
Abstract
Background
Choosing cutoff values for nerve conduction studies (NCS) and ultrasound cross-sectional area (CSA) in the diagnosis of carpal tunnel syndrome (CTS) is critical in determining the diagnostic accuracy of the tests. The goals of this study were to: (1) determine the sensitivity and specificity of various electrodiagnostic and ultrasound threshold values for diagnosis of CTS; and (2) determine the number of hands that underwent NCS and ultrasound that were within 10% of threshold values.
Methods
A total of 309 hands of 235 patients were included in this study. Diagnosis of median neuropathy was made based on NCS by the independent physician performing the NCS. Criteria analyzed included distal motor latency of 4.4+ ms, distal sensory latency of 3.6+ ms, difference in median-ulnar mixed nerve palmar latency of 0.4+ ms, and CSA of the median nerve of 10+ mm2.
Results
Median neuropathy was diagnosed in 235 hands, whereas 74 hands were found not to have median neuropathy. Overall, 141 hands (46%) had at least 1 of the 3 electrodiagnostic variables within 10% of the diagnostic cutoff values, and 137 hands (44%) had a median nerve CSA within 10% of 10 mm2. By performing ultrasound in addition to NCS for each patient, an additional 65 hands (21%) had a definitive diagnosis on at least 1 of the 2 diagnostic modalities.
Conclusions
Ultrasound and NCS yielded a similar number of patients within 10% of their diagnostic threshold values. When used together, the number of patients with a nonborderline diagnosis on at least 1 diagnostic modality was increased substantially.
Keywords
Introduction
Carpal tunnel syndrome (CTS) is a peripheral neuropathy caused by median nerve entrapment at the wrist. It is estimated that the general population has a prevalence of median neuropathy between 3.8% and 7.8%, making it 1 of the most common peripheral neuropathies.1,2 Symptoms include paresthesia, pain, motor deficit or atrophy of the thenar muscles, and sensory deficits in the distribution of the median nerve at the hand.3-5 Although diagnosis is often based on history and physical examination, it can be confirmed by diagnostic modalities such as nerve conduction studies (NCS) or ultrasonography (US).6-8
A 2002 literature review by the American Association of Electrodiagnostic Medicine (AAEM) demonstrated sensitivities of NCS for CTS of 63% to 85% and specificities of 97% or higher. 9 While studies have explored ideal values for distal motor latency (DML) and distal sensory latency (DSL) to be used as diagnostic thresholds, 10 various practices continue to use differing reference values for diagnosis of CTS rather than a single set of standardized cutoffs, thereby creating the possibility of false-positive and false-negative diagnoses. Without standardized cutoff values, a patient could receive a diagnosis of CTS from 1 physician, whereas another physician believes the electrophysiologic data do not quite reach the threshold for a diagnosis of CTS, potentially changing management and patient care.
Kortlever et al examined 565 patients with NCS for potential CTS. Using specific cutoff values, the authors found median DSL, median DML, and difference in median-ulnar mixed nerve palmar latency to have sensitivities of 83%, 64%, and 97% and specificities of 96%, 97%, and 96%, respectively. Using 3 NCS variables from this study, we aimed to recreate parts of the study while also incorporating use of US measurement of the cross-sectional area (CSA) of the median nerve for diagnosis of CTS.
The goal of this study was to: (1) determine the sensitivity and specificity of various NCS and US threshold values; and (2) determine the number of hands that underwent NCS and US that were within 10% of the diagnostic threshold values.
Materials and Methods
This retrospective study was approved by the University of Pittsburgh Institutional Review Board. A database of 686 hands that underwent NCS for suspicion of CTS from 2015 to 2020 was reviewed. Data of patients were reviewed for eligibility criteria by a research assistant who was not directly involved in patient care or NCS testing. Patients with testing of bilateral hands had data of each hand individually included in the study. Patients were excluded if they: (1) had incomplete data from their NCS; (2) had previous carpal tunnel release surgery on the tested hand; (3) did not have a US examination performed; or (4) had a history of a separate nerve condition in the affected limb such as cervical radiculopathy and cubital tunnel syndrome.
A total of 309 hands in 235 patients that underwent NCS and US for diagnosis of CTS met inclusion criteria and were included in this study. Diagnosis of median neuropathy was made based on the electrodiagnostic results by the independent physician performing the NCS in the impression of the procedure report. Based on these independent diagnoses, hands were sorted into 2 groups: median neuropathy or no median neuropathy.
In line with the study by Kortlever et al, NCS criteria analyzed in this study included: (1) DML of 4.4 ms or greater; (2) DSL of 3.6 ms or greater; or (3) difference in median-ulnar mixed nerve palmar latency of 0.4 ms or greater. These criteria were derived from AAEM standards as well as the diagnostic criteria used by one of the authoring physicians in the Kortlever study. Mean compound muscle action potential and sensory nerve action potential were also reported for each group. The cutoff value used for the CSA of the median nerve as measured by US was 10 mm2.7,11,12 The 10% upper and lower margins of the cutoff values used can be seen in Table 1.
Overview of Cutoff Values and 10% Margins.
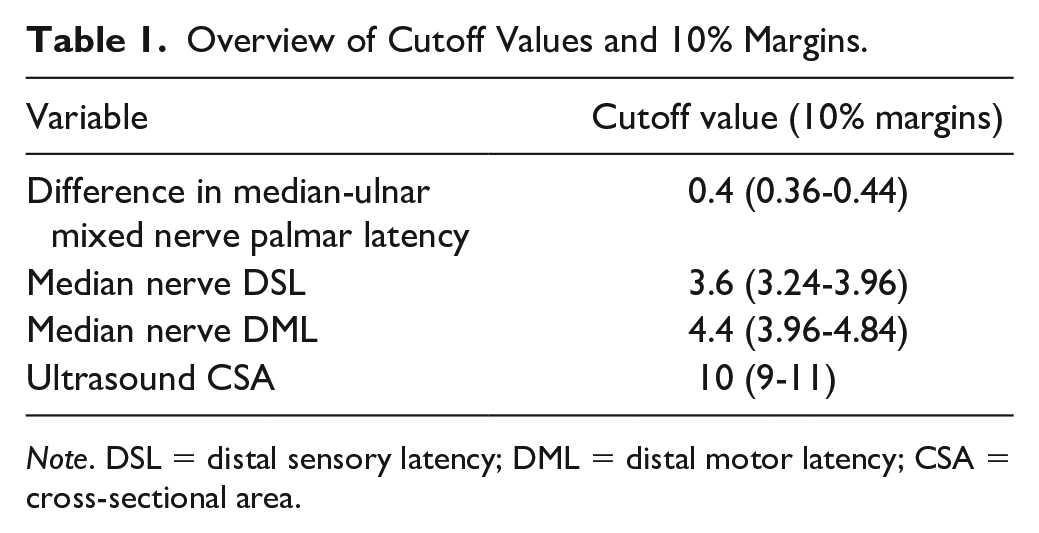
Note. DSL = distal sensory latency; DML = distal motor latency; CSA = cross-sectional area.
Electrodiagnostic Testing
Electrodiagnostic studies (sensory and motor) were performed to the standards of the American Association of Neuromuscular and Electrodiagnostic Medicine by a certified physician in an outpatient setting and interpreted as median neuropathy or no median neuropathy by the examining physician.
Ultrasound Examination
A hand-fellowship–trained orthopedic surgeon performed all ultrasound examinations. Patients were seated across from the examiner with the elbow flexed to 80° and the dorsal forearm resting on the examination table. The wrist was in the neutral position, dorsum of hand resting on the table, and fingers in the resting cascade. A 15-6 MHz transducer was used to measure the CSA of the median nerve at the carpal tunnel inlet (level of pisiform) using the trace function.
Statistical Analysis
Continuous variables were reported as mean ± standard deviation (SD). Student t tests were used to analyze differences between continuous variables. Pearson χ2 tests were used to analyze differences between categorical variables. All tests were performed using GraphPad Prism 8 software. A P < .05 was considered statistically significant. For each of the diagnostic groups, the number of hands within 10% (above or below) of each electrodiagnostic criteria cutoff value was calculated. A post hoc power analysis demonstrated that a sample size of 309 hands with an effect size of 0.5 yielded a statistical power of over 99% to detect a significant difference between groups.
Results
Median neuropathy was diagnosed by the physician performing the NCS in 235 hands, whereas 74 hands were found not to have median neuropathy. The mean age of patients with hands diagnosed with median neuropathy was 50.9 ± 11.9 years, whereas the mean age of those with hands found not to have median neuropathy was 45.3 ± 15.3. Patient demographic information as well as patient-reported symptom questionnaire scores can be seen in Table 2.
Patient Demographics.
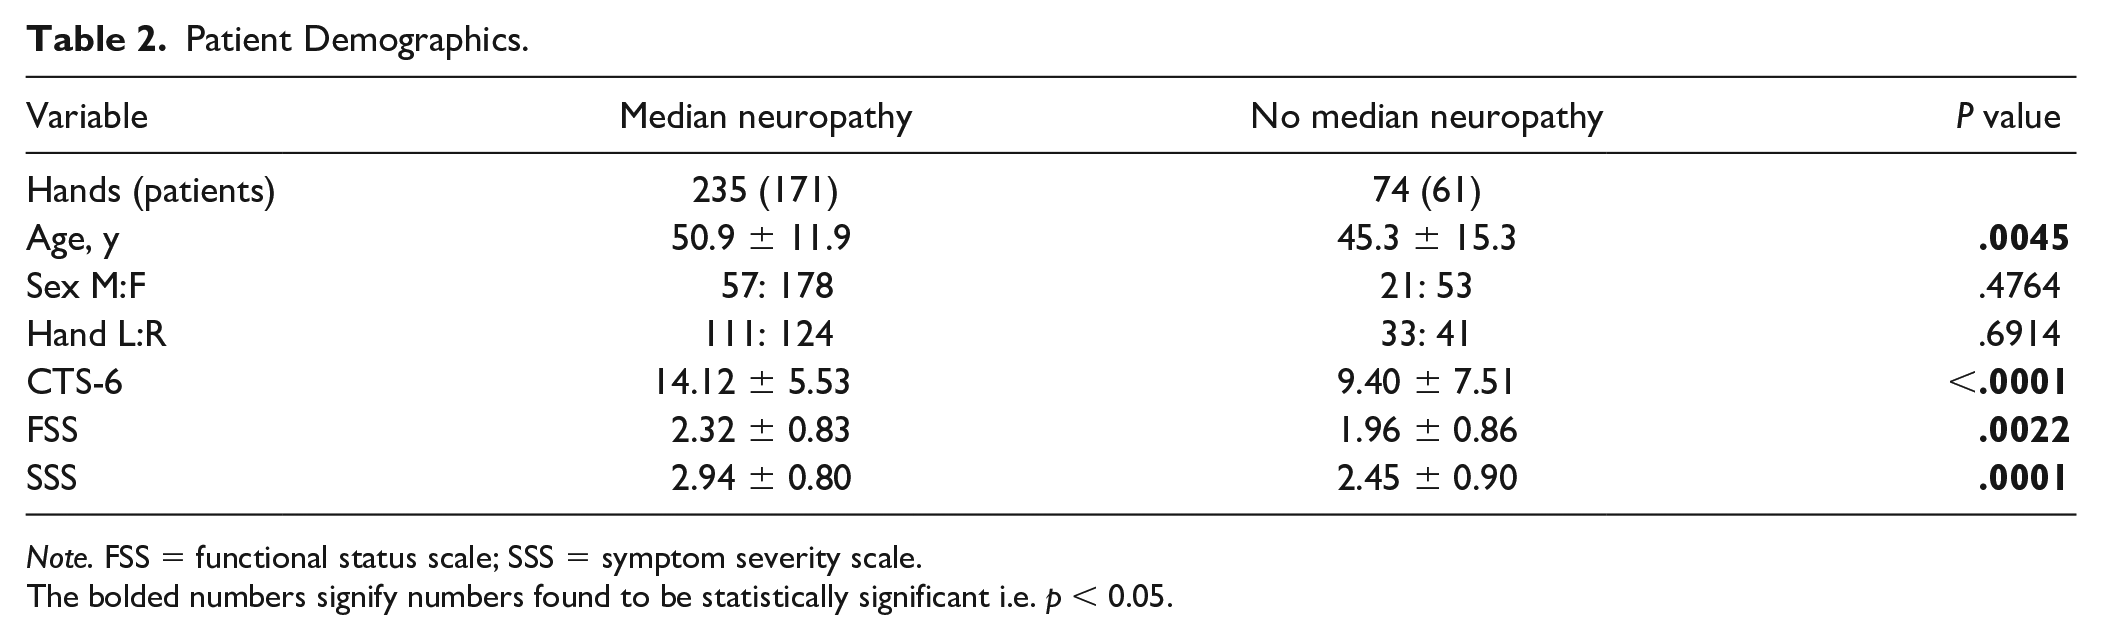
Note. FSS = functional status scale; SSS = symptom severity scale.
The bolded numbers signify numbers found to be statistically significant i.e. p < 0.05.
The means for the NCS and US diagnostic criteria as well as the number of patients meeting each criterion in the median neuropathy and no median neuropathy groups can be seen in Table 3. The differences in median DML, median DSL, and difference in median-ulnar mixed nerve palmar latency between groups were all found to be statistically significant with P values less than .0001. Among hands diagnosed with no median neuropathy, none had a median DML above the threshold value, whereas 7 had a median DSL above the threshold (11%) and 13 had a difference in median-ulnar mixed nerve palmar latency above the threshold value (20%).
Nerve Conduction Study and Ultrasound Results by Diagnostic Group.
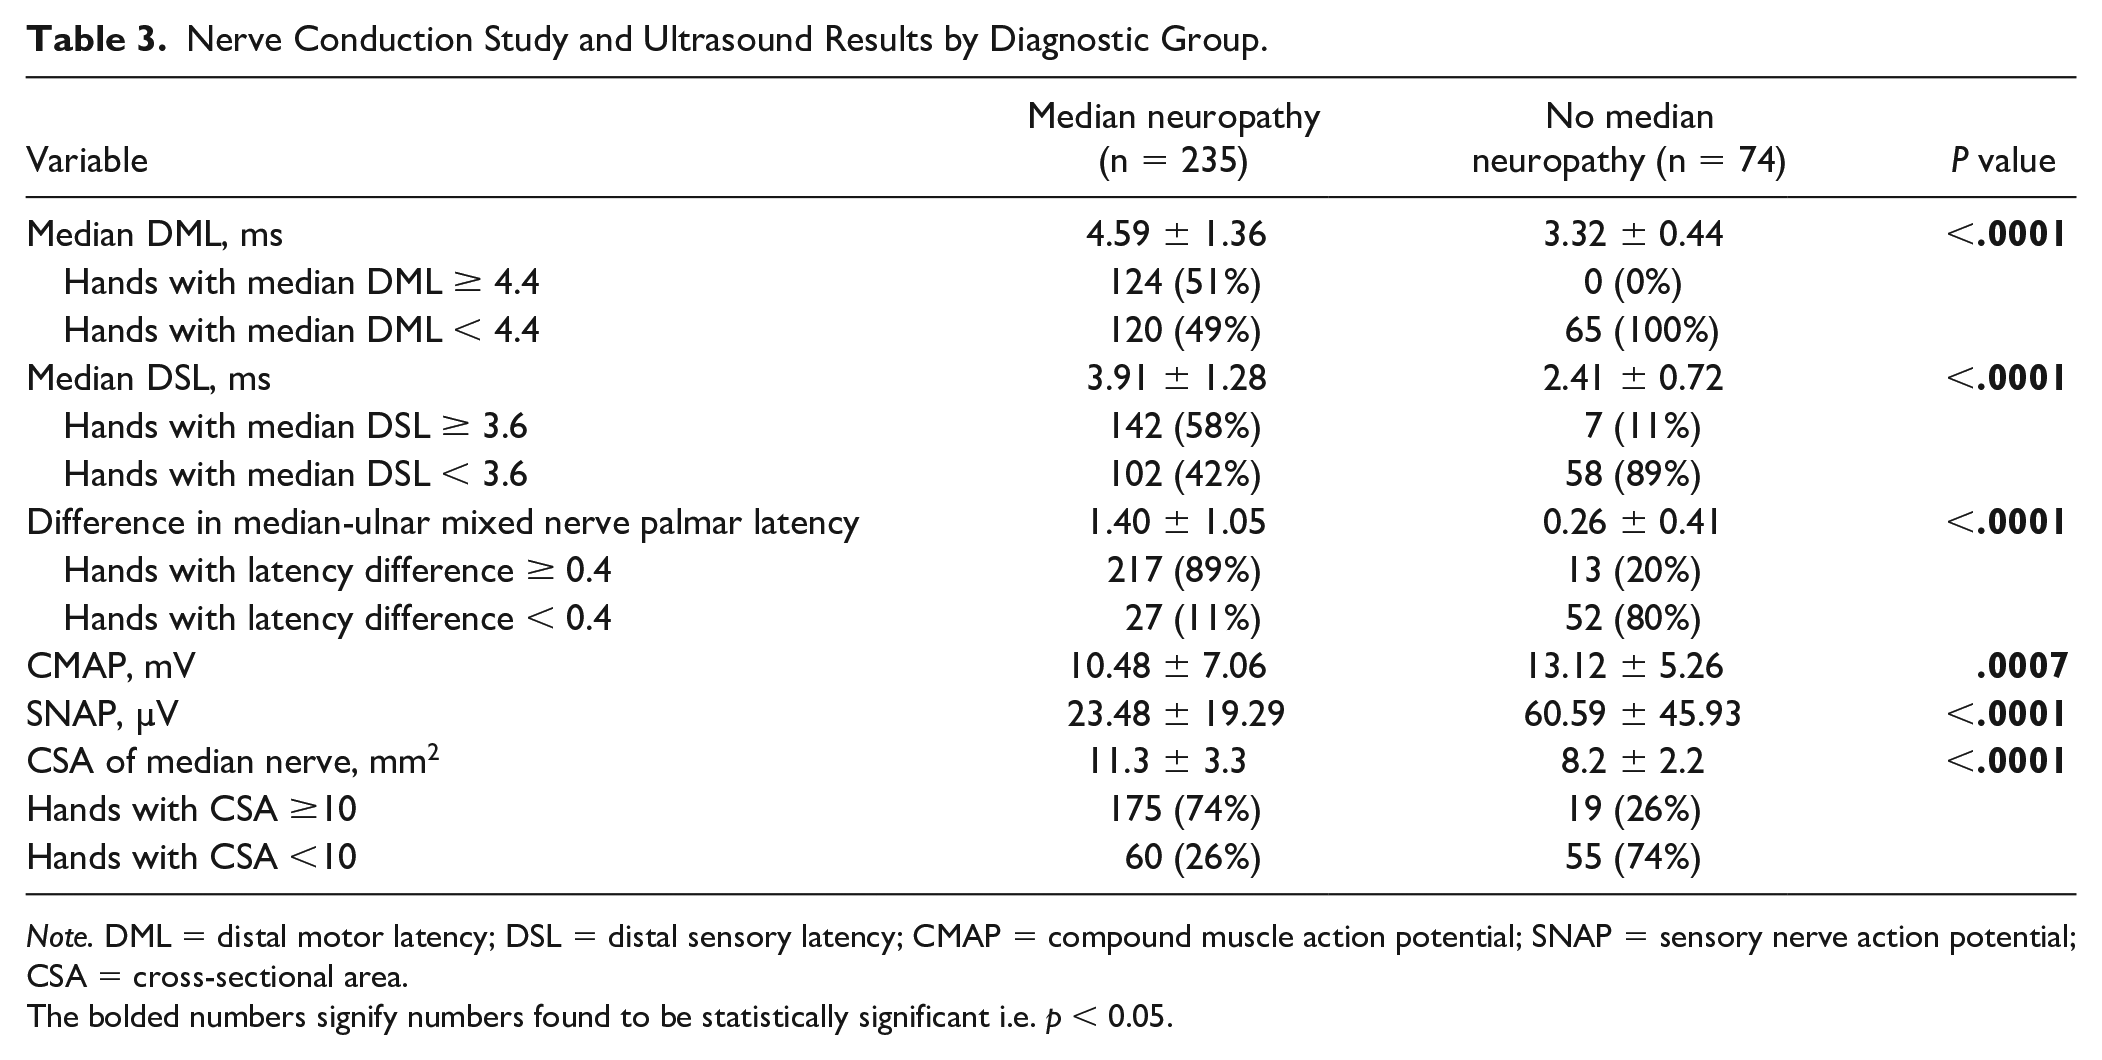
Note. DML = distal motor latency; DSL = distal sensory latency; CMAP = compound muscle action potential; SNAP = sensory nerve action potential; CSA = cross-sectional area.
The bolded numbers signify numbers found to be statistically significant i.e. p < 0.05.
The percentage of hands within 10% of the cutoff values for each of the 3 NCS criteria ranged from 5% for difference in median-ulnar mixed nerve palmar latency to 33% for median DML (Table 4). Of the total 309 hands in this study, 141 (46%) had at least 1 of the 3 electrodiagnostic variables within 10% of the diagnostic cutoff value and 137 hands (44%) had a median nerve CSA within 10% of 10 mm2. Difference in median-ulnar mixed nerve palmar latency had the greatest sensitivity at 88.9%, whereas median DML had the greatest specificity at 100% (Table 5).
Number of Hands Within 10% of Cutoff Value.
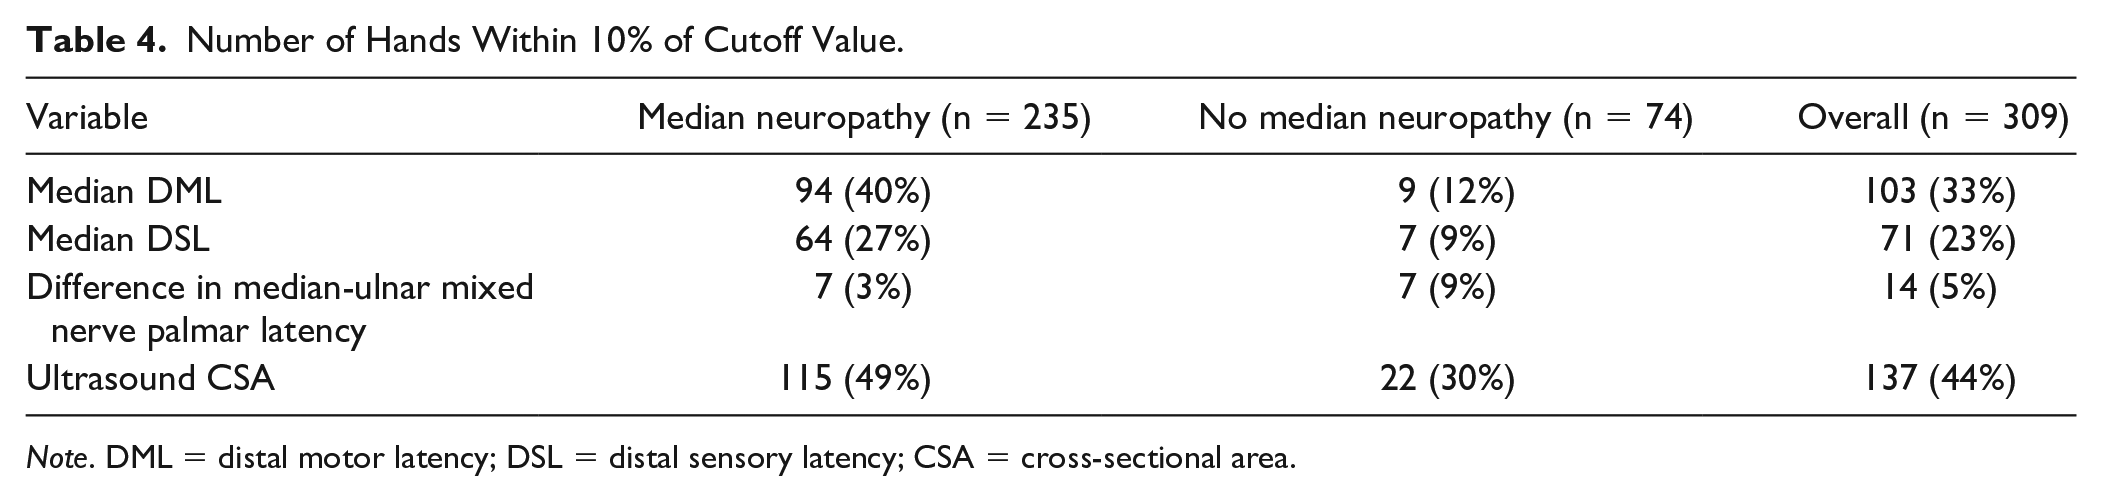
Note. DML = distal motor latency; DSL = distal sensory latency; CSA = cross-sectional area.
Sensitivity and Specificity of NCS Criteria and Ultrasound.
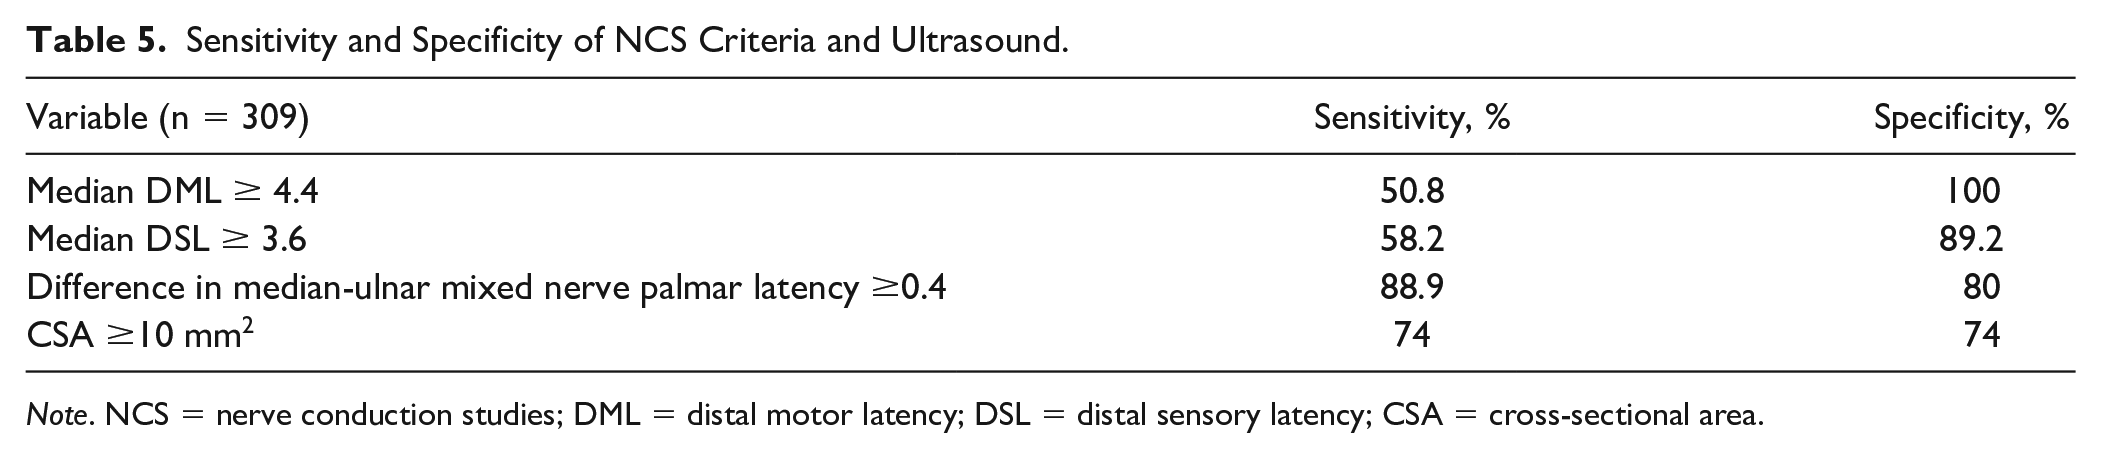
Note. NCS = nerve conduction studies; DML = distal motor latency; DSL = distal sensory latency; CSA = cross-sectional area.
Of the 141 hands with borderline NCS data, 76 hands (54%) had ultrasound data that were also within 10% of the threshold value (Table 6). By performing ultrasound in addition to NCS for each patient, an additional 65 hands (21% of the total study population) had a definitive diagnosis of CTS or no CTS on at least 1 of the 2 diagnostic modalities. Overall, 233 hands (75%) in this study had a definitive diagnosis on NCS, ultrasound, or both.
Ultrasound Results of Borderline NCS Hands.
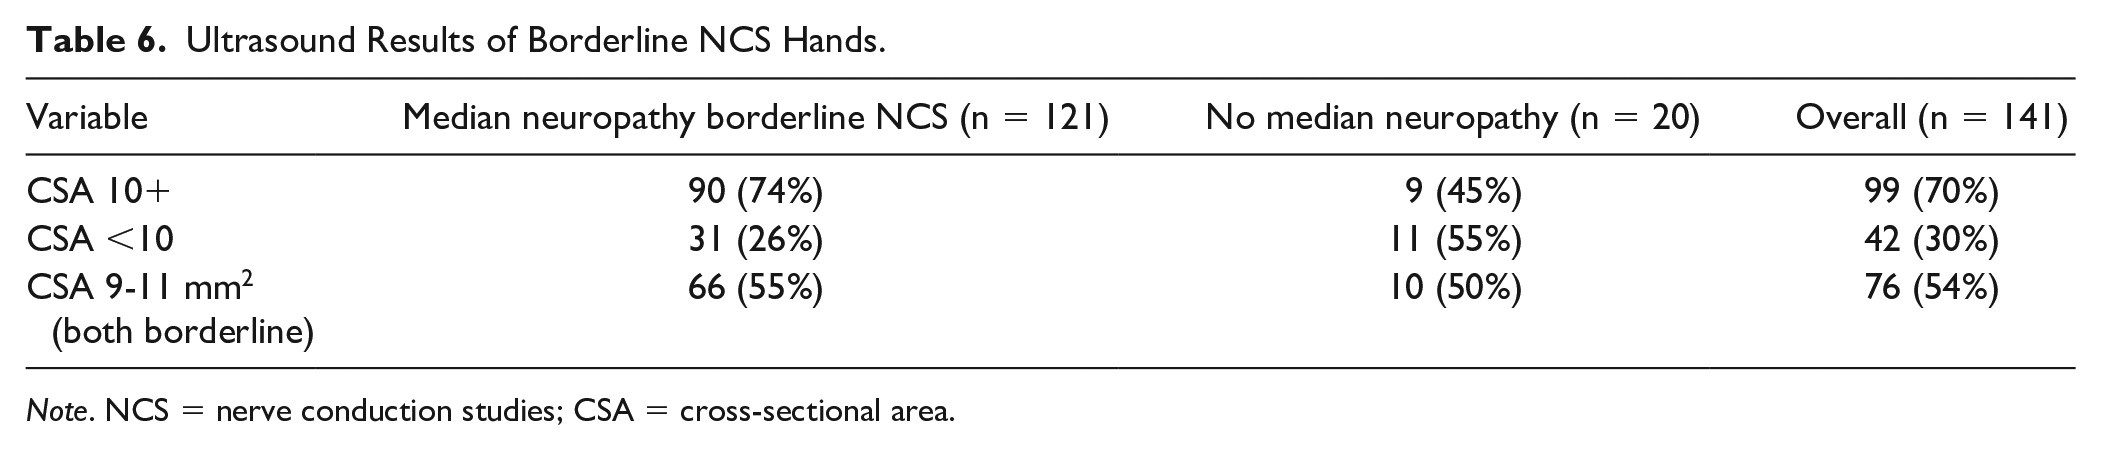
Note. NCS = nerve conduction studies; CSA = cross-sectional area.
Discussion
This study found that 46% of hands had at least 1 of the 3 electrodiagnostic factors used within 10% of the threshold value. This value was similar to the rate of US examinations within 10% of the threshold value (44%). The results of this study were similar to the results of Kortlever et al who found that 33% of patients had a DML within 10% of the cutoff, 29% had a DSL within 10% of the cutoff, and 12% had a difference in median-ulnar mixed nerve palmar latency within 10% (33%, 23%, and 5% for this study, respectively). As previously mentioned, diagnostic values within 10% of the threshold values may be problematic as they could be heavily influenced by measurement error and interpreted differently by different labs/physicians.
With the addition of US examination of the median nerve at the wrist, the 54% of hands with an NCS-confirmed nonborderline diagnosis of median neuropathy or no median neuropathy could be increased to 75% with a definitive diagnosis on at least 1 of the 2 diagnostic modalities. These findings highlight the ability of US examination to add value to the diagnostic work-up in CTS. Ultrasonography may have a role in these borderline cases or other unclear cases. However, it is unclear whether adding additional testing improves the outcomes of carpal tunnel release.
When interpreting the sensitivity and specificity values used in this study, it is important to recognize that the values are biased toward NCS. The electrodiagnostic physician used NCS to make the diagnosis of CTS that was used as the reference standard. Therefore, to have a diagnosis of CTS, at least one of the NCS variables would need to be positive. In addition, to have a negative diagnosis for CTS, none of the NCS variables would be positive. The sensitivity and specificity were calculated for each of the NCS variables individually; however, the above explanation demonstrates how the sensitivity and specificity would be artificially elevated. Ultrasonography demonstrated a sensitivity and specificity of 74% when using NCS as the reference standard. It is important to recognize that prior studies have demonstrated similar sensitivity and specificity for US and NCS when using clinical examination as the reference standard. 13
We acknowledge limitations with this study. First, the patients included in this study were drawn from a single practice at a tertiary referral center. Therefore, these results may not be generalizable to the general population. Second, this is a retrospective study in which physical examination results and confidence of the NCS-ordering physician in the diagnosis were not included. Watson et al showed that low confidence of physician in the diagnosis of CTS is a strong predictive factor of normal NCS results. Third, the NCS results were used for the diagnosis of median neuropathy or no median neuropathy by the physician performing the test. Although there were no specific reference values used by these physicians, the use of the NCS data surely influenced which group the patients were sorted into and likely increased the sensitivity and specificity of all 3 electrodiagnostic variables analyzed.
Footnotes
Ethical Approval
This study was approved by our institutional review board.
Statement of Human and Animal Rights
All procedures followed were in accordance with the ethical standards of the responsible committee on human experimentation (institutional and national) and with the Helsinki Declaration of 1975, as revised in 2008 (5). Informed consent was obtained from all patients for being included in the study.
Statement of Informed Consent
Informed consent was obtained from all individual participants included in the study.
Declaration of Conflicting Interests
The author(s) declared no potential conflicts of interest with respect to the research, authorship, and/or publication of this article.
Funding
The author(s) received no financial support for the research, authorship, and/or publication of this article.