
Abstract
Background:
Upper extremity (UE) injuries, ranging from the clavicle to the fingertips, are prevalent in ice hockey. Despite hockey’s growing popularity, comprehensive epidemiological data on UE injuries are limited. This study analyzes patterns of acute hockey-related UE injuries among young players in the United States, focusing on age-specific and sex-specific injury distributions.
Methods:
The National Electronic Injury Surveillance System was analyzed for ice hockey–related injuries among patients aged 5 to 24 years from 2006 to 2023. Injuries were classified by patient demographics and anatomical region. Logistic regression models analyzed the association between injury patterns and predictive variables of interest (P < .05).
Results:
Of 258 302 estimated ice hockey–related injuries, 91 889 (35.57%) involved the UE. The shoulder (clavicle, scapula, proximal humerus) was the most common site of UE injuries (40.73%), followed by the wrist (19.55%) and then digits (11.23%). Fractures were the predominant injury type (35.85%). Youth players (5-13 years) had higher odds of fractures (odds ratio [OR] = 1.78) compared with other age groups. College-aged players (19-24 years) were more prone to dislocations (OR = 3.52). Males had higher odds of shoulder dislocations (OR = 6.55) and shoulder injuries overall (OR = 1.70), whereas females had higher odds of wrist injuries (OR = 1.92) and wrist strains or sprains (OR = 2.92).
Conclusions:
This comprehensive analysis of UE injuries in ice hockey athletes highlights the significant burden of these injuries and identifies important patterns related to injury types, anatomical locations, and demographic factors. These findings provide a foundation for developing targeted injury prevention strategies and improving player safety in ice hockey.
Introduction
Ice hockey, known for its fast-paced and physical nature, presents a unique environment where upper extremity (UE) injuries are prevalent and often severe, resulting in missed playing time. 1 The popularity of ice hockey continues to grow, with USA Hockey reporting nearly 400 000 youth players (69.1% of registered participants) in the 2022-2023 season, representing a 12% increase since 2009-2010. 2 As participation increases, as does the importance of understanding and preventing injuries associated with the sport. Upper extremity injuries account for a substantial portion of ice hockey–related injuries, accounting for 44% of injuries in players younger than the age of 18. 3 Previously published literature has reported that the wrist, hand, and fingers were the second most common ice hockey–associated injury presenting to the emergency department (ED) after the face, with shoulder injuries following closely in third.4,5 The physical nature of ice hockey, combined with high-velocity pucks and aggressive stick use, contributes to the high incidence of UE trauma.
Ice hockey is unique among contact sports due to the use of a hockey stick as a primary tool for gameplay. This feature, shared with lacrosse, introduces injury mechanisms not seen in other contact sports. The aggressive use of sticks to control the puck, combined with the sport’s inherent physicality, contributes significantly to the prevalence of UE injuries. Direct stick impacts can cause fractures (metacarpals, phalanges) and soft tissue injuries (thumb ulnar collateral ligament sprains, wrist contusions).6,7 Unlike football or wrestling, where direct body contact dominates injury mechanisms, ice hockey’s stick use adds a layer of complexity, increasing the risk of blunt trauma to the hands, wrists, and fingers. Although previous research has provided broad overviews of hockey injuries with a focus on injuries of the hip, pelvis, and lower extremity, there is a need for a more focused analysis of UE injuries.8,9
This study aims to examine the epidemiology of acute ice hockey–related UE injuries among youth ice hockey athletes in the United States using the National Electronic Injury Surveillance System (NEISS) database. This study will also assess injury trends over time and compare injury patterns across different age groups and between sexes, allowing for a better understanding of demographic patterns and providing insights into UE injury distribution at various levels of play. We hypothesize that UE injuries in youth ice hockey players have distinct patterns based on injury type, age, and sex. The findings of this research will be crucial for coaches, athletic trainers, and health care providers in optimizing player safety and performance in this popular and physically demanding sport.
Materials and Methods
Data Sources
This study used data from the Consumer Product Safety Commission’s (CPSC) NEISS, a database that collects information from a nationally representative probability sample of 100 hospital EDs evenly distributed across the United States. 10 De-identified data for each case include variables such as treatment date, patient age, sex, race, diagnosis, injured body part, patient outcome, place of injury, and 2 narrative descriptions. Many orthopedic investigations have used the NEISS to analyze injury epidemiology.11 -16
Age Cohorts
Ice hockey–related injuries were examined using records from 2004 through 2023, using the NEISS product code 1279 (Figure 1). Cases with multiple associated diagnosis codes (ie, fracture-dislocation) were not included in our analysis; only cases with a single, clearly defined diagnosis were included in our analysis. The patient population was further stratified based on injury location, focusing on those occurring in sports and recreational settings to ensure association with active play.
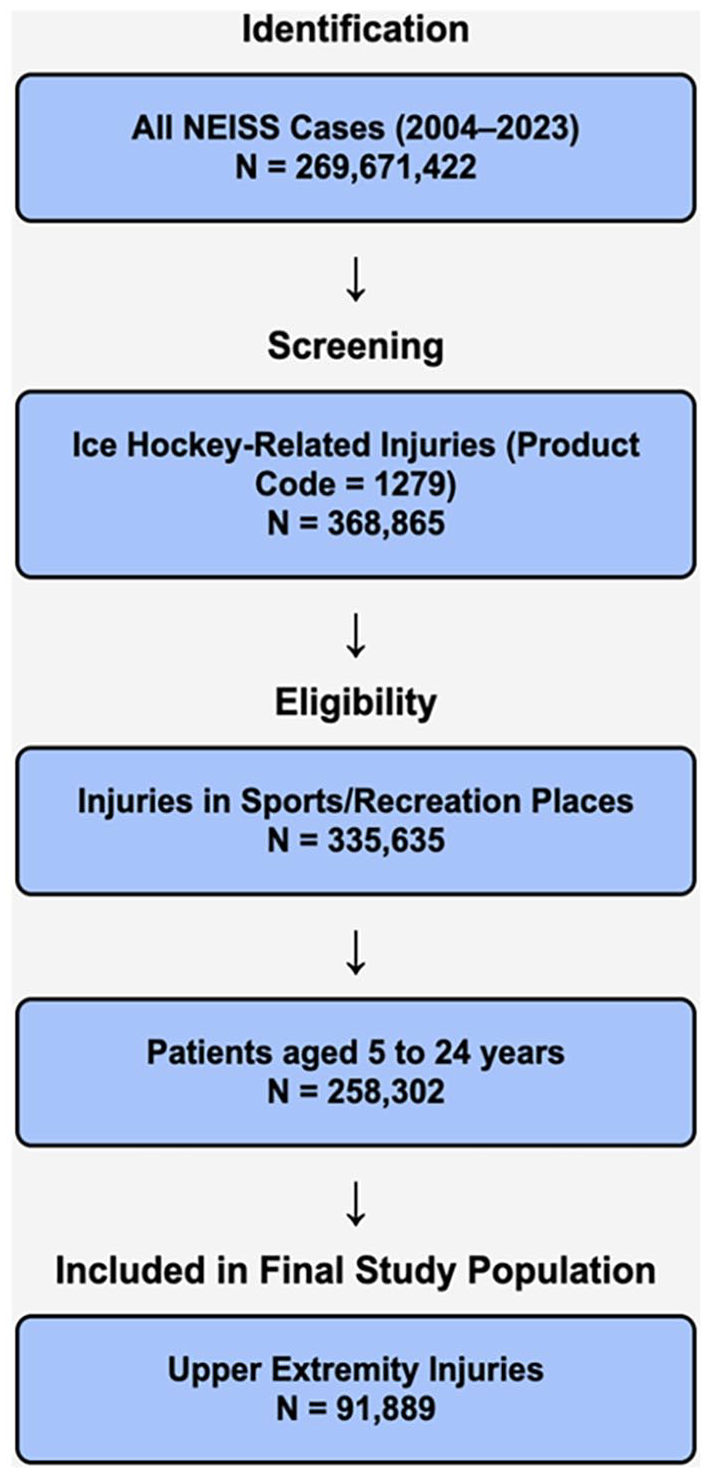
Flowchart demonstrating patient selection for analysis.
Patients aged 5 to 24 years were included, and the analysis was narrowed to focus exclusively on UE injuries, defined as those affecting the shoulder (including the sternoclavicular joint, clavicle, acromioclavicular joint, scapula, glenohumeral joint, proximal humerus), upper arm, elbow, lower arm, wrist, hand, and fingers, including the thumb.
Variables
Demographics variables, including age and sex, and injury characteristics, including pattern and location, were collected. The NEISS database was used to collect demographic variables (age and sex) and injury characteristics (pattern and location). The NEISS classifies injuries by body part and diagnosis, including fractures; dislocations; strains or sprains; contusions, abrasions, and lacerations; avulsions; and hematomas. Upper extremity diagnoses were categorized into larger groups for analysis, including: (1) contusion, abrasion, or laceration; (2) dislocation; (3) fracture; (4) strain or sprain; and (5) other, and were also examined in more specific categories. For reporting purposes, soft tissue injuries are defined as contusions, abrasions, lacerations, and sprain or strain injuries.
Although the NEISS database provides broad anatomical classifications for injuries, it is important to outline potential injuries for each body part location to provide additional context. For lower arm injuries, fractures may involve the radius or ulna, typically in the forearm region. Upper arm injuries may include fractures of the humerus, involving the proximal, shaft, or distal sections. Elbow injuries may affect the distal humerus, proximal ulna (including the olecranon), or proximal radius (including the radial head). Finger injuries often involve fractures of the phalanges (proximal, middle, or distal) of specific digits, whereas hand injuries typically involve fractures of the metacarpal bones. Shoulder injuries may include fractures of the clavicle, scapula, or proximal humerus. Wrist injuries may involve fractures of the distal radius, distal ulna, or carpal bones. Throughout this article, we use terms such as “shoulder fracture” and “lower arm fracture” to align with the NEISS classifications; these terms can encompass any of the specific injury types described above. This approach ensures consistency with the NEISS data while providing a clearer understanding of potential injury patterns within these broad categories.
Statistical Analysis
Descriptive statistics were used to summarize demographic characteristics (age, sex) and injury types across the study population. Pearson χ2 tests were used to assess the association between categorical variables such as injury type, body region, sex, and age group and determine whether there were significant differences in injury patterns between male and female athletes, and between age groups. Logistic regression models estimated odds ratios (ORs) for various injury types and anatomical regions, with sex (male vs female) and age group as the primary independent variables, and the likelihood of specific diagnoses (eg, dislocations, fractures, sprains, or strains) in the UE as the outcome. To facilitate age-specific analysis, patients were stratified into 3 distinct groups, namely, youth (5-13 years), high school (14-18 years), and college (19-24 years), capturing all levels of competitive play from mini-mite to college. Data analysis was performed using Stata Statistical Software 18.0 (StataCorp LLC, College Station, Texas). Following CPSC guidelines, statistical analyses and tests were performed using weighted sampling techniques applied to all cases, with the Survey Estimation Module in Stata used to account for the survey design of the NEISS database, including sampling strata and clustering variables. Each injury case in NEISS is assigned a statistical weight that represents how many similar cases it would account for in the entire US hospital system. These weights are based on the hospital’s size, geographic stratum, and probability of being sampled, ensuring that the estimates reflect national trends rather than just the sampled hospitals. The national estimate is then calculated by summing the weighted values of all cases. Records with missing data were excluded on a listwise basis. Statistical significance was set at P < .05.
Results
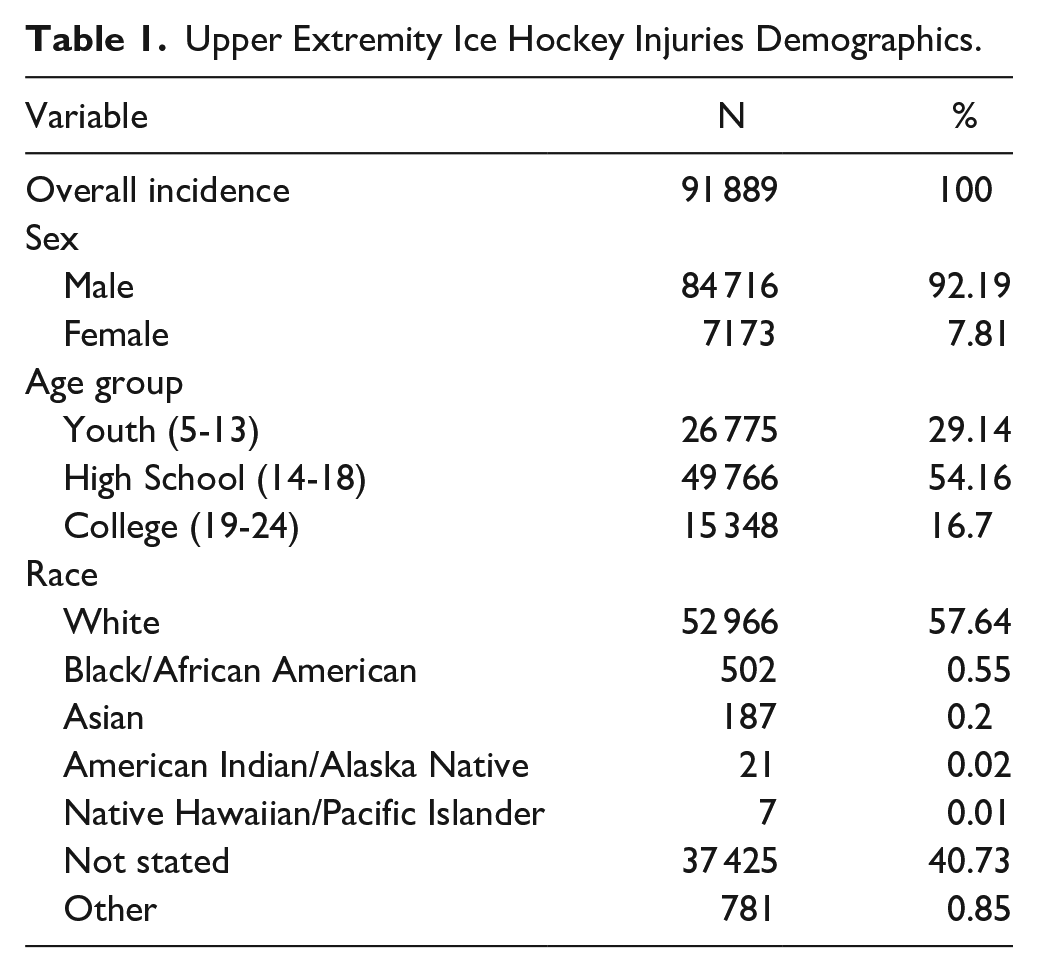
From 2004 to 2023, 8580 unweighted ice hockey injuries (age 5-24) presented to US EDs, representing 258 302 cases nationally. Of these, 91 889 (35.57%) involved the UE and formed our study population. The mean age of ice hockey athletes with UE injuries was 15.33 years (95% confidence interval [CI] = 14.91-15.75) and males accounted for 92.19% of all injuries (Table 1).
Upper Extremity Ice Hockey Injuries Demographics.
Injury Type and Pattern of Distribution
Among UE injuries, fractures were the most commonly reported injury, accounting for 35.85% (95% CI = 32.04-39.85; N = 32 941), followed by contusions, abrasions, and lacerations at 28.13% (95% CI = 23.97-32.69; N = 25 844; Table 2). Strains or sprains represented 18.29% (95% CI = 15.25-21.78; N = 16 809), whereas dislocations accounted for 6.23% (95% CI = 4.87-7.94; N = 5729). Other UE injuries, including amputations, avulsions, burns (frostbite), crush injuries, and hematomas, made up 11.50% (95% CI = 5.37-22.92; N = 10 565).
Upper Extremity Injuries by Body Part and Diagnosis (2004-2023).
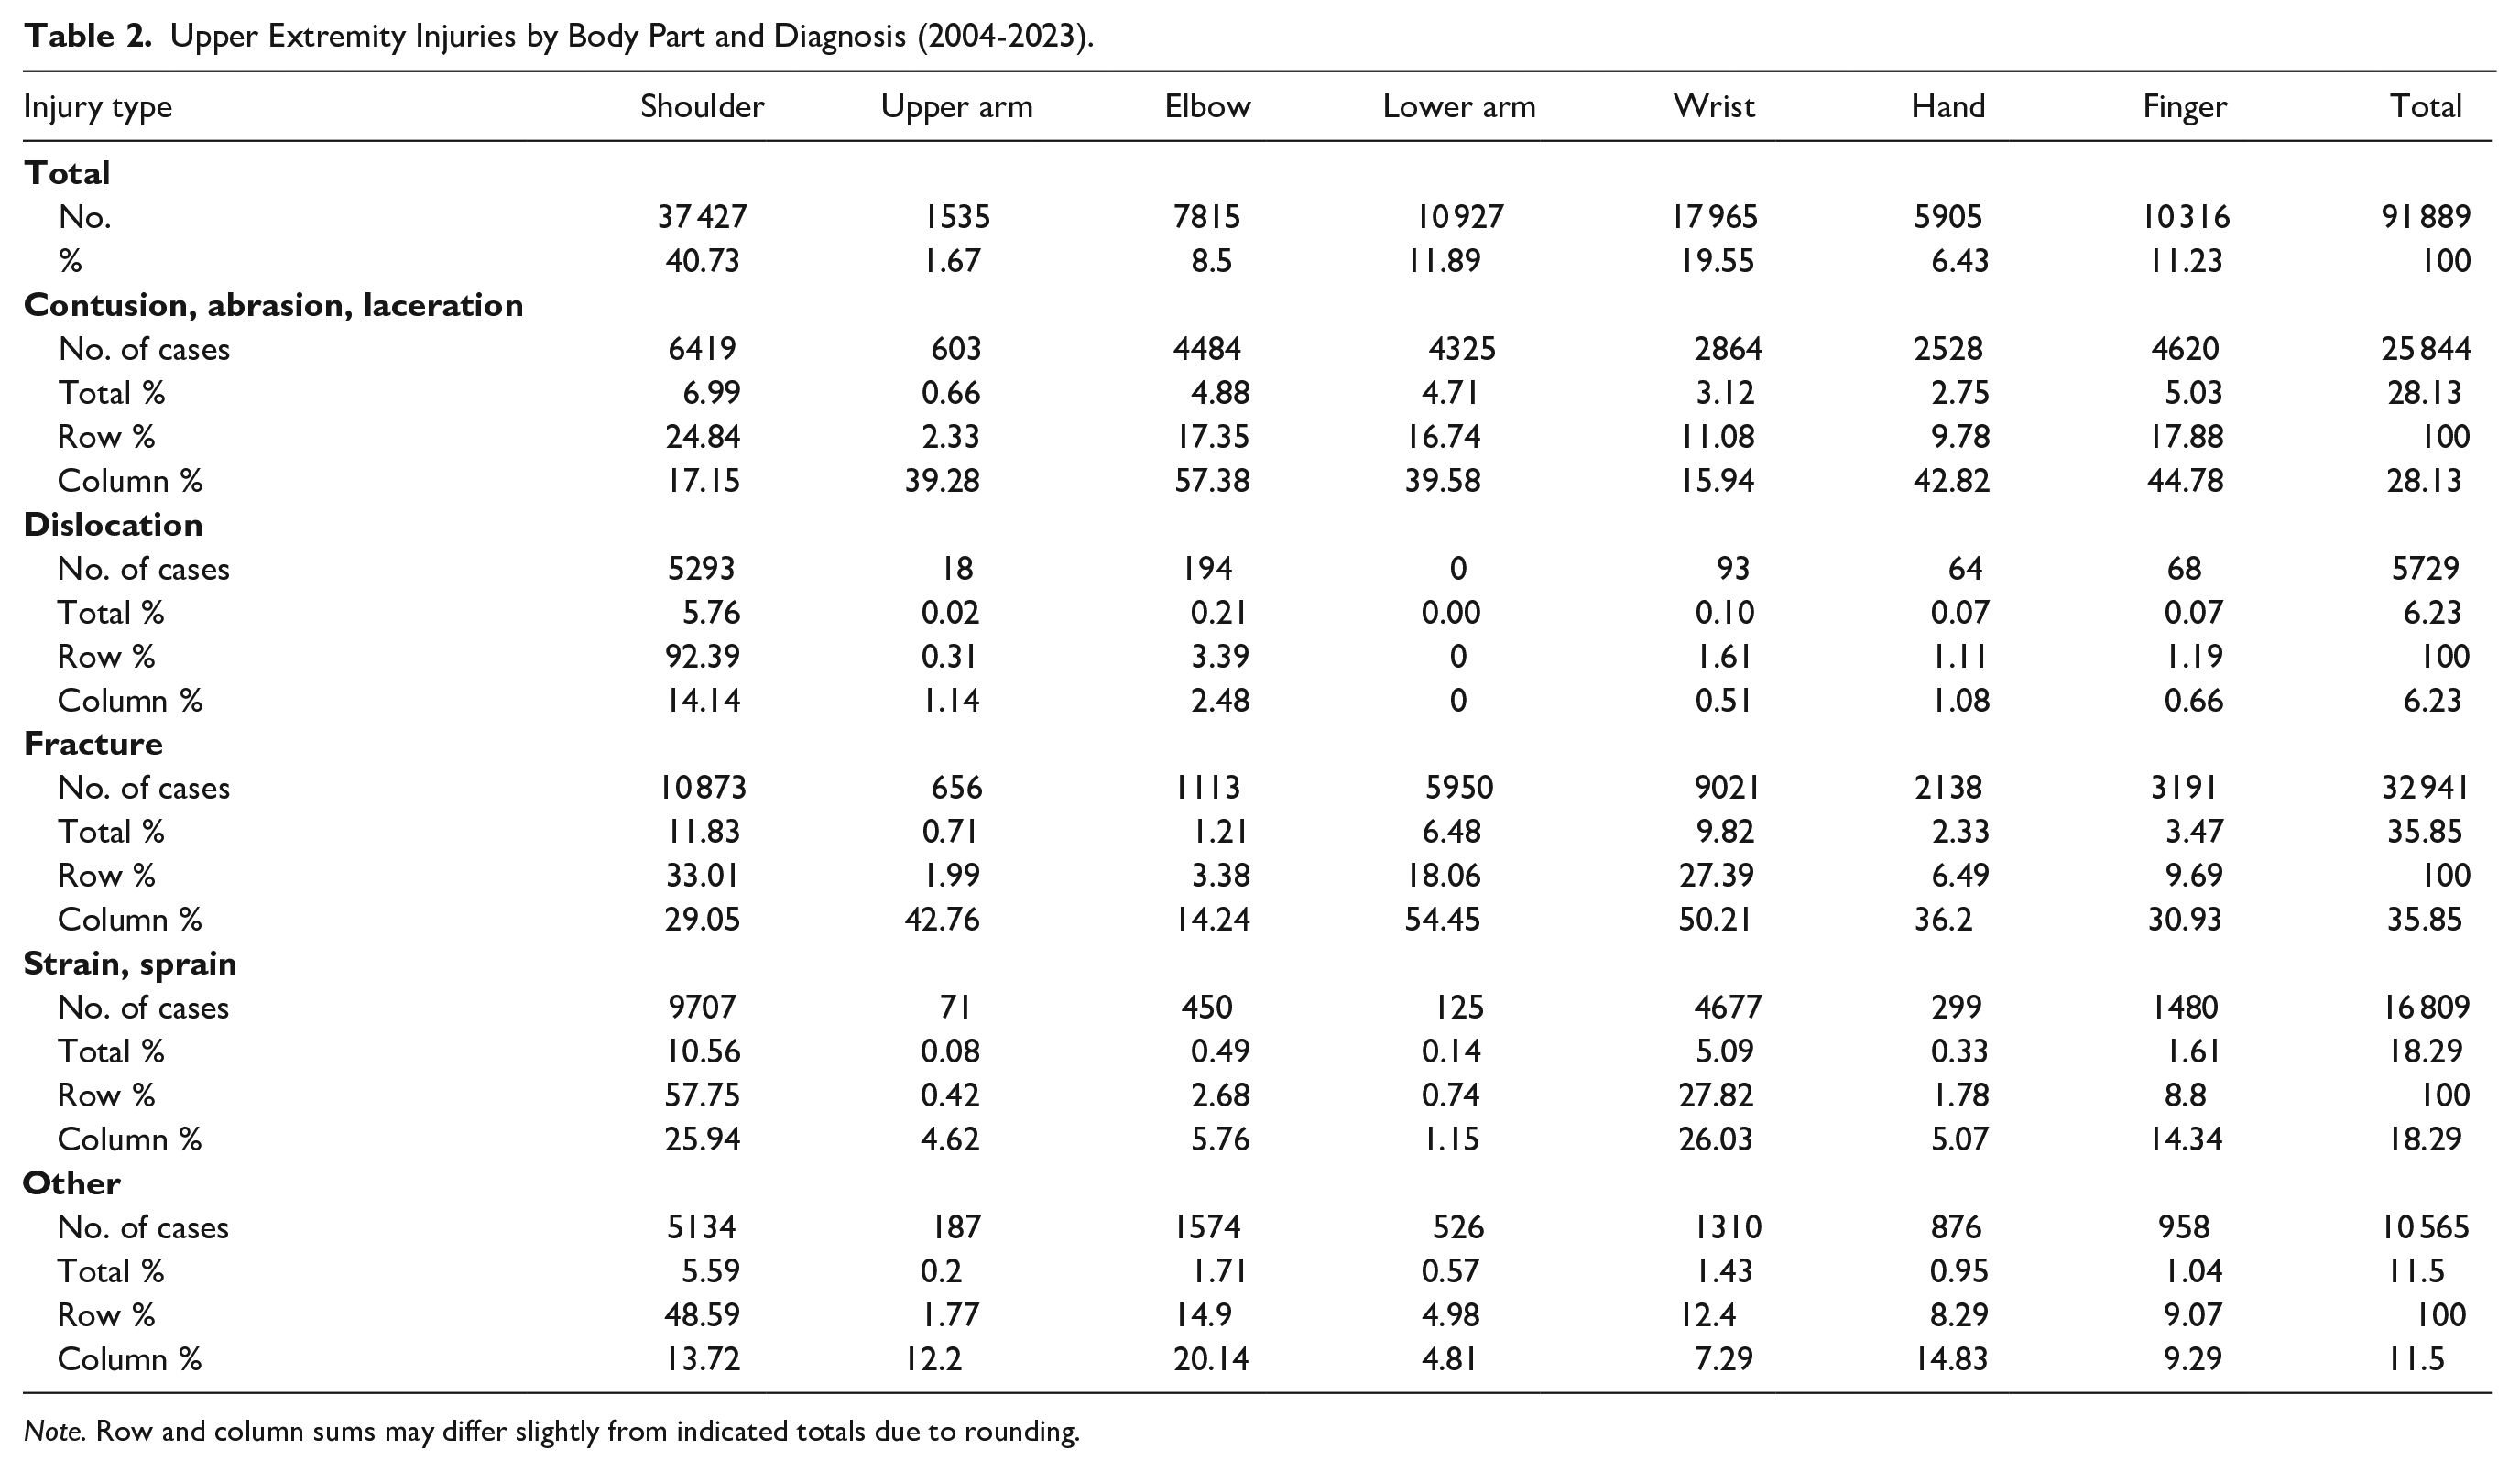
Note. Row and column sums may differ slightly from indicated totals due to rounding.
For dislocations, the shoulder was the most commonly affected body part, accounting for 92.39% (95% CI = 87.89-95.31; N = 5293) of all dislocation injuries. For sprains and strains, the shoulder was the most commonly affected site, comprising 57.75% (95% CI = 51.63-63.64; N = 9707) of such injuries, followed by the wrist, which accounted for 27.82% (95% CI = 22.51-33.85; N = 4677), and the fingers (including the thumb), making up 8.8% of strains/sprains (95% CI = 6.66-11.55; N = 1480).
Injuries by Location of Injury
The shoulder was the most common site of UE injuries, accounting for 40.73% (95% CI = 38.12-43.39; N = 37 427), followed by the wrist at 19.55% (95% CI = 16.98-22.4; N = 17 965; Table 2). The lower arm (forearm) represented 11.89% (95% CI = 10.32-13.67; N = 10 927), whereas the finger made up 11.23% (95% CI = 10.02-12.55; N = 10 316). The elbow accounted for 8.51% (95% CI = 6.98-10.33; N = 7815), with the hand at 6.43% (95% CI = 5.46-7.55; N = 5905).
The most common shoulder injuries were fractures, comprising 29.05% (95% CI = 24.07-34.60; N = 10 873), followed by strains or sprains at 25.94% (95% CI = 20.92-31.68; N = 9707).
Among elbow injuries, contusions, abrasions, and lacerations were the most common diagnosis, comprising 57.38% (95% CI = 47.43-66.76; N = 4484). This was followed by fractures, which accounted for 14.24% (95% CI = 7.61-25.08; N = 1113).
For the wrist, fractures were the most frequent diagnosis, comprising 50.21% (95% CI = 44.00-56.42; N = 9021) of all wrist injuries. The hand was most commonly affected by contusions, abrasions, and lacerations, comprising 42.82% (95% CI = 31.92-54.46; N = 2528) of all hand injuries, followed by fractures, which accounted for 36.2% (95% CI = 24.29-50.09; N = 2138). For the fingers, contusions, abrasions, and lacerations were the most common diagnosis, comprising 44.78% (95% CI = 35.11-54.87; N = 4620) of all finger injuries. This was also followed by fractures, which accounted for 30.93% (95% CI = 24.15-38.64; N = 3191).
Injuries by Patient Age
The study population was divided into 3 age groups: youth players (5-13 years, N = 26 775, 29.14%), high school players (14-18 years, N = 49 766, 54.16%), and college players (19-24 years, N = 15 348, 16.70%; Table 3). Figure 2 illustrates the distribution of injuries among the 3 groups. Logistic regression analyses showed distinct injury patterns among these age groups.
Age-Based Distribution of Upper Extremity Injuries by Body Part and Diagnosis (2004-2023).
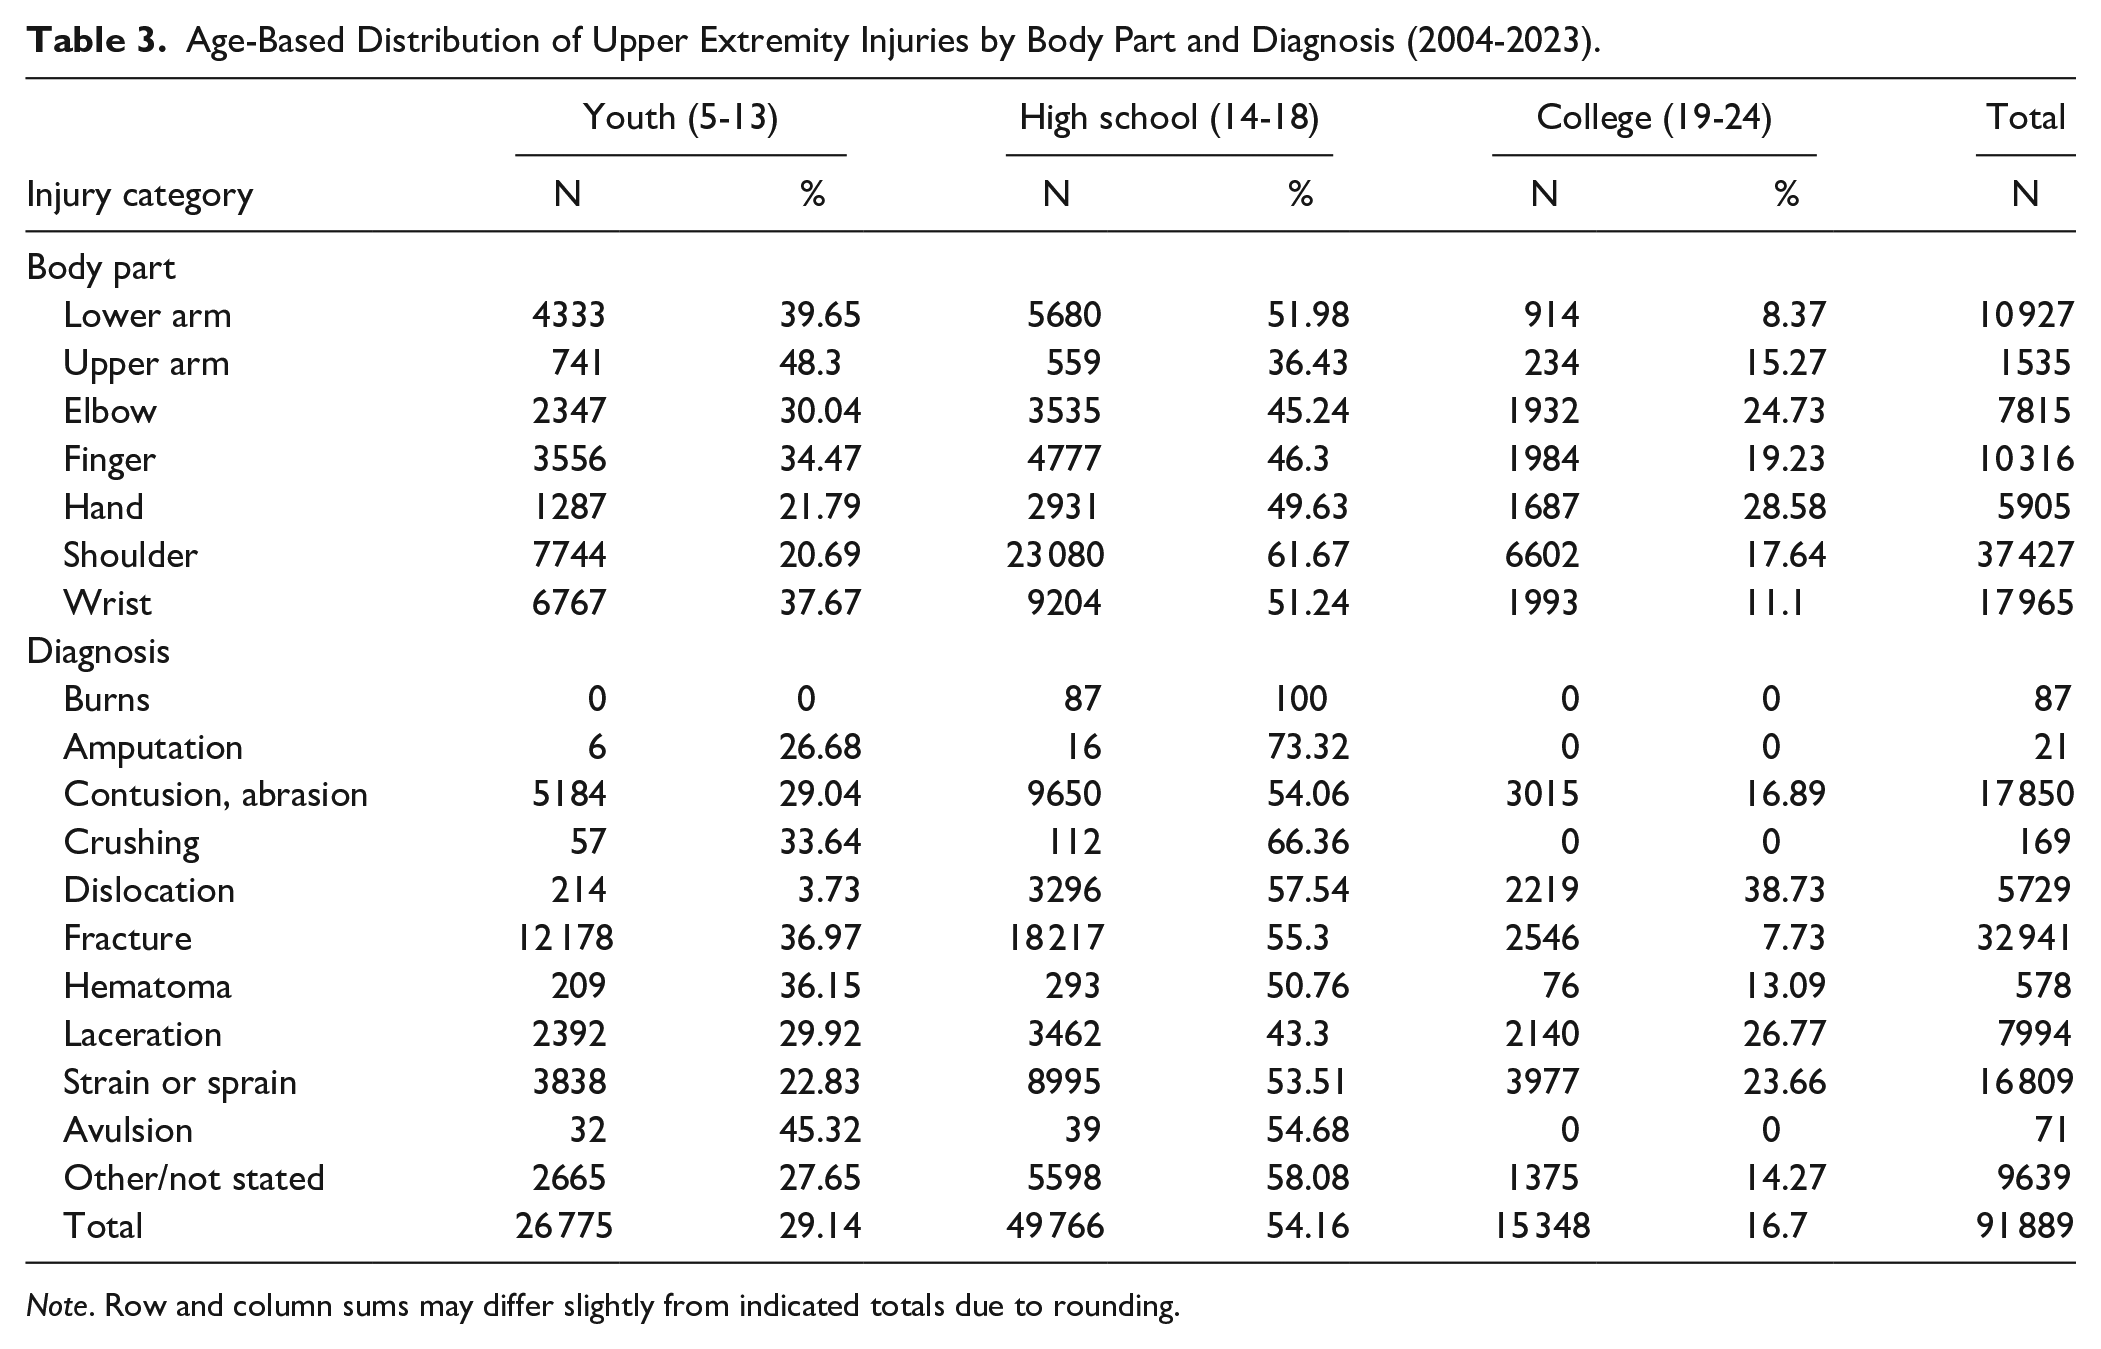
Note. Row and column sums may differ slightly from indicated totals due to rounding.
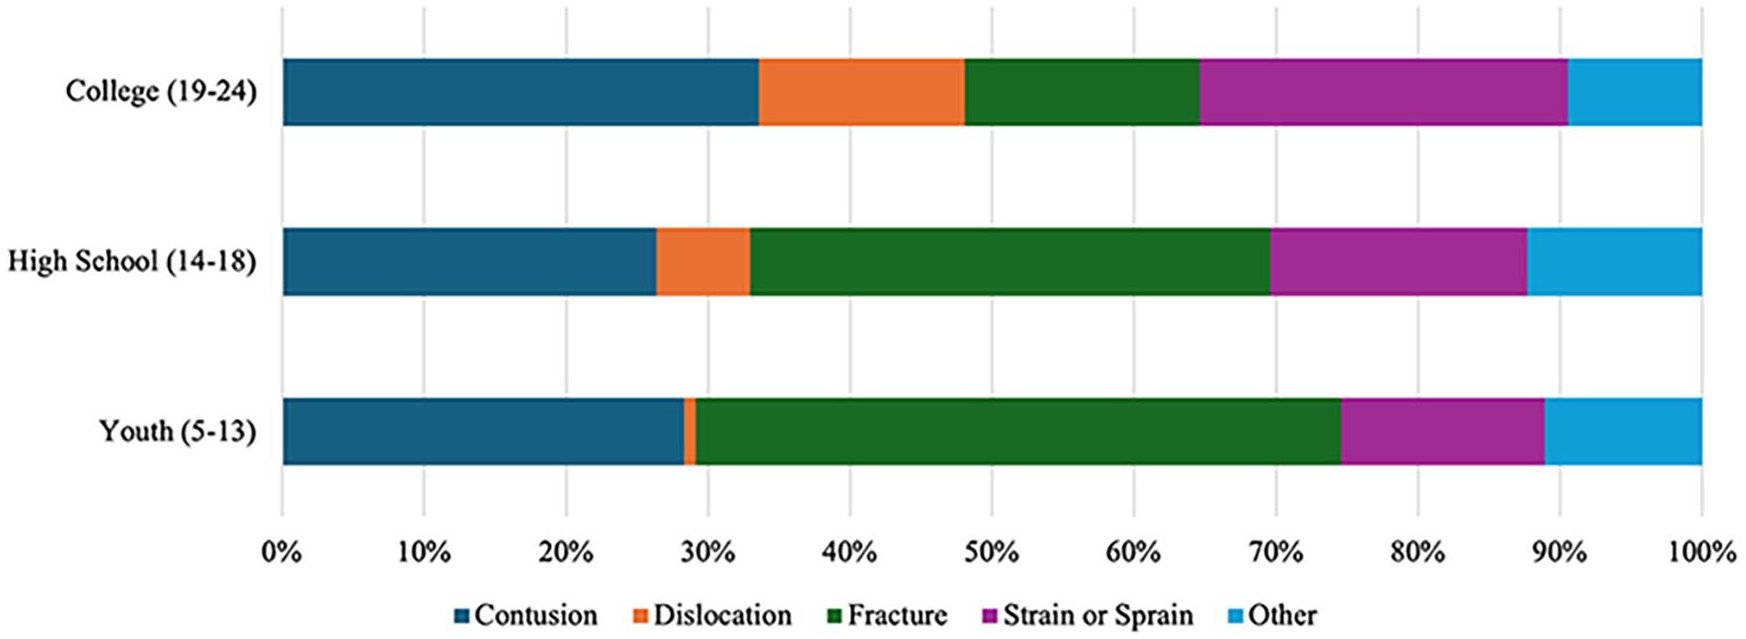
Distribution of upper extremity injury diagnoses by age group. Diagnosis patterns varied among youth, high school, and college-aged patients presenting with ice hockey–related upper extremity injuries from 2004 to 2023.
School-aged players (5-13 years)
For youth players (5-13 years, N = 26 775), fractures were the most prevalent injury type, accounting for 45.48% of the injuries (95% CI = 38.76%-52.38%, N = 12 178), followed by contusions, abrasions, and lacerations at 28.3% (95% CI = 24.16%-32.84%, N = 7576; Figure 3). Dislocations were relatively uncommon in this age group, comprising only 0.80% (95% CI = 0.28%-2.25%, N = 214).
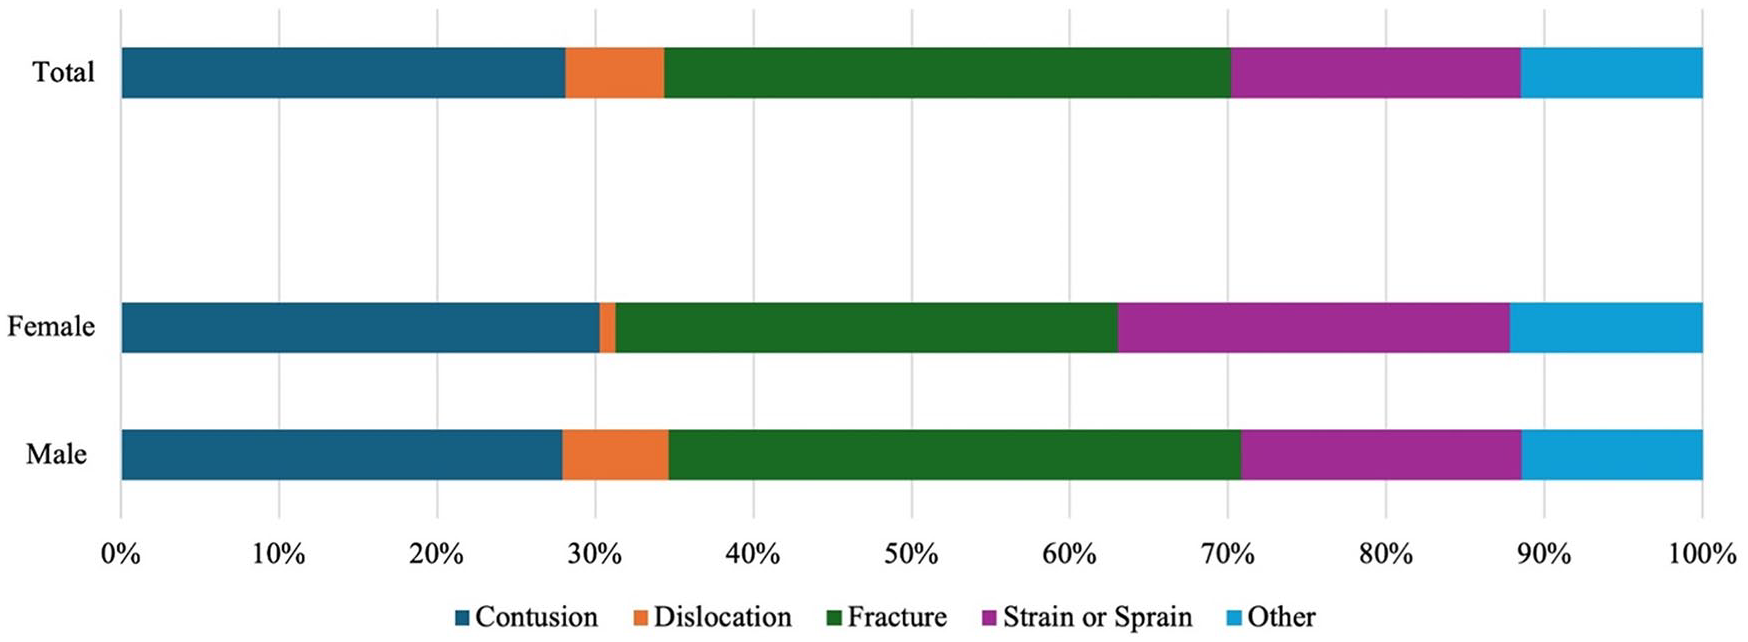
Distribution of upper extremity injury diagnoses by sex. Diagnosis patterns differed between male and female patients presenting with ice hockey–related upper extremity injuries from 2004 to 2023.
The shoulder was the most frequently injured body part in school-aged players, accounting for 28.92% of injuries (95% CI = 24.30%-34.03%, N = 7744). This was followed by wrist injuries at 25.27% (95% CI = 20.39%-30.87%, N = 6767) and lower arm injuries at 16.18% (95% CI = 13.24%-19.63%, N = 4333). Youth had higher odds of sustaining fractures (OR = 1.78, 95% CI = 1.35-2.36, P < .001) compared with other age groups.
High school players (14-18 years)
High school players (14-18 years) showed a higher proportion of soft tissue injuries with 44.42% of injuries classified as soft tissue injuries (N = 22 107, 95% CI = 37.21%-51.87%). Fractures were common, accounting for 36.61% of injuries (N = 18 217, 95% CI = 32.68%-40.71%). Dislocations in high school athletes were more frequent than in younger players, comprising 6.62% of high school UE injuries (N = 3296, 95% CI = 4.99%-8.74%). The shoulder was overwhelmingly the most affected body part in this age group, accounting for 46.38% (95% CI = 43.39%-49.39%, N = 23 080) of injuries, followed by the wrist (18.50%, 95% CI = 15.98%-21.31%; N = 9204) and lower arm (11.41%, 95% CI = 8.87%-14.56%; N = 5680). High school students had higher odds of sustaining crushing injuries (OR = 1.67, 95% CI = 1.37-2.03, P < .001) compared with other age groups.
College-aged players (19-24 years)
College-aged players (19-24 years) exhibited a different injury profile. Soft tissue injuries were the most common, accounting for 59.5% (95% CI = 52.18%-66.43%, N = 9133) of college injuries, followed by fractures at 16.59% (95% CI = 12.03%-22.43%, N = 2546). Notably, dislocations were most prevalent in this age group, comprising 14.46% (95% CI = 9.91%-20.61%, N = 2219) of injuries in the college group.
College students had higher odds of sustaining soft tissue injuries (OR = 1.89, 95% CI = 1.46-2.44, P < .001) and dislocations (OR = 3.52, 95% CI = 2.03-6.10, P < .001) compared with other groups.
Injuries by Patient Sex
Among ice hockey athletes with UE injuries, males accounted for 92.19% (95% CI = 90.72%-93.45%, N = 84 716), whereas females represented 7.81% (95% CI = 6.55%-9.28%, N = 7173). Figure 3 illustrates the distribution of injuries among males and females.
Among male ice hockey athletes with UE injuries, the most common diagnosis was fracture, accounting for 36.2% (95% CI = 32.41%-40.16%, N = 30 664), followed by contusions, abrasions, and lacerations at 27.94% (95% CI = 23.66%-32.67%, N = 23 673); strain or sprains at 17.74% (95% CI = 14.69%-21.26%, N = 15 030); and dislocation at 6.68% (95% CI = 5.18%-8.57%, N = 5658).
The most frequently injured body parts in male players were the shoulder (41.67%, 95% CI = 38.93%-44.47%; N = 35 304), wrist (18.62%, 95% CI = 16.00%-21.56%; N = 15 774), and lower arm (16.18%, 95% CI = 13.24%-19.63%; N = 4333).
Among female ice hockey athletes with UE injuries, the most common diagnoses were fractures, accounting for 31.75% (95% CI = 23.86%-40.85%, N = 2277), followed by contusions, lacerations, and abrasions at 30.27% (95% CI = 22.10%-39.91%, N = 2171); strains or sprains at 24.82% (95% CI = 17.50%-33.94%, N = 1780); other injuries at 12.17% (95% CI = 5.26%-25.70%, N = 873); and dislocations at 0.99% (95% CI = 0.19%-5.08%, N = 71).
The most commonly injured body parts in female players were the wrist (30.54%, 95% CI = 22.7%-39.7%; N = 2191), shoulder (29.59%, 95% CI = 23.73%-36.22%; N = 2122), and elbow (10.45%, 95% CI: 7.598%-14.21%; N = 750). Notably, females had a higher proportion of wrist injuries compared with males.
Logistic regression analyses showed distinct trends between males and females in injury location and type. Males had higher odds of sustaining shoulder injuries (OR = 1.70, 95% CI = 1.26-2.29, P = .001) compared with females. Males were significantly more likely to sustain shoulder dislocations (OR = 6.55, 95% CI = 1.16-37.06, P = .034) compared with females. Comparatively, females were more likely to experience any wrist injury (OR = 1.92, 95% CI = 1.25-2.95, P = .004) compared with males. Females had higher odds of sustaining wrist strains or sprains (OR = 2.92, 95% CI = 1.76-4.83, P < .001) and upper arm fractures (OR = 2.88, 95% CI = 1.30-6.40, P = .010) compared with males. Females also had higher odds of sustaining soft tissue injuries (OR = 1.46, 95% CI = 1.07-1.98, P = .017) compared with males.
Discussion
This study’s findings highlight the significant prevalence of UE injuries, accounting for 35.56% of all reported ice hockey–related injuries, aligning with previous literature reporting UE injuries constitute 8% to 34.4% of all hockey-related injuries.9,17 The shoulder was the most commonly injured region, followed by the wrist and fingers, reflecting the biomechanics of ice hockey where these areas are frequently exposed to high-impact collisions, stick strikes, and falls onto the ice.
Distinct sex-specific injury patterns were revealed. Females had higher odds of experiencing wrist and finger strains or sprains, whereas males were more likely to sustain shoulder dislocations and hand fractures. Notably, body checking is prohibited in women’s hockey, although it is permissible for male players over the age of 14. This rule difference likely contributes to a distinct style of play and injury patterns compared with men’s hockey, particularly the higher incidence of shoulder injuries and dislocations. The anatomy and relative flexibility of the glenohumeral joint make it vulnerable to dislocation, particularly with high-energy collisions involving the upper body, and our findings support the association of body checking with higher rates of shoulder injury in men’s hockey.18,19
Findings also revealed distinct injury patterns across different age groups. School-aged players (0-13 years) had higher odds of fractures, avulsions, and crushing injuries, likely due to their ongoing development of proper playing technique and skeletal system. High school players (14-18 years) showed similar patterns to younger players but with increased dislocation rates, whereas college-aged players (19-24 years) were the most susceptible to dislocations, strains or sprains and soft tissue injuries. The increase in these injuries, specifically shoulder dislocations, may be attributed to the higher intensity and physicality of high school and collegiate play, where body checking becomes permissible at the 14U level of play. 20
Ice hockey’s unique penalty system allows for a level of physicality rarely seen in other sports. Major infractions, such as boarding, charging, and fighting, result in only 5-minute penalties, whereas minor violations lead to 2-minute penalties. This relative leniency may encourage aggressive play, contributing to the high injury rates observed. The permissive ruleset, combined with the sport’s highly physical nature, may foster aggressive tactics that contribute to the high rates of UE injuries commonly observed in hockey. The design and quality of protective equipment also play a significant role. Inadequate coverage—such as exposed wrists, fingers, or forearms due to poorly designed or ill-fitting gloves and padding—can leave players vulnerable to lacerations, fractures, and contusions. In addition, the use of suboptimal materials or insufficient padding in gloves, elbow pads, and shoulder pads may fail to adequately absorb or disperse impact forces, further increasing the risk of UE injuries despite the presence of protective gear.
Fractures, particularly of the wrist, hand, and digits, represent a significant portion of overall injuries (15.62%) and can substantially affect a player’s performance and recovery time. National Hockey League players who sustained hand or wrist fractures missed an average of 14 to 22 games, equivalent to more than a quarter of a regular season, with players experiencing a significant decrease in performance statistics upon return. 9 The same study reported that the average time to return to play was significantly increased for cases requiring operative intervention, especially in fractures of the thumb and wrist. 9 These extended recovery periods highlight the significant impact that various UE fractures can have on a hockey player’s season and performance.
The findings of this study have important implications for physicians and health care providers treating ice hockey athletes. When counseling patients, providers should inform them about the overall injury risk, age-specific risks, and sex-specific risks. Special attention should be given to protecting the shoulder, wrist, and hand regions, as these are the most commonly injured areas. Patients should also be counseled on the potential impact on playing time and long-term implications of injuries.
To address these issues, several strategies could be used. Enhancing the enforcement of existing penalties and implementing more severe consequences for dangerous play could serve as deterrents. Williamson et al 21 demonstrated that increasing the severity of penalties for head contact in ice hockey led to a significant decrease in head-to-head collisions, suggesting similar measures could be effective in reducing injuries to other areas. In addition, introducing new penalties for risky behaviors, educating players about injury prevention, promoting safe checking techniques, and mandating more effective protective equipment could potentially lower injury rates while preserving the physical intensity of the sport.
Limitations and Future Directions
Although this study provides valuable insights, it has some limitations. The reliance of NEISS on emergency department data may not capture all ice hockey–related injuries, particularly those treated in other health care settings, such as urgent care clinics or dedicated orthopedic urgent care clinics. In addition, the study lacks information on specific play situations leading to injuries and does not account for exposure time or player positions, nor does it detail specific injury types, treatment, or longitudinal outcome data. Another limitation of the NEISS database is that diagnoses made in EDs, especially for “strains or sprains,” are often preliminary and may differ from the final diagnoses made by specialists after advanced imaging and work up. Furthermore, the cohort in this study was predominantly white, male, and high school–aged, which may limit the generalizability of the findings; the results and conclusions may not be applicable to all ice hockey participants, including those of different ages, genders, or racial and ethnic backgrounds.
Conclusion
This comprehensive analysis of UE injuries in ice hockey athletes highlights the significant burden of these injuries and identifies important patterns related to injury types, anatomical locations, and demographic factors. These findings provide a foundation for developing targeted injury prevention strategies and improving player safety in ice hockey. By addressing the specific risk factors and injury patterns identified in this study, stakeholders in the sport can work toward reducing the incidence and severity of UE injuries, ultimately enhancing the long-term health and performance of ice hockey players.
Footnotes
Author Contributions
Peter V. Dinh: Project administration; Investigation; Methodology; Supervision; Writing—original draft; Writing—review & editing
Timothy A. Reiad: Formal analysis; Investigation; Methodology; Validation; Writing—original draft; Writing—review & editing
Margaret R. Wang: Supervision; Writing—original draft; Writing—review & editing
Jacob M. Johnson: Conceptualization; Supervision; Writing—original draft; Writing—review & editing
David Bruni: Supervision; Writing—original draft; Writing—review & editing
Reena A. Bhatt: Supervision; Writing—original draft; Writing—review & editing
Joseph A. Gil: Supervision; Writing—original draft; Writing—review & editing
Ethical Approval
This study was approved by our institutional review board.
Statement of Human and Animal Rights
This article does not contain any studies with human or animal subjects.
Statement of Informed Consent
Informed consent for information published in this article was not obtained because these data are publicly available and deidentified.
Declaration of Conflicting Interests
The author(s) declared no potential conflicts of interest with respect to the research, authorship, and/or publication of this article.
Funding
The author(s) received no financial support for the research, authorship, and/or publication of this article.