
Abstract
The built environment comprises human-made spaces that influence our behavior, and theme parks allow the study of physical activity in a highly developed and immersive environment. In this sample (n = 33, 34.5 ± 10.4 years, 78.8% female), physical activity (steps/day) was collected retrospectively over a 7-day period at baseline and during their time spent in Walt Disney World (WDW) resort. Categorical park exposure was defined as baseline days at home, scheduled off days during travel, single-park days, and multiple-park days. Steps were lowest during the baseline week at home, followed by scheduled off days during the trip (12,690, 95% CI 11,017 to 14,364 steps/day), single-park days (20,032, 95% CI 18,762 to 21,301 steps/day), and multiple-park days (25,309, 95% CI 24,211 to 26,406 steps/day) (all pairwise, P < .001). Participants accumulated more daily physical activity during their WDW visit compared with baseline days at home. Immersive and walkable built environments promote higher levels of incidental physical activity without intentional exercise.
“Participants accumulated significantly more daily physical activity during their WDW visit compared with baseline days at home.”
Introduction
Physical activity is critically important to health, as higher physical activity is associated with lower risk of heart disease, stroke, certain types of cancers, and numerous other chronic clinical conditions.1,2,3 Unfortunately, most adults in the United States fail to accumulate the recommended amount of physical activity. 4 While the exact reason, or combination of reasons, remains unclear, lack of time, lack of energy, and lack of motivation are cited as common barriers to physical activity.2,5 These contextual factors, when coupled with environmental factors, play a significant role in influencing physical activity behavior. The built environment comprises human-made spaces that influence daily living, work, and recreation, including community layout, transportation systems, and recreational amenities such as parks, trails, and mixed-use developments. 6 Closer proximity to community destinations, supportive transportation infrastructure, and favorable aesthetic qualities have been associated with higher physical activity levels.2,6 However, much of this research has focused on structured settings or community-based interventions. 7
Despite the growing interest in how environmental characteristics support physical activity, theme parks have historically been understudied. Theme parks provide a highly structured environment that could potentially allow the study of physical activity behavior in a controlled environment that eliminates many of these potential barriers. These environments offer a unique combination of physical space, social dynamics, and motivation for movement that differ from day-to-day routines. Specifically, there is limited empirical evidence on how much walking or physical activity occurs during theme park visits, and how it may vary across individuals or under different circumstances (e.g., during special events or with different travel groups). Additionally, existing national physical activity surveillance systems do not capture this type of context-specific movement behavior because the time spent in these settings is relatively short, and does not represent a typical week for most adults. 8
Although many theme parks and similar environments exist, Walt Disney World (WDW) is the largest and most popular of the major theme parks, with annual attendance in 2024 totaling just over 49 million patrons. 9 The park was originally founded in 1971 with the Magic Kingdom and subsequently opened four separate parks, each with their own distinct theming and characteristics, with the most recent being Animal Kingdom in 1998. 10 Individually, the Magic Kingdom is the most popular theme park in the world, ranking #1 in annual attendance, with EPCOT (the Experimental Prototype Community of Tomorrow) and Hollywood Studios rounding out the top 10 (eighth and ninth, respectively), and Animal Kingdom ranking 15th in Amusement/Theme Parks attendance worldwide in 2024. 9 Collectively, the four main theme parks within WDW offer miles of paved walkways, interconnected transportation hubs that include Skyliner gondola lifts, a monorail system, bus transportation routes, and even waterway taxis. 11 Automobile transportation within each of the parks is not possible, and is difficult to use when traveling between the parks. Essentially, once arriving at WDW Resort, guests rely almost exclusively on the interconnected transportation system and active transportation, specifically walking in most cases, to move throughout the parks.
Although anecdotal evidence and popular perception suggest that individuals are more physically active in this setting, 12 empirical research using controlled, device-based methods to quantify these context-dependent changes in physical activity behavior remains limited. In particular, few studies have examined how physical activity varies across distinct daily contexts, and identify other factors which may also impact physical activity while in WDW Resort is lacking. Addressing this gap may improve understanding of how recreational built environments influence daily physical activity behavior. As such, this study aims to address these gaps by collecting real-world, self-reported wearable-device data on physical activity during visits to WDW Resort. Findings will contribute to a broader understanding of how leisure and tourism environments can support public health and inform future recommendations for physical activity promotion in novel settings.
Materials and Methods
This investigation used a repeated-measures observational design to examine within-person changes in daily physical activity across WDW parks. Data were collected anonymously online using the Qualtrics survey system from October 28, 2025 to January 13, 2026. The study protocol was approved by the Institutional Review Board at the University of Alabama (protocol ID# 25-10-9084).
Participants
Participants were recruited via online platforms (e.g., social media, forums) using standardized posts which included information regarding the nature and scope of the research, the study requirements, inclusion criteria, and outcome measures that would be collected. Individuals who were interested in this research study provided consent electronically to participate. No personally identifiable information (i.e., name, email, IP address, etc.) was collected as part of this study. Participants were eligible if they were adults over 18 years of age, fluent in English, and visited WDW within the previous 12 months.
Demographics
Participant characteristics were self-reported and used for descriptive purposes and as potential covariates in the subsequent analyses. These characteristics included: Age (in years), sex (female or male), race (Asian, Black or African American, Native Hawaiian or Other Pacific Islander, American Indian or Alaskan Native, White/Caucasian), ethnicity (Hispanic or Latino and Non-Hispanic or Latino), height (feet and inches), and weight (in pounds).
WDW Park Characteristics
Daily park attendance was assessed via self-report for each day of the trip. Participants were asked to indicate which WDW park(s) they entered by selecting all applicable options from a predefined list, including Magic Kingdom, EPCOT, Hollywood Studios, and Animal Kingdom. Additional response options included a “Scheduled Off Day” for days spent in WDW Resort, but during which participants did not enter one of the four theme parks. Each park and response option was recorded as a dichotomous indicator at the day level and then combined to derive a categorical park exposure variable representing baseline days at home, scheduled off days during travel, single-park days, and multiple-park days. This derived variable was used in subsequent analyses to characterize daily physical activity across distinct exposure contexts.
In addition to park location and step counts, several contextual variables were assessed to characterize participants. The length of the current visit, whether the participant stayed at an on-site resort within WDW (coded as No or Yes), and the number of previous visits to WDW was assessed as a continuous variable to reflect potential familiarity with the built environment within WDW. Participants reported whether they used additional park services during their visit, including options such as Lightning Lane or Park Hopper passes (both coded as No or Yes). Whether participants traveled with children (coded as No or Yes), the total number of Children (reported as the number of children under 18 years of age), and whether a stroller was used during the visit (coded as No, Single Stoller, or Double-Stroller) were also reported. Last, participants were asked to report the specific brand and model of the physical activity monitor used during their visit to WDW, which was subsequently collapsed into a single dichotomous variable indicating whether the device was “wrist-worn” (No or Yes). These variables were examined descriptively and considered as covariates, but not included as primary predictors in the mixed-effects models.
Physical Activity Assessment
Physical activity (daily step count; steps/day) data was collected retrospectively; participants provided data from their personal wearable activity monitor or a smartphone to provide an ecologically valid assessment of PA in free-living conditions. 13 Participants were required to report data from consecutive days over a 7-day period at baseline and during their time spent in WDW resort. 14 The validity of consumer-wearable devices has thoroughly been examined in previous research. 15 Given their rise in popularity and the volume of data that can be collected from participants in longitudinal studies, their use in large-scale studies has been supported. Although device type varied across participants, all methods captured total daily ambulatory movement and were treated equivalently for analytic purposes using device type as a potential covariate, as participant data were collected using the same device throughout the observation period. 16 No prospective wear instructions were provided as part of the study protocol.
Statistical Analysis
All analyses were performed in SPSS (IBM version 29.0 Somers, NY, USA). Individuals with zero self-reported steps/day were excluded from the analysis (n = 27). In addition, descriptive statistics (mean [M], standard deviation [SD], skewness, kurtosis, minimum and maximum) were generated for each variable of interest. Data were visually examined using box and whisker plots and participant values exceeding ±3 SD from the mean value were identified as potential outliers. Data are reported as M ± SD, or 95% confidence interval (95% CI), unless otherwise indicated, and statistical significance was determined using an alpha level P < .05.
To address Aim 1, daily step counts were analyzed using a linear mixed-effects model with repeated daily observations nested within participants. Park environment (baseline days at home vs trip days at WDW) was included as a fixed effect, and participant was included as a random intercept. This approach accounted for unequal numbers of observations per participant. Examination of model residuals using histograms and Q–Q plots indicated adequate normality. Although the Kolmogorov-Smirnov test was statistically significant (P = .023), the Shapiro–Wilk test was non-significant (P = .079), and visual diagnostics supported normality. Standardized residuals were also examined and showed homoscedasticity, with only one observation exceeding ±3 SD; this value reflected plausible behavior and was retained. Overall, model assumptions were adequately met.
To address Aim 2, daily step counts were also analyzed using linear mixed-effects models. Individual WDW park locations and possible park combinations were initially inspected to explore differences when participants visited more than one park in a single day. For the primary analysis, days were collapsed into distinct categories which included baseline days at home, scheduled off days during their trip, days involving visits to a single park (single-park day), and days involving visits to multiple parks (multiple-park day) and focused on a priori planned contrasts rather than exhaustive pairwise comparisons between individual parks. Park location was included as a fixed effect, and participant was included as a random intercept. Models were estimated using restricted maximum likelihood (REML). These contrasts tested theoretically relevant comparisons, as well as an overall comparison between park days and off days, which reduced Type II error and preserved interpretability.
Results
Descriptive Characteristics of Study Participants.
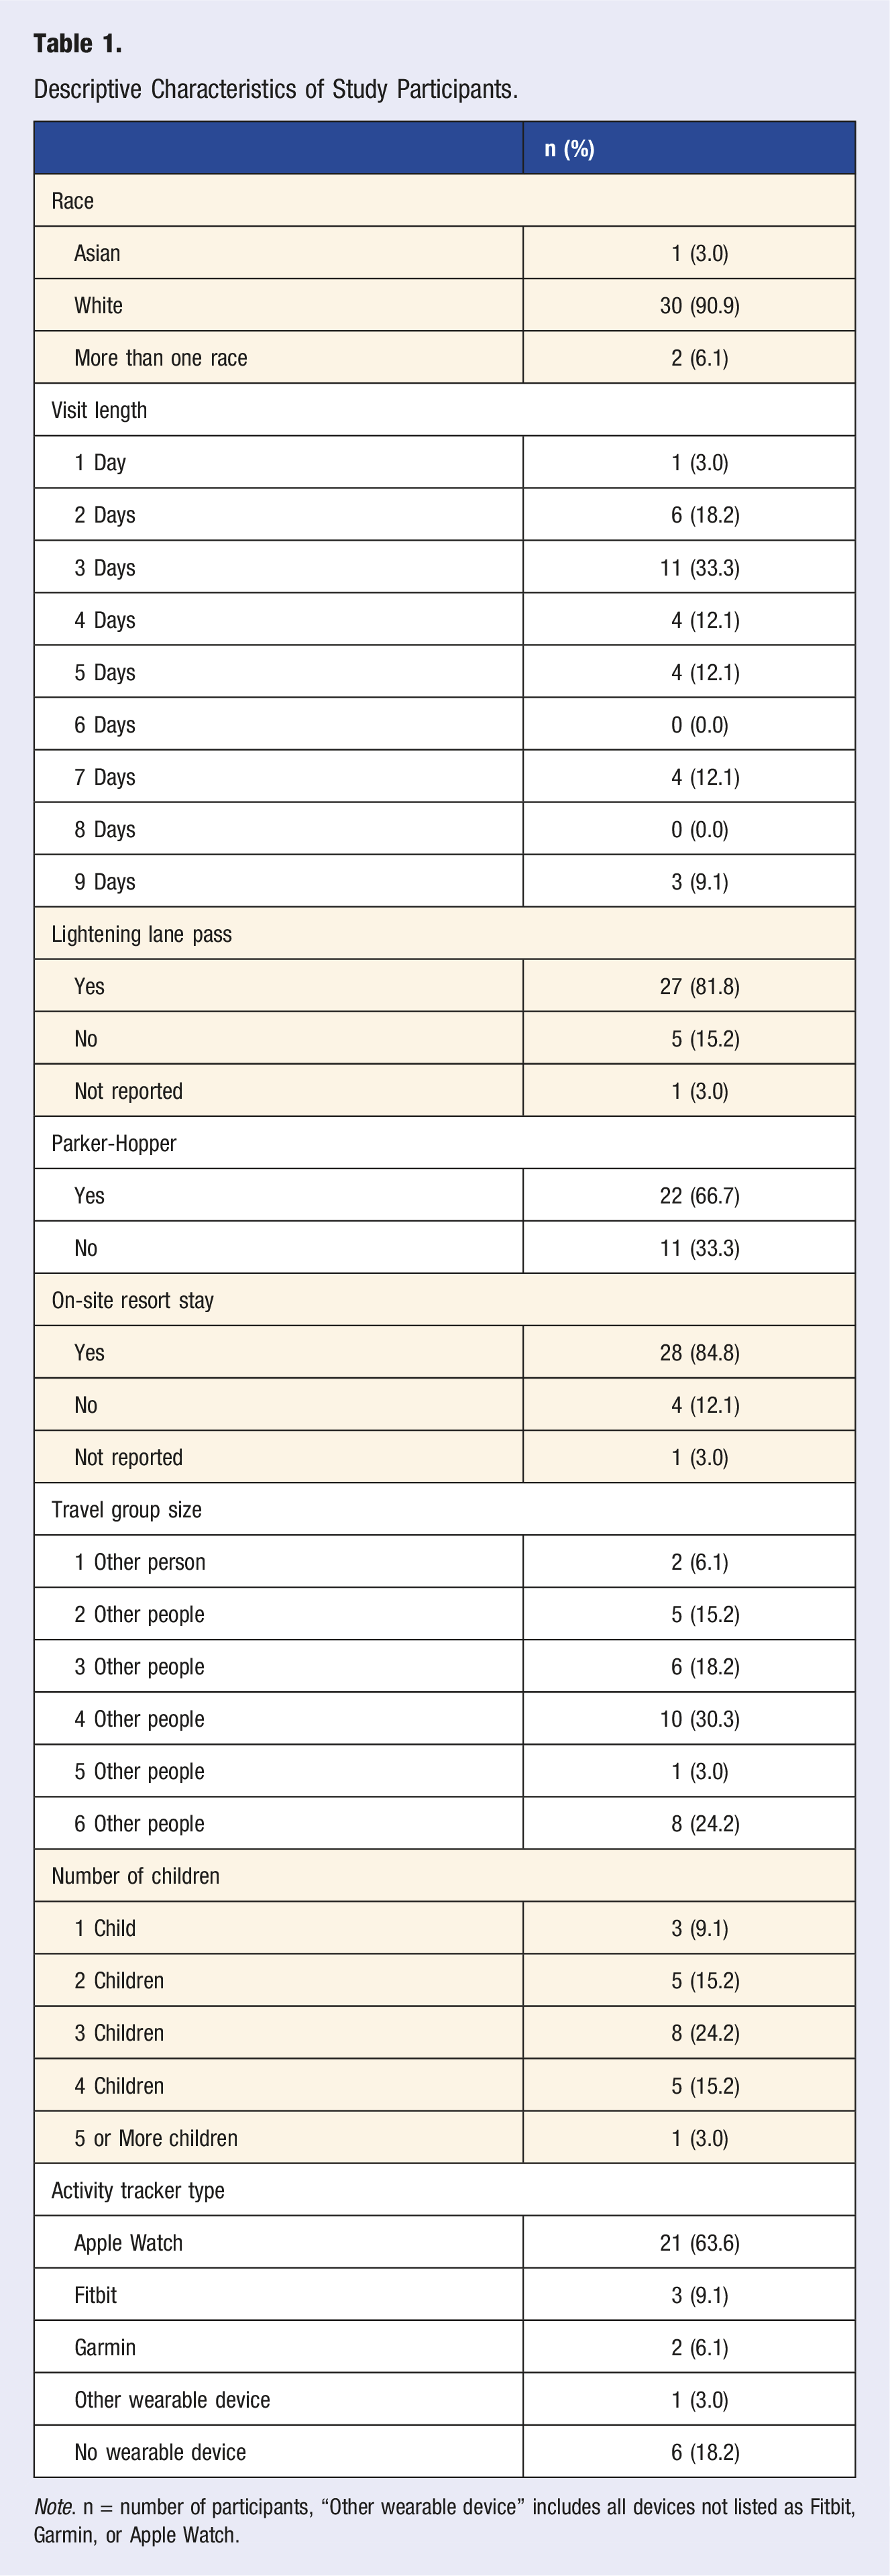
Note. n = number of participants, “Other wearable device” includes all devices not listed as Fitbit, Garmin, or Apple Watch.
Participants contributed between 6 and 7 baseline days (totaling 222 person-days) and between 1 and 9 trip days (totaling 137 person-days) used in the mixed-effects models, which included 27 scheduled off days (7.5%), 47 days involving visits to a single park (13.1%), and 63 days involving visits to multiple parks (17.5%). Preliminary mixed-effects analyses indicated higher daily step counts while in WDW (21,029, 95% CI 20,130 to 21,928 steps/day) compared with the pre-trip baseline week at home (7,875, 95% CI 7,169 to 8,581 steps/day; P < .001).
In a subsequent analysis, days were collapsed into distinct categories representing single-park days and multiple-park days to account for unequal number of person-days in each park. The Magic Kingdom was the most frequently visited park (n = 18, 5.0%), followed by EPCOT (n = 14, 3.9%), Hollywood Studios (n = 11, 3.9%), and Animal Kingdom (n = 6, 1.7%). The number of observations varied across days involving visits to multiple parks, with EPCOT + Hollywood Studios (n = 18, 5.0%) representing the most commonly reported combination, followed by the Magic Kingdom + Hollywood Studios (n = 14, 3.9%), the Magic Kingdom + EPCOT (n = 12, 3.3%), the Magic Kingdom + Animal Kingdom (n = 8, 2.2%), and EPCOT + Hollywood Studios (n = 6, 1.7%). No participants reported visits to three parks within the same day, however 5 guests reported visiting all four parks within a single day (n = 5, 1.4%). Step counts were lowest during the baseline week at home, followed by scheduled off days during the trip (12,690, 95% CI 11,017 to 14,364 steps/day), single-park days (20,032, 95% CI 18,762 to 21,301 steps/day), and highest on multiple-park days (25,309, 95% CI 24,211 to 26,406 steps/day) (all pairwise, P < .001). This ordered pattern suggests a graded increase in physical activity associated with increasing exposure to the park environment (P trend <.001) (Figure 1). Distribution of daily step count (steps/day) across daily park environments. Closed circles represent the mean within each group. The central line indicates the median, boxes represent the interquartile range (IQR, 25th-75th percentiles), and whiskers extend to 1.5 times the IQR. Data points beyond the whiskers denote potential outliers. a Significantly different than scheduled off day, single-park day, and multiple-park day (P < .001) b Significantly different than home, single-park day, and multiple-park day (P < .001) c Significantly different than home, scheduled off day, and multiple-park day (P < .001) d Significantly different than home, scheduled off day, and single-park day (P < .001).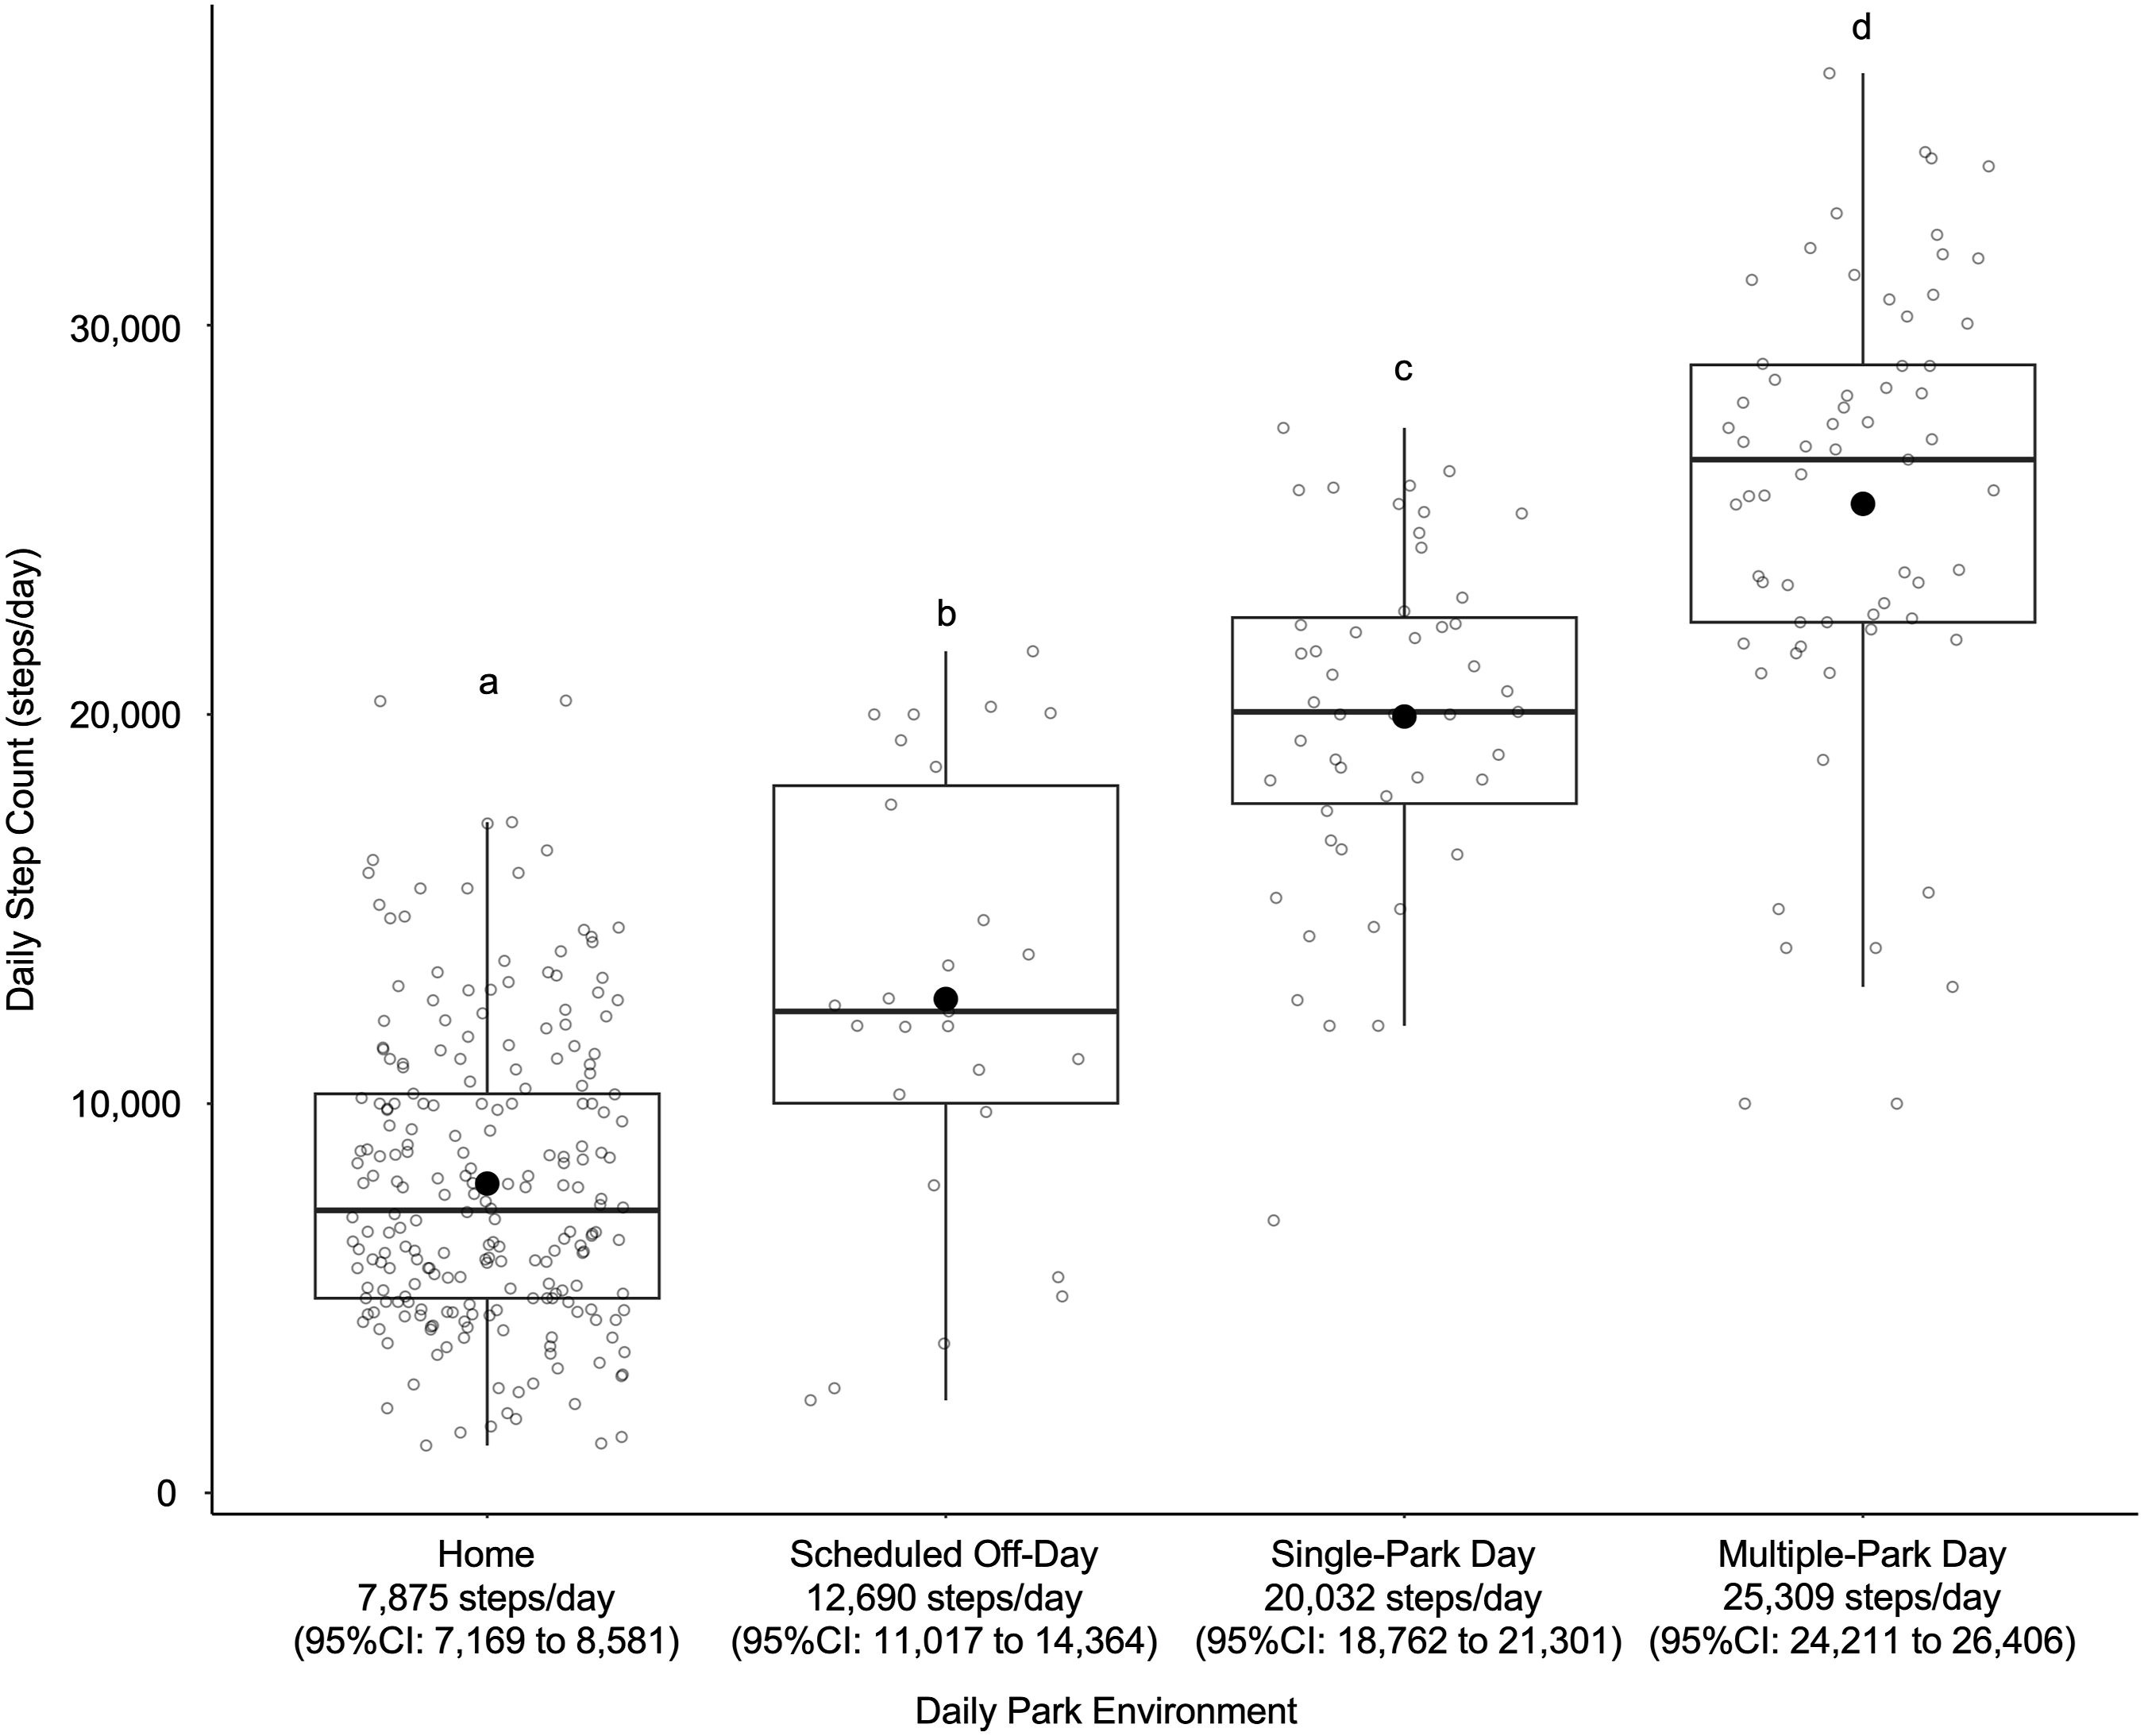
Parameter Estimates From Linear Mixed-Effects Model Predicting Daily Physical Activity in Walt Disney World.
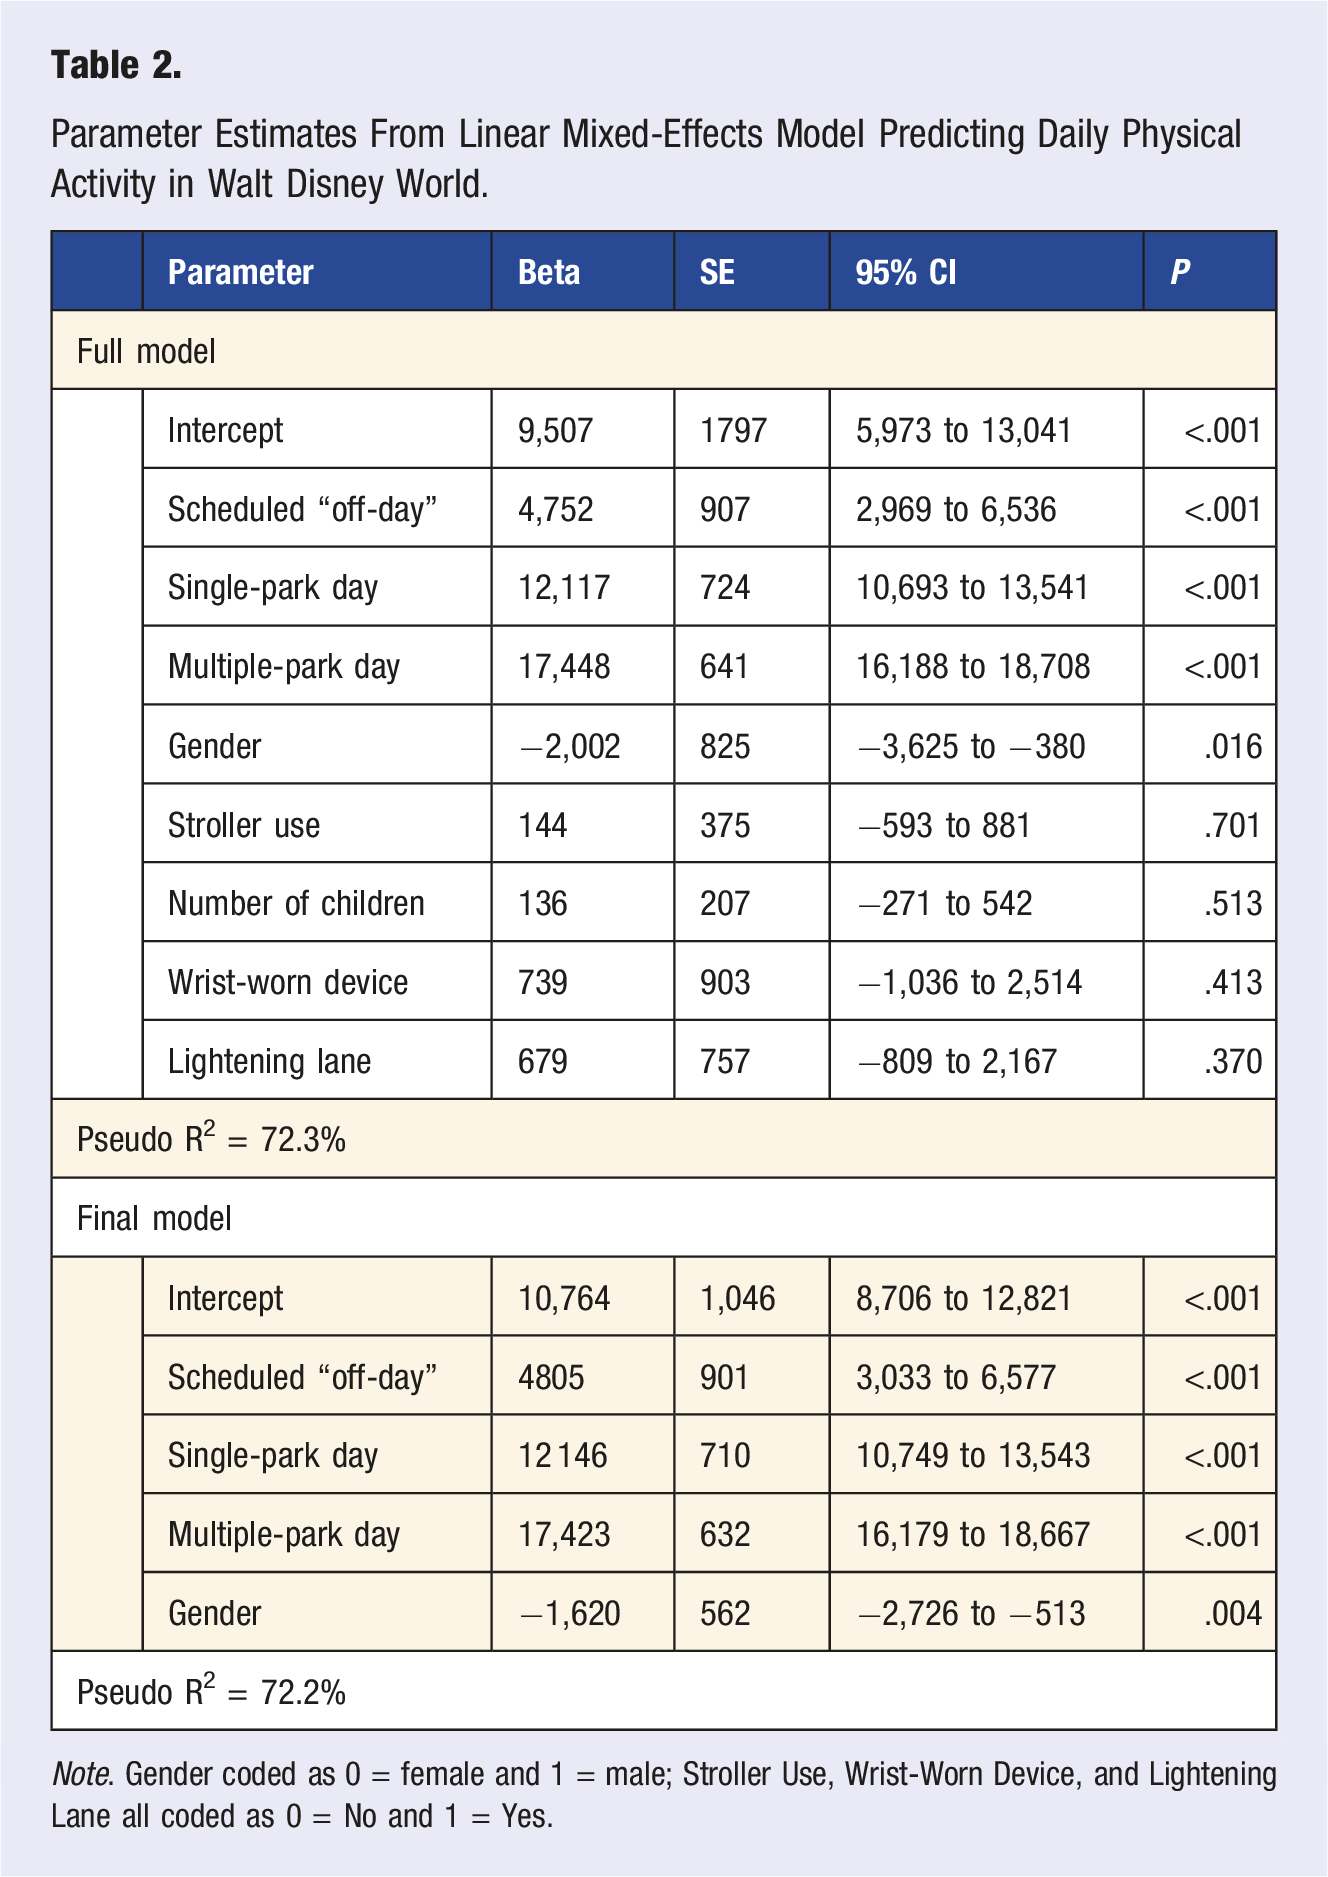
Note. Gender coded as 0 = female and 1 = male; Stroller Use, Wrist-Worn Device, and Lightening Lane all coded as 0 = No and 1 = Yes.
Discussion
The results of the current study indicate that adults are 2-3 times more physically active while at WDW compared with baseline days at home, with additional differences observed between various parks and park combinations. Although higher levels of physical activity during visits to WDW were anticipated, these findings extend beyond previously reported anecdotal estimates that individuals walk more while navigating through WDW. Daily step counts increased in a graded manner from baseline days at home to scheduled off days, single-park days, and multiple-park days, suggesting that features of the built environment and the structure of daily activities meaningfully shape physical activity behavior. The consistency of this pattern across park exposure levels indicates that well-designed, walkable environments that integrate engaging destinations may facilitate sustained physical activity without requiring explicit exercise intent.
These results are consistent with previous research in 122 adults (65% female) which found walking increased during vacation compared to pre-vacation (P < .001) and 6-week post-vacation (P < .001). 17 Interestingly, this increase appeared to be domain specific, as moderate-intensity activity decreased during vacation compared to both pre-vacation (P < .01) and 6-week post-vacation periods (P < .05), with no changes in vigorous activity. 17 Also consistent with our current study, light-intensity physical activity (+3 min/day, +0.9%, P = .02) and moderate-to-vigorous physical activity increased during vacation (+5 min/day, +13.2%, P < .001) in a sample of 308 Australian adults. Identifying the reason for these inconsistencies is beyond the scope of the current study, however may be due to validity of the self-reported physical activity assessment used by Cooper et al., which has been questioned when compared to device-based measures of physical activity. 18 Despite some variation in domain-specific findings, both this study and previous research indicate a consistent increase in walking and light-intensity activity.
However, not all previous research has indicated that adults are more physically active while on vacation. These results contradict a recent systematic review and meta-analysis of 17 studies including 1951 adult participants which found no difference in time spent engaged in light physical activity, or moderate-vigorous intensity physical activity while on vacation, with little variability observed across seasons. 19 Only a slight non-significant increase in light intensity and moderate-vigorous intensity activity during the summer months (+19 min/day and +2 min/day), coupled with a slight, albeit statistically significant) decrease in light-intensity physical activity observed during winter months (−26 min/day, P = .04). 19
The parks were intentionally designed with visual, auditory, and olfactory stimuli that capture an individual’s attention and draw them to areas throughout the park.20,21,22 These features create a system of motivating factors that may encourage people to be more physically active while in WDW Resort than outside of the parks during a typical day. Visual “hooks” or “weenies” are used to pull guests closer to attractions, draw guests forward and promote traffic flow.23,24 When the original Disneyland Park opened in Anaheim, California in 1955, guests could see icons in each land meant to pique their interest from the central hub of the park. 23 Through the castle archway, a spinning, illuminated carousel enticed them forward. 24 Looking into Tomorrowland, a 76-foot Moonliner V2 rocket drew in those fascinated by the space race. 24 A peek through the rough-hewn log fort gate of Frontierland often featured the Mark Twain Riverboat sailing by, encouraging guests into the land themed with the wildness of the Old West. Adventureland, in contrast, did not feature any visual hook at all, instead purposefully shrouding itself in mystery as another creative way of drawing people forward. 23 When the Magic Kingdom opened in 1971, it employed many of these same visual tricks. 24 When EPCOT Center was in development in the late 1970s, the show building for the park’s headliner show, the American Adventure, was moved to the far side of the lagoon in an effort to prevent a bottleneck of people near the entrance to World Showcase, and encouraged guests to walk farther to reach the “main attraction” that they could spy across the water.24,25
The Disney parks also employ cinematic storytelling and order, which encourages patrons to follow through to the end of the story, or, in this case, move their feet to the far reaches of the park. 26 The unfolding story is, enticing guest movement, and a drive to discover more of the tale being told. 26 This intentional design feature aims to create a sense of harmony and contentment that keeps guests distracted from their weariness. 26 Beyond the stimuli meant to draw people in, the Disney parks are also intentionally designed to encourage guests to linger longer. A blend of asphalt concrete mixed with rubber was first introduced to Walt Disney via the 1939 New York World’s Fair, 23 and this “Rubberized Asphalt” has been implemented in all of the Disney parks, including his original Disneyland park and the Magic Kingdom, intended to alleviate achy joints and weary “Museum Feet.” 24 In addition, shaded areas, benches, and seating options throughout the parks also contribute to this goal, allowing guests to rest in between bouts of physical activity, thus promoting additional movement. 27
Although current U.S. national guidelines for physical activity do not include daily steps targets for adults, higher daily steps are associated with a lower risk of all-cause mortality and numerous other clinical conditions regardless of age, sex, and race, and have recently been adopted into other national guidelines.28,29 While 10,000 steps/day has been historically treated as an unofficial goal used widely in general recommendations, substantially lower amounts have been associated with clinically meaningful improvements in health outcomes.30,31 Generally speaking, some physical activity is better than none, and more is generally better than less. 32 Evidence from 57 studies and 35 different cohorts indicated accumulating at least 7,000 steps/day was associated with roughly 50% lower risk of all-cause and cardiovascular disease mortality, as well as decreased risk of cancer mortality, diabetes, and dementia, among other health outcomes. 33 Greater exposure to the park environment was associated with progressively higher physical activity. Notably, all individual parks and park combinations were associated with significantly higher step counts compared to planned off days, indicating that elevated physical activity was a consistent feature of park attendance rather than being driven by a specific park.
Higher physical activity levels are associated with environments that include safe walking infrastructure (such as raised crosswalks, sidewalks, traffic-free bridges, and greenways), enhanced landscaping and lighting, greater access to public transportation, increased street connectivity, and greater access to recreational opportunities.2,34 From a public health perspective, these results highlight the potential for recreational environments to promote incidental physical activity through environmental design and motivation, offering insight into how enjoyment, novelty, and goal-directed movement may contribute to higher daily activity levels. These “stealth interventions” can improve intrinsic motivation to engage in more physical activity by reframing the “burden” of exercise. 35
Strengths
There were numerous strengths that should be noted. First, a device-based measure of daily ambulatory physical activity was used, rather than self-report, which likely reduced potential recall bias and improved measurement precision. These repeated day-level observations allowed for a detailed analysis of within-person changes across baseline, off days, and varying levels of park exposure. The authors also used mixed-effects models which accounted for the nesting of multiple days within individuals and unequal numbers of observations across participants and activity contexts. This analytic approach maximized the use of available data while preserving statistical validity despite unbalanced designs. In addition, the intentional research design categorized parks and park days based on theoretically distinct activity contexts and exposure levels (baseline days at home, scheduled off day, single-park day, multiple-park day), allowing for interpretable comparisons that reflect increasing engagement between the participant and the built environment. This approach enhanced interpretability while avoiding unstable estimates associated with sparsely populated categories. This allowed for comparisons across a continuum of exposure to the recreational environment, rather than a simple binary comparison of travel vs non-travel days. By including both off days and varying levels of park engagement, the design allowed for more nuanced interpretation of how context and intensity of exposure influence daily physical activity.
Limitations
While steps/day were captured as a device-based measure of physical activity, participants were asked to provide these values from their own personal device, which was not standardized across all participants. While most participants used the same type of wearable physical activity monitor (e.g., Apple Watch, Garmin), potential differences between devices may be present. However, it is unlikely that this dramatically impacted the current results, as participants recorded their activity level with the same device across their entire trip. Moreover, the current study aimed to assess within-participant changes across daily park environments, not measurement precision per se. This was done intentionally to preserve ecological validity rather than suggest consumer-grade wearables and smartphones are “accurate,” which was beyond the scope of the current study. The total amount of time spent in each park was also not controlled. As a result, some participants may have entered the parks earlier in the mornings, stayed later in the evening, and moved from park to park during the day at various times. The inability to statistically control for device wear-time, or in this case, device “park-time” should be noted. In addition, the daily step counts observed in the current study do not capture when or why activity occurred (e.g., navigating through the parks, leisure walking, or transportation-related movement). Because of this limitation, it is not possible to identify which specific features of the environment or activities were most strongly associated with increased steps.
Furthermore, although the total number of day-level observations was substantial, the number of participants in the current study was modest, and observations were unevenly distributed across activity contexts. For example, despite hundreds of daily observations across various combinations of parks, only 4 participants spent their entire day inside Animal Kingdom, compared to 18 participants who spent their entire day inside the Magic Kingdom. WDW is a highly structured and walkable environment, which may not reflect typical urban or recreational settings. The observed increase in physical activity may therefore be specific to environments designed to promote prolonged walking and engagement, which may limit the ecological validity.
Perhaps one of the most important limitations to note is not related to the methodology or analytic approach used in the current study, but the translational significance. Visiting WDW or another theme park to achieve the recommended level of physical activity is not feasible for most individual adults, and is not a scalable practical public health strategy. However, the environmental characteristics that promoted higher levels of incidental physical activity within WDW can be applied to real-world contexts, informing community-level physical activity-friendly policies and design strategies. The WDW park environment itself is a highly walkable built environment characterized by numerous pedestrian-centered design features. These include short distance to the parks from on-property lodging, 36 multiple transportation modes to facilitate access,27,36 and the availability of different types of parks (i.e., Magic Kingdom vs EPCOT) or distinct areas within each park (i.e., Fantasyland vs Adventureland). 36 The park environment is also characterized by high destination accessibility, reflected by the street connectivity and concentration of interesting destinations in a geographic area. 34 Additional features include visually engaging environments,36,37 shaded rest areas,27,38 accessible restrooms,36,37 and available seating.27,36 Furthermore, walking surfaces are relatively flat, even, and paved,27,36,38 all of which contribute to a safe, well-maintained, and aesthetically pleasing36,37 environment designed to minimize perceived walking burden.
Many of these community design features have already been identified as key target areas for physical-activity friendly policies and public health initiatives. 39 However, while some design features have become increasingly more common, others have been met with resistance. For example, the “Complete Streets” initiative seeks to develop transportation systems that ensure safe and equitable access for all users, including pedestrians, bicyclists, motorists, and transit riders. Adoption of the Complete Streets policies improved from 50% to 67% in municipalities with ≥50 000 residents. However these improvements were not observed in smaller municipalities, rural areas, or in communities with lower socioeconomic status. 39 Managing the financial costs of these infrastructural changes, and resulting gentrification and residential displacement that may occur following these developments, remains a great concern and would require coordinated efforts from multiple stake-holders and community members. Nevertheless, these challenges should not discourage public health advocates from exploring creative ways to promote physical activity level in the greater community. Despite these limitations, the current findings illustrate how intentional environmental design can encourage substantial physical activity outside of structured exercise settings.
Conclusion
Participants accumulated significantly more daily physical activity during their WDW visit compared with baseline days at home. Physical activity differed across daily contexts, increasing from scheduled off days to single-park and multiple-park days, highlighting a graded association between activity levels and exposure to the park environment. These findings suggest that immersive, walkable built environments that combine destination density with motivational features may promote higher levels of incidental physical activity without requiring intentional exercise. Future research with larger samples is needed to confirm these findings and further investigate nuances in park visitors’ experiences, as well as their motives. The authors recommend public health policy groups consider the impacts of highly structured recreational environments on physical activity as a potential avenue for supporting community-based engagement in physical activity.
Footnotes
Author Contributions
Michael V. Fedewa: Conceptualization, Data Curation, Formal Analysis, Project Administration, Writing-Original Draft, Writing-Review and Editing. Cailin Kerch: Conceptualization, Data Curation, Project Administration, Writing-Original Draft. Madelyn Simmang: Writing-Original Draft, Writing-Review and Editing. Kate Grasso: Writing-Original Draft, Writing-Review and Editing. Elroy J. Aguiar: Formal Analysis, Writing-Original Draft, Writing-Review and Editing.
Funding
The authors received no financial support for the research, authorship, and/or publication of this article.
Declaration of Conflicting Interests
The authors declared no potential conflicts of interest with respect to the research, authorship, and/or publication of this article.