
Abstract
With the rapid advancement of the social economy and the rapid increase in the number of transportation vehicles, bridge health monitoring has become increasingly important. Using information technology to analyze data and identify damage to bridge structures can effectively ensure bridge safety, thereby avoiding traffic accidents. The current data analysis and damage identification methods have limitations, including poor real-time performance and low accuracy. An improved support vector machine algorithm is developed, in this study, for real-time monitoring data classification. Moreover, a bridge structure damage identification model is proposed based on improved support vector machine and data preprocessing. When compared and analyzed alongside other algorithms, it was found that the accuracy and precision of the improved support vector machine algorithm were 97.4% and 95.7% respectively, outperforming the other algorithms. Subsequently, a performance comparison analysis was conducted between the proposed recognition model and other models. Results denoted that the mean running time of the model was 38.1 s, outperforming the comparison models. The results demonstrated that the improved support vector machine algorithm and recognition model proposed in the study are effective and can help improve the analysis efficiency of bridge monitoring data and the accuracy of identifying bridge structural damage, providing a theoretical basis for bridge structural damage identification.
Introduction
As a key component of the transportation network, bridges are subjected to natural factors such as temperature changes and vehicle loads for a long time, leading to structural aging, material degradation, and surface cracking, which in turn affect their safety and traffic capacity. 1 Any damage or collapse of a bridge can seriously affect traffic and economy, and even threaten public safety, causing profound impacts on society. Therefore, identifying damage to bridge structures is particularly important. 2 Nevertheless, with the rising in the amount and types of bridge data samples, the current data analysis methods and damage identification methods have problems such as poor real-time performance and low accuracy. 3 Although many experts have conducted relevant research, the results are still unsatisfactory. For example, to address the limitations of methods for identifying damage to bridge rubber bearings and the lack of related research, the Huang M. team proposed a method combining prior knowledge of bearing damage localization with swordfish optimization. Experimental verification denoted that this method could effectively identify the severity of bearing damage, but the recognition accuracy was low. 4 At the same time, Daneshvar et al. proposed an optimized iterative regularization method to solve the issue of low accuracy caused by noise in current bridge structure damage identification (BSDI) methods. Numerical simulation experiments verified that the algorithm can successfully identify bridge damage, but it has not solved the problem of large amounts of bridge-related data and poor real-time recognition. 5 Effective research has been conducted. For example, Mousavi A A team proposed a structural health monitoring and damage detection method grounded on complete set empirical mode decomposition technology to address the low accuracy in bridge structural damage identification. Experimental verification showed that this method had robustness and higher sensitivity in damage identification and detection. 6 In the research field of BSDI systems based on hybrid optimization, combining meta-heuristic algorithms with machine learning models has become one of the mainstream paradigms for improving the accuracy of damage identification. For instance, Pham V T et al. proposed a hybrid model integrating Particle Swarm Optimization (PSO) and classification gradient enhancement algorithms for cable-stayed Bridges, verifying the effectiveness of this method in the inherent health monitoring system. 7 In the research field of BSDI based on deep learning, Corbally R and Malekjafarian A proposed a new driven deep learning framework for bridge condition monitoring to improve the accuracy of damage to bridge clamps and bearings. Experimental results show that this framework has good accuracy in terms of damage categories and degrees. 8
As the social economy rapidly develops, the number of cars and freight vehicles is increasing rapidly, and real-time analysis of bridge health data and damage identification is becoming increasingly important. Finding a method for rapid data analysis, improved accuracy, and real-time detection of bridge structures damage is critical to the safety of people and property. Support Vector Machines (SVM) have the advantages of strong generalization and avoidance of overfitting, and are broadly applied. 9 However, SVM has the problem of uncertain parameter selection, such as kernel function and penalty factor. PSO is a meta-heuristic optimization algorithm with the merits of strong global search capability and adaptability, which can better make up for the defects of the SVM algorithm. 10 Principal Component Analysis (PCA) is an unsupervised dimensionality reduction method, which has the advantages of being simple and easy to implement and reducing data dimensionality, and is widely used in the fields of data analysis and data compression. 11 Many experts have done related research. For example, Zheng Q’s team proposed a multi-feature recognition system for chatter detection combining PSO and SVM to solve the low chatter recognition accuracy of machine tools, and compared the performance of this system with other systems, and the results showed that the recognition accuracy of this system was higher than other systems. 12 As another example, for the problem of poor real-time sales prediction, Zhang et al. proposed a prediction model based on PCA and back-propagation neural network, which was experimentally verified to have good robustness. 13
The results indicate that there are currently few methods applied to the analysis of bridge health monitoring data, and there is still a problem of low accuracy in the identification of bridge structural damage. Therefore, the study combines PSO algorithm and SVM algorithm to construct an improved SVM algorithm. Moreover, Random Forest (RF) algorithm, PCA algorithm, and K-means algorithm are utilized to preprocess the bridge structure data. Finally, the improved SVM algorithm is applied to preprocessed data to construct a BSDI model that combines PCA and SVM. The research aims to raise the real-time and accuracy of BSDI.
The innovation of this research lies in the combination of PSO algorithm and SVM, optimizing the key parameters of SVM, and conducting multi-algorithm collaborative preprocessing of bridge structure data through RF, PCA, and K-means. A BSDI model combining PCA and SVM is constructed. This method not only enhances the accuracy of damage identification and the generalization ability of the model, but also strengthens the real-time monitoring capability. The contribution of the research lies in providing a new means of bridge health monitoring. Through experimental verification and performance comparison, the proposed method outperforms existing technologies, providing a new theoretical and practical basis for the development of the field of BSDI.
The contribution of this research lies in the significant improvement of the efficiency and reliability of damage identification by developing a new type of bridge health monitoring technology. This technology utilizes advanced data processing and machine learning algorithms to analyze bridge structure data, achieving rapid and accurate detection of damage. In addition, the research has provided a set of practical tools and methods for the field of bridge monitoring, which can be directly applied to actual bridge maintenance work, enhancing the practicality and operability of the monitoring system and providing a strong guarantee for the safe operation and long-term health of bridges.
Methods and materials
Construction of improved SVM algorithm for real-time monitoring data classification
In recent years, placing sensors on bridges and using machine learning algorithms for health monitoring have been widely applied.
14
However, due to the increase in the amount and types of bridge data samples, the current data analysis methods and BSDI methods have problems such as poor real-time performance and low accuracy.
15
SVM has the merits of strong generalization ability and avoiding overfitting, and is broadly utilized in fields such as image recognition and text recognition. Finding an optimal segmentation hyperplane that maximizes the distance between different categories is the goal of SVM.
16
The schematic diagram of the hyperplane is denoted in Figure 1. Schematic diagram of the optimal hyperplane for SVM.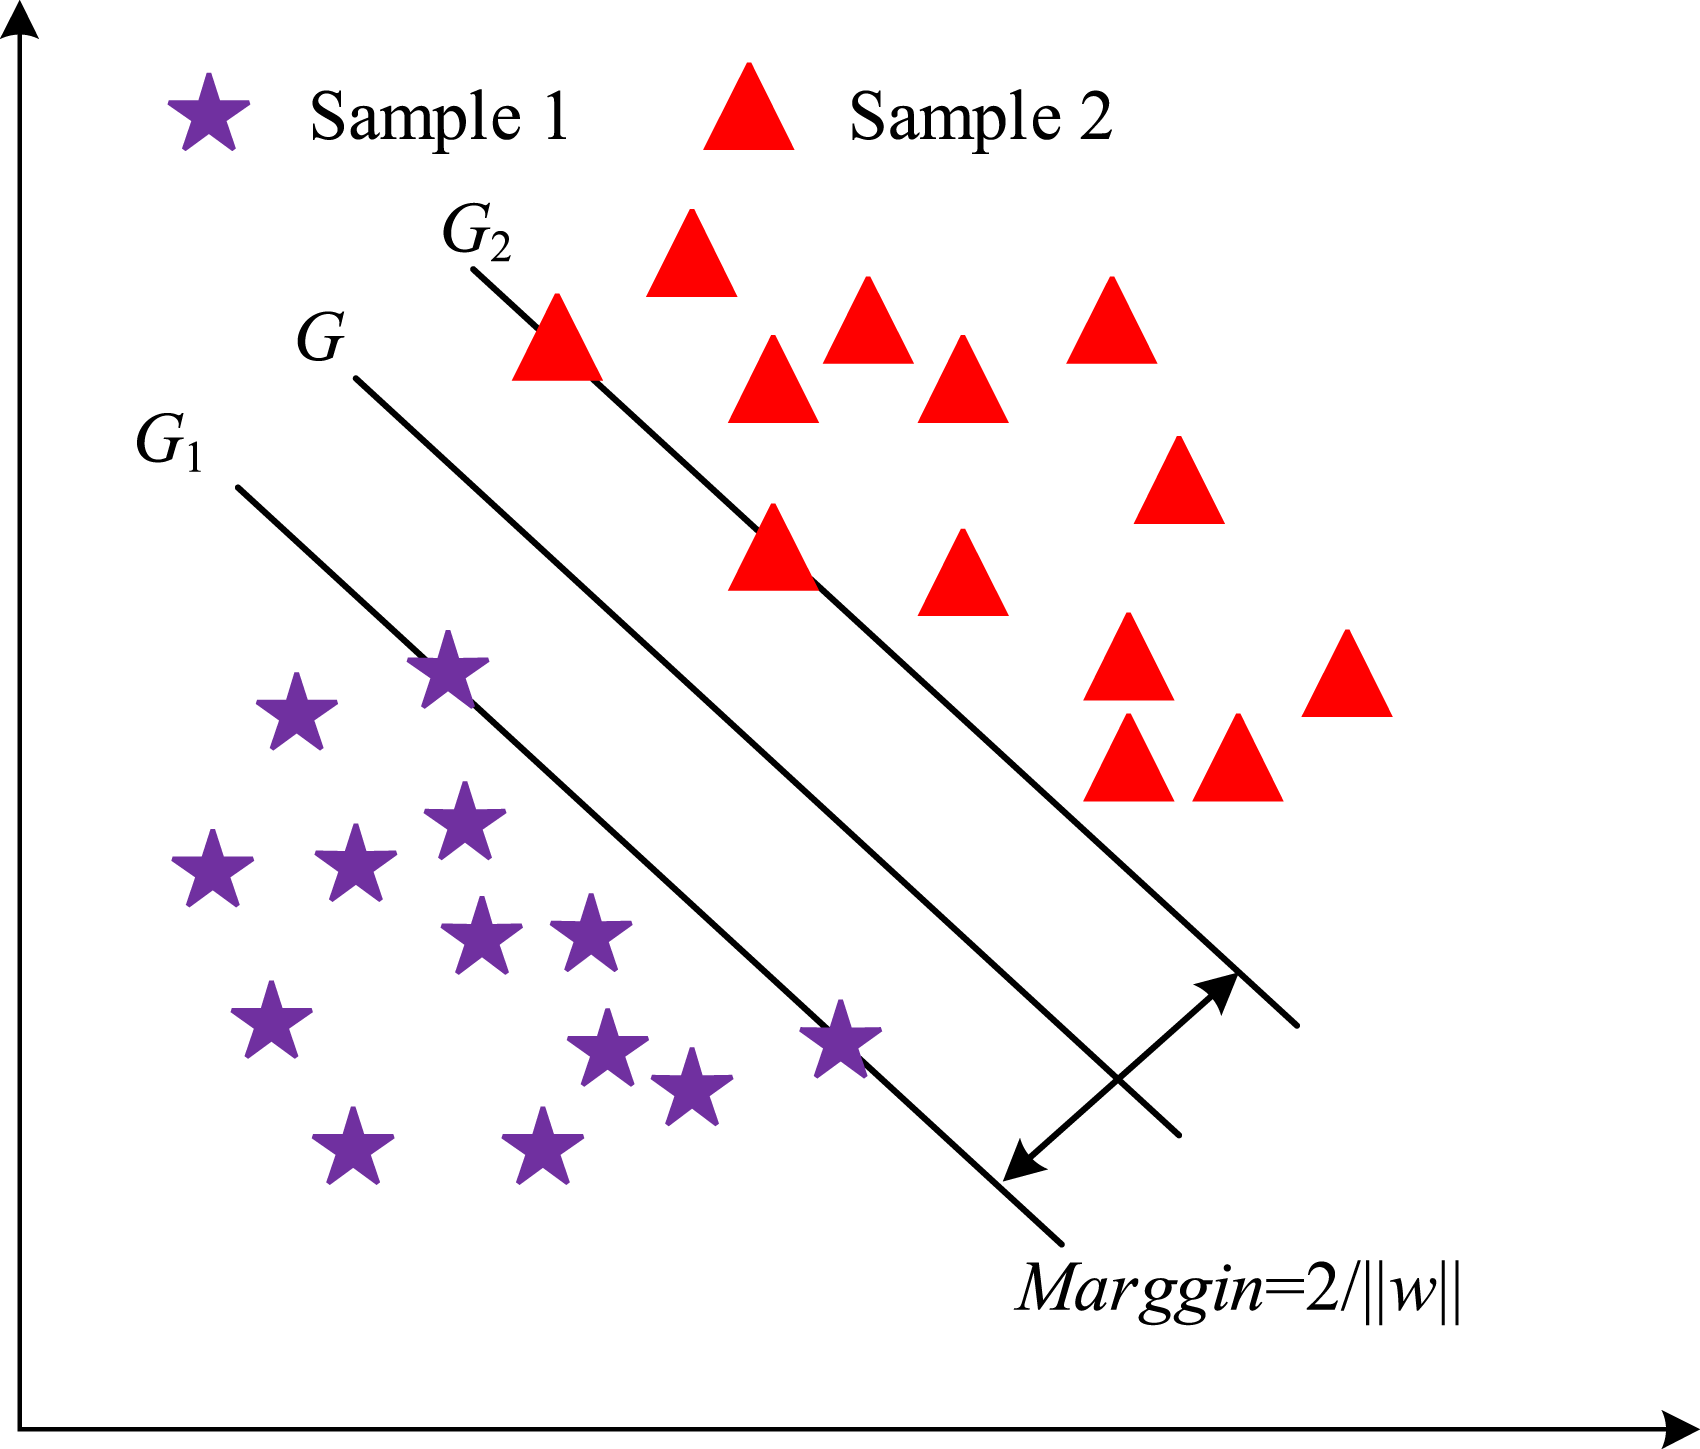
In Figure 1,

However, SVM has the problem of uncertain parameter selection, such as kernel function and penalty factor. These parameters determine the complexity and width of the SVM decision boundary, and the choice of parameters determines the performance of the SVM model. To assist SVM in selecting optimal parameters, the PSO algorithm is studied to improve it. The PSO flow is denoted in Figure 2
17
PSO algorithm flow.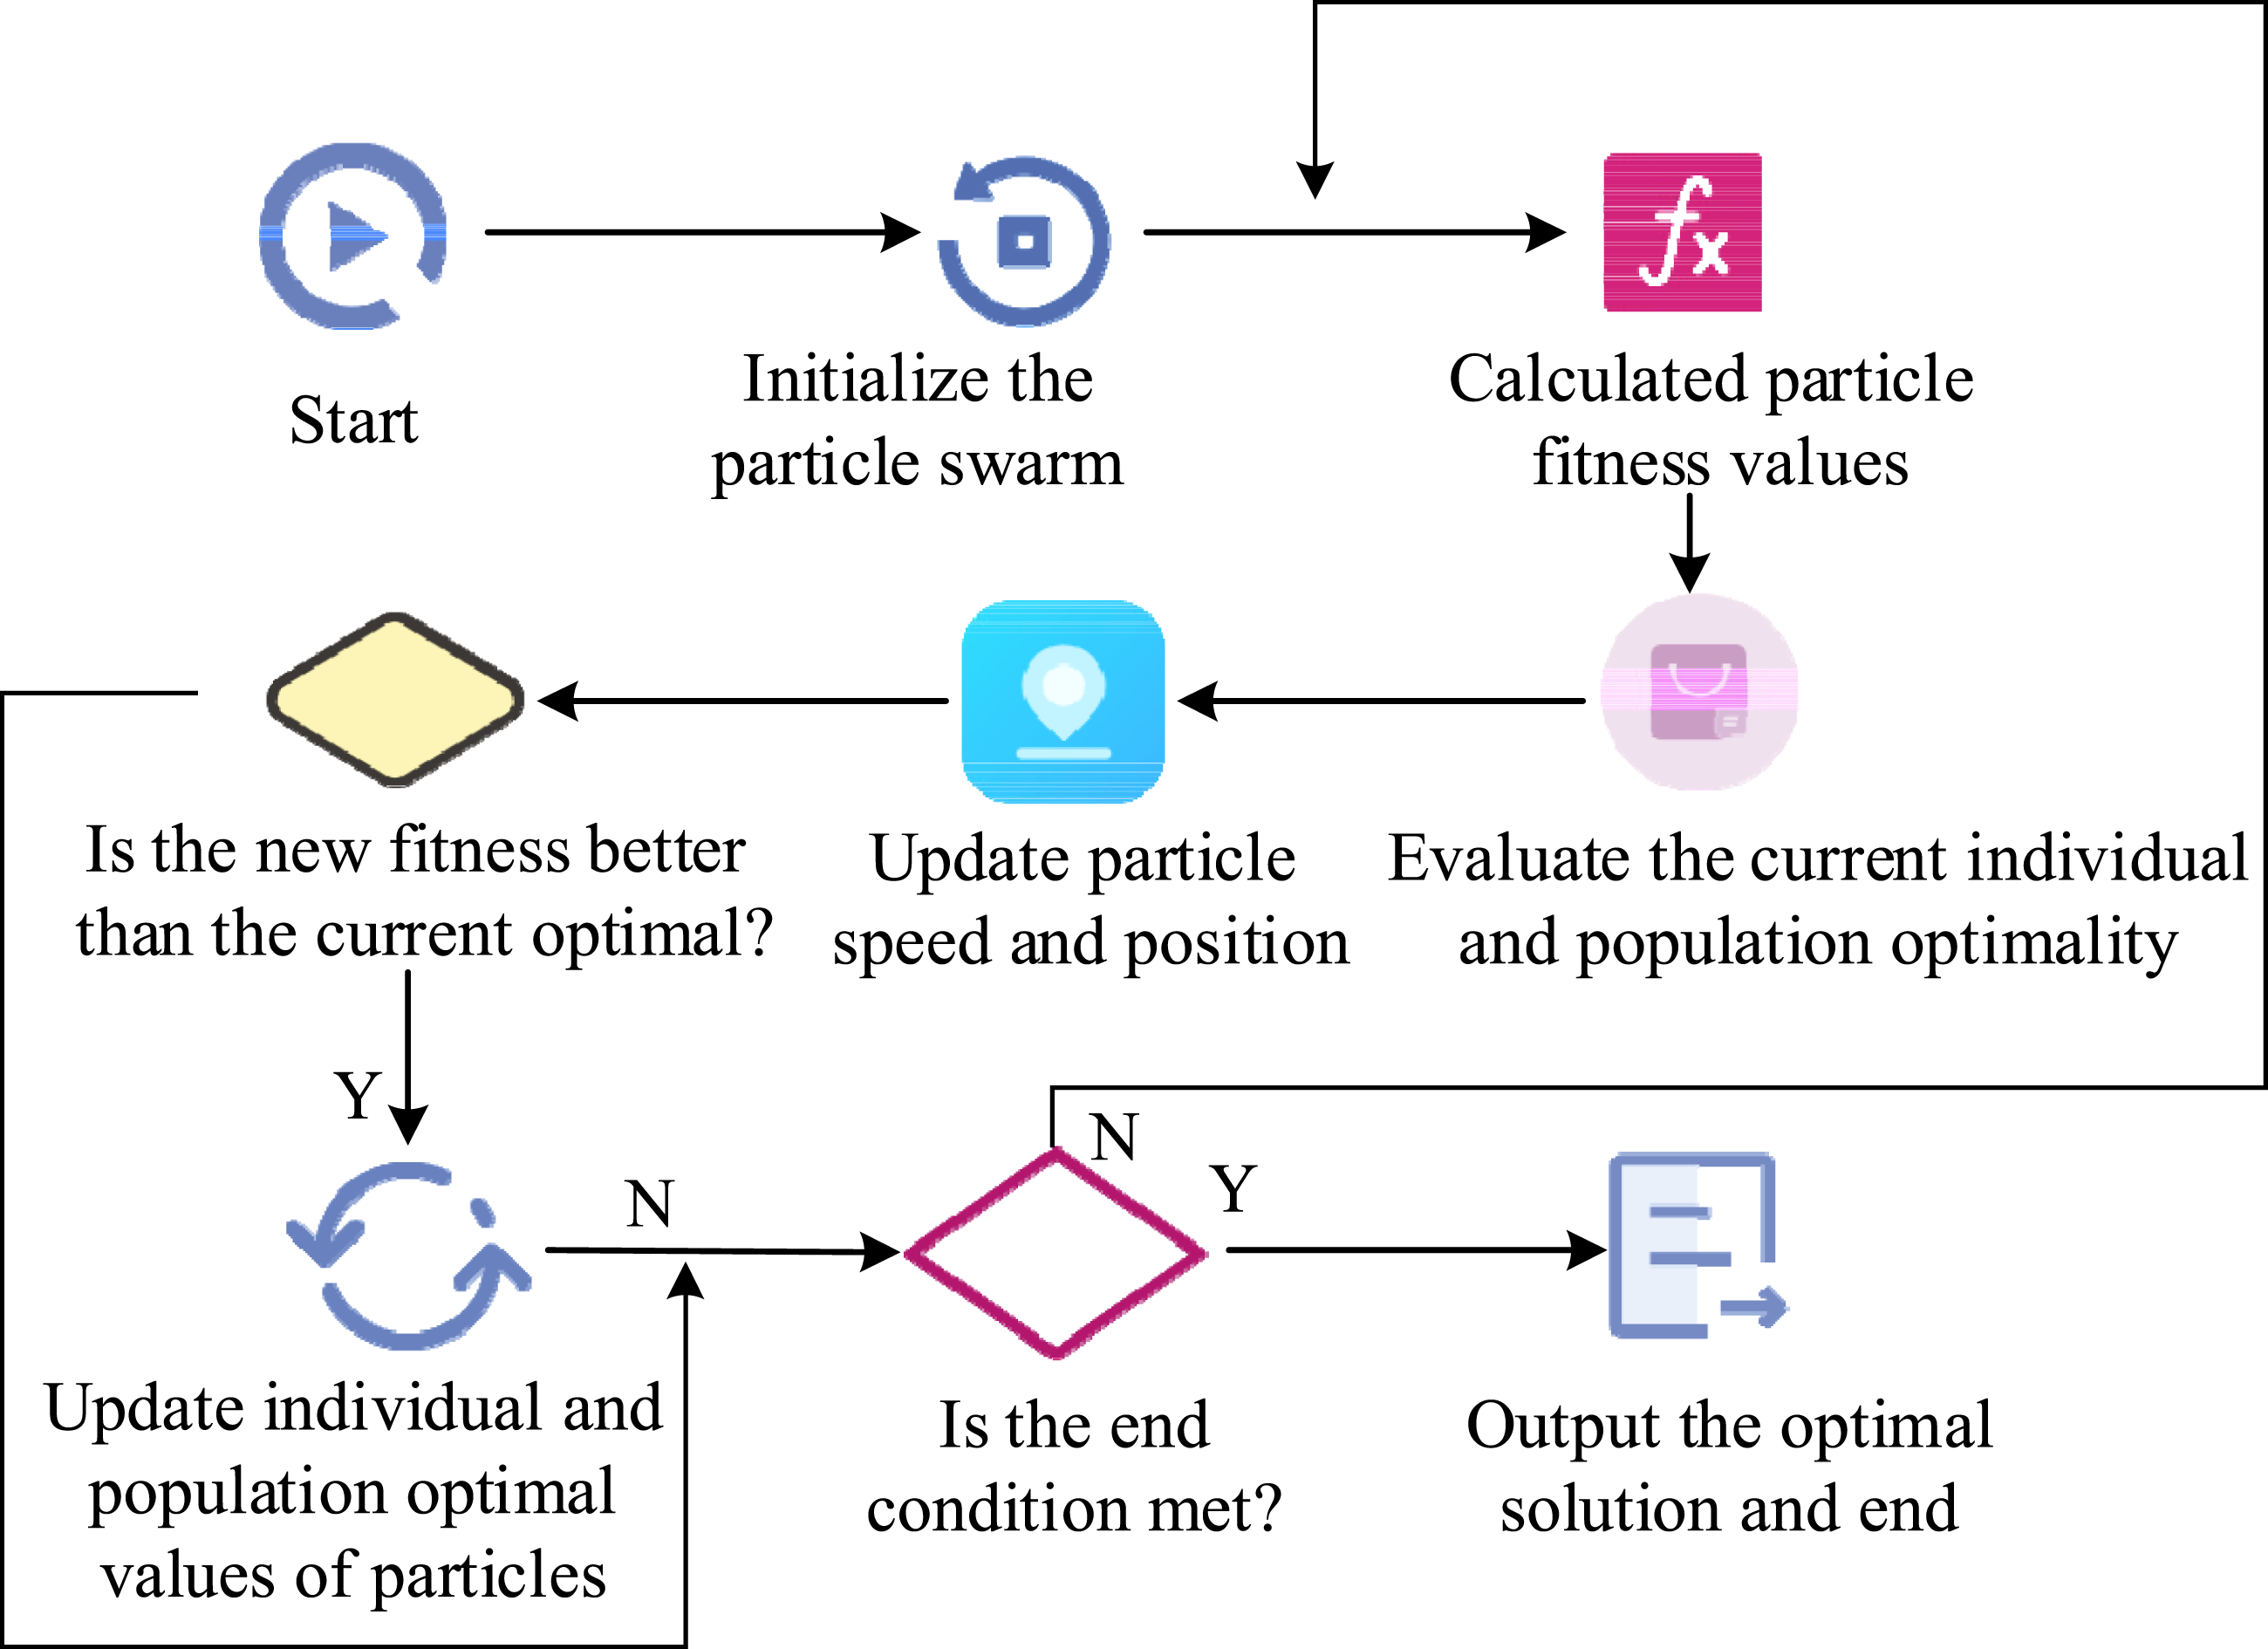
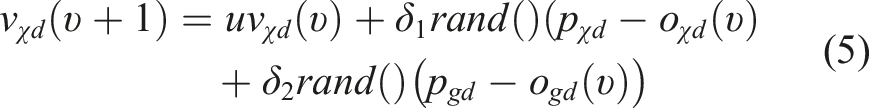
From Figure 2, the PSO algorithm process first initializes parameters such as the number of particle swarm, initial velocity, and position. Secondly, each particle’s fitness value in the particle swarm is calculated. At the same time, the best position of each particle, that is, the individual Optimal Position (OP) and the best position of the entire population of particles, that is, the global OS, are recorded. The latest particle population is generated by adjusting the velocity and position of all particles. The calculation expression for updating particle velocity is shown in formula (5). Flow of improved SVM algorithm.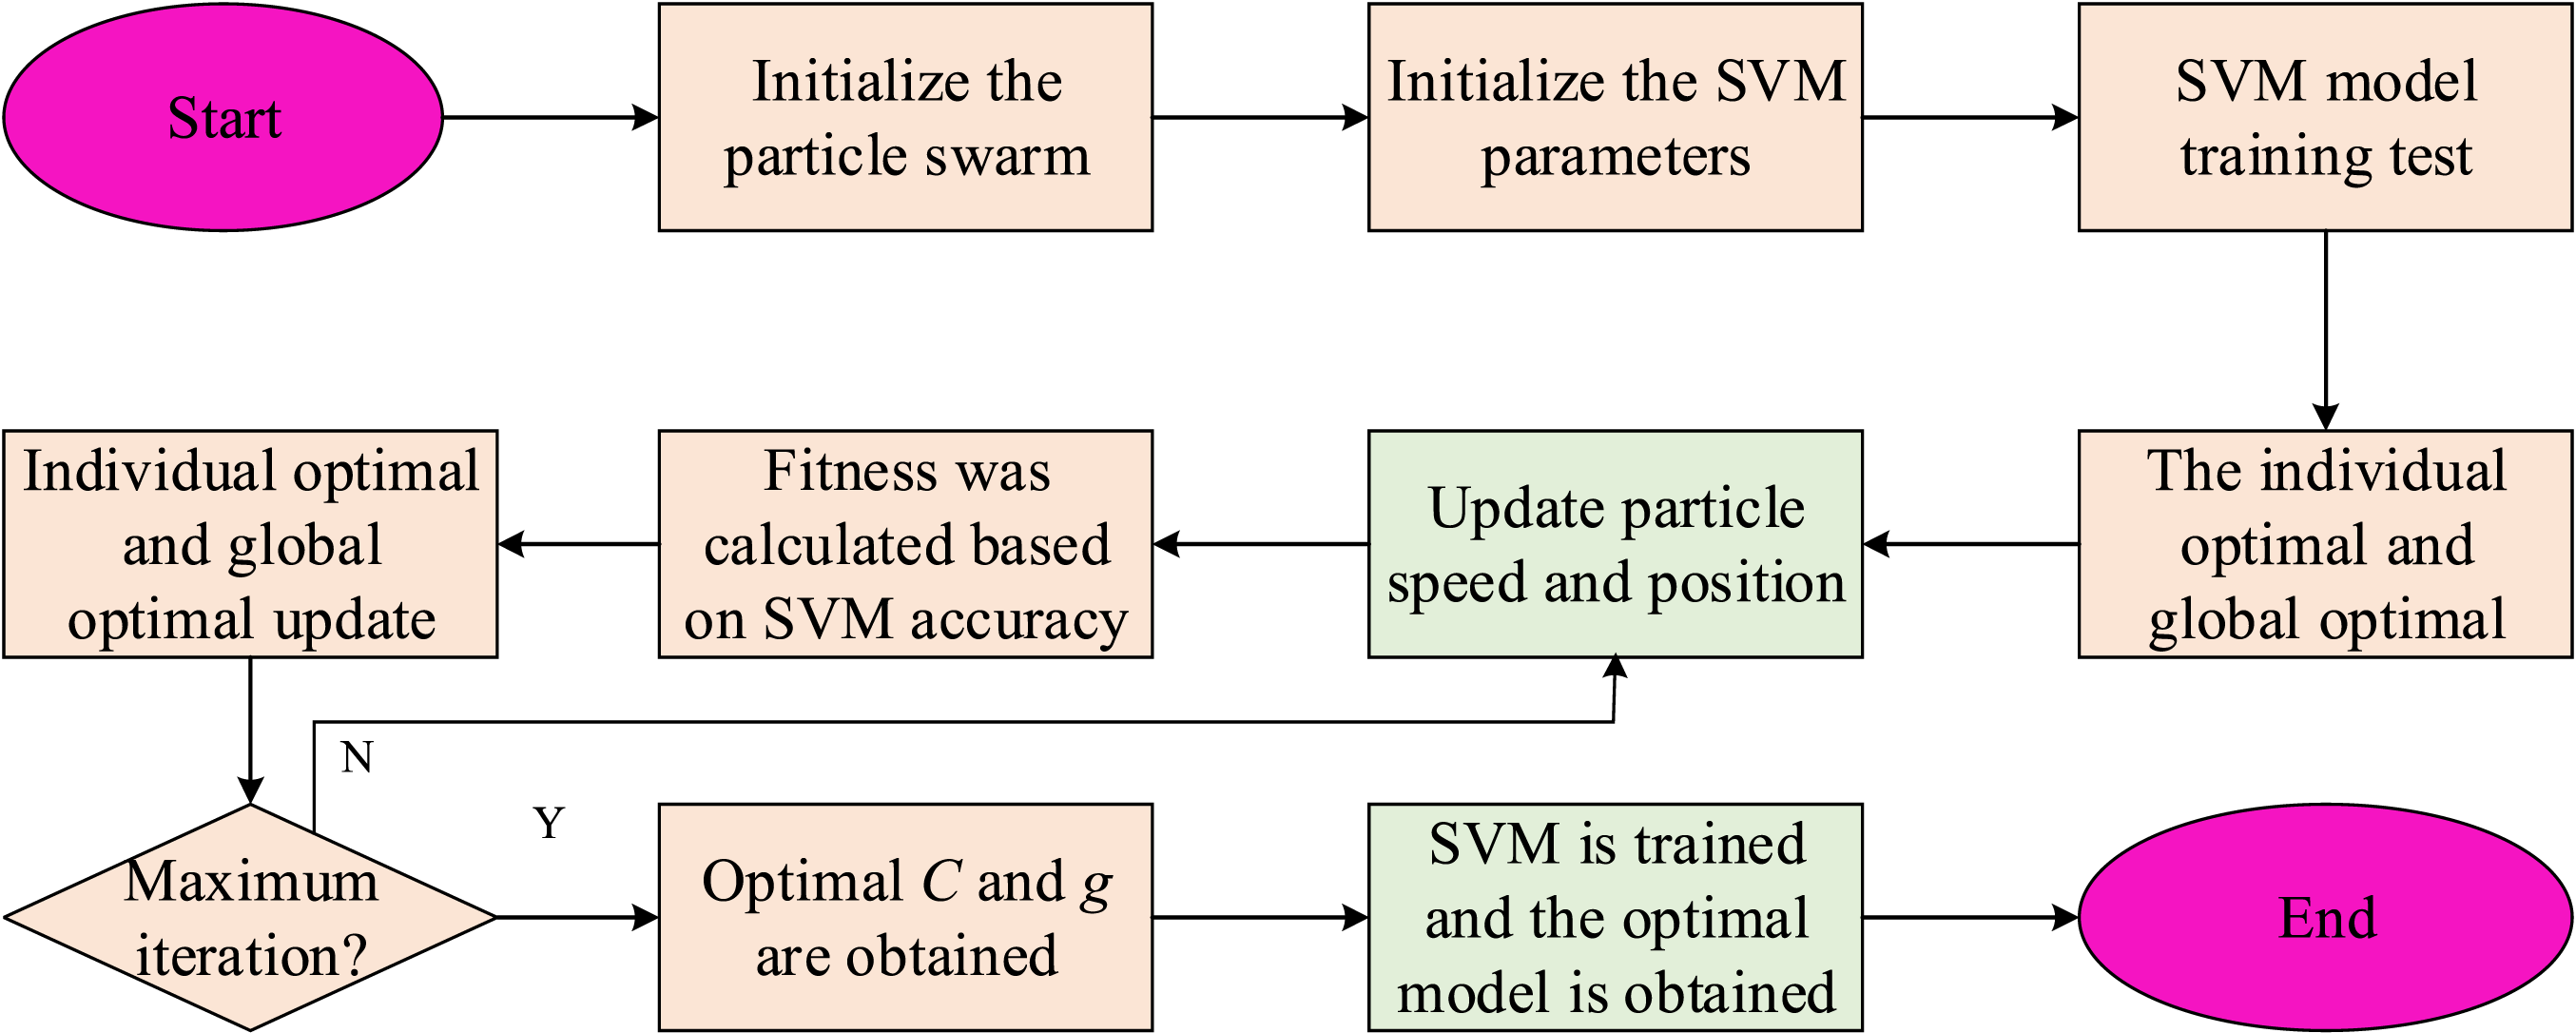

In Figure 3,
Design of bridge structural damage identification model grounded on improved SVM and data preprocessing
Although the improved SVM algorithm can achieve the identification of bridge structural damage, there are still problems such as high noise, inconsistent dimensions, and excessive data volume in the bridge monitoring process. Finding an effective method to process data is greatly significant for improving the efficiency of bridge monitoring. In view of this, the study begins by dividing the bridge data collected through linear acceleration and gravitational acceleration into two datasets. Time series are used as an index of the data samples, and duplicate values in both data sets are removed, retaining only the last duplicate value. Secondly, the RF algorithm is used to fill in the missing values in the data. RF is an ensemble learning algorithm that has advantages such as feature importance assessment and strong robustness, and is widely utilized in natural language processing and image recognition. The process of filling missing values in the RF algorithm is to construct multiple decision tree models to predict and fill missing values in the dataset, with each model using the remaining features to predict the values of missing features.
18
Next, the PCA algorithm is utilized to minimize the dimensionality of the data. The PAC algorithm process is shown in Figure 4. PAC algorithm flow.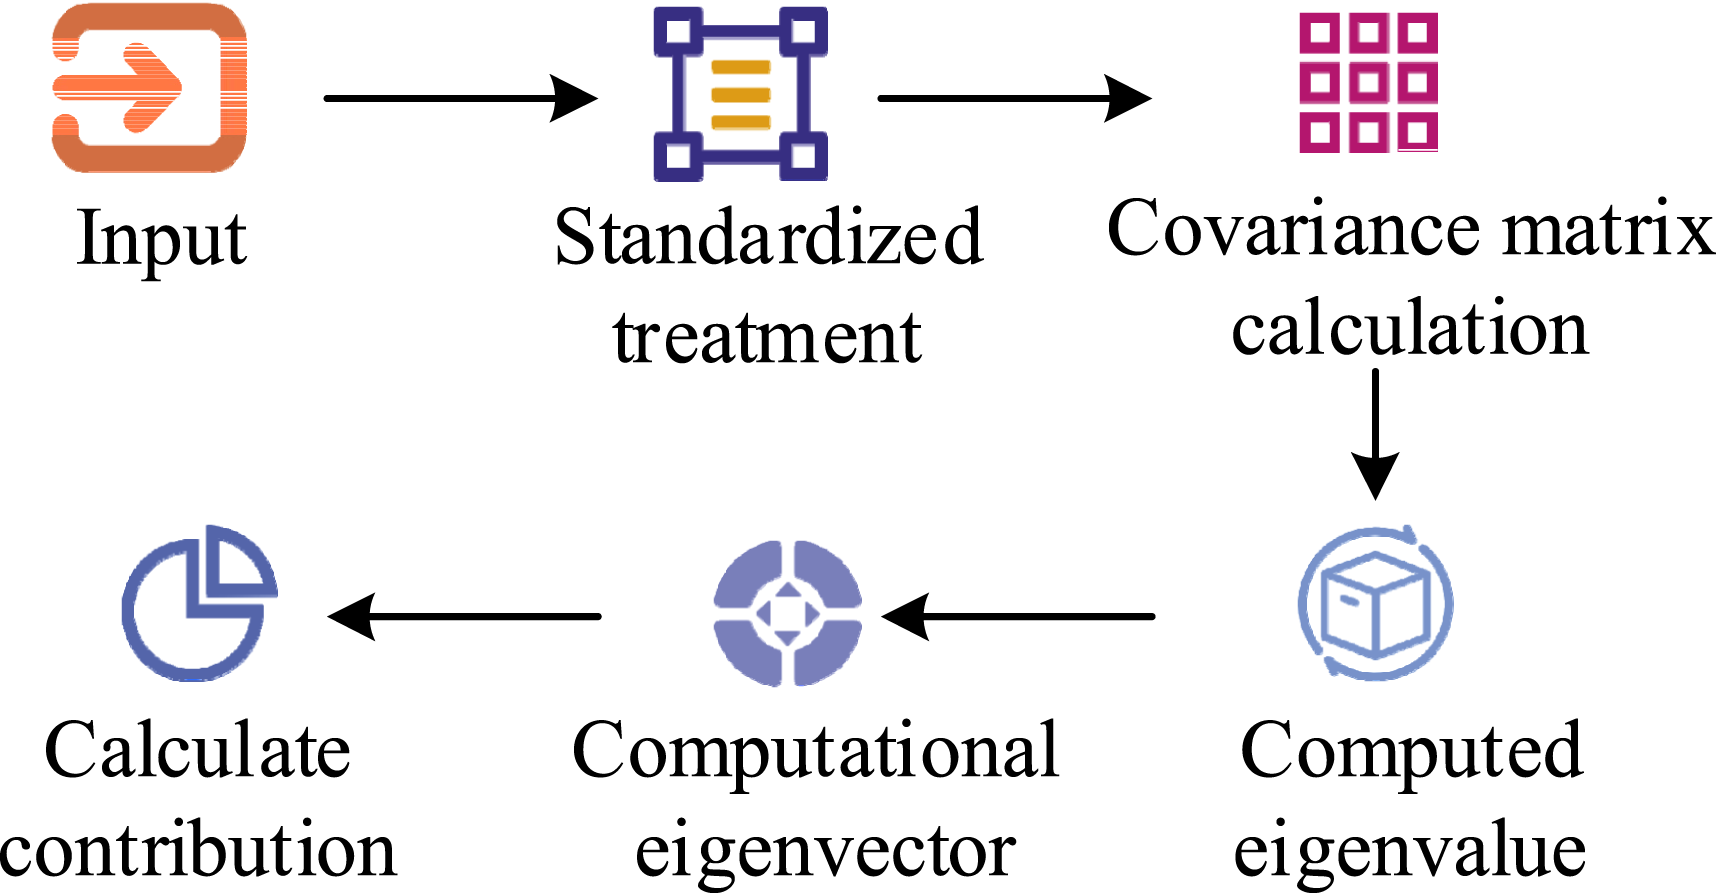
From Figure 4, the process of the PCA algorithm first assumes that there are Data on the horizontal, vertical, and vertical axes of the relationship between the linear acceleration and acceleration of gravity.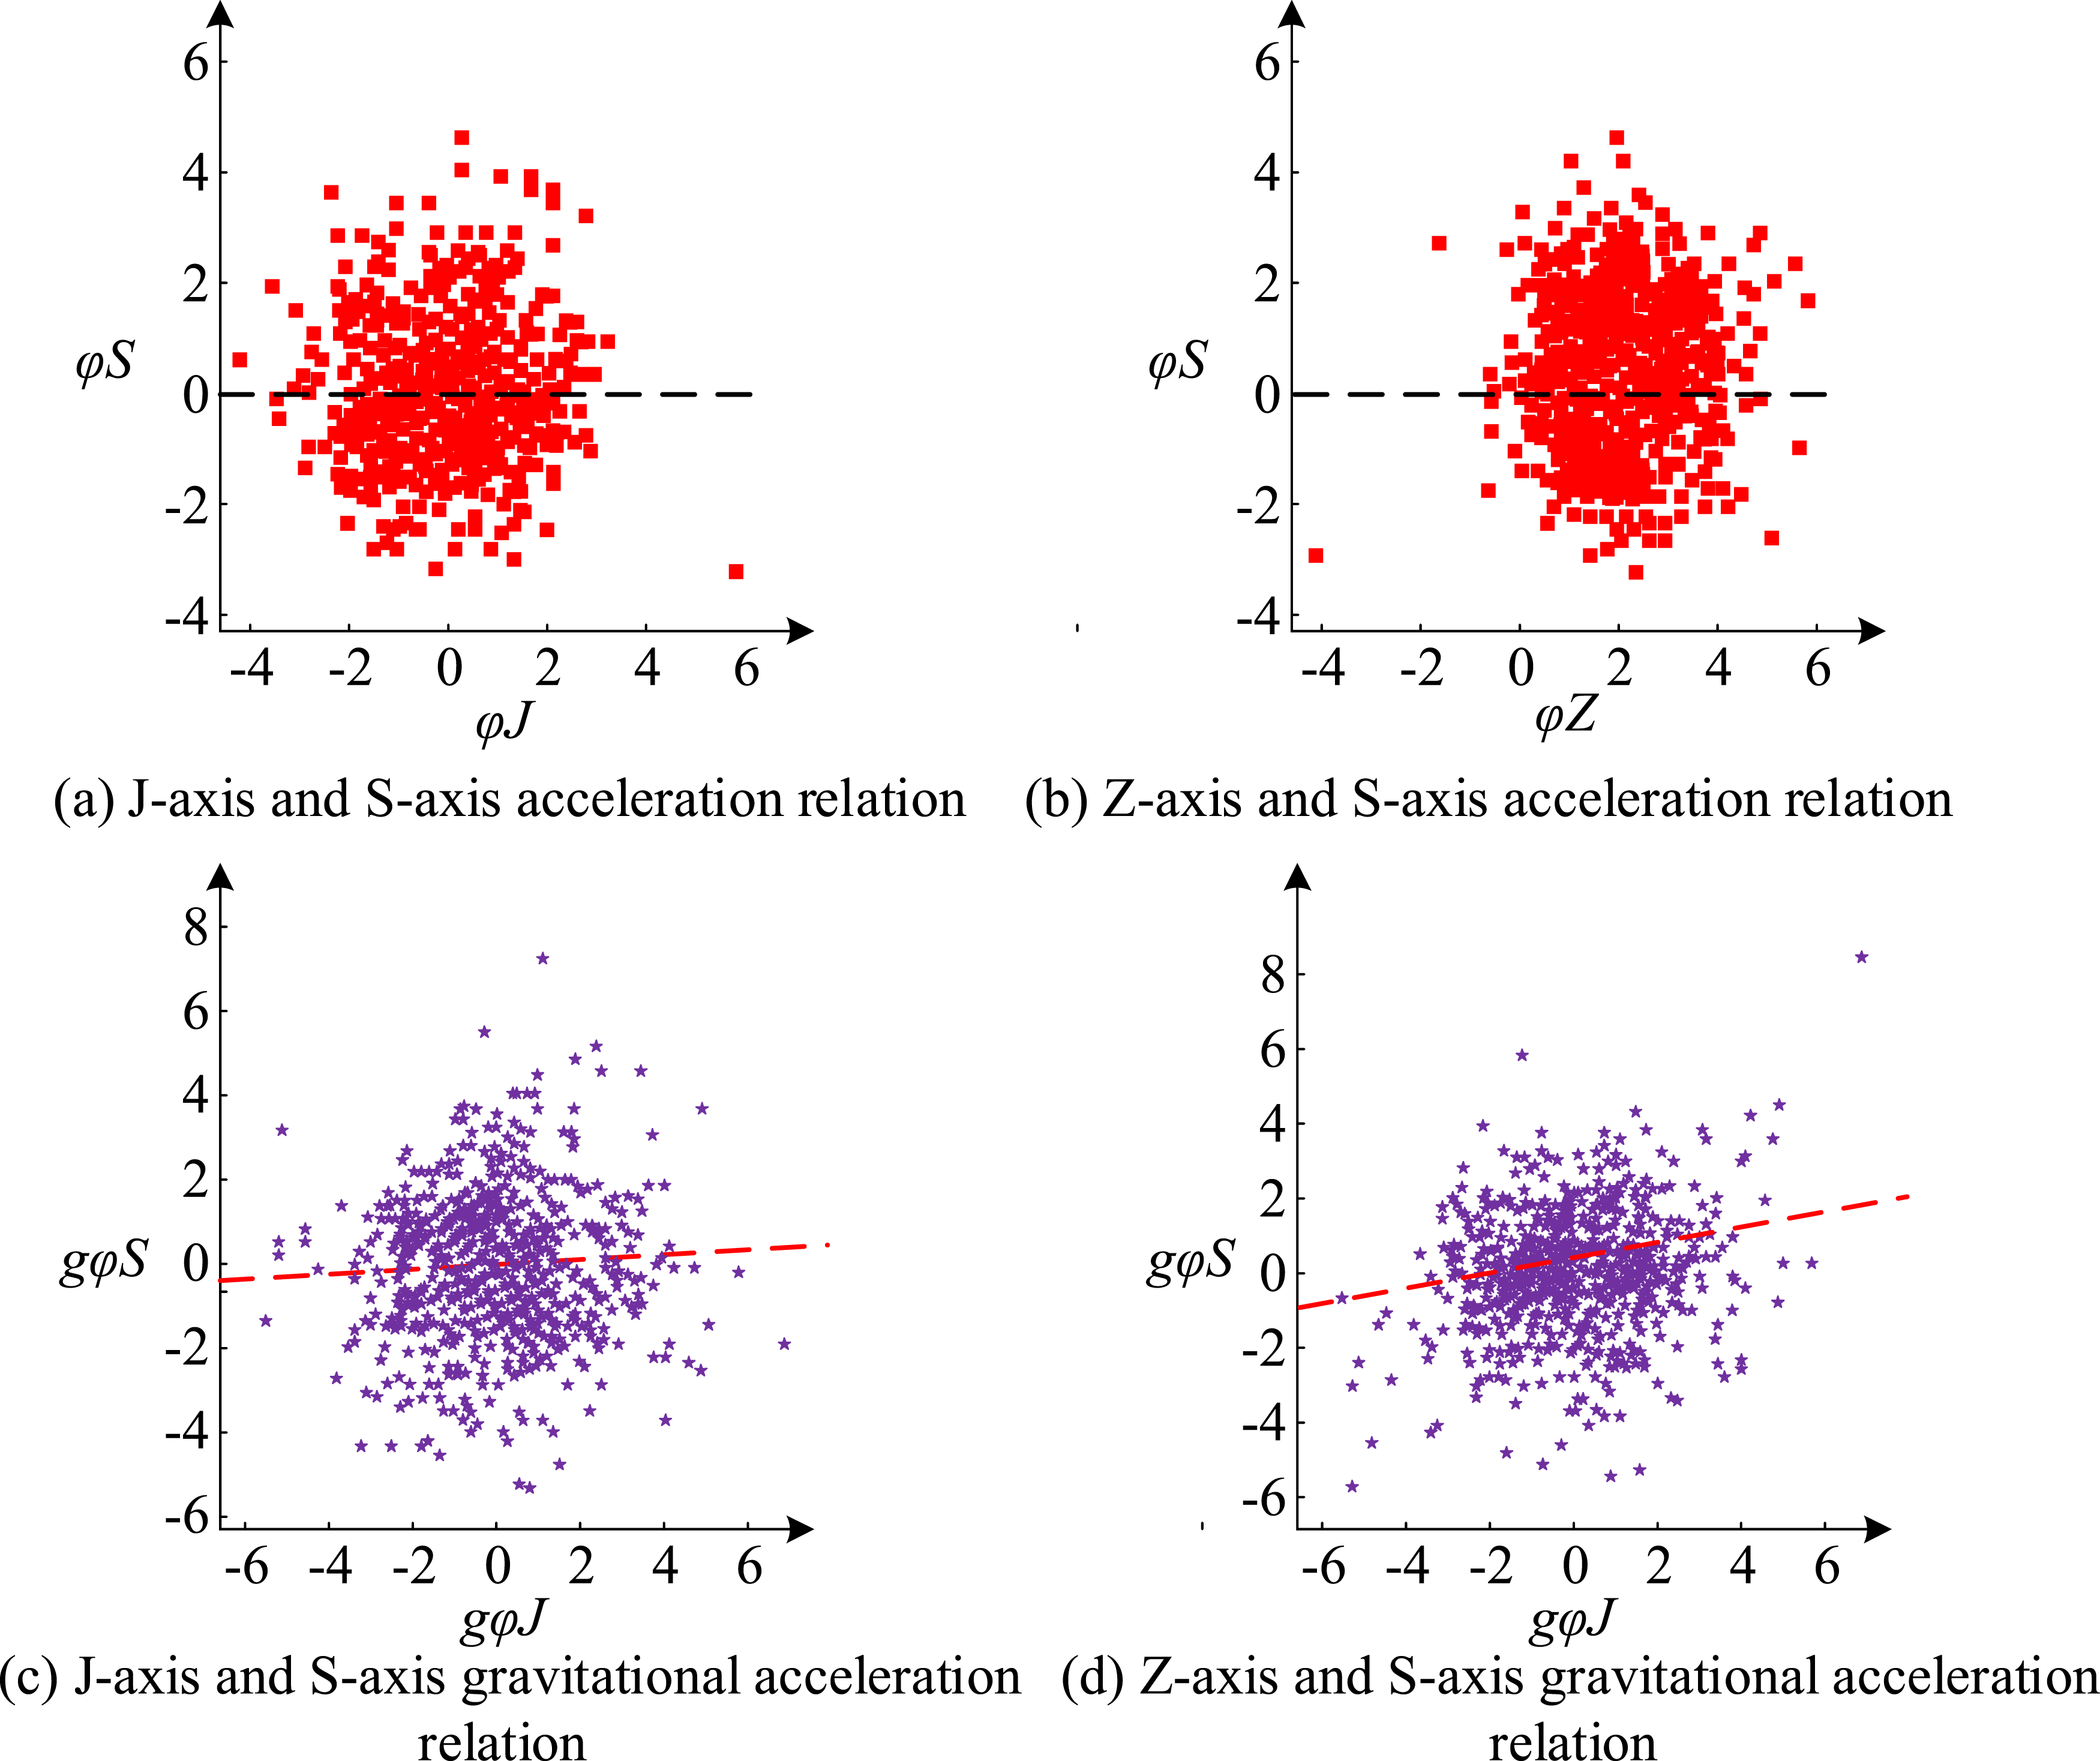


In Figure 5, Bridge structural damage identification model grounded on improved SVM and data preprocessing.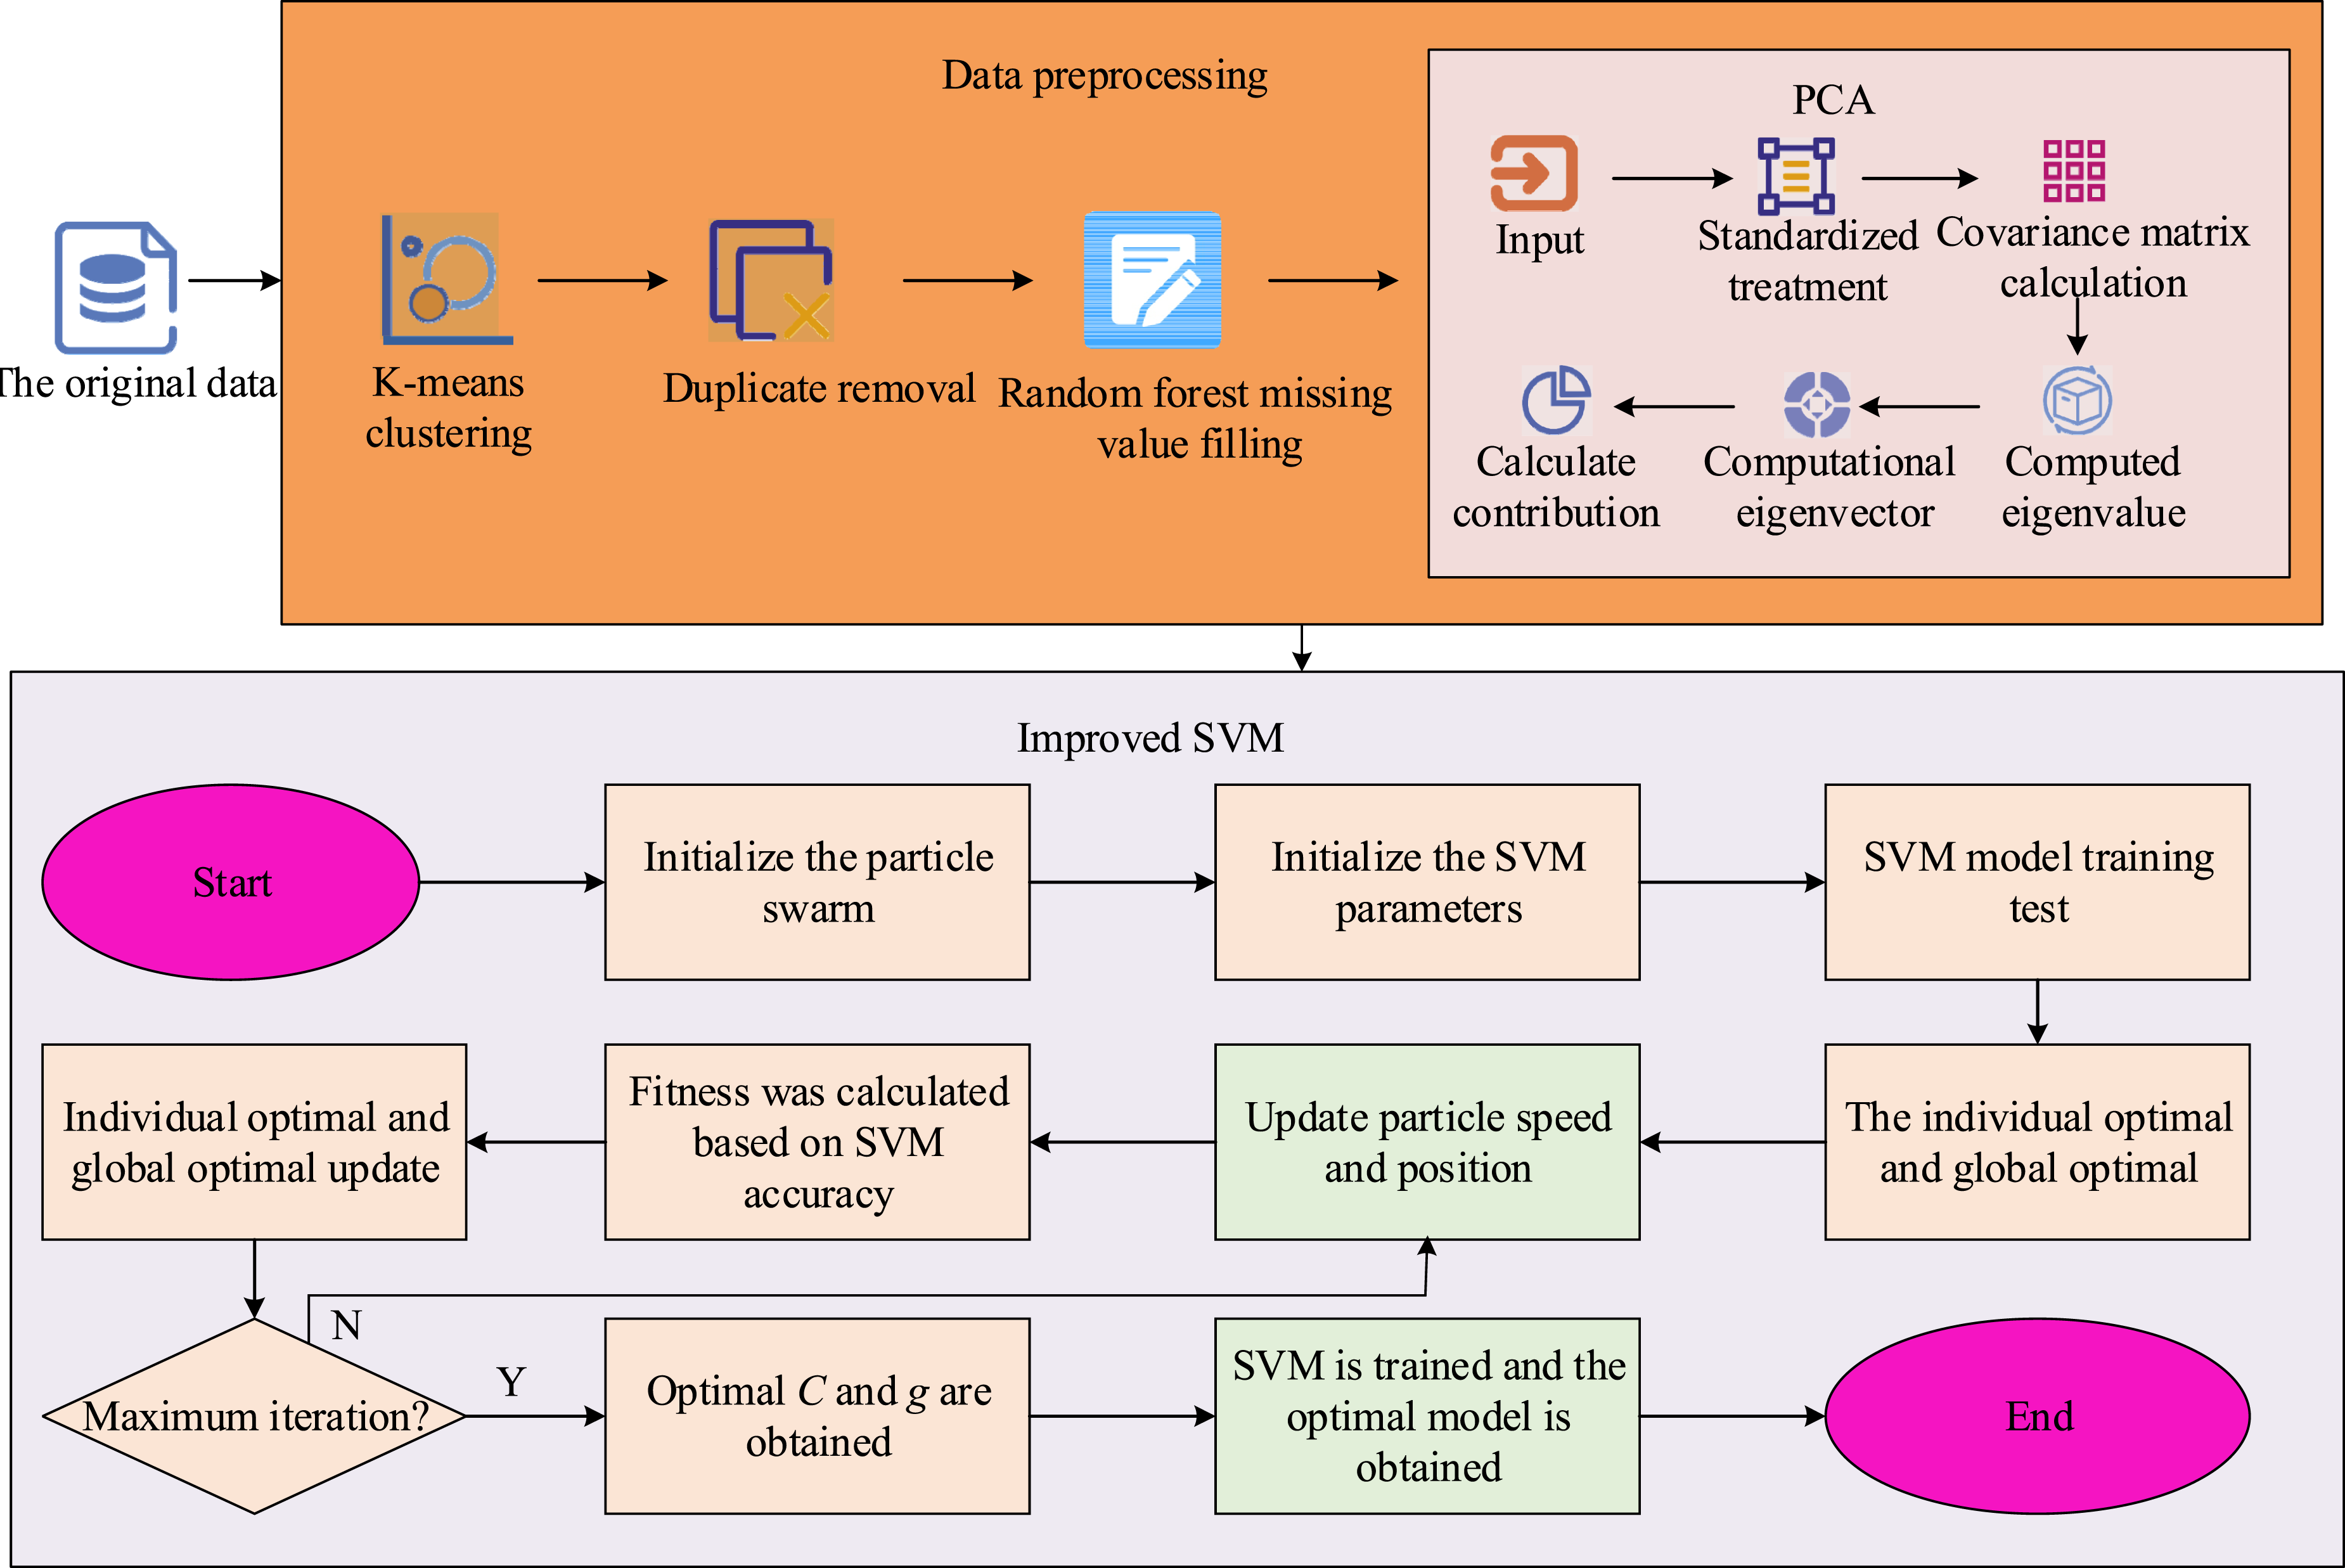
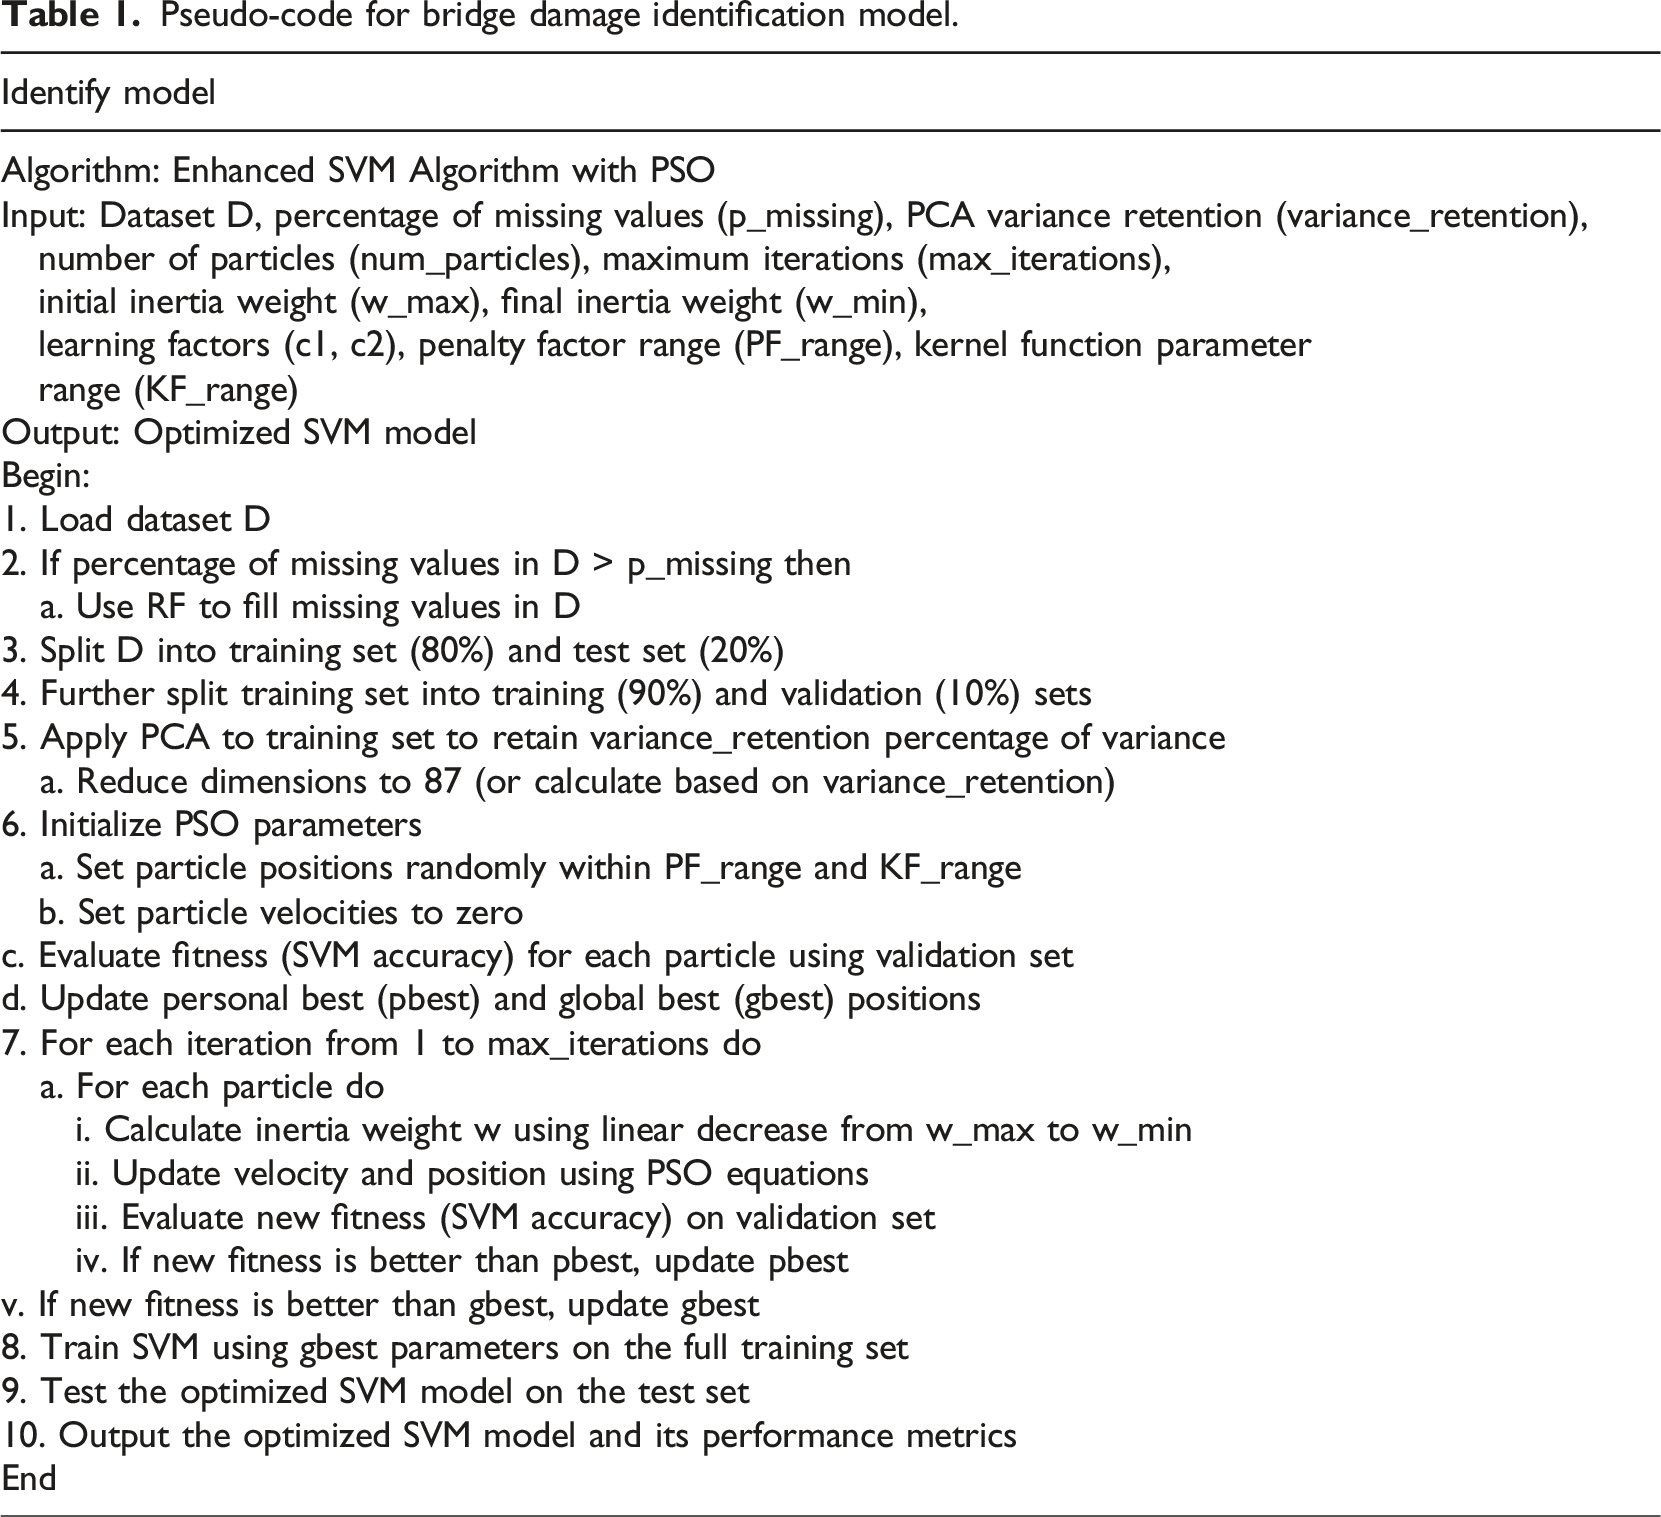
Pseudo-code for bridge damage identification model.
Results
Performance analysis of algorithms
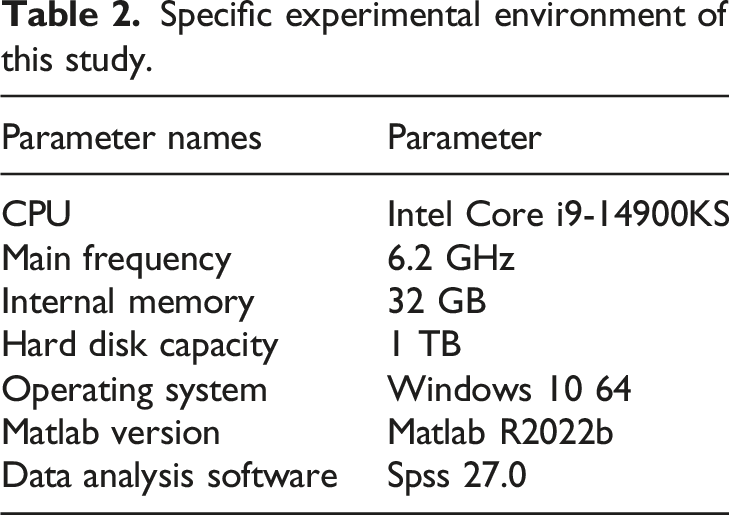
Specific experimental environment of this study.
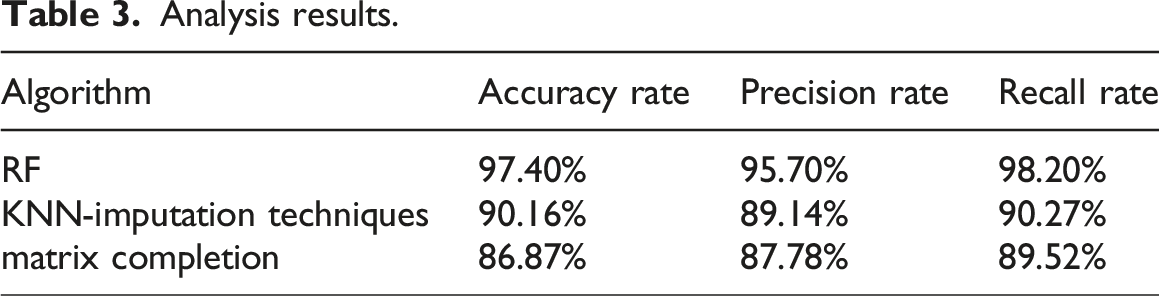
Analysis results.
Results of K value test.
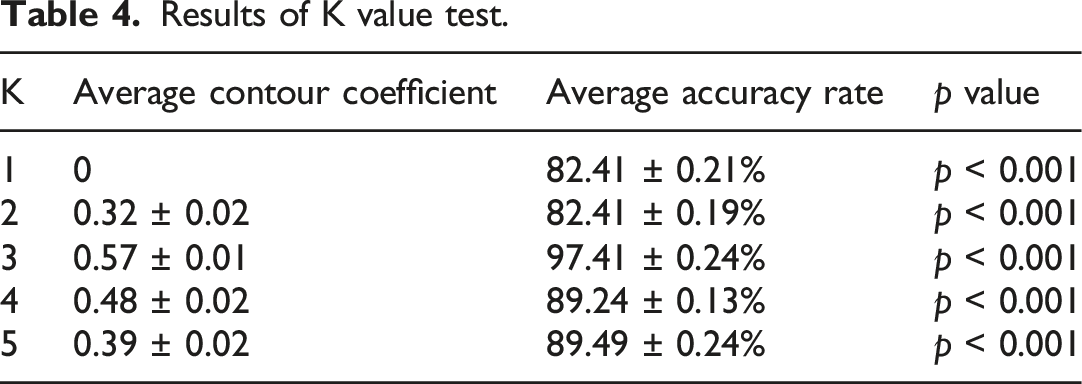
From Table 4, the p values in this process were all less than 0.001, indicating that the statistical results are statistically reliable. Furthermore, as the value of K increased, the average contour coefficient value grew from 0 to 0.57 ± 0.01, at which point the K value was the maximum. However, when the K value increased to 5, the average contour coefficient value decreased by 0.39 ± 0.02. Meanwhile, when the K value increased from 0 to 3, the average accuracy rate changed from 82.41 ± 0.21% to 97.41 ± 0.24%. When the value of K ranged from 3 to 5, the value of average accuracy rate gradually decreased. It indicated that when the value of K was 3, the performance of the K-means algorithm reached the optimum. In the above environment, the accuracy and precision comparison experiments were first carried out on each method, and the accuracy and precision findings are denoted in Figure 7. The accuracy and precision of each algorithm.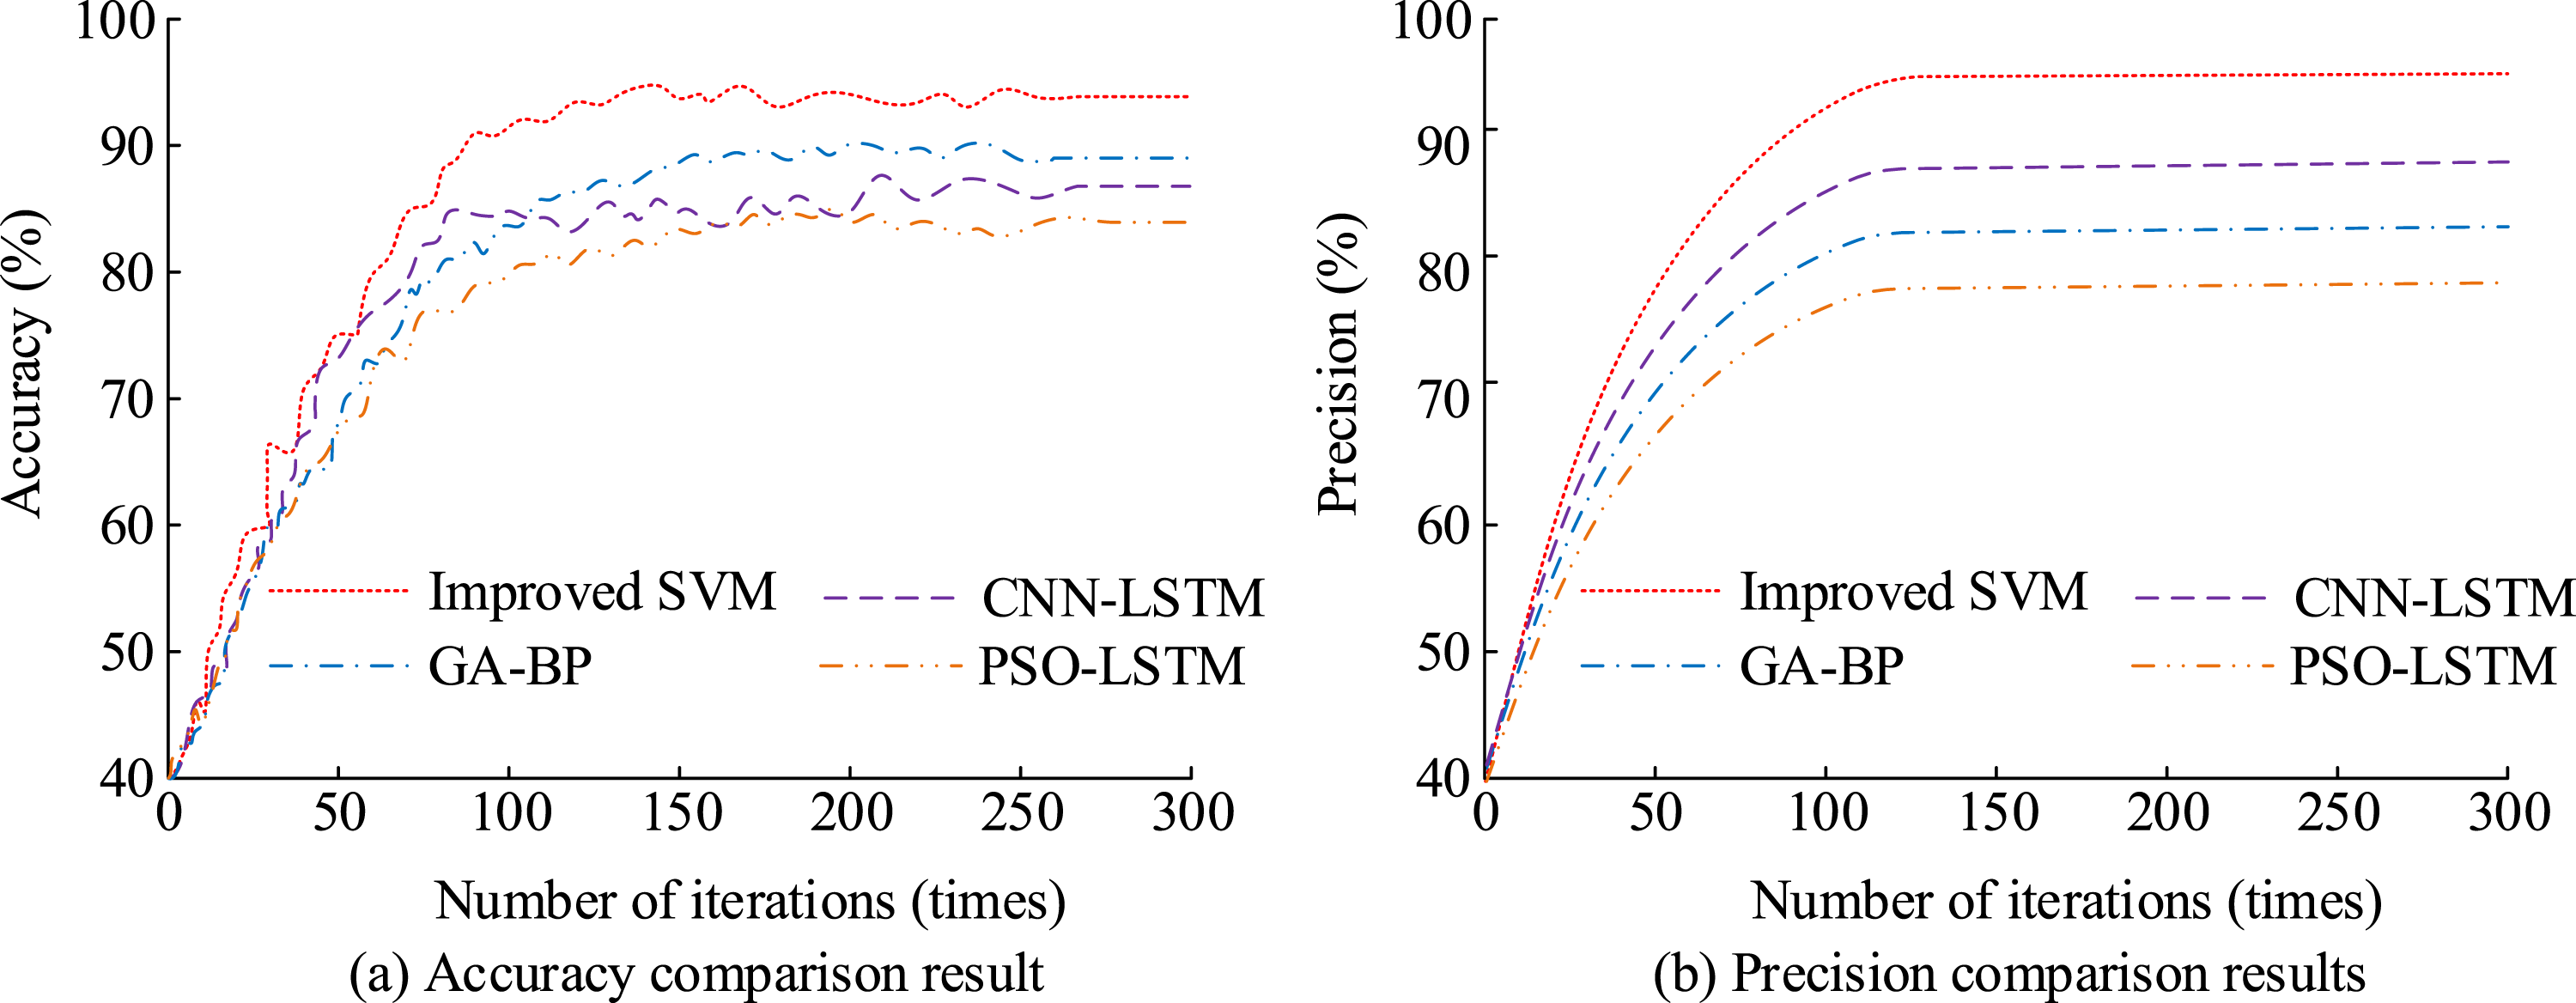
From Figure 7(a), the accuracy of the improved SVM, CNN-LSTM, GA-BP, and PSO-LSTM algorithms was 97.4%, 87.1%, 89.2%, and 83.8%, respectively, with the improved SVM algorithm having the highest accuracy. According to Figure 7(b), the improved SVM algorithm had a precision of 95.7%, which was higher than the CNN-LSTM algorithm’s 88.2%, GA-BP algorithm’s 81.3%, and PSO-LSTM algorithm’s 78.9%. The results denoted that the improved SVM algorithm had better performance in terms of accuracy and precision compared to the comparison algorithms. The findings of the recall and F1 score comparison between the improved SVM algorithm and the other algorithms are shown in Figure 8. Comparison results of recall rate and F1 score of each algorithm.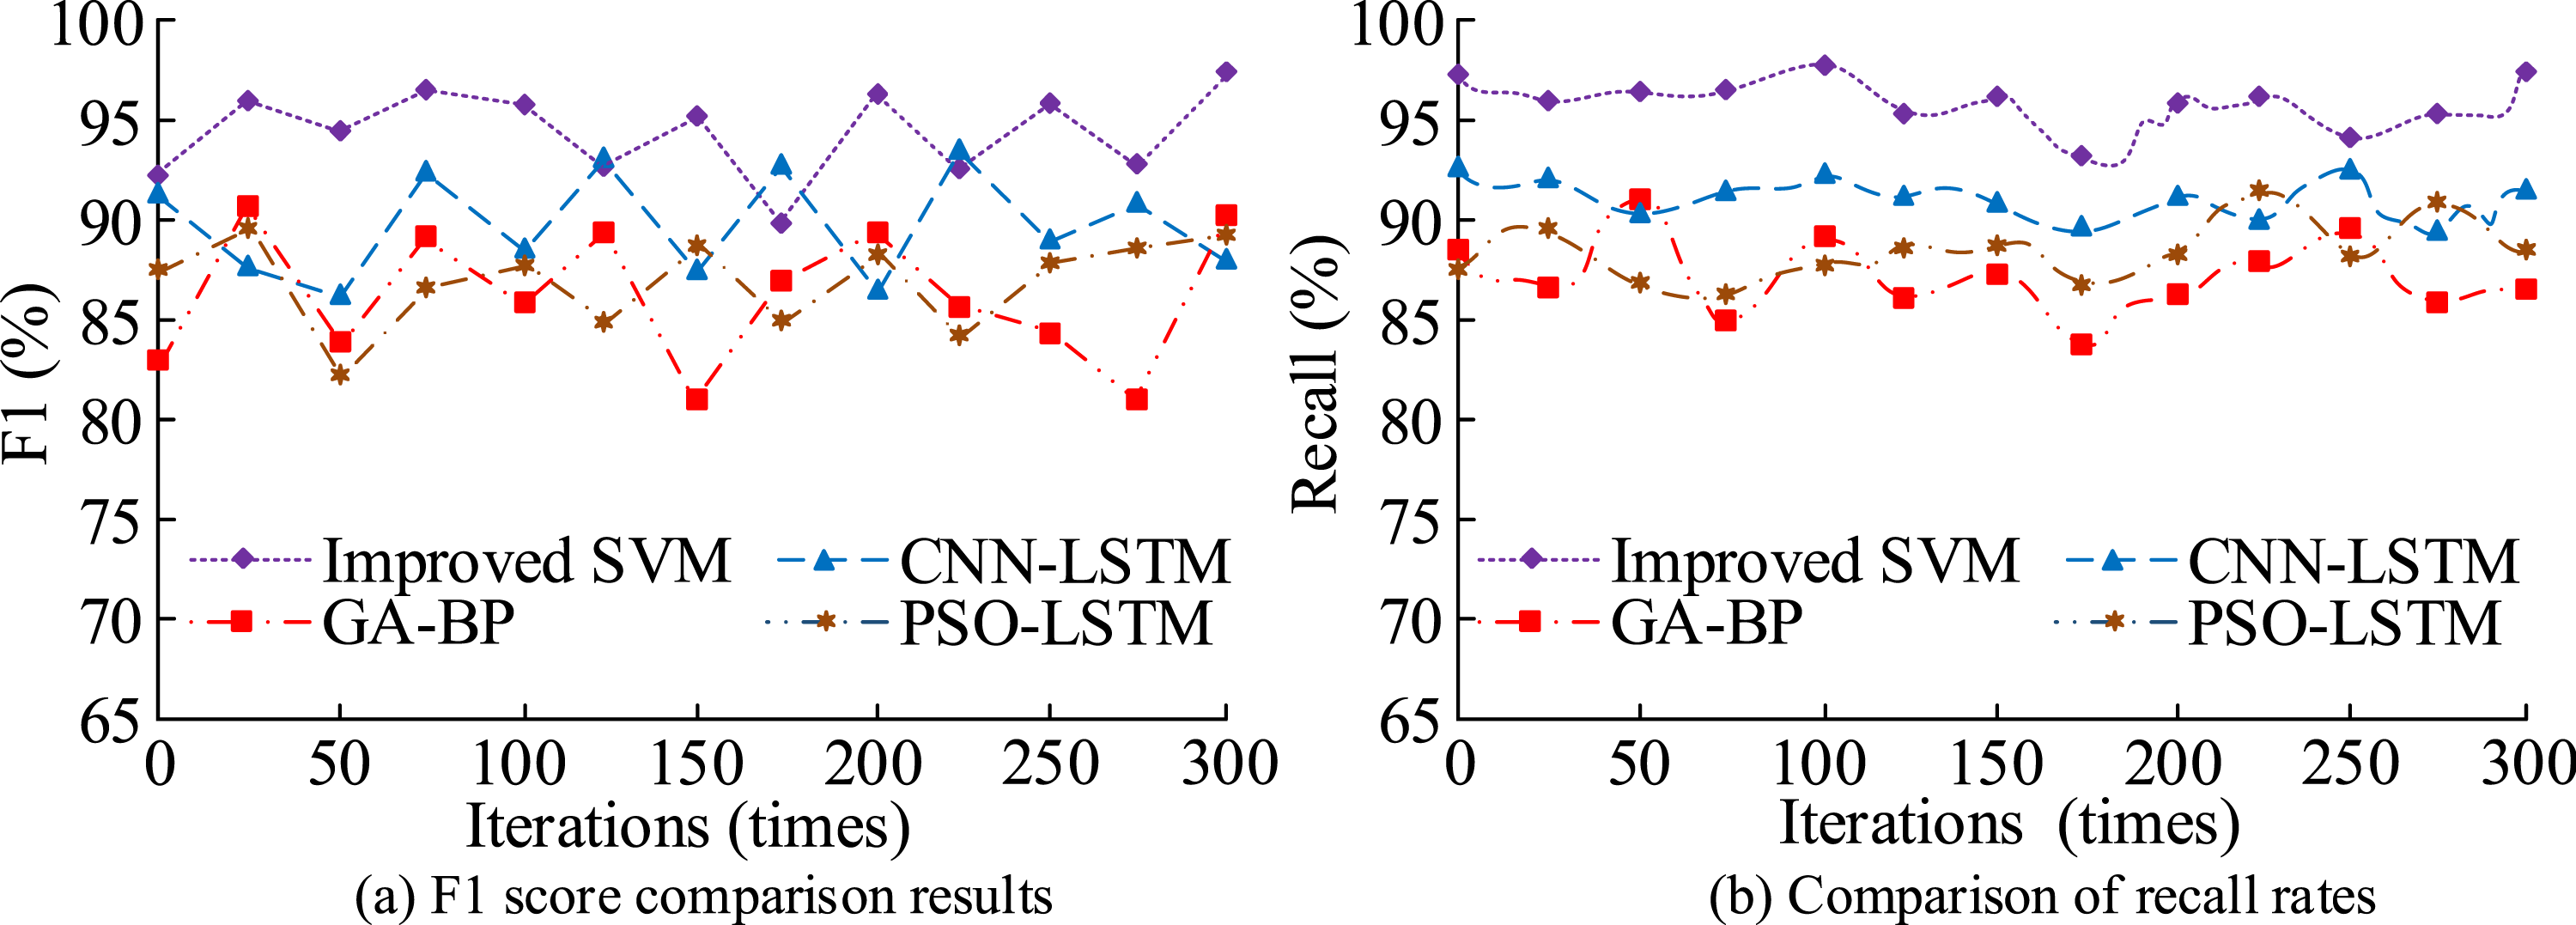
From Figure 8(a), the SVM algorithm had the highest average F1 score, which was 96.2%. The CNN-LSTM algorithm had a mean F1 score of 90.4%, the GA-BP algorithm had a mean F1 score of 87.3%, and the PSO-LSTM algorithm had an average F1 score of 85.1%. From Figure 8(b), the average recall rates of the improved SVM, CNN-LSTM, GA-BP, and PSO-LSTM algorithms were 98.2%, 92.1%, 89.8%, and 90.3%, respectively. Among them, the SVM algorithm had the highest average recall rate. The results showed that, in recall rate and F1 score, the improved SVM algorithm had better performance contrast to the comparative algorithm. The comparison findings of MSE and Root Mean Squared Error (RMSE) of each algorithm are shown in Figure 9. The MSE and RMSE comparison results of each algorithm.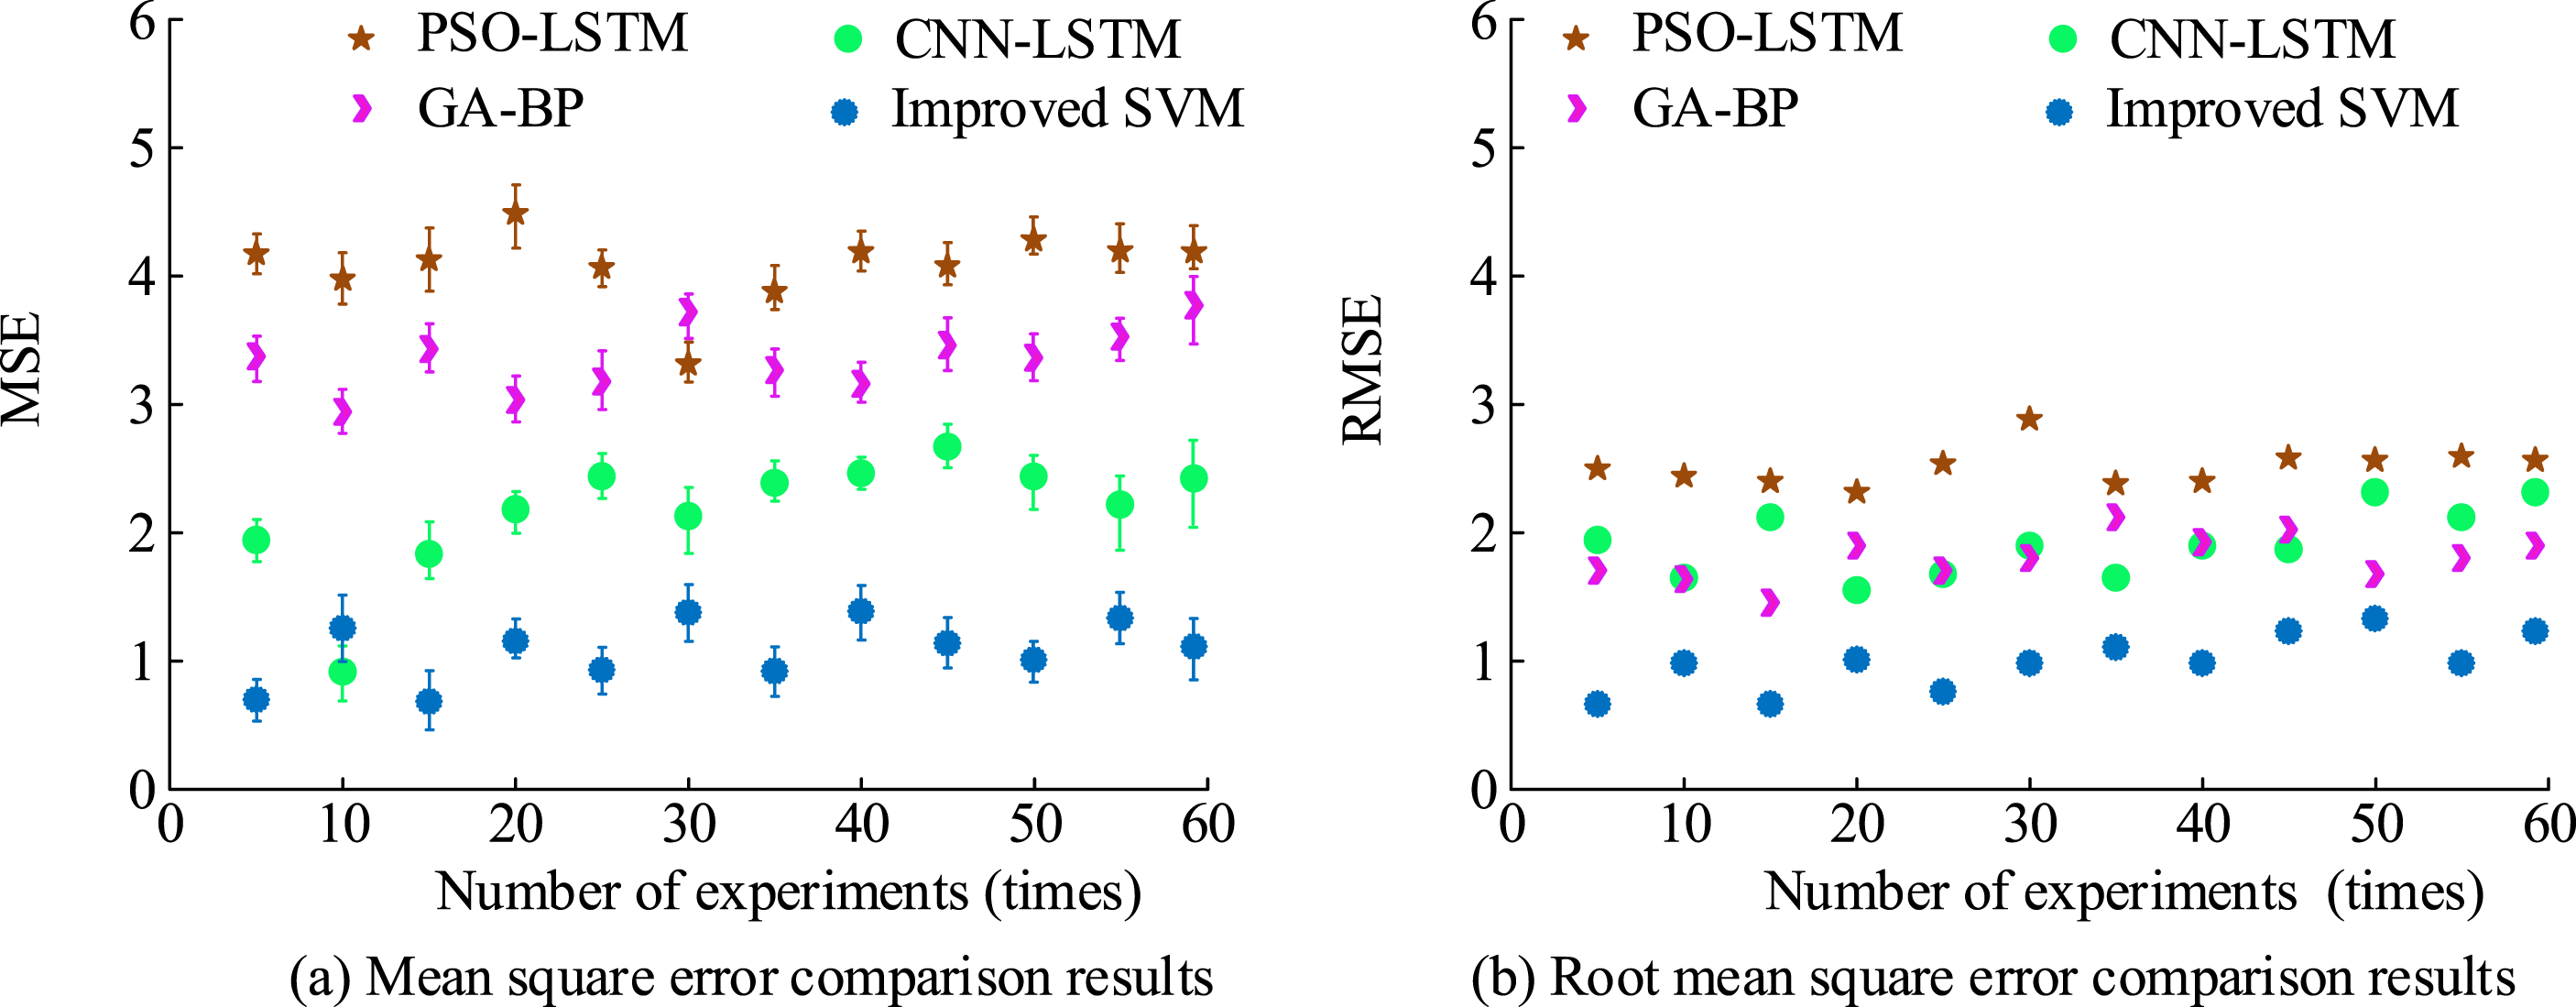
Statistical test results.
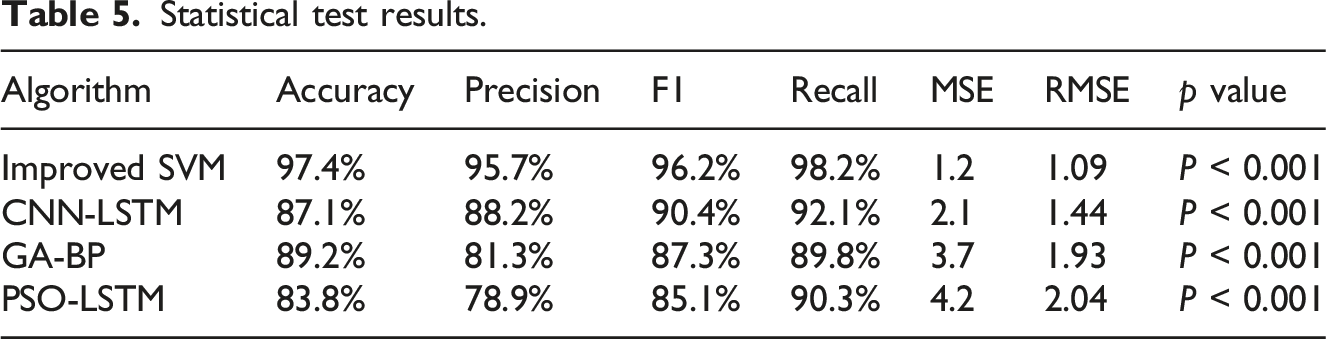
From Table 5, at each time the experiment was conducted, the p value of the statistical test results was less than 0.001, indicating that the experimental results had a significant difference at the statistical 1% level and were statistically significant.
Performance analysis of bridge damage identification model
After verifying the performance of the improved SVM algorithm through multiple dimensions, a comparative performance analysis experiment was carried out on the bridge damage identification model. The comparison models were the bridge damage identification models based on CNN-LSTM, GA-BP, and PSO-LSTM. The comparative indicators were the recognition accuracy, running time, and AUC value of the ROC curve for the three types. The recognition accuracy results of each model for three types of bridge structures are shown in Figure 10. Identification accuracy results of each model for the three bridge structure types.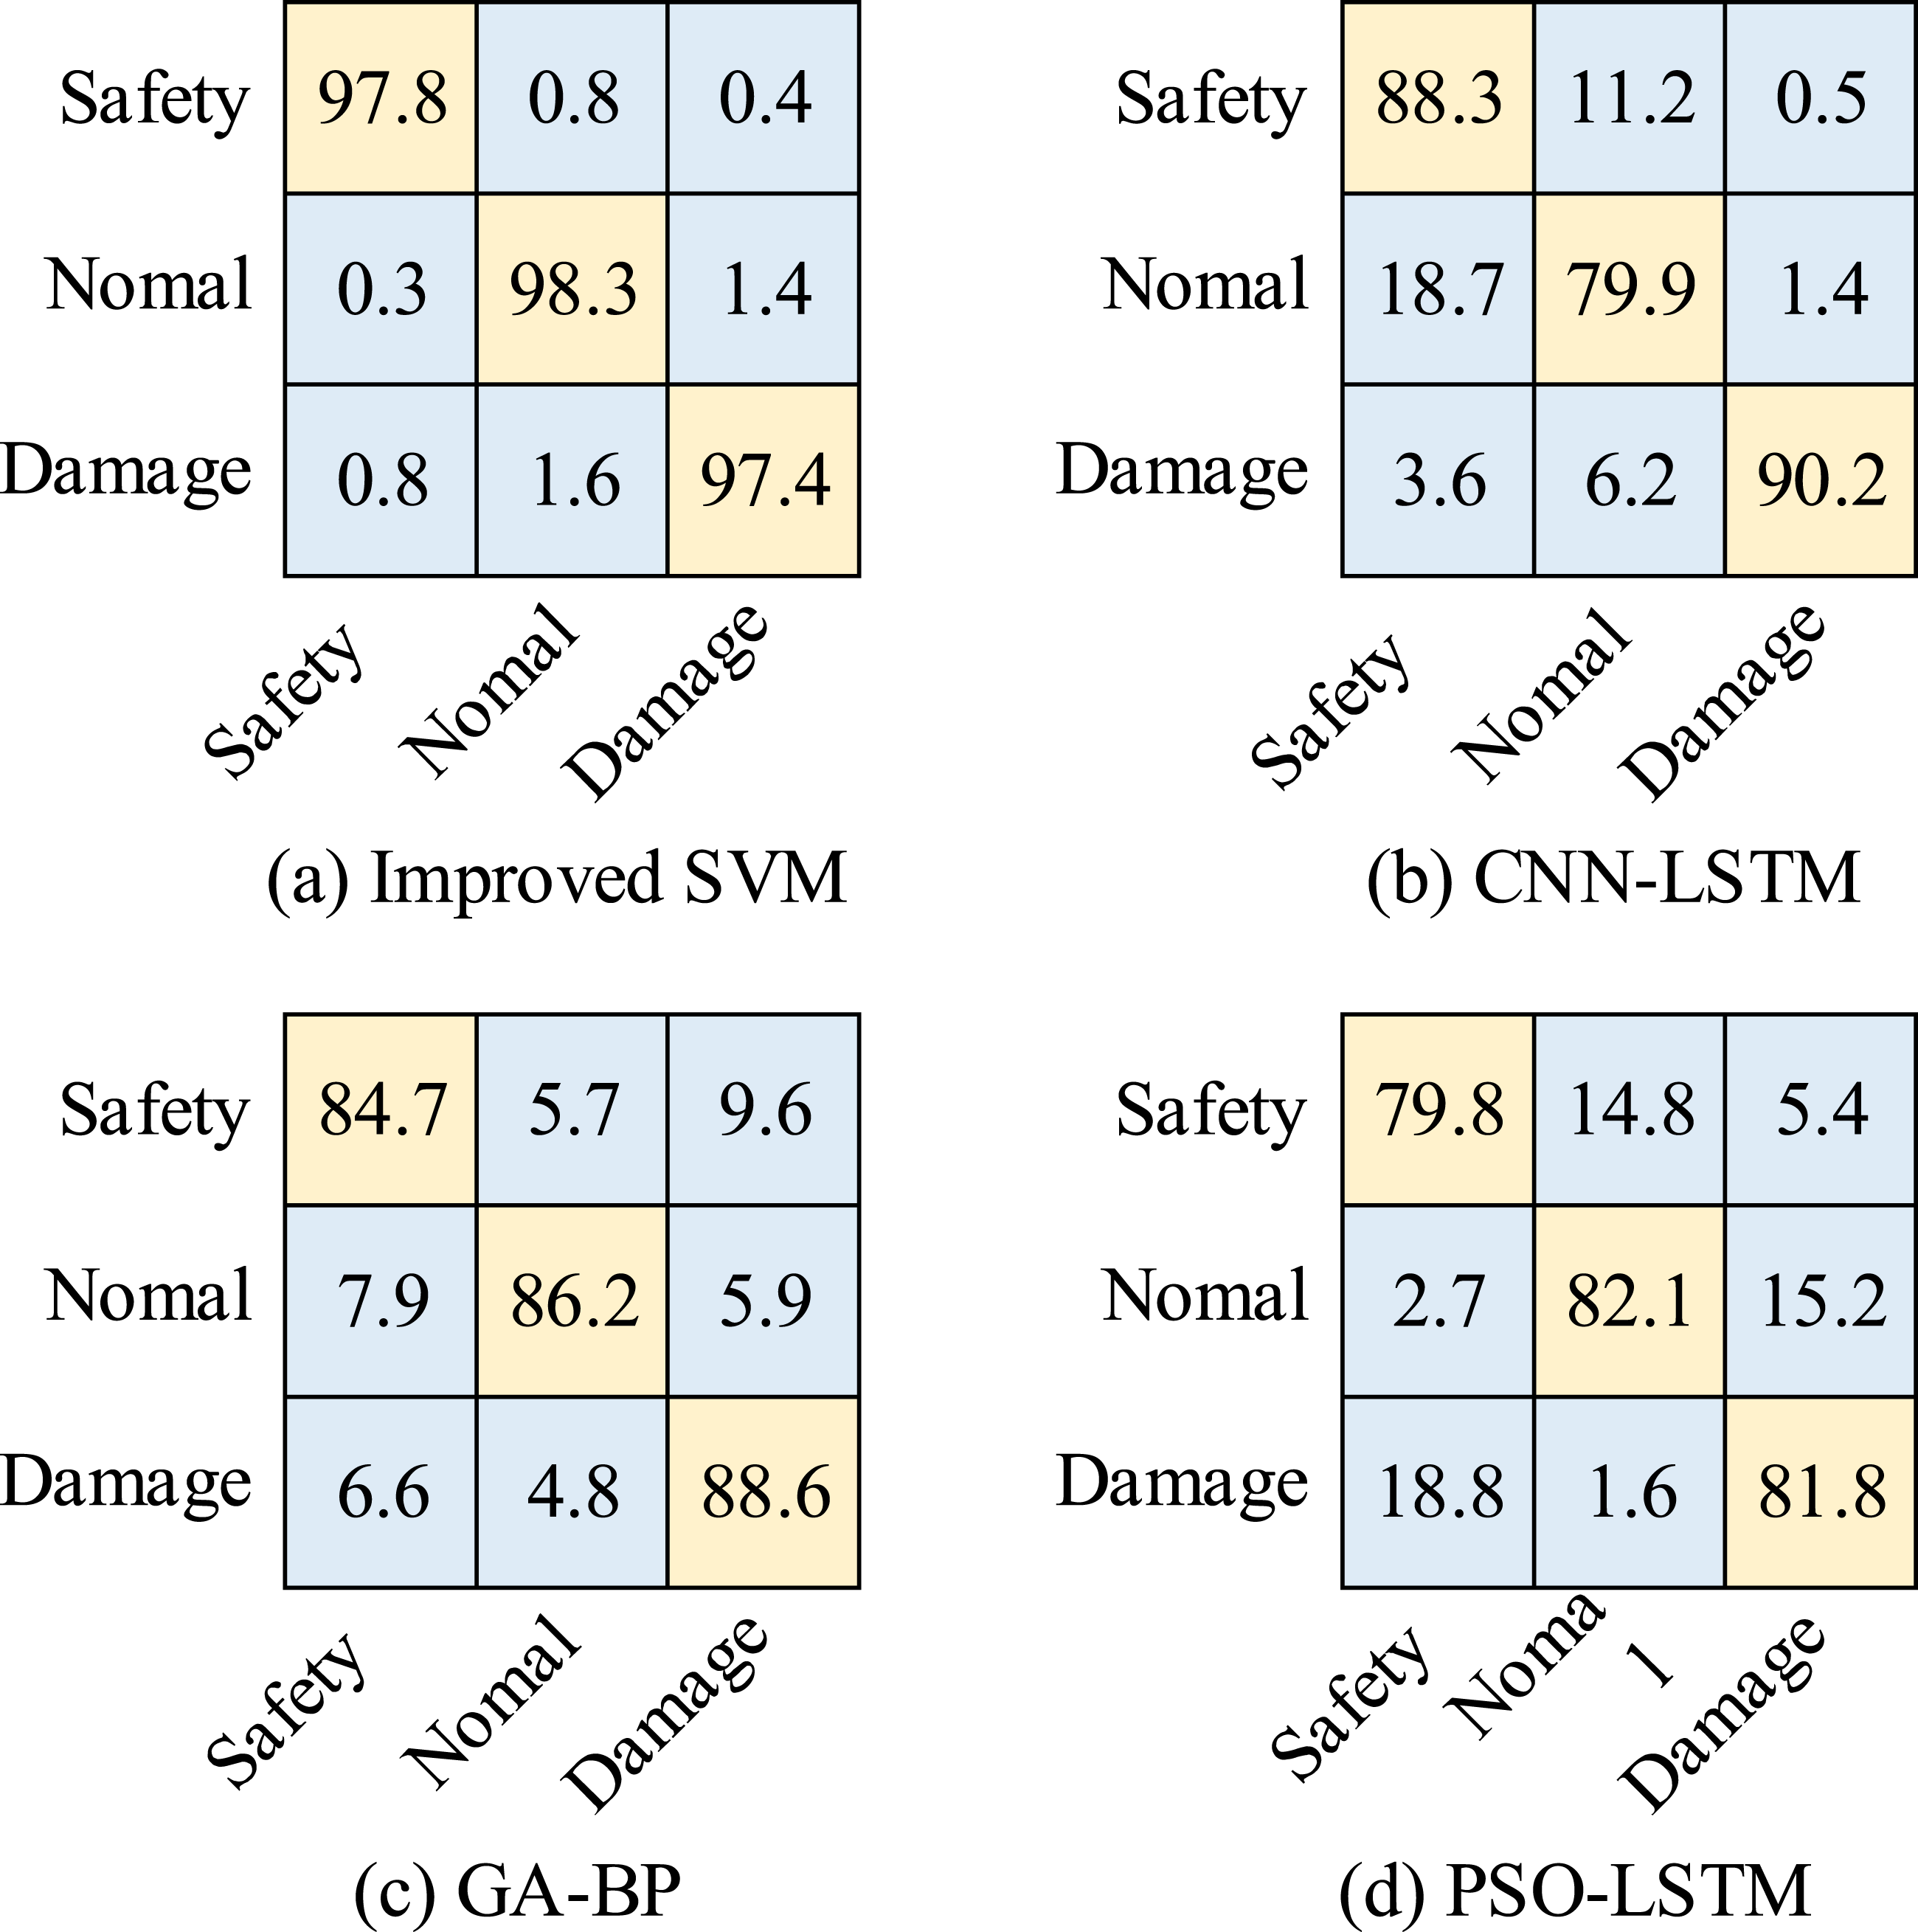
From Figure 10(a), the improved SVM model had recognition accuracies of 97.8%, 98.3%, and 97.4% for The model of running time and AUC value contrast result of ROC curve.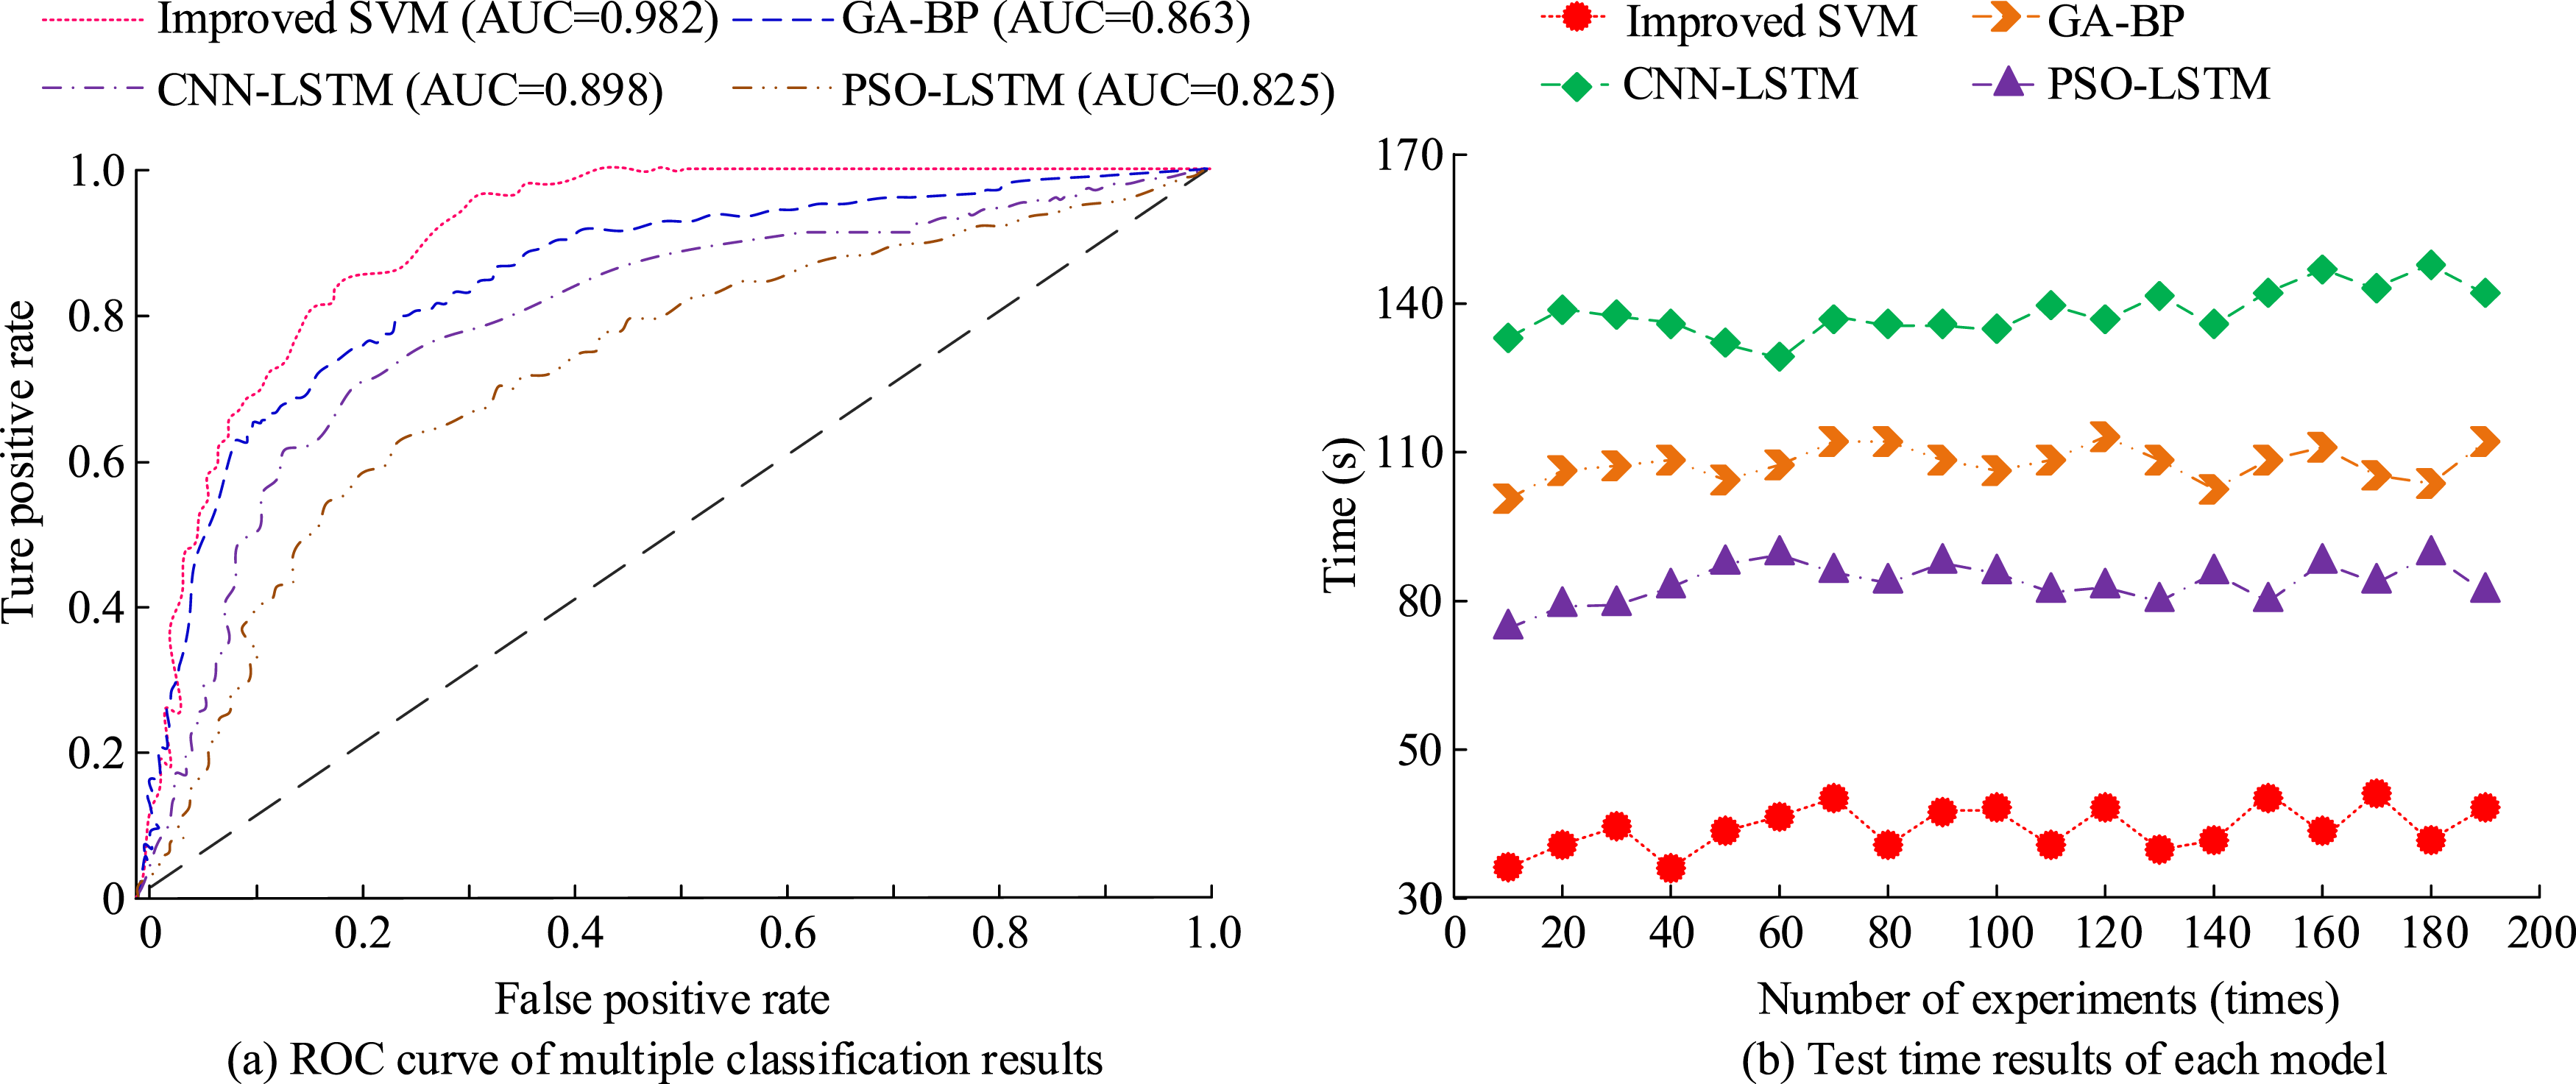
Results of single-sample delay and real-time performance under different data lengths.
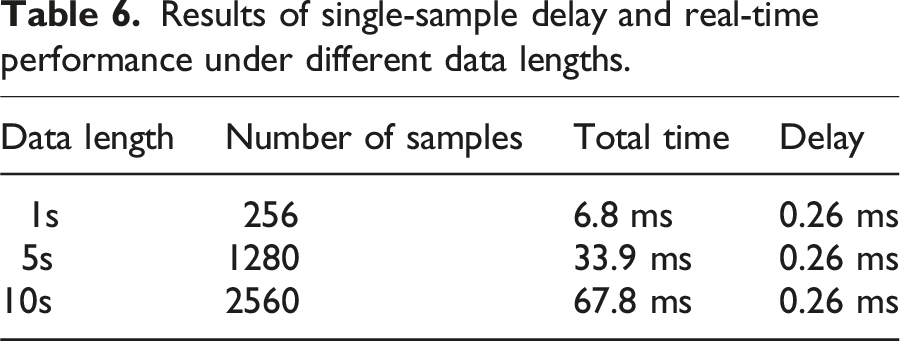
From Table 6, the single-sample delay at different data lengths was all 0.26 ms, which was significantly less than 200 ms. The above results indicate that the model has real-time reasoning capabilities in the original hardware environment.
Discussion
This study analyzed the performance of the improved SVM algorithm and the BSDI model based on PCA and improved SVM. The outcomes denoted that the improved SVM algorithm had significant advantages in accuracy, precision, and F1 score. In the comparative analysis of accuracy, the accuracy of the improved SVM, CNN-LSTM, GA-BP, and PSO-LSTM algorithms was 97.4%, 87.1%, 89.2%, and 83.8%, respectively. Among them, the improved SVM algorithm had the highest accuracy. This result indicated that the introduction of the PSO algorithm optimized the parameters of the algorithm and improved the performance of the SVM algorithm. This result is similar to the results obtained by the Hang Y team in their related research on combining the PSO algorithm with the SVM algorithm. 19 In the comparative analysis of precision, the precision of the improved SVM, CNN-LSTM, GA-BP, and PSO-LSTM algorithms was 95.7%, 88.2%, 81.3%, and 78.9%, respectively. The improved SVM algorithm had the highest accuracy. These outcomes indicated that the combination of dynamic inertia weight optimization PSO algorithm and SVM algorithm improved the classification accuracy of the algorithm. This result is consistent with the improved SVM algorithm proposed by Yuming et al. 20 In addition, in the comparative analysis of F1 score, recall rate, MSE, and RMSE, the improved SVM algorithm had an average F1 score, average recall rate, average MSE, and average RMSE of 96.2%, 98.2%, 1.2, and 1.09, respectively, which were all superior to the comparative algorithm. In the performance comparison analysis of recognition models, the improved SVM model achieved recognition accuracies of 97.8%, 98.3%, and 97.4% for Safe, Normal, and Damage bridge conditions, respectively, which were significantly better than the comparison models. This result indicated that the introduction of PSO algorithm improved the recognition accuracy and precision of the model. This result coincides with the conclusion reached by the Honghua X team in 2024. 21 In addition, in the comparative analysis of running time and ROC curve AUC values, the proposed improved SVM model, CNN-LSTM model, GA-BP model, and PSO-LSTM model had AUC values of 0.982, 0.898, 0.863, and 0.825, respectively. The average running times were 38.1s, 139.1s, 109.4s, and 78.4s, respectively. The improved SVM model was the most optimal. This result indicated that the introduction of RF, K-means algorithm, and PCA algorithm for data preprocessing, combined with PSO algorithm and SVM algorithm, improved the recognition efficiency and accuracy of the model. This result coincides with the conclusion drawn by Zhao et al. in their 2024 related study. 22 The limitation of this study is that it only considered the application of machine learning algorithms in BSDI, while there have been many applications of deep learning for BSDI. Considering the use of deep learning methods such as BP for BSDI is a further direction of research. Although the improved SVM algorithm performs best in terms of accuracy, it should also be noted that the algorithm may have limitations. For instance, the model may be rather sensitive to the selection of training data, and there may be differences in generalization ability across datasets of different scales. Future research needs to further explore these factors to enhance the robustness and applicability of the model.
Conclusion
This study introduces an improved SVM algorithm for BSDI, achieving superior performance metrics over existing methods, including accuracy of 97.4% and an AUC value of 0.982. The integration of PCA for dimensionality reduction and dynamic inertia weight-based PSO optimization enhances the algorithm’s efficiency and accuracy. The real contribution of this research is the demonstration of how algorithmic enhancements can significantly improve the real-time analysis of bridge health monitoring data. This advancement has practical implications for industrial applications, as it enables the early identification of structural damage, potentially reducing maintenance costs and improving bridge safety. By deploying sensors in key bridge structures and utilizing cloud platforms for data transmission, the proposed model can be integrated into existing infrastructure to provide continuous monitoring. This proactive approach to bridge health management can lead to more efficient maintenance strategies and extend the lifespan of bridges. In summary, the enhanced SVM algorithm and BSDI model offer a significant advancement in structural health monitoring, with both scientific and industrial implications. Future work will focus on validating the model in diverse conditions and exploring its integration with other monitoring technologies.
Footnotes
Funding
The authors received no financial support for the research, authorship, and/or publication of this article.
Declaration of conflicting interests
The authors declared no potential conflicts of interest with respect to the research, authorship, and/or publication of this article.