
Abstract
The study examines bending moment, shear force, torsional moment, and vertical deflection in skew-curved bridges. These values are compared with those of straight bridges. SAP2000v20, a finite element method (FEM) based software, is utilised for modelling and analysing the bridges, conforming to the Indian Road Congress (IRC) 6:2017 Codal provisions. The purpose of this research is to examine the behaviour of skew-curved bridges using parametric variations. Also, the equation for a skew-curved bridge with different parameters is derived. The combined impact of curvature and skewness must be considered for accurate analysis, as separate evaluations are insufficient. Additionally, the impact of high skewness in curved bridges is not well-documented, and no specific guidelines or limitations are available. Therefore, a detailed parametric study is conducted to address these gaps, providing insights into the combined influence of skewness and curvature on bridge behaviour. This study extends by considering all IRC loadings and highlights the critical findings under the specified 70R track load conditions. Variables include skew angles, curve angles, span lengths, and the number of cells. Results indicate that incorporating skewness improves the performance of bridges with greater curvature by reducing forces and deflections. Notably, double-cell curved bridges with high skewness outperform single-cell counterparts with the same curvature and the same volume of material. The equations are found to be very close to the finite element results.
Introduction
Bridges are built to cross things like valleys, rivers, and roadways. Because of their extreme rigidity and strength, box-girder bridges are used on modern highways. The girder nearest to the traffic bears the most weight since these bridges divide the vehicle load across many girders from the deck. Box-girder bridge decks are normally orthogonal to traffic, but, occasionally, because of site limitations, they are skewed, meaning that the angle of the deck relative to the abutment is not exactly 90°. The prevalence of curved bridges has risen because of things like site constraints and rising traffic volumes. A skew-curved bridge exhibits complicated behaviour that cannot be approximated by merely adding the individual effects of skewness and curvature. The real-world example of the skew-curved bridge is shown in Figure 1(a),
1
and the corresponding mathematical model is shown in Figure 1(b). There isn’t much research on skew-curved box-girder bridges, but a few of the more important ones are highlighted in the paragraph that follows. Configuration of skew-curved bridge.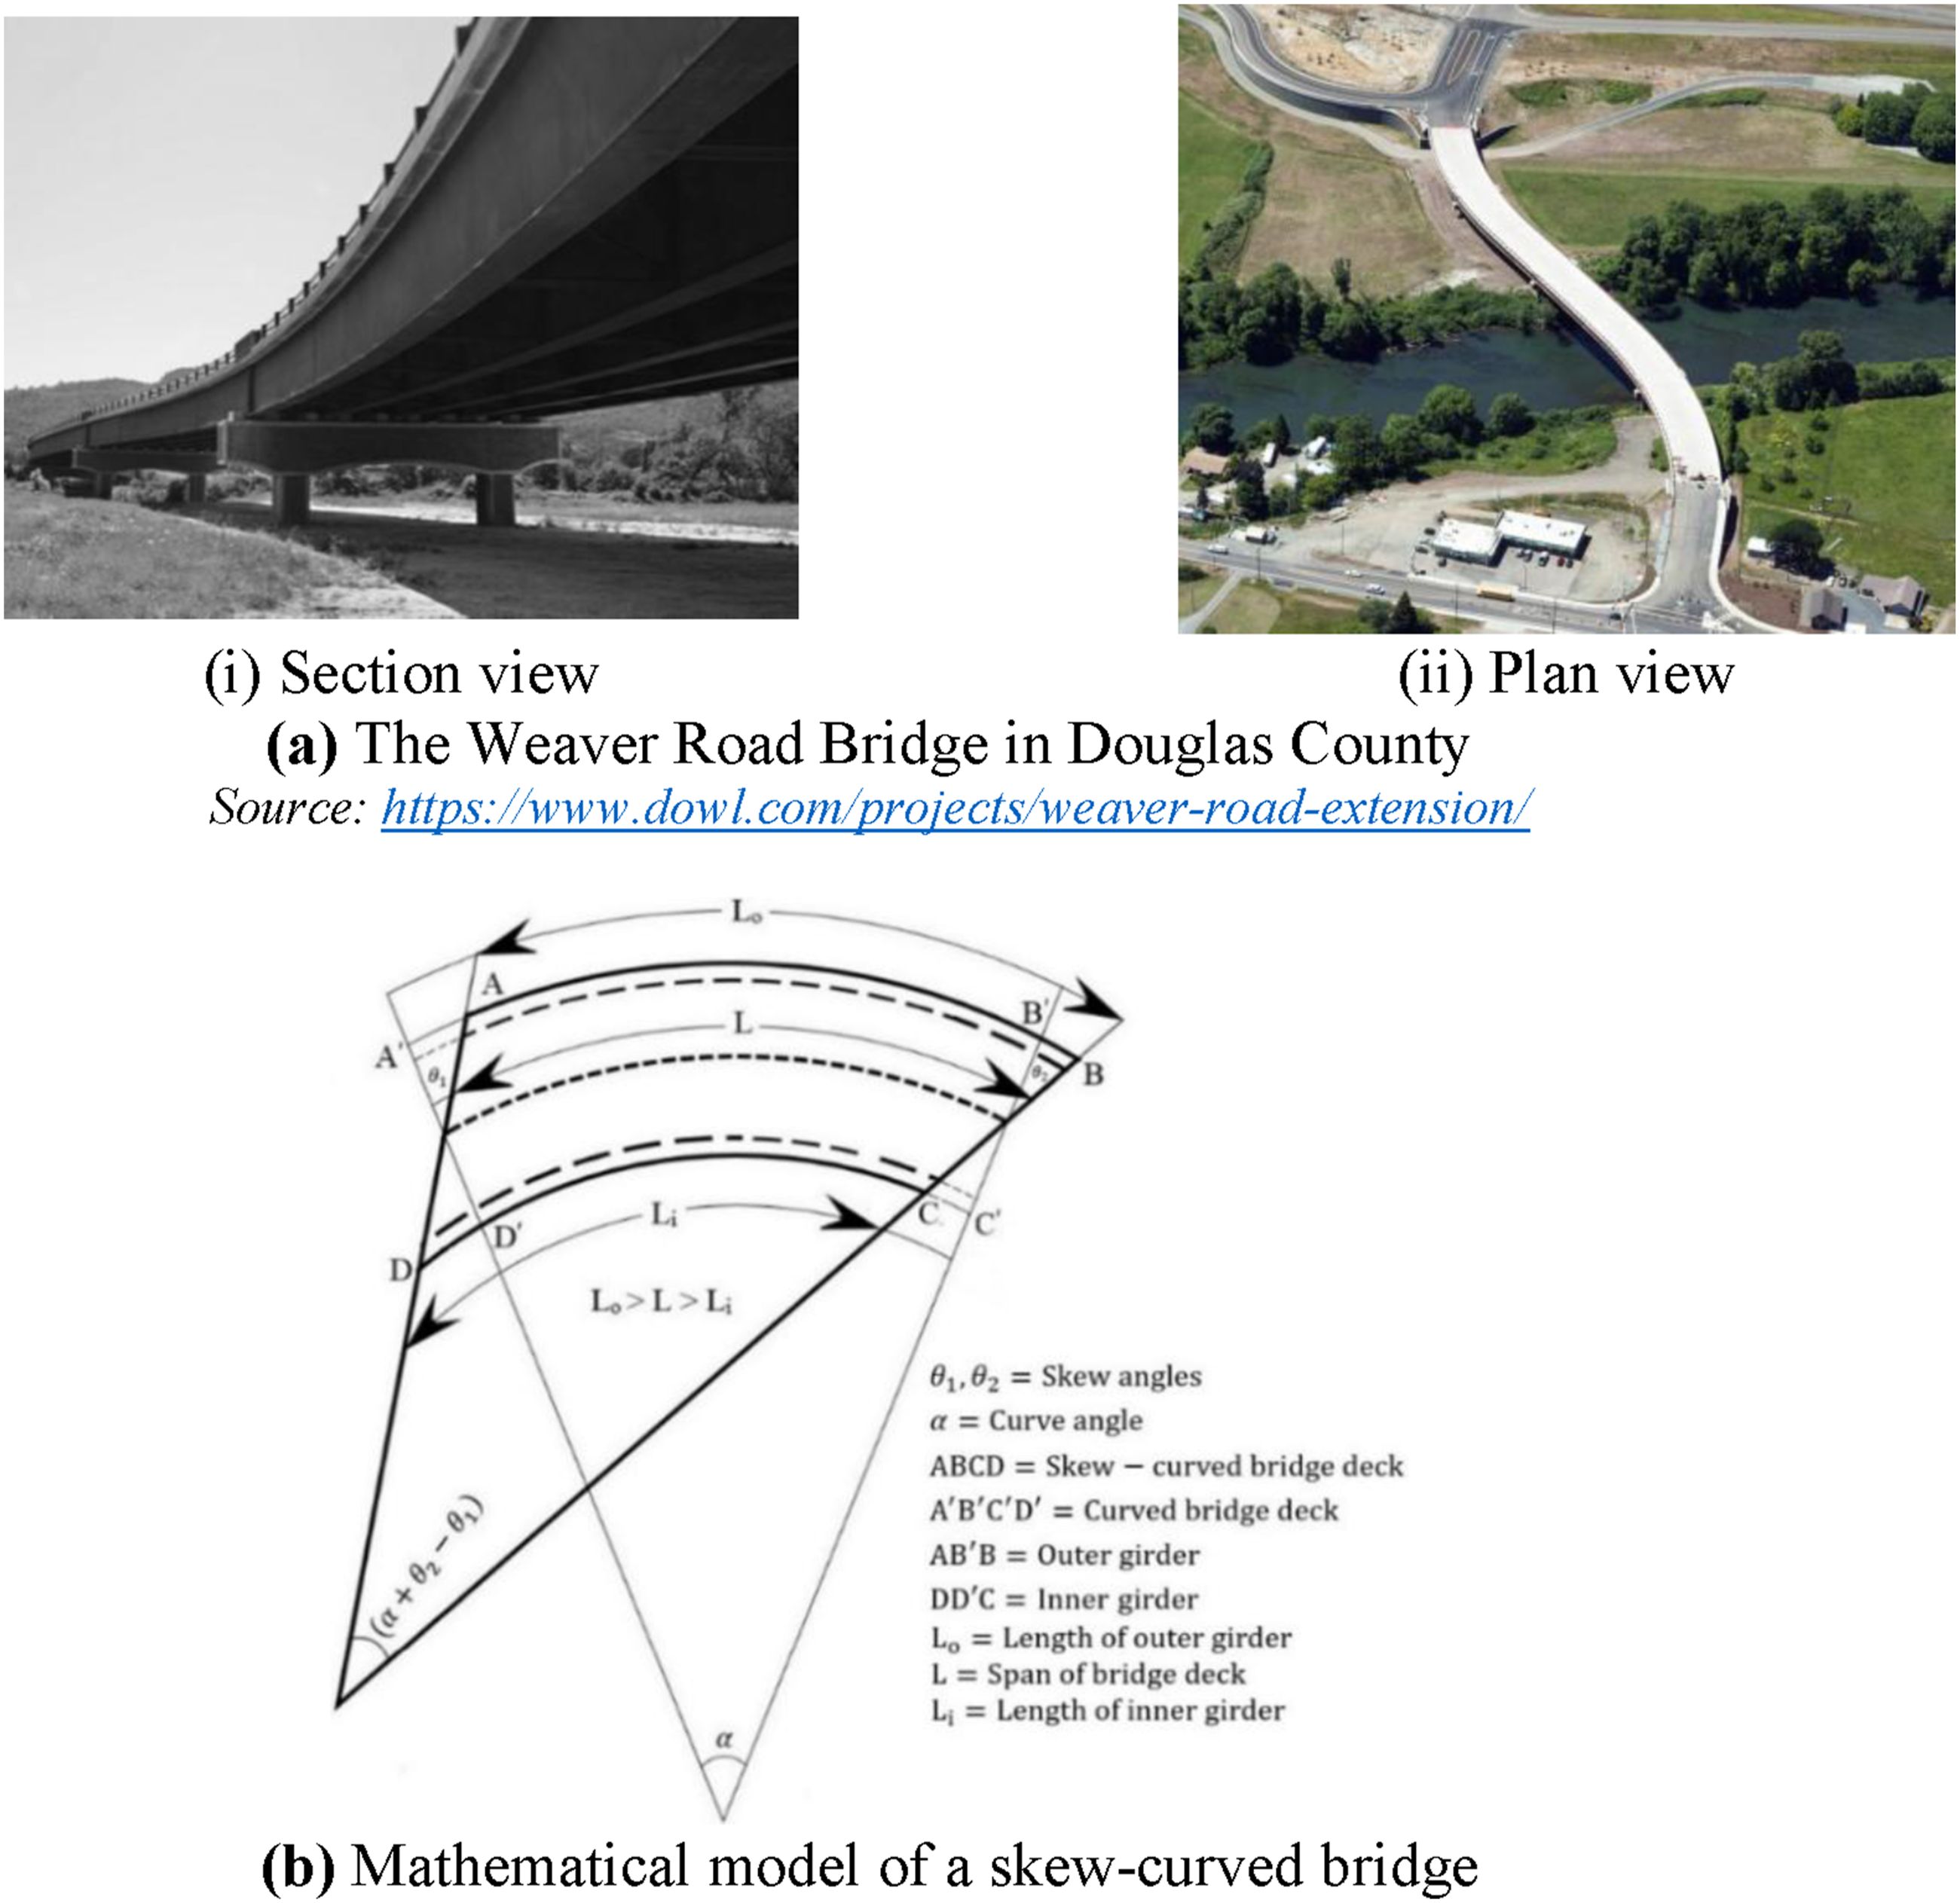
The effect of skewness on moment and shear distribution in composite steel–concrete bridges under Ontario Highway Bridge Design Code (OHBDC) truck loading is studied, without considering curvature.2,3 Analytical and experimental studies on a steel curved bridge under Federal Highway Administration (FHWA) sponsorship are carried out.4,5 The same bridge is later examined during its erection stages. 6 After that, the stability issue of a curved I-girder bridge at the construction stage using finite element software is addressed. 7 The stress, deflection, and empirical relationships for bridges with different spans and skew angles under American Association of State Highway and Transportation Officials (AASHTO) loading are evaluated using SAP2000. 8 The time-history (non-linear) analysis is performed to evaluate seismic performance on eight bridge configurations having different skewness and curvature. 9 The combined and individual effects of skewness and curvature of the bridge girders under AASHTO loading using SAP2000 are investigated. 10 The numerical and experimental static and thermal analyses are performed on 12 skew-curved bridge models. 11 A new system for the construction of curved girders (I and U girders) is suggested using short straight girders analytically and experimentally under AASHTO loading. 12 The linear and non-linear responses of a composite box-girder bridge are examined to evaluate the impact of cross bracing. 13 Straight box-girder multi-cell bridges subjected to IRC loads are analysed using ANSYS. 14 Analytical fragility curves to assess the vulnerability of seismic incidence in curved box-girder structures are developed. 15 The bending moment on a skew-curved bridge under the gravity loads and IRC specified loads using CSiBridge software is anticipated. 16 Several models of skewed bridges are developed based on beam theory to evaluate the vibration response. 17 The straight and skew deck-girder bridges are investigated experimentally, statistically and using FEM. 18 A curved box-girder bridge is modelled to determine the responses by varying the radius, cross-section, loading position and span length, without considering the combined effect of skewness. 19 Three-dimensional finite element modelling is used to investigate stress distribution in skewed composite I-girders under dead load, considering various construction characteristics. 20 The skew and skew-curved bridges are studied, subjected to IRC loadings.21–23 A curved box-girder bridge using ANSYS is analysed to determine the mode shapes. 24 The dynamic analysis is carried out on a curved thin-walled straight box-girder bridge. 25 A static analysis on a curved box-girder bridge is conducted under Indian railway loading using the finite element method. 26 A simplified model by performing a parametric study is developed to evaluate the response of the skewed bridges. 27 Static analysis on a straight box-girder bridge is performed using FEM, subject to Indian Railway regulations. 28 A prestressed concrete box-girder bridge model is investigated to determine the static behaviour using FEM. 29 A method for the dynamic analysis of curved bridge deck pavement is proposed, considering geometric complexity and vehicle-deck interaction using FEM. 30 Analytical and numerical approaches are compared for curved steel box-girder bridges. 31 A procedure is proposed to model and analyse box-girder bridges. 32 The dynamic and static responses of box-girder bridges are investigated.33,34 The bending and torsional effects on a thin-walled curved box-girder bridge are analysed. 35 The box-girder bridges are examined to determine static and dynamic responses using ANSYS. 36 Skewed reinforced concrete (RC) girder bridge decks are examined utilising a grillage model in FEM by varying skew angles, as well as various cross girder designs. 37 The live load distribution factor in severely skewed bridges is investigated using parametric modelling and load testing on a concrete deck bridge. 38 A system for automatically generating box-girder bridge models is described based on design standards, using two case studies. 39
Based on the above studies, the following gap in the research has been identified and addressed: 1. The effects of skewness and curvature have been extensively studied independently, although the combined effect of both has not extensively studied. 2. Curved box-girder bridges are the subject of most of the studies. 3. The effect of curvature and large skew angles under IRC-specified loadings is not specifically addressed. 4. There are no specific design procedures on these bridges in any codes because of their complex behaviour. Furthermore, no standards for skew-curved bridges have been given by the IRC. Thus, the analysis of these box-girder bridges becomes critical. 5. There are a limited number of detailed parametric studies that investigate a variety of factors such as skew angles, curve angles, span lengths, and cell numbers. Most research primarily focused on either limited geometric ranges or individual parameter effects. 6. The studies lack in providing any equations to predict the behaviour of skew-curved bridges.
The present study seeks to close the above-mentioned research gaps by doing a full parametric analysis of RC box-girder skew-curved bridges with the finite element method (FEM) based SAP2000v20 software. 40 RC box-girder bridges having more skewness and curvature are investigated in the present study, considering specified IRC loadings. Actual area loads provide more realistic results. That is why all IRC loadings (Class-70R, Class-AA, and Class-A) are studied; however, only the most important results of the 70R tracked load are discussed in this paper. Also, the curved bridge with greater skewness is not shown anywhere else. The equations from the statistical approach are also deduced for skew-curved bridges in the form of ratios. So designers/practitioners can use these equations to determine the responses of a skew-curved bridge with the help of a straight bridge. The findings will help to improve design recommendations and our understanding of the structural behaviour of skew-curved bridges, while also resolving past study constraints.
Methodology
It is difficult to conduct parametric research on bridges experimentally since it takes a lot of work, money, and time to create prototypes and requires a complex lab setup with experienced labour. But these difficulties may be lessened with the help of numerical software, which is becoming increasingly popular because of how well it analyses intricate structures like bridges. Before the study is carried out, the present methodology is verified against published experimental results. The modelling and analysis are done using SAP2000v20, a finite element tool. 40
Validation
In this section, the present approach is validated with the published experimental and numerical results. The experimental setup has some constraints as stated above, so it is not always feasible when the numerical analysis yields satisfactory insights. So, experimental validation of the approach is necessary. After the validation of the present approach, the study is further extended to modelling of the bridge deck for the present study, followed by results and discussion.
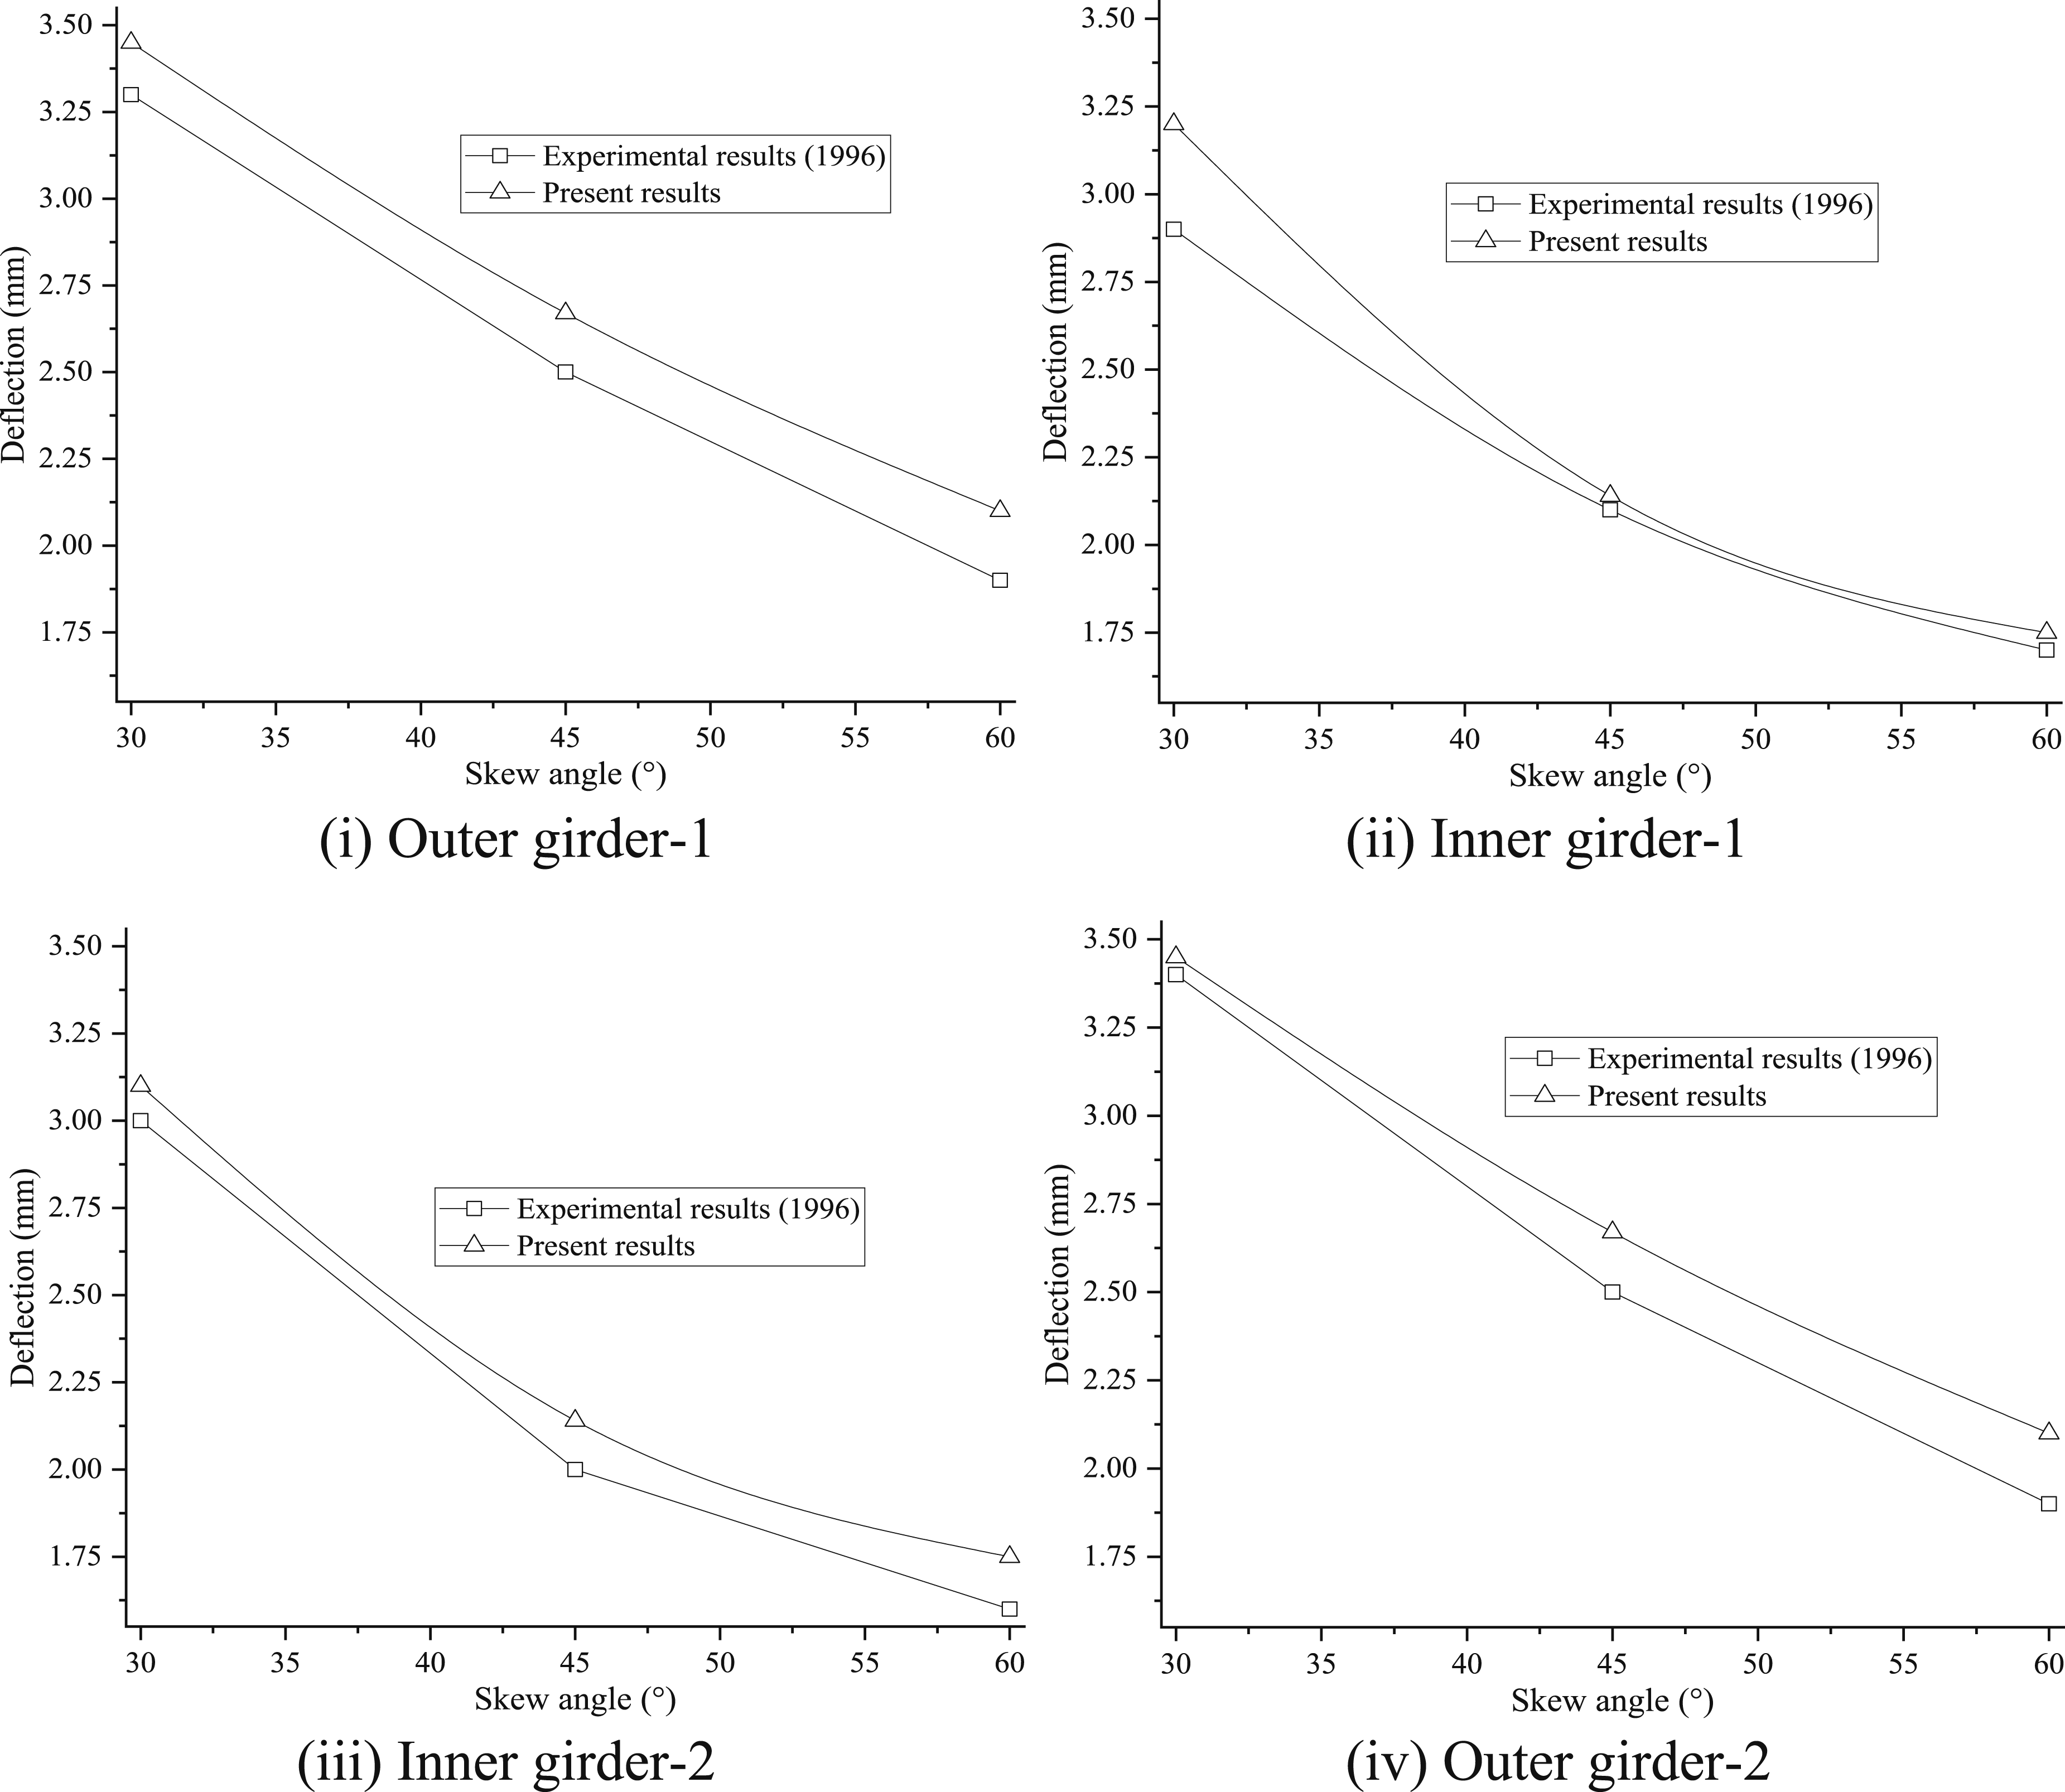
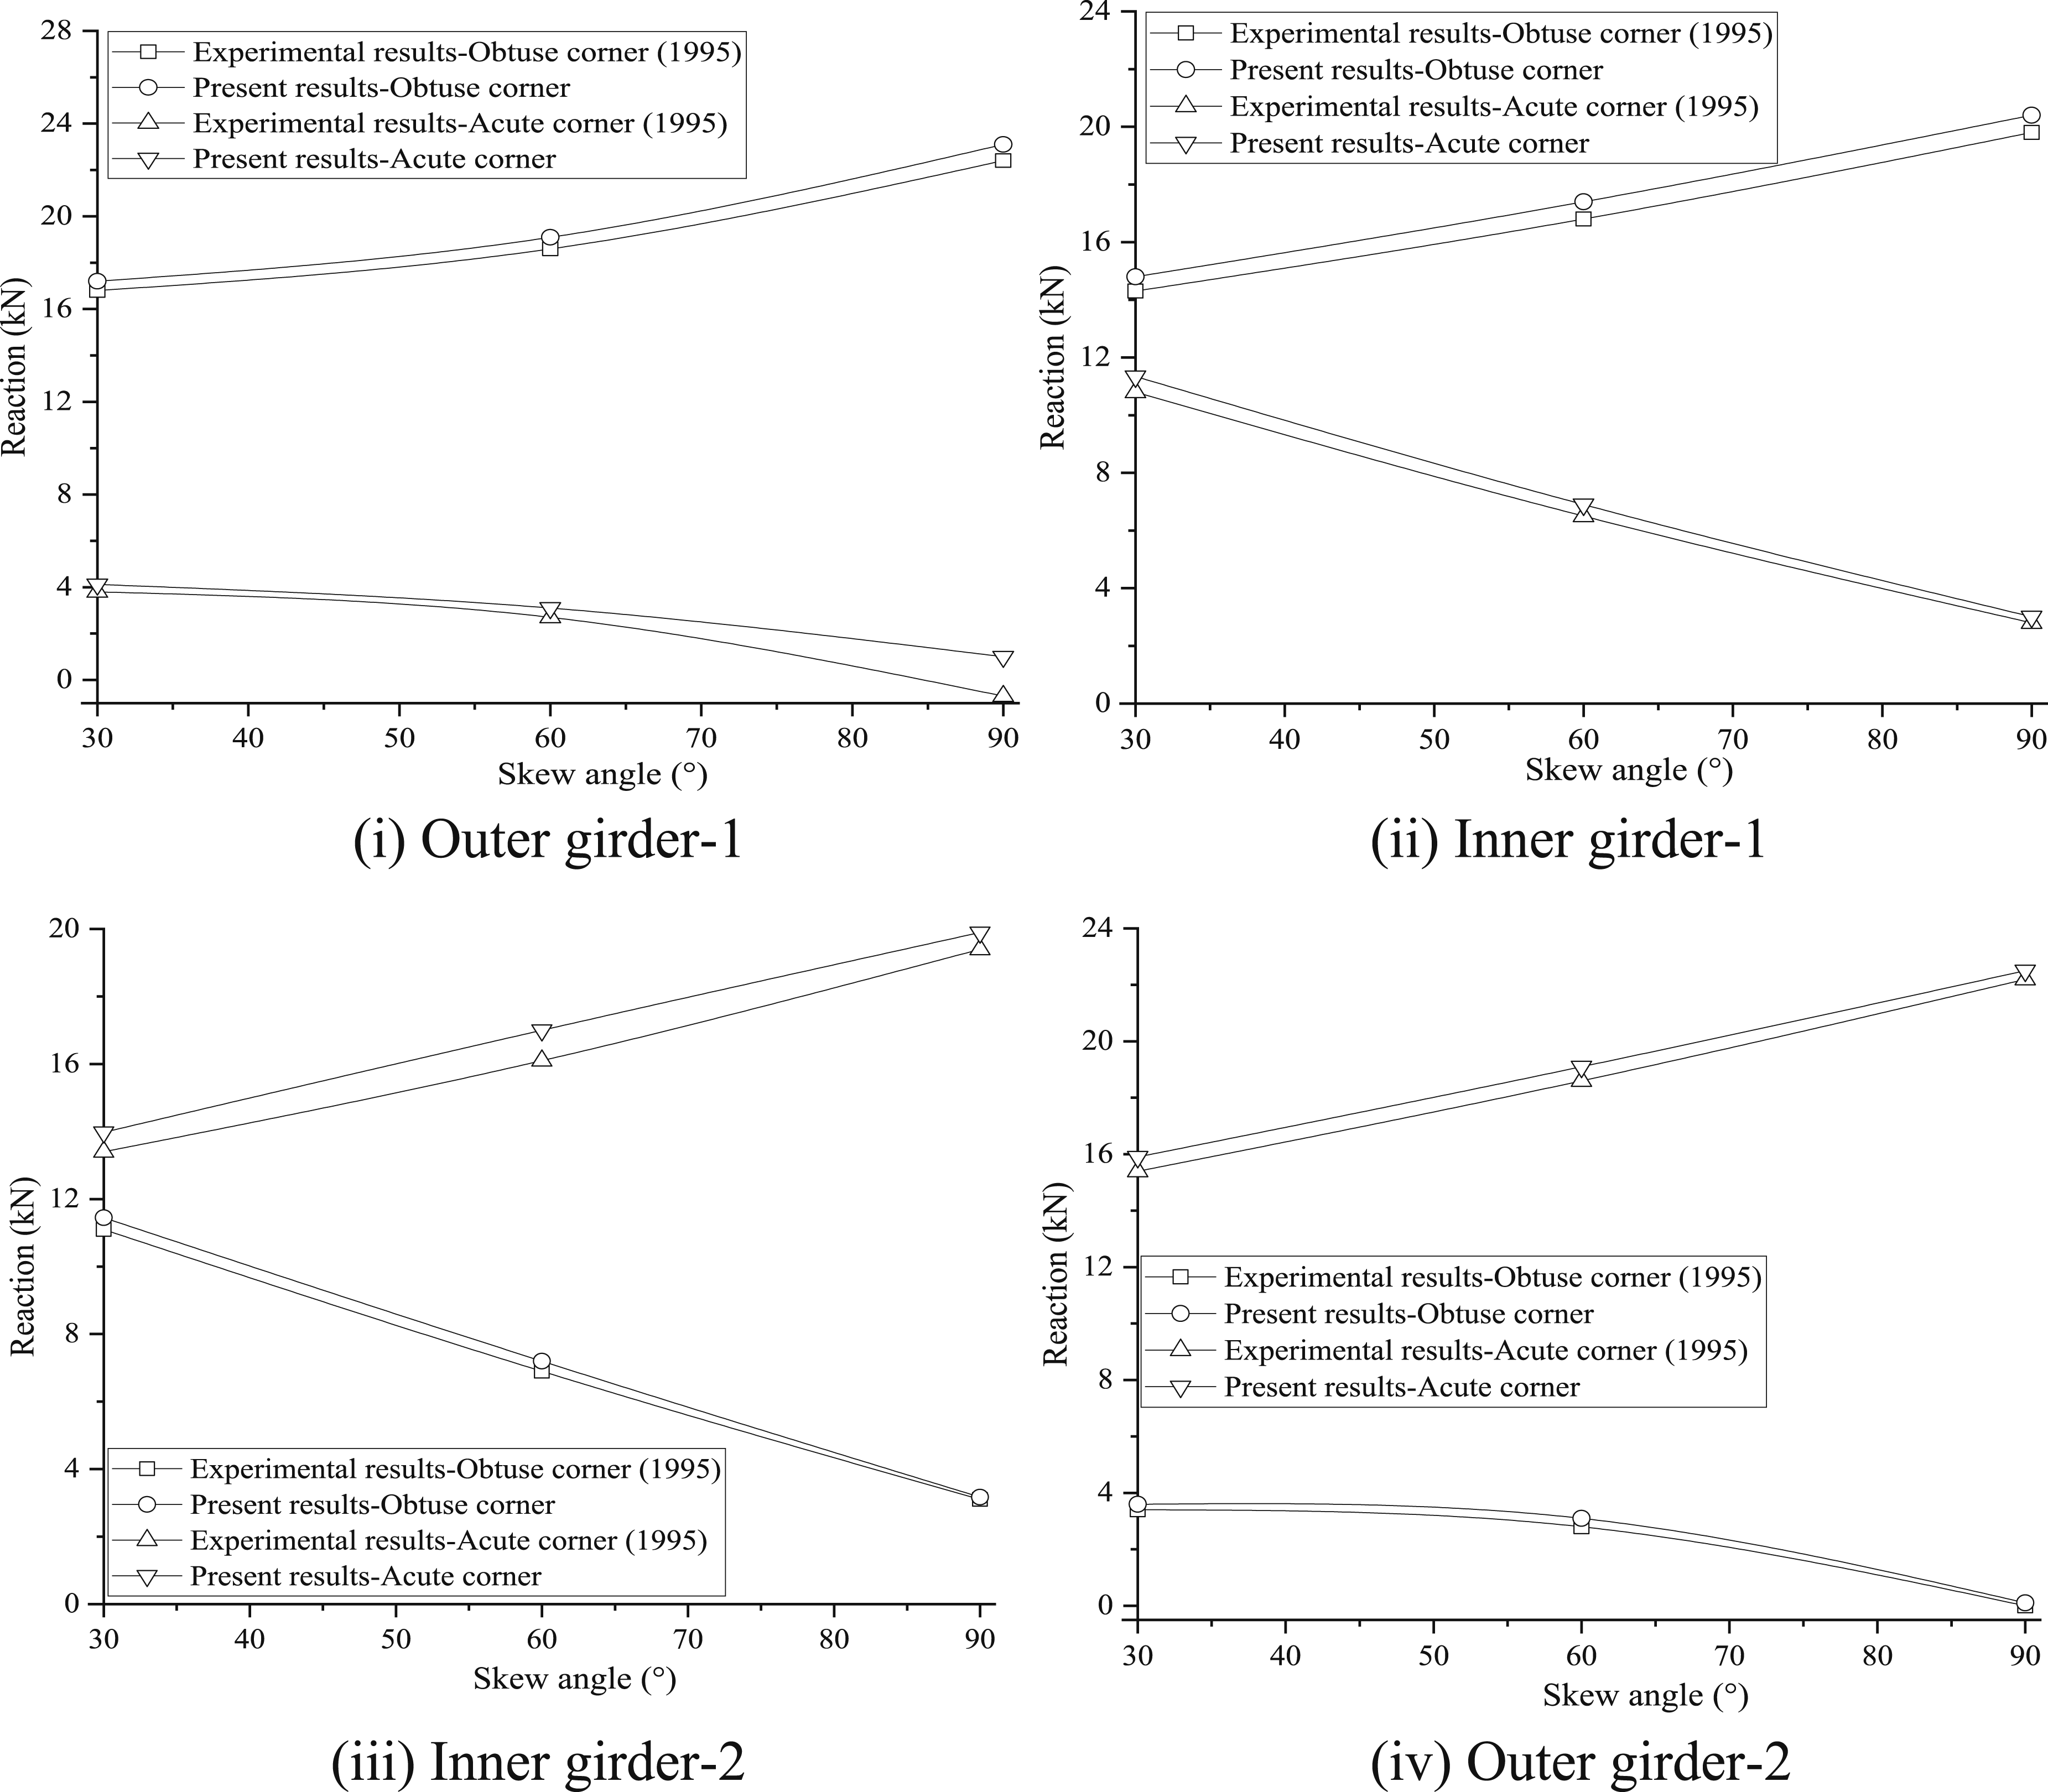
For experimental validation, the deflection and reaction results of the outer and inner girders of a skewed simply supported composite deck, tested by Ebeido and Kennedy (1995, 1996), are used. The deck has a span length of 1.778 m and a thickness of 38 mm. The width of the deck is 1.232 m, 1.509 m, and 2.134 m with skewness of 30°, 45°, and 60°, respectively. The cross beam and longitudinal beam dimensions are 75 mm × 8 mm of steel grade of strength, 500 MPa. The characteristic strength of the concrete deck is 41 MPa.
For validating the published results, four-noded shell and two-noded beam elements are used for the longitudinal and cross beam, having six degrees of freedom at each node. The mesh size of 20 mm is chosen after a convergence study, as shown in Figure 2. Further, considering the chosen mesh size, the results of maximum deflection and support reaction are compared on outer and inner girders with the published results and are depicted in Figures 3 and 4, respectively. It can be clearly seen that the maximum deflection reduced with the increment in the skewness of the bridge in all girders. Also, the present results have very little variation compared to the published results. Convergence study. Validation of deflection (mm). Validation of support reaction (kN).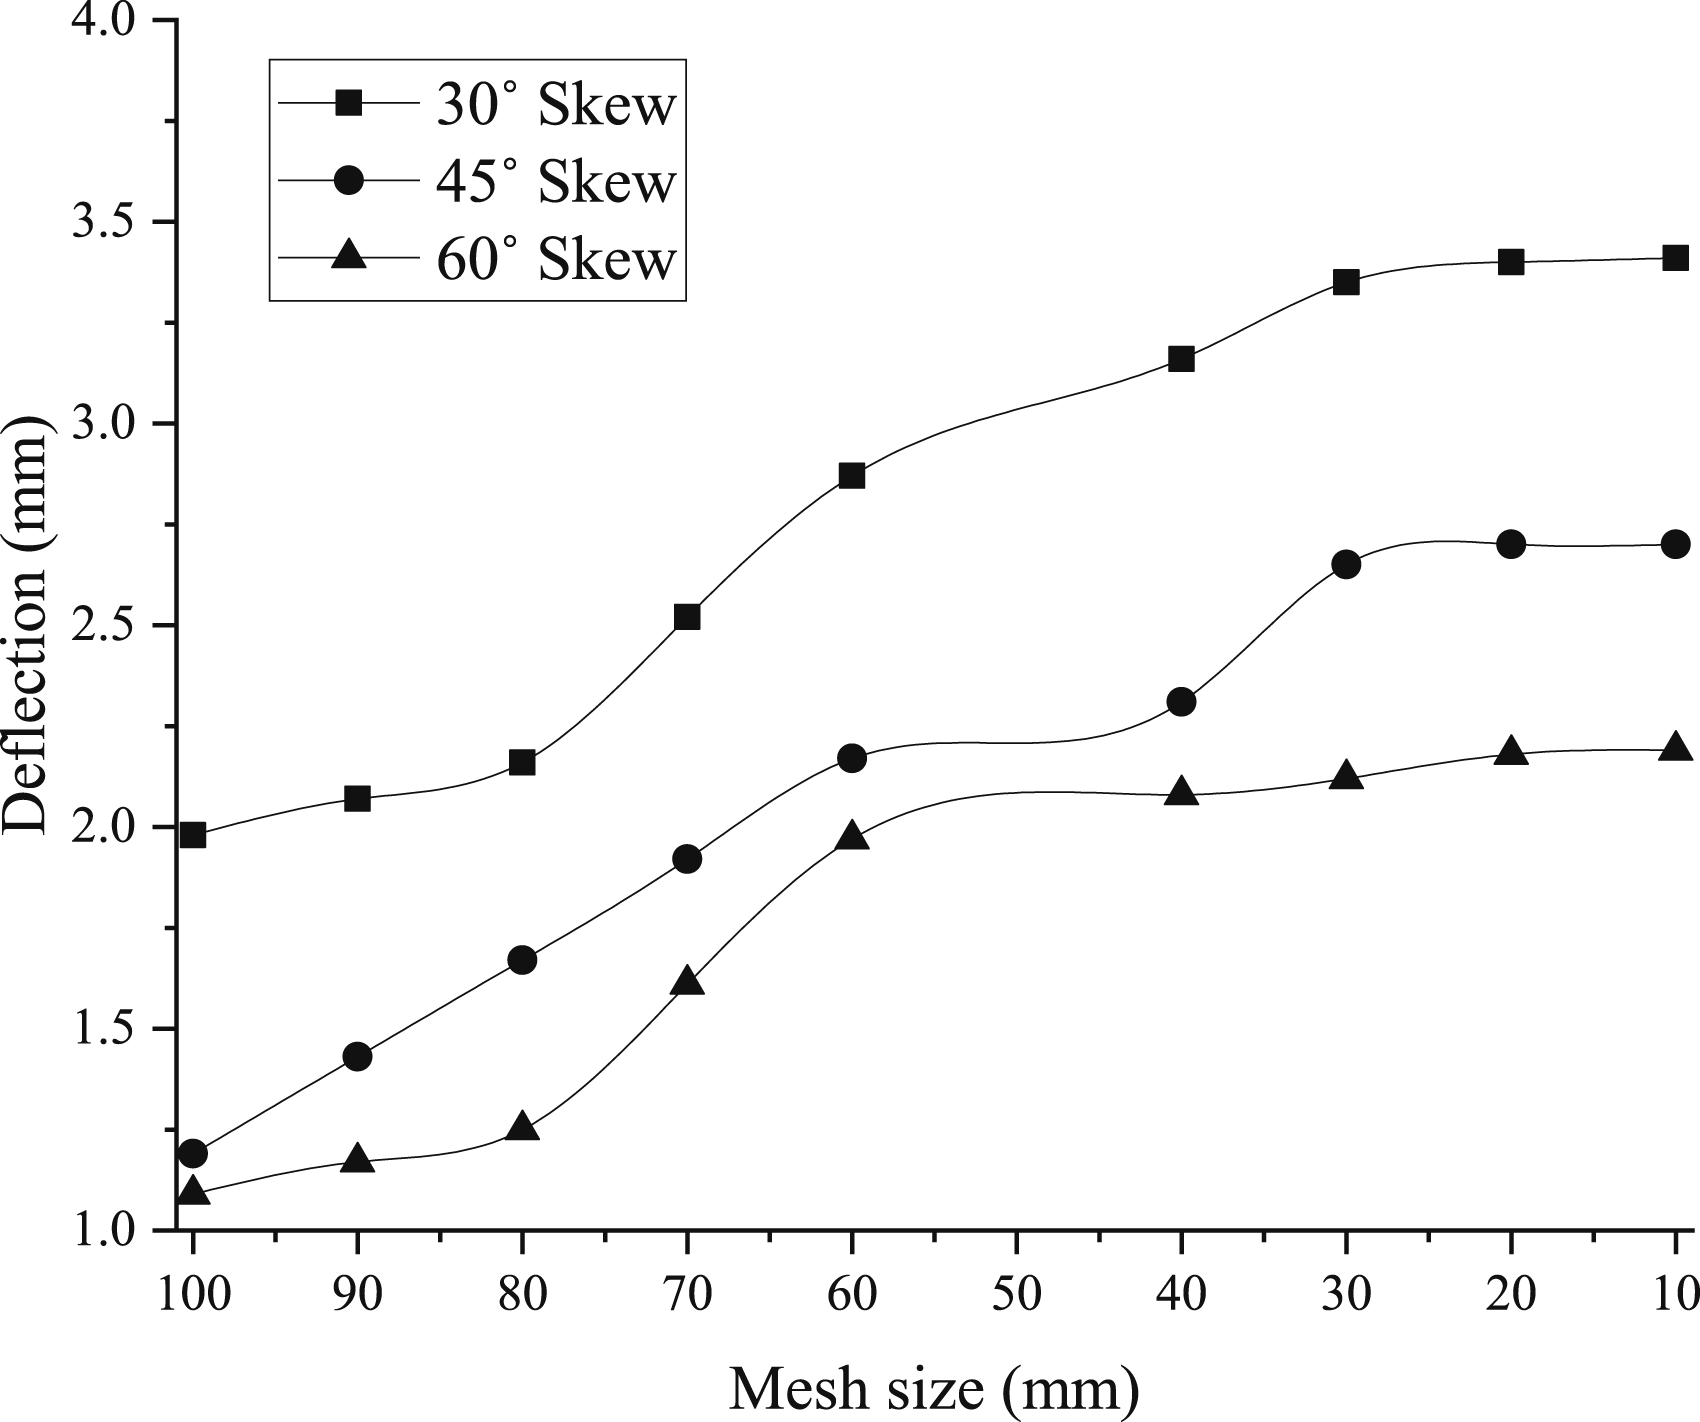
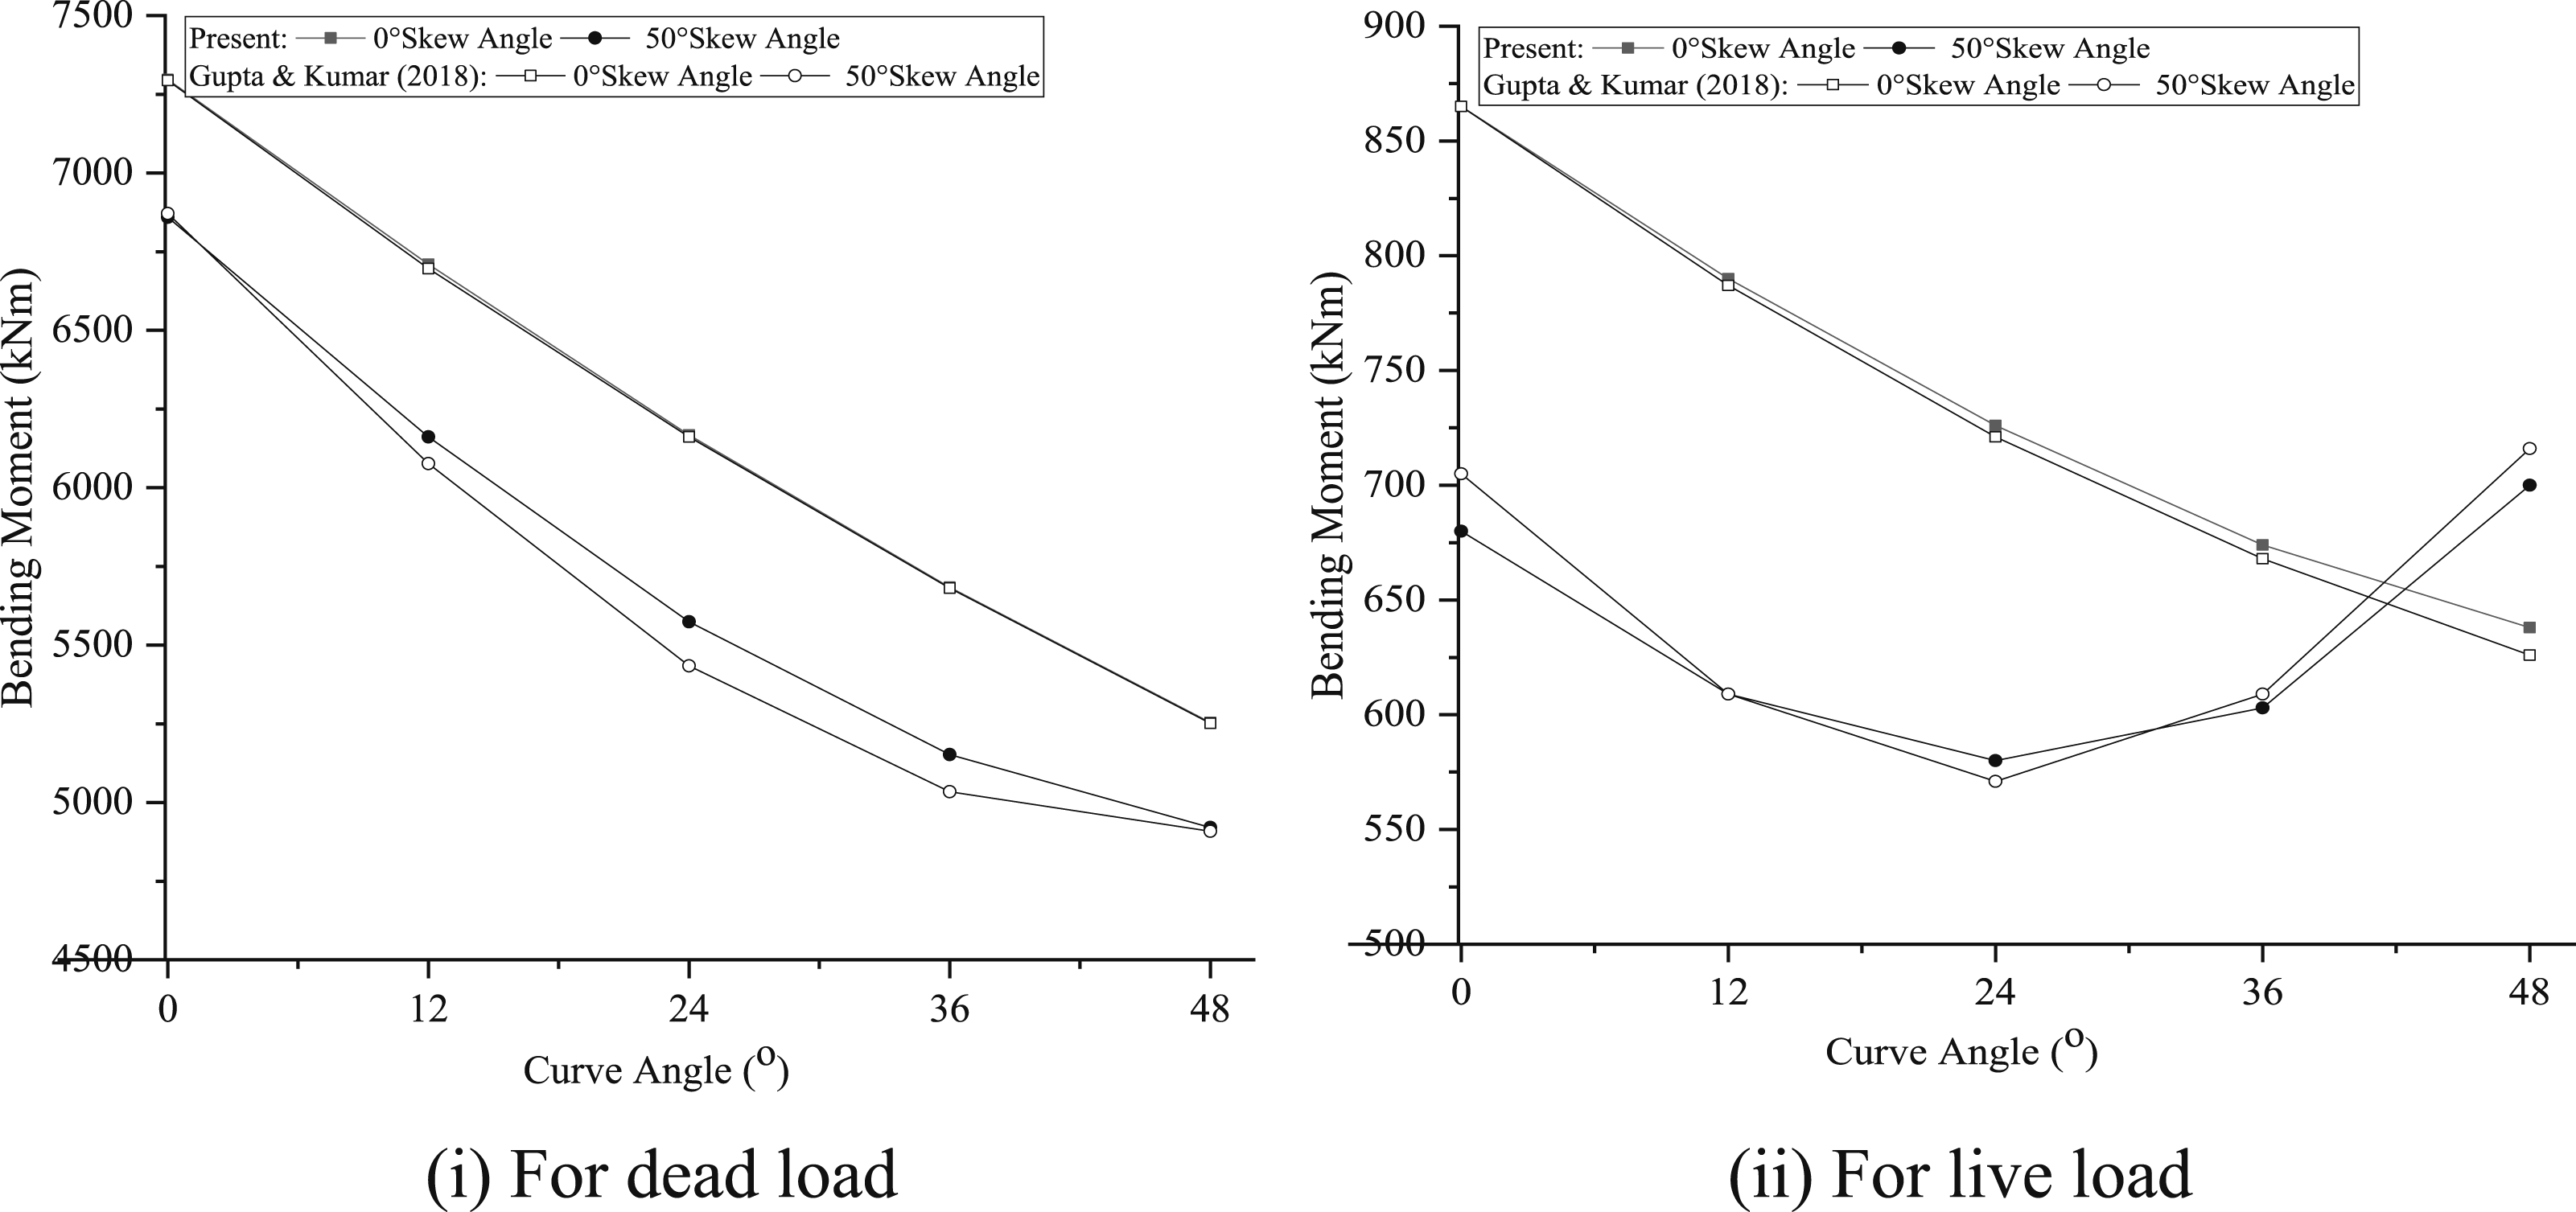
Furthermore, numerical results are validated by considering the results obtained by Gupta and Kumar (2018). A box-girder bridge, the Han-Jiang bridge at Shayang, located in Wuhan, China, with the following data is considered: Span length = 27.4 m; Width = 10.8 m; Overall depth = 2.96 m; Kerb on both sides of deck = 200 mm; Thickness of top flange = 250 mm; and Thickness of bottom flange = 280 mm. The material properties of concrete are: Poisson’s ratio = 0.2; Characteristic strength = 25 MPa; Density = 25 kN/m3; and Modulus of elasticity = 2.5 × 10⁴ MPa. The box-girder bridge is simply supported, that is, pin support bearing is provided at the left interior support and roller support bearing is provided at the remaining three supports. The box-girder bridge is analysed for both dead and live loads (the live load is assumed as a concentrated load and placed at 1.2 m from the kerb) as per the Codal provision. Four-noded shell element with six degrees of freedom at each node is used in finite element modelling. A Mesh size of 0.2 m in both longitudinal and transverse directions is considered. Figures 5 and 6 show the bending moment in the outer and inner girders subjected to dead load (DL) and live load (LL) for various curve angles. Effect of curve angle on outer girder bending moment. Effect of curve angle on inner girder bending moment.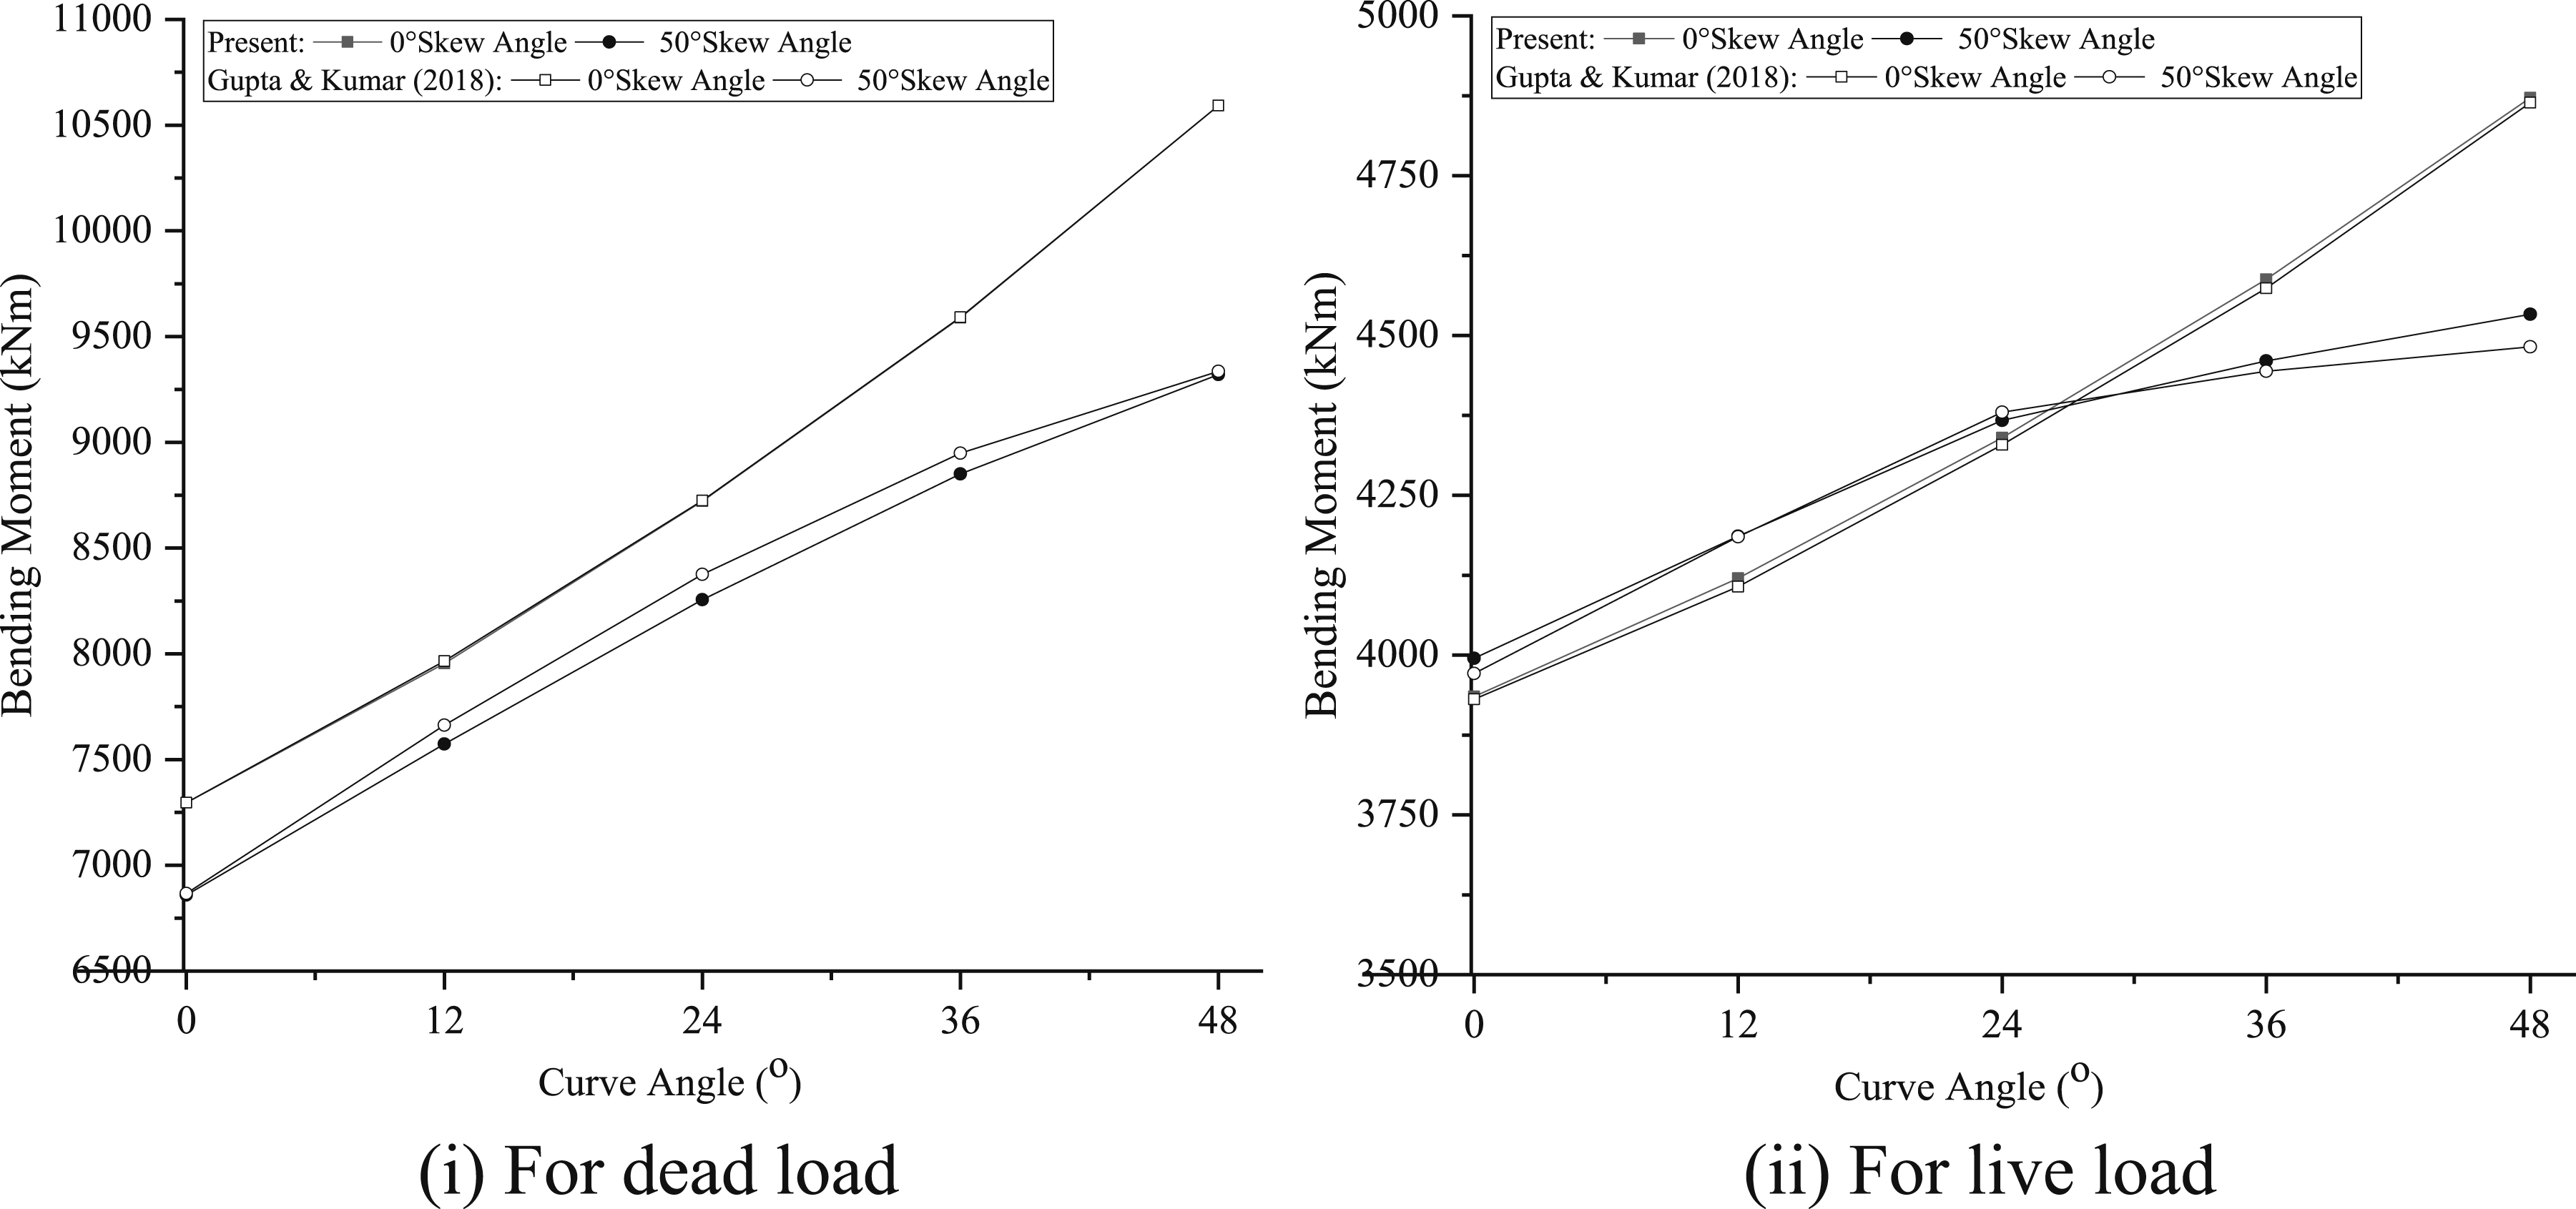
Modelling
This section describes the modelling of a skew-curved box-girder bridge for the present study.
Modelling approach
A FEM-based software, SAP2000v20, is used to model and analyse the bridge.
40
This makes it possible to simulate in detail whether the bridge will behave under different loads and boundary conditions. Also, the flow diagram of the study is shown in Figure 7. Flow diagram of the study.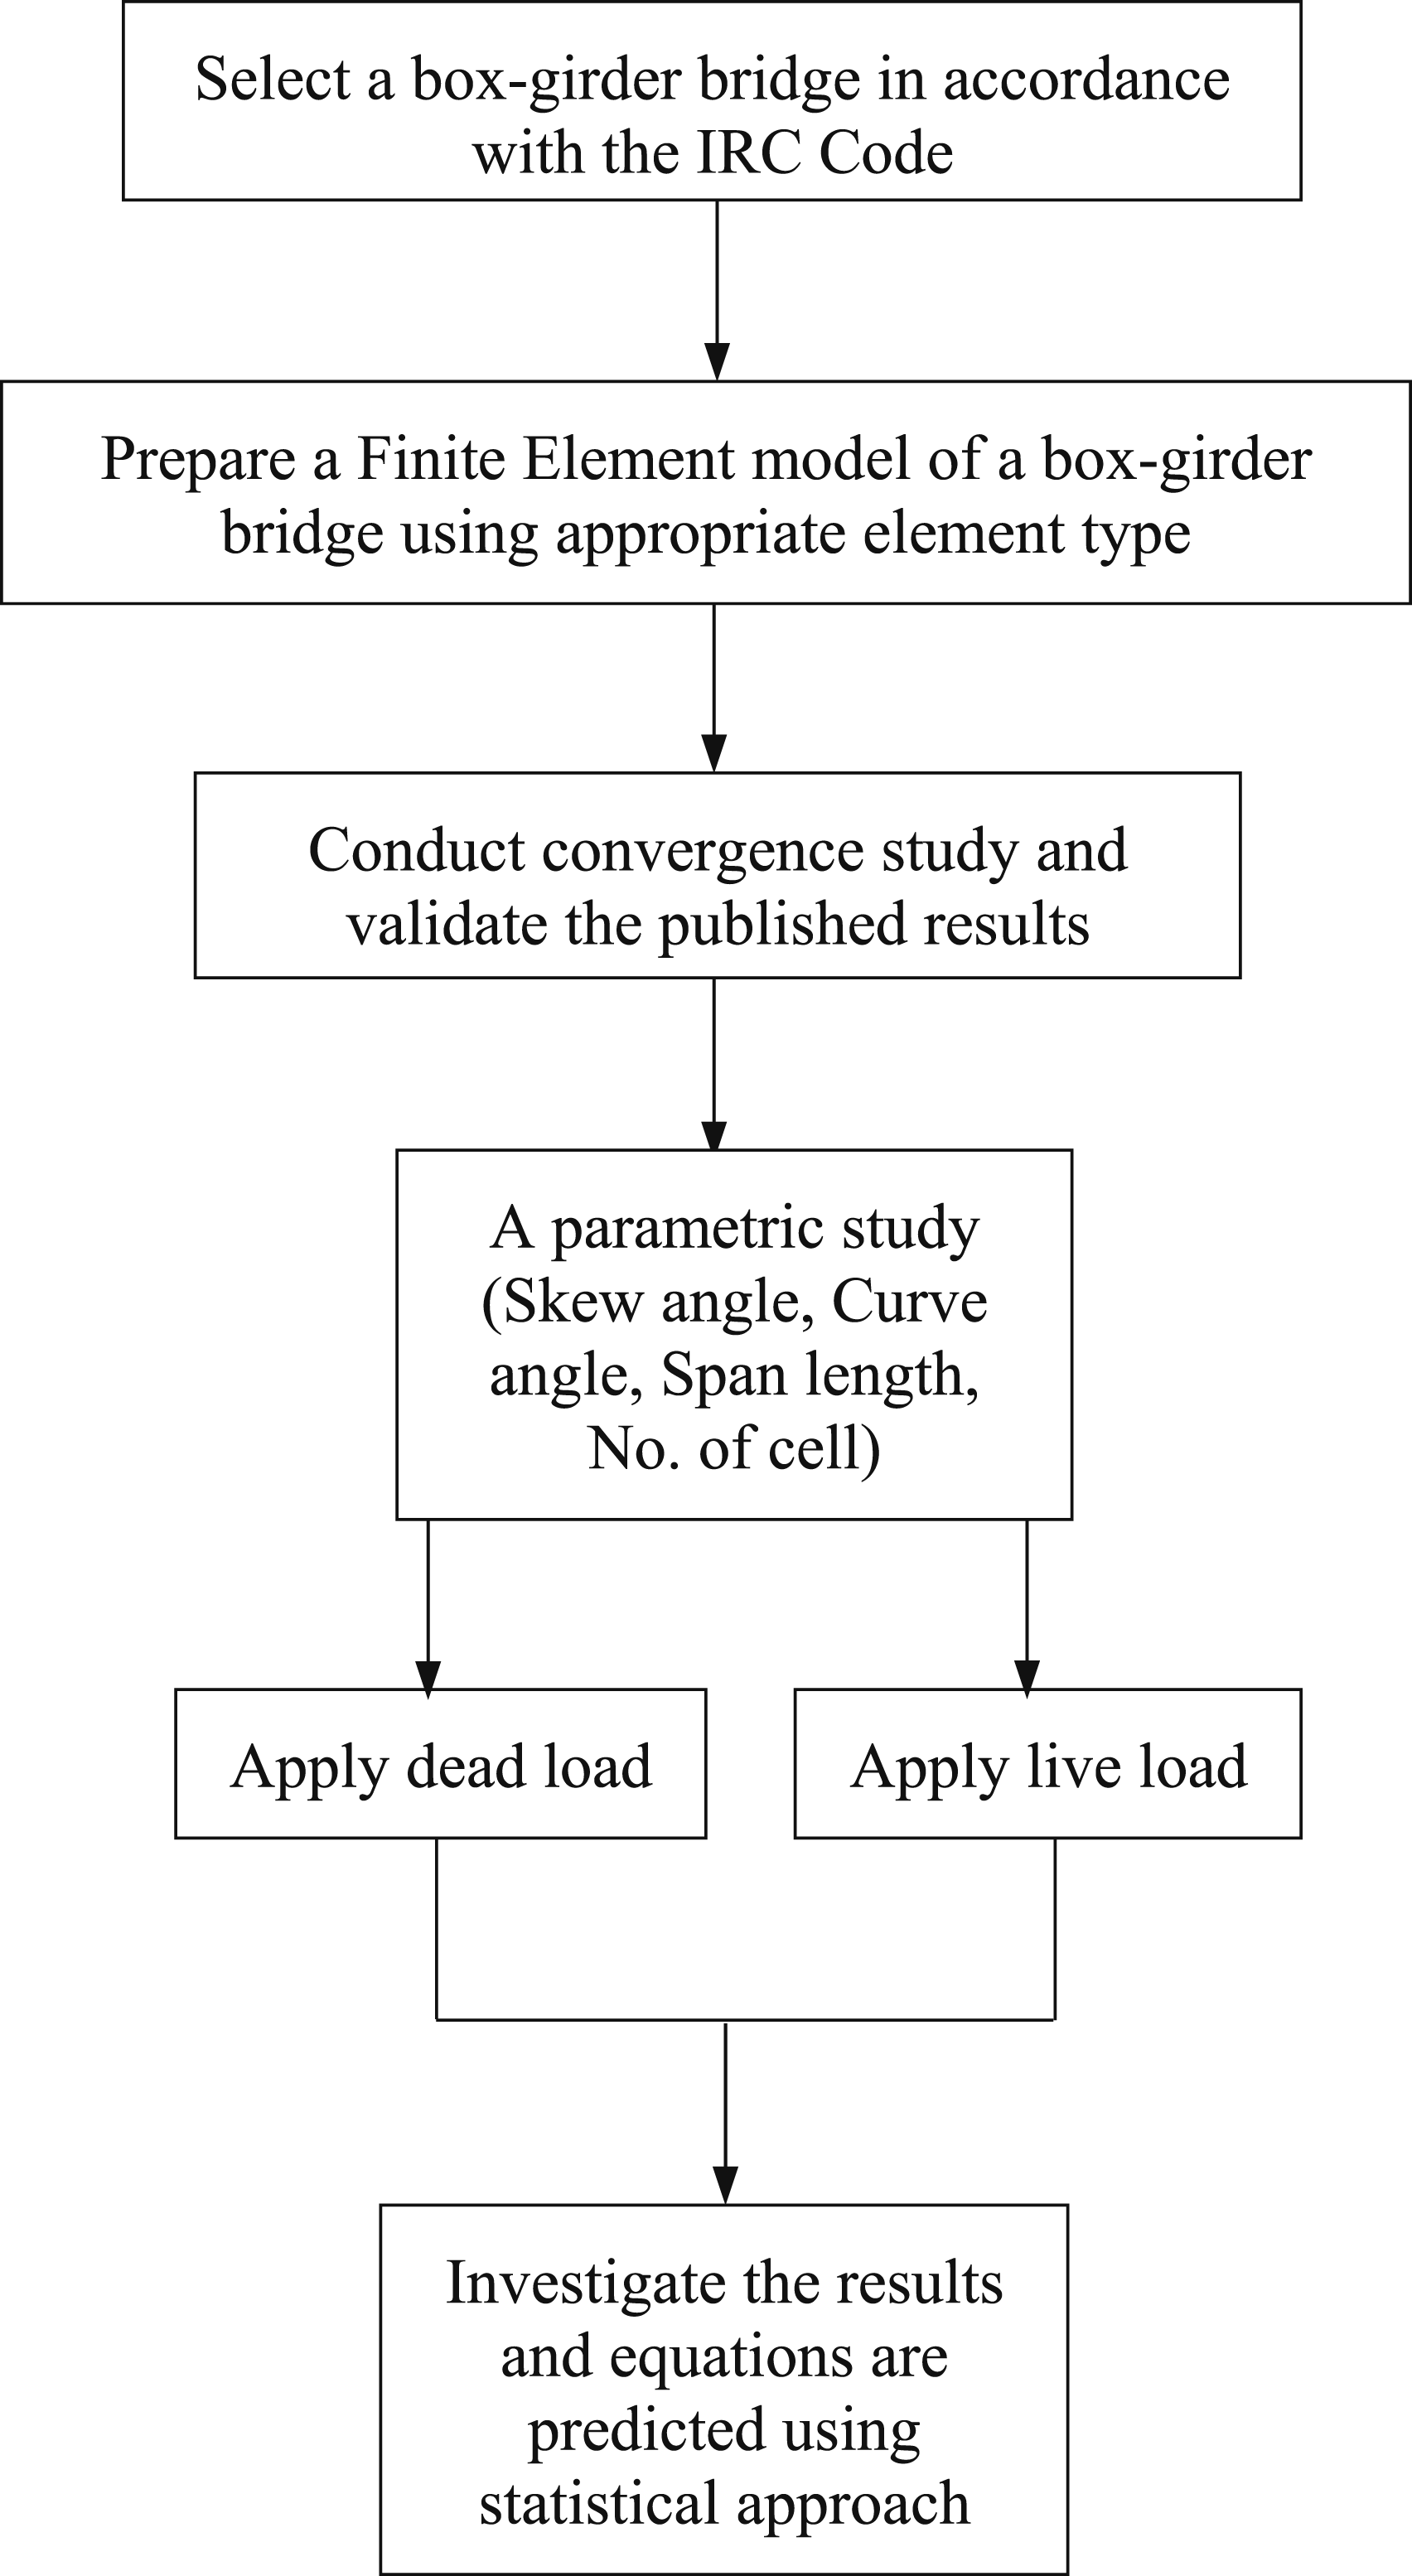
Material and Geometric Properties
Material properties.
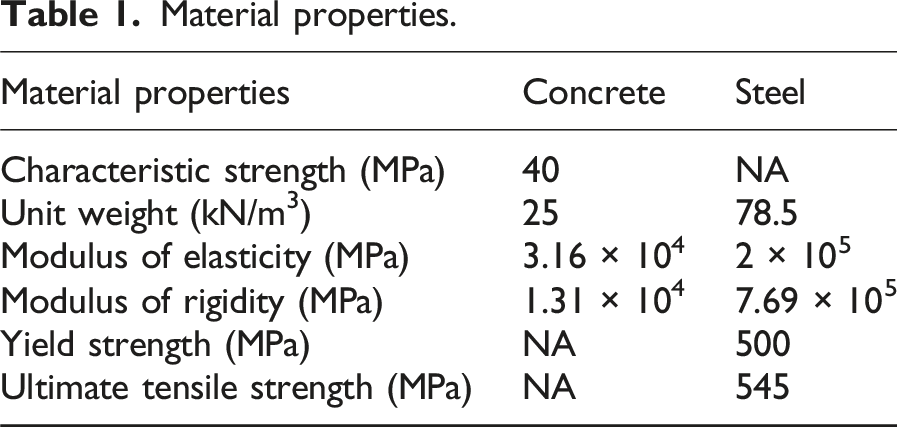
b) Geometric Properties: Initially, a single-cell box-girder bridge model is assumed, and an analysis for dead and live loads. The present analysis assumes a span length of 25 m and a span-depth ratio of 10. Cross-sectional area (A) = 6.42 m2 [Total width (B) = 11.5 m; Depth (D) = 2.7 m; Thickness of top flange (ttf), bottom flange (tbf), and web (tw) = 0.3 m], Moment of inertia (I) = 6.802 m4, Sectional modulus (Z) = 6.735 m3. Firstly, the cross-section is assumed for a single-cell box-girder bridge model and analysed for dead and live loads. After that, the same material of the cross-section is redistributed for the two-cell box-girder bridge and analysed. The cross-section of single and double cells is shown in Figure 8. Cross-section of box-girder bridges.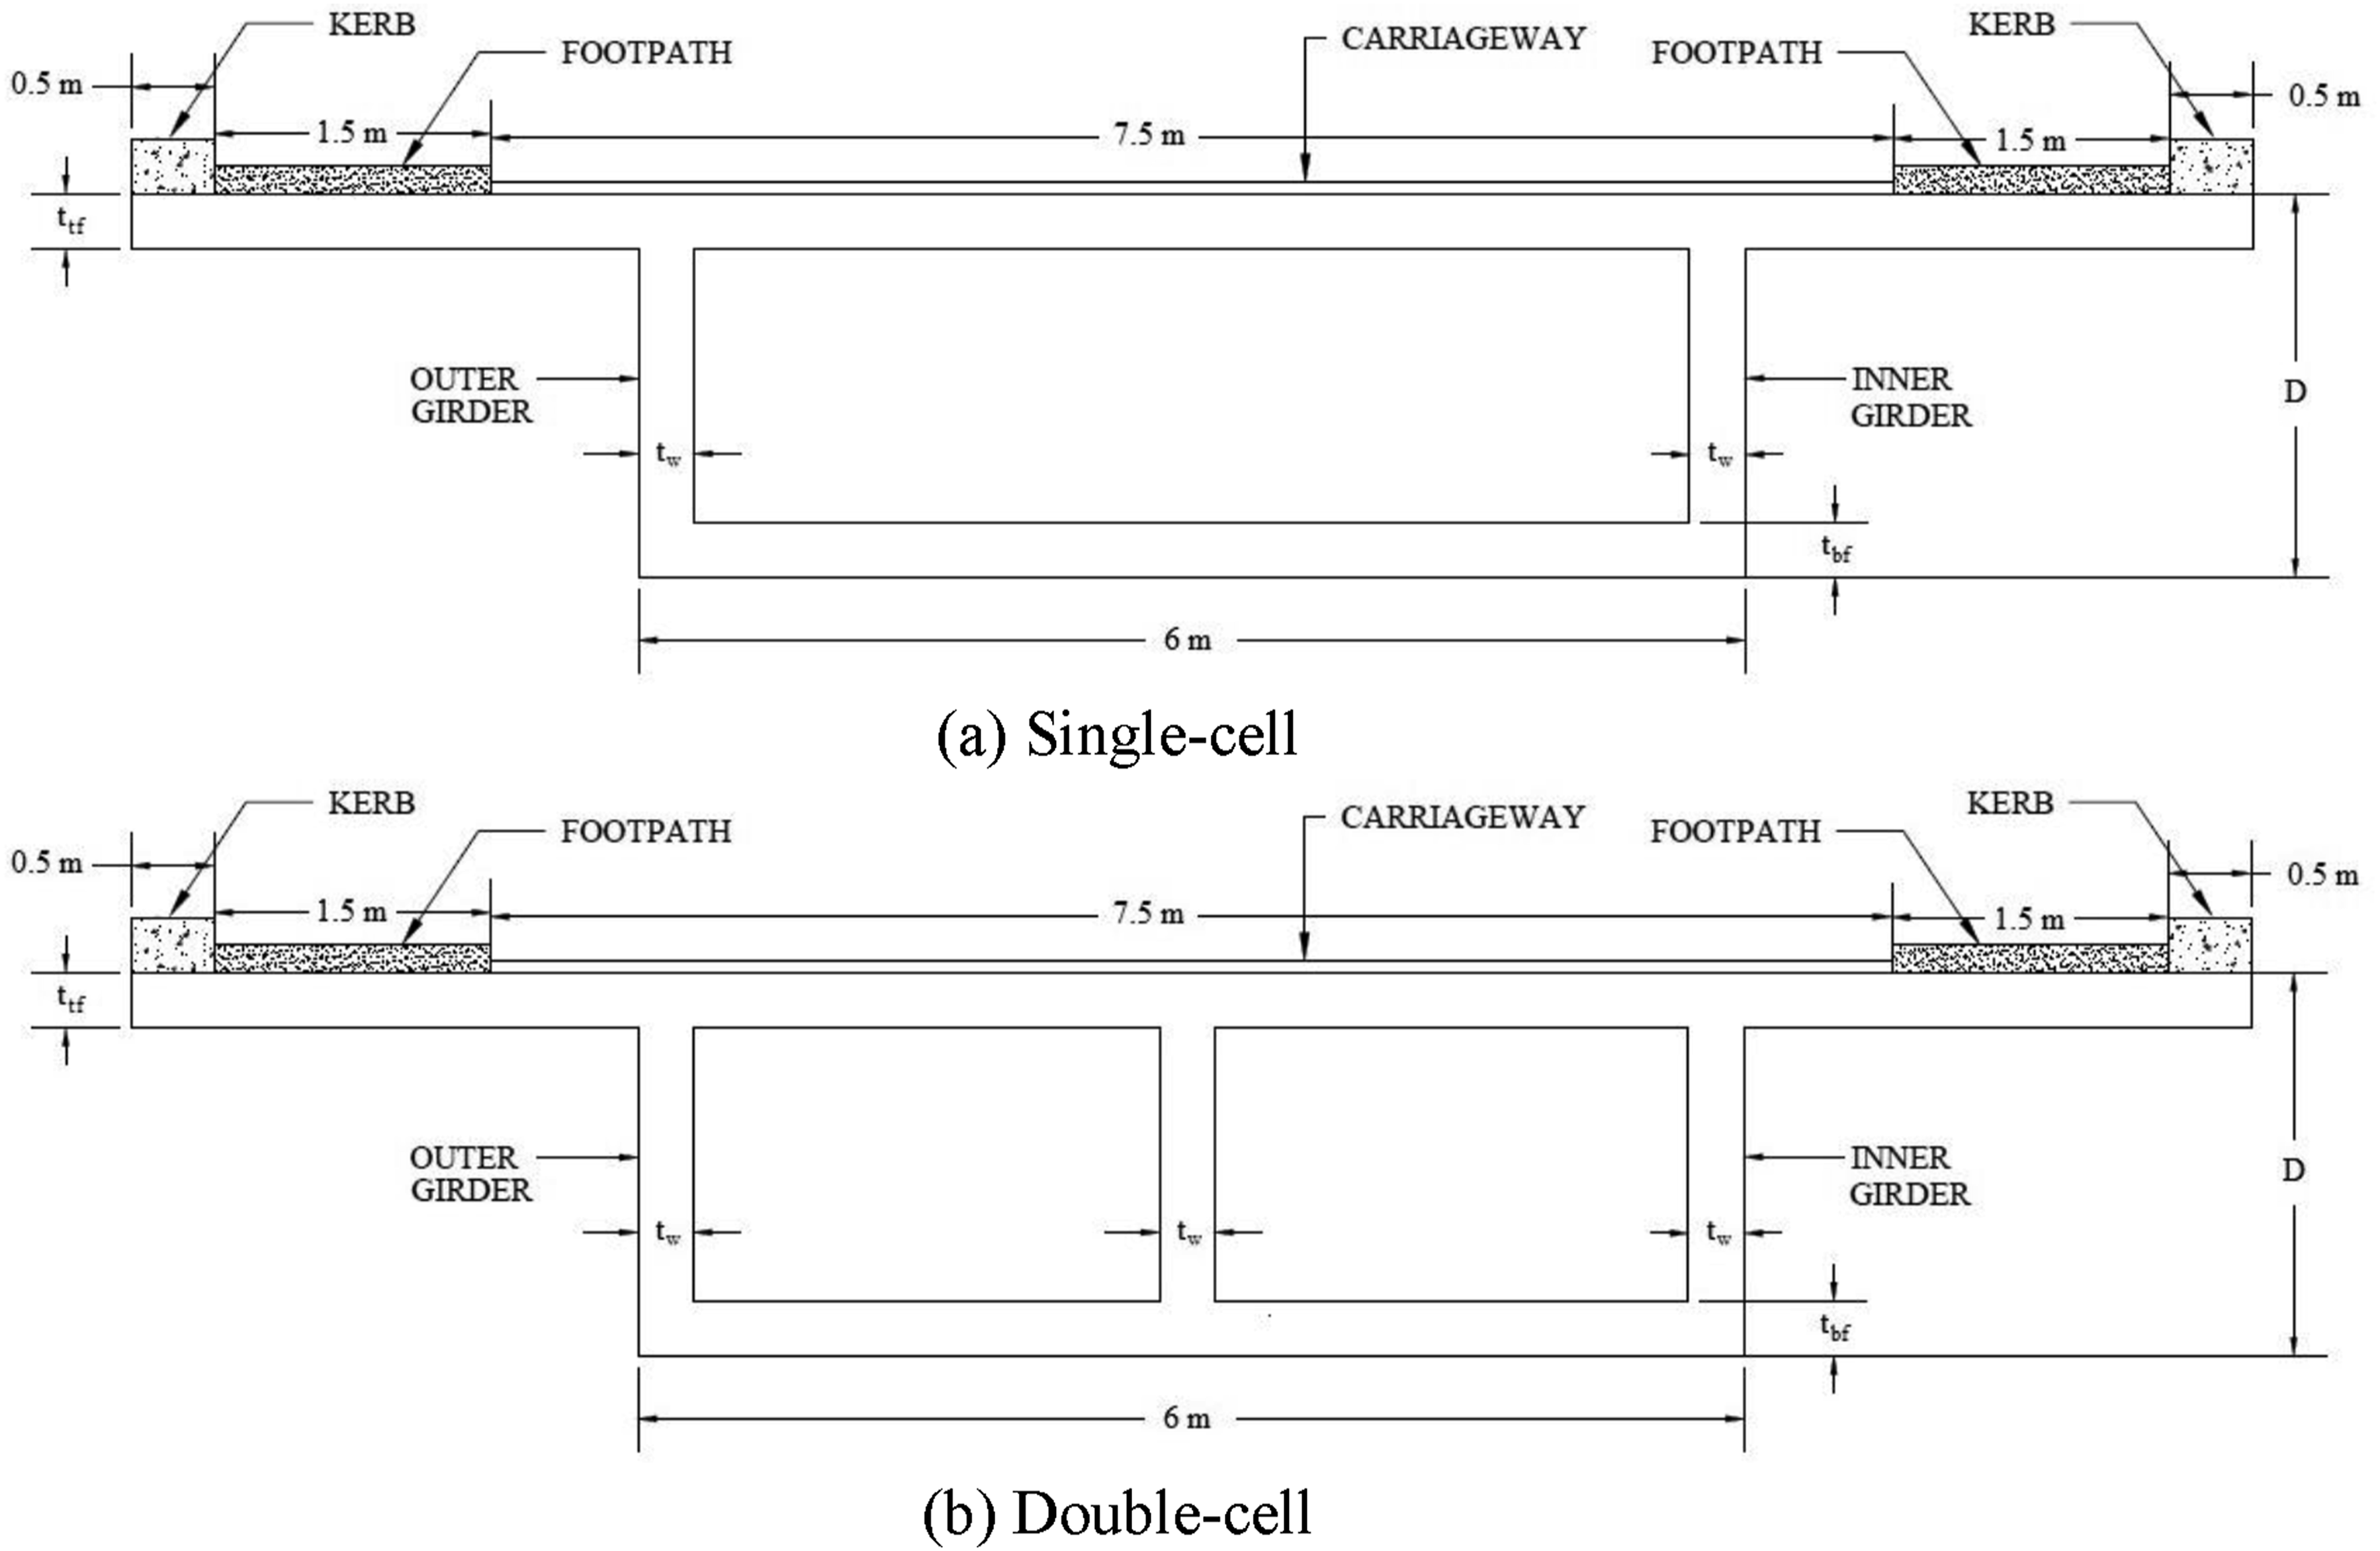
Codal provisions
Indian Road Congress (IRC): 6-2017: Standard Specifications and Code of Practice for Road Bridges, Section II: Loads and Stresses: Specific load types such as Class-70R, Class-AA, and Class-A are detailed, with corresponding load magnitudes and distribution patterns. 41 The results (stresses and deflection) are evaluated for combined dead and live (IRC Class 70-R track) loads.
Indian Road Congress (IRC): 21-2000: Standard Specifications and Code of Practice for Road Bridges, Section III: Cement Concrete (Plain and Reinforced): examination for bending stress (compressive stress = 13.33 MPa, tensile stress = 240 MPa) and vertical deflection (L/800).
42
If the results are within the limits specified in IRC:21-2000,
42
then the model is finalised, and the whole process is repeated until the results fall within the limits. As a result, the properties gained through the trial-and-error process are employed in the current study, which is as per the requirements specified in IRC:21-2000, which are as follows: 1. The minimum allowable span length for a box-girder bridge is 25 m, 2. The recommended span-depth ratio for a reinforced concrete bridge falls in the range of 17 to 18, 3. The girder must have a minimum thickness of 300 mm, 4. The cantilever arm length equals 45% of the distance between webs, 5. The minimum thickness of the soffit slab should be 1/20 of the distance between girders.
Design parameters
a) Loads: Dead load (self-weight) and live load as per IRC:6-2017, Clause no. 204.1 are considered in this study.
41
All Indian loading conditions – Class-70R track and wheel load, Class-AA track and wheel loads, and Class-A load – are applied to analyse the bridge models. Among these, the maximum forces and deflections are obtained for the Class-70R track load. So, IRC Class 70-R track load (Figure 9) is used for two lanes as specified in IRC:6-2017.
41
The location of the IRC Class 70R tracked load is critical for skew-curved bridges. The load is applied along the curved centroidal axis and laterally positioned according to IRC standards. For all designs, the torsion-critical condition occurred when the track load is placed near the inner curve. IRC Class 70-R track loading.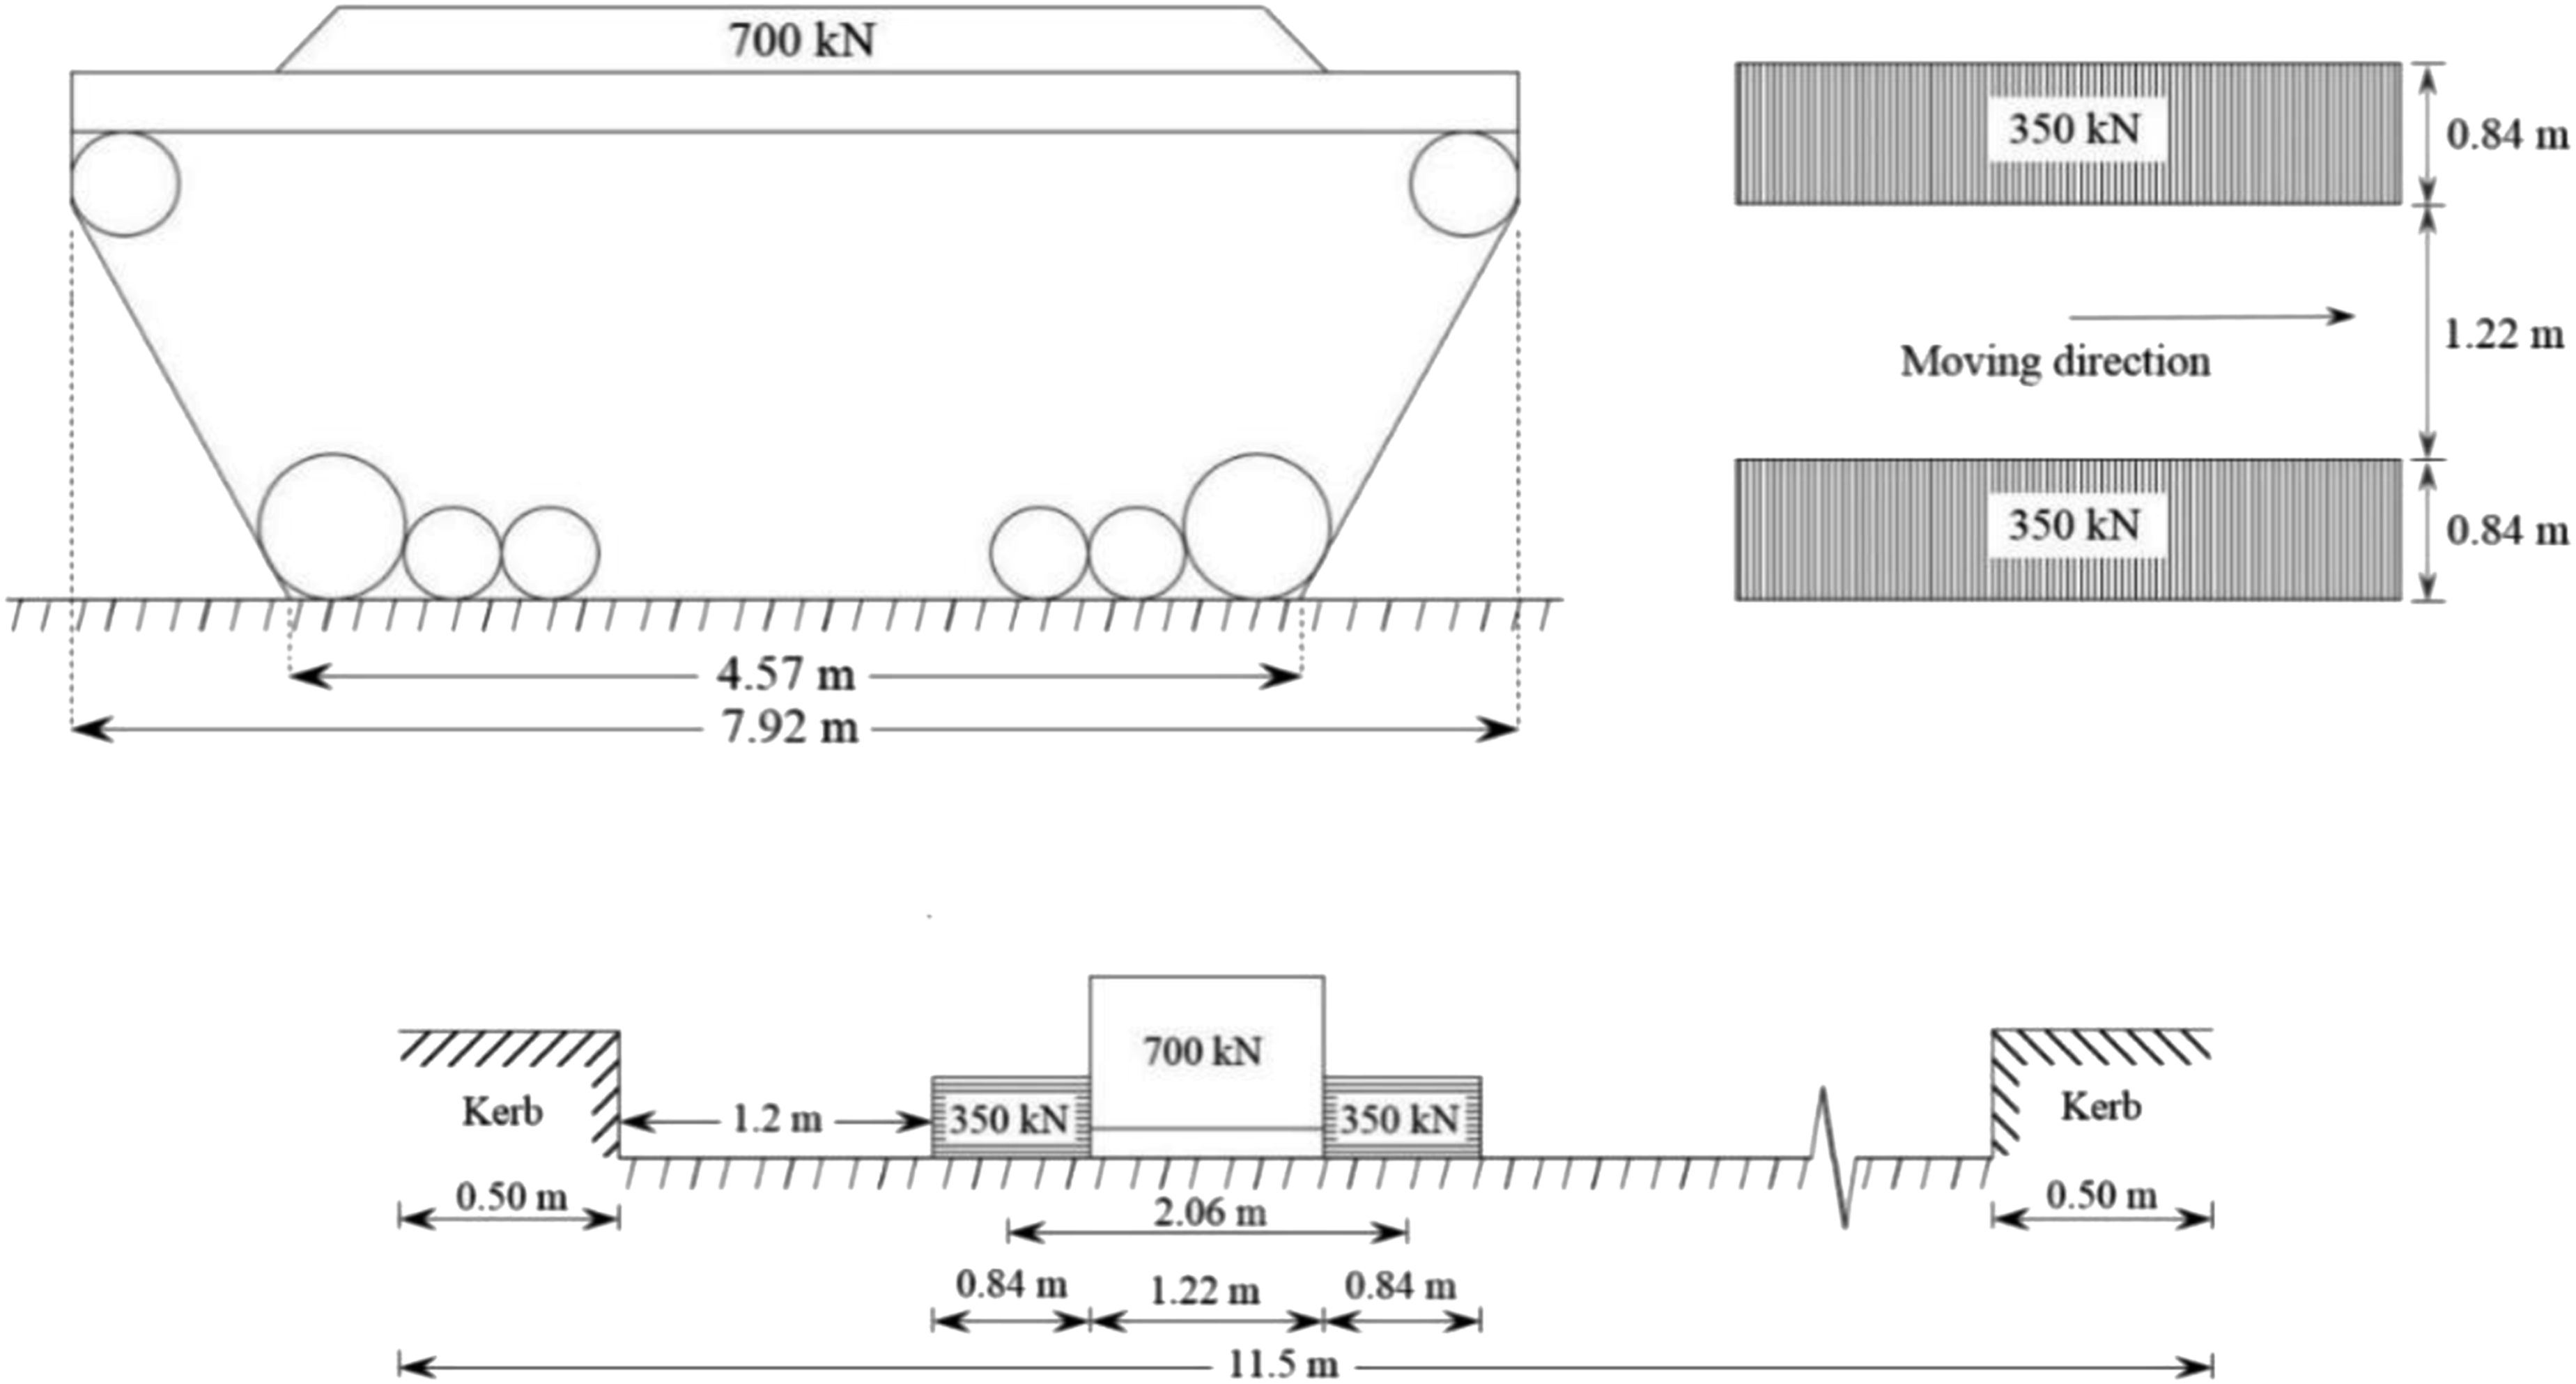
b) Mesh Size: To determine the mesh size required to achieve the most accurate solution approximation, a convergence analysis is performed. Plotting the maximum deflection against the mesh size allows for this. The mesh size of 100 mm is chosen for the further analyses as the results converge at 100 mm mesh size, as shown in Figure 10. The bridge is discretised using a four-noded shell element with six degrees of freedom (three translations and three rotations) at each node. The discretised model is depicted in Figure 11. Convergence study. Finite element model of box-girder bridges.
Boundary conditions
As shown in Figure 12, a simply supported boundary condition with two roller bearings on one end and two pin/hinge bearings on the other end is used to constrain the bridges. The constraint at the pin/hinge bearing is well defined that all the translations are restricted and all the rotations are allowed. The roller bearing is further provided, considering the overall stability of the structure. At the roller bearing, all the rotations are allowed, and the translation is only allowed in the longitudinal direction (more specifically, in the horizontal direction perpendicular to the abutment). Roller bearings are oriented parallel to the global longitudinal axis, allowing translation in the deck’s longitudinal direction while restraining transverse movement. The translation allowed at the roller bearing is depicted via two-headed arrows. The torsional effects came into the picture due to the present boundary conditions being constrained, as the whole structure is stable. This configuration avoids unintentional warping or differential rotation. As a result, the boundary conditions roughly reflect the actual support behaviour of skew-curved box-girder bridges. Boundary conditions.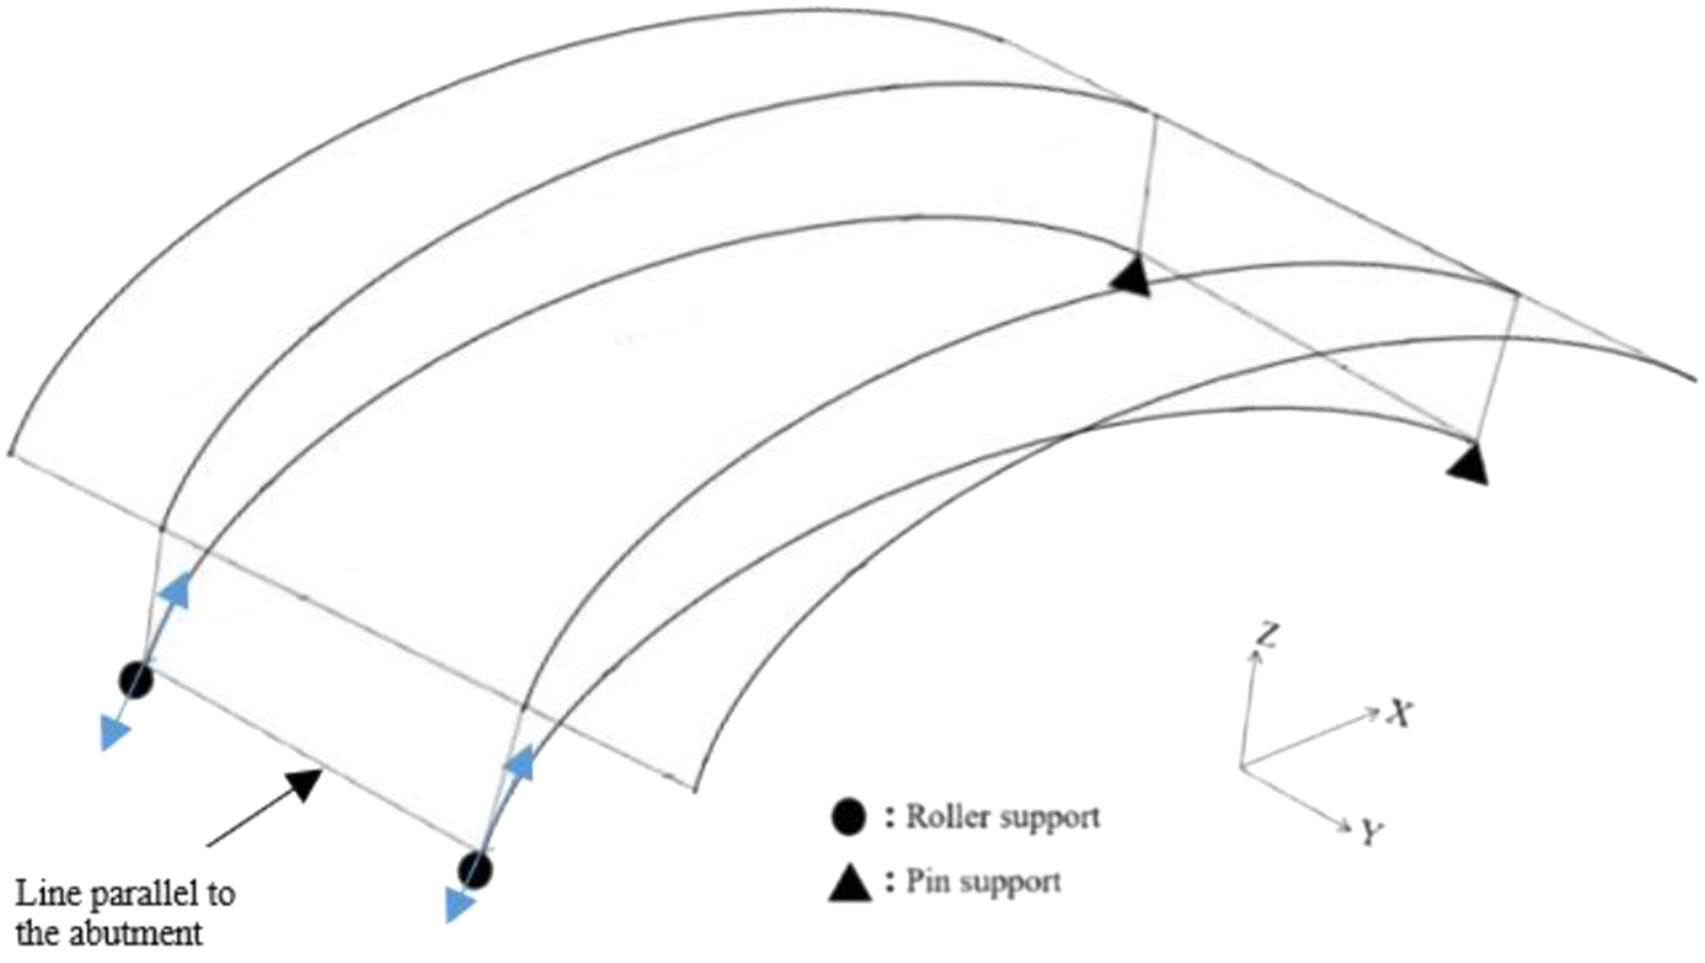
Connection details
The model is developed to accurately represent the connections between the girders and the deck slab. Four-noded shell elements and two-noded beam elements are used in finite element modelling to depict the concrete deck and reinforcing bars, as illustrated in Figure 13. Because the current work uses a linear elastic analysis, the reinforcing beams do not represent material nonlinearity or cracking. Their function is confined to providing correct stiffness distribution inside the RC section and preserving compatibility between the shell and beam components. Each node of the shell element is associated with six degrees of freedom, encompassing three translations and three rotations. Meanwhile, each node of the beam element possesses three degrees of freedom, including two translations and one rotation. Description of elements.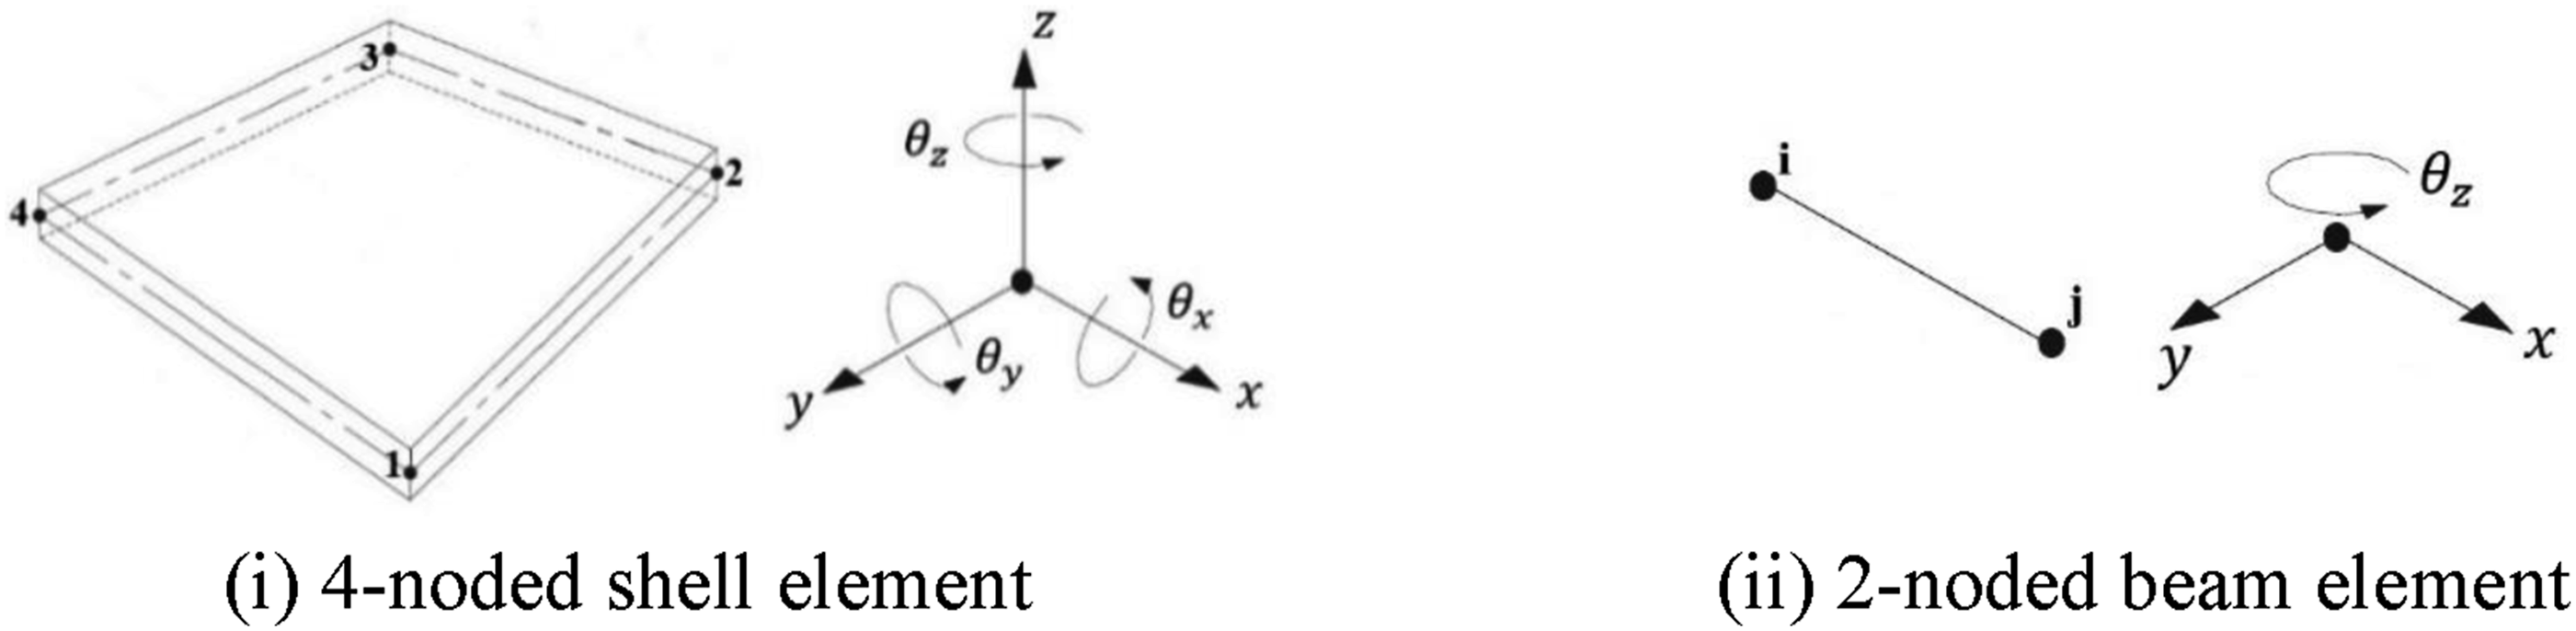
Results and discussion
The study investigates the effect of different parameters on the force and deflection ratios. The parameters include skew angles, θ (0°, 10°, 20°, 30°, 40°, 50°, and 60°), curve angles, α (0°, 12°, 24°, 36°, 48°, and 60°), span lengths, L (25, 30, 35, 40, 45, and 50 m), and the number of cells, N (1 and (2) while keeping the same amount of material. The chosen range of skew angles (0° to 60°) and curve angles (0° to 60°) reflects the practical bounds frequently used in worldwide literature and Indian bridge design practice. Because of significant torsional effects and challenges with load transmission, bridges with skewness greater than 60° are rarely built, even though curve angles greater than 60°. Finally, the equations for forces and deflection of skew-curved bridges are determined in the form of ratios. The next sections go into depth on how these parameters affect bridge forces and deflection.
Effect of span length (L)
The study investigates the impacts of span length, skew angle, and curve angle on bridge forces and deflection, employing ratios like BMRL. That is, the maximum bending moment across different span lengths of a skew-curved bridge under either DL or LL is compared to the maximum bending moment of a 25-meter straight bridge. Some live load (LL) analysis results are unavailable due to space constraints for load placement and manoeuvring, particularly for certain combinations as: (i) L = 25 m, θ = 60°, α = 36°, 48°, and 60°; (ii) L = 30 m, θ = 60°, α = 48°, and 60°; (iii) L = 35 m, θ = 60°, α = 48°, and 60°; (iv) L = 40 m, θ = 60°, α = 60°. As a result, the analysis and conclusions are solely based on the available data.
In this section, the design curves for two limiting cases, that is, θ = 0° and θ = 60°, are presented, as the nature of the design curves of all intermediate cases of skew angle does not change significantly. For different skew and curve angles, the variation of BMRL in both the girders under DL (BMRL,DL) with the span length of the bridge is shown in Figure 14. It is seen that skewed and non-skewed bridge girders (θ = 0) have a minimal increase in the bending moment under dead load because of curvature (BMRL,DL). Conversely, the span length has an important and non-linear effect on BMRL,DL. Regardless of the skew angle, the influence of curvature on BMRL,DL increases with span length in the outer girder, while it is negligible in the inner girder. However, compared to the curved bridge (Figure 14(a)), the rate of the increment in BMRL,DL with the span length decreases when the skewness is added to the curved bridge (Figure 14(b)). This can be observed from the BMRL,DL values at 0° skew and 60° curve (Figure 14(a)), and 60° skew and 60° curve (Figure 14(b)). It happens because the skew angle changes the load pathway and transfers a part of the dead load through torsion and transverse shear rather than pure longitudinal bending. Variation of bending moment ratio with span length for different curve angles under DL.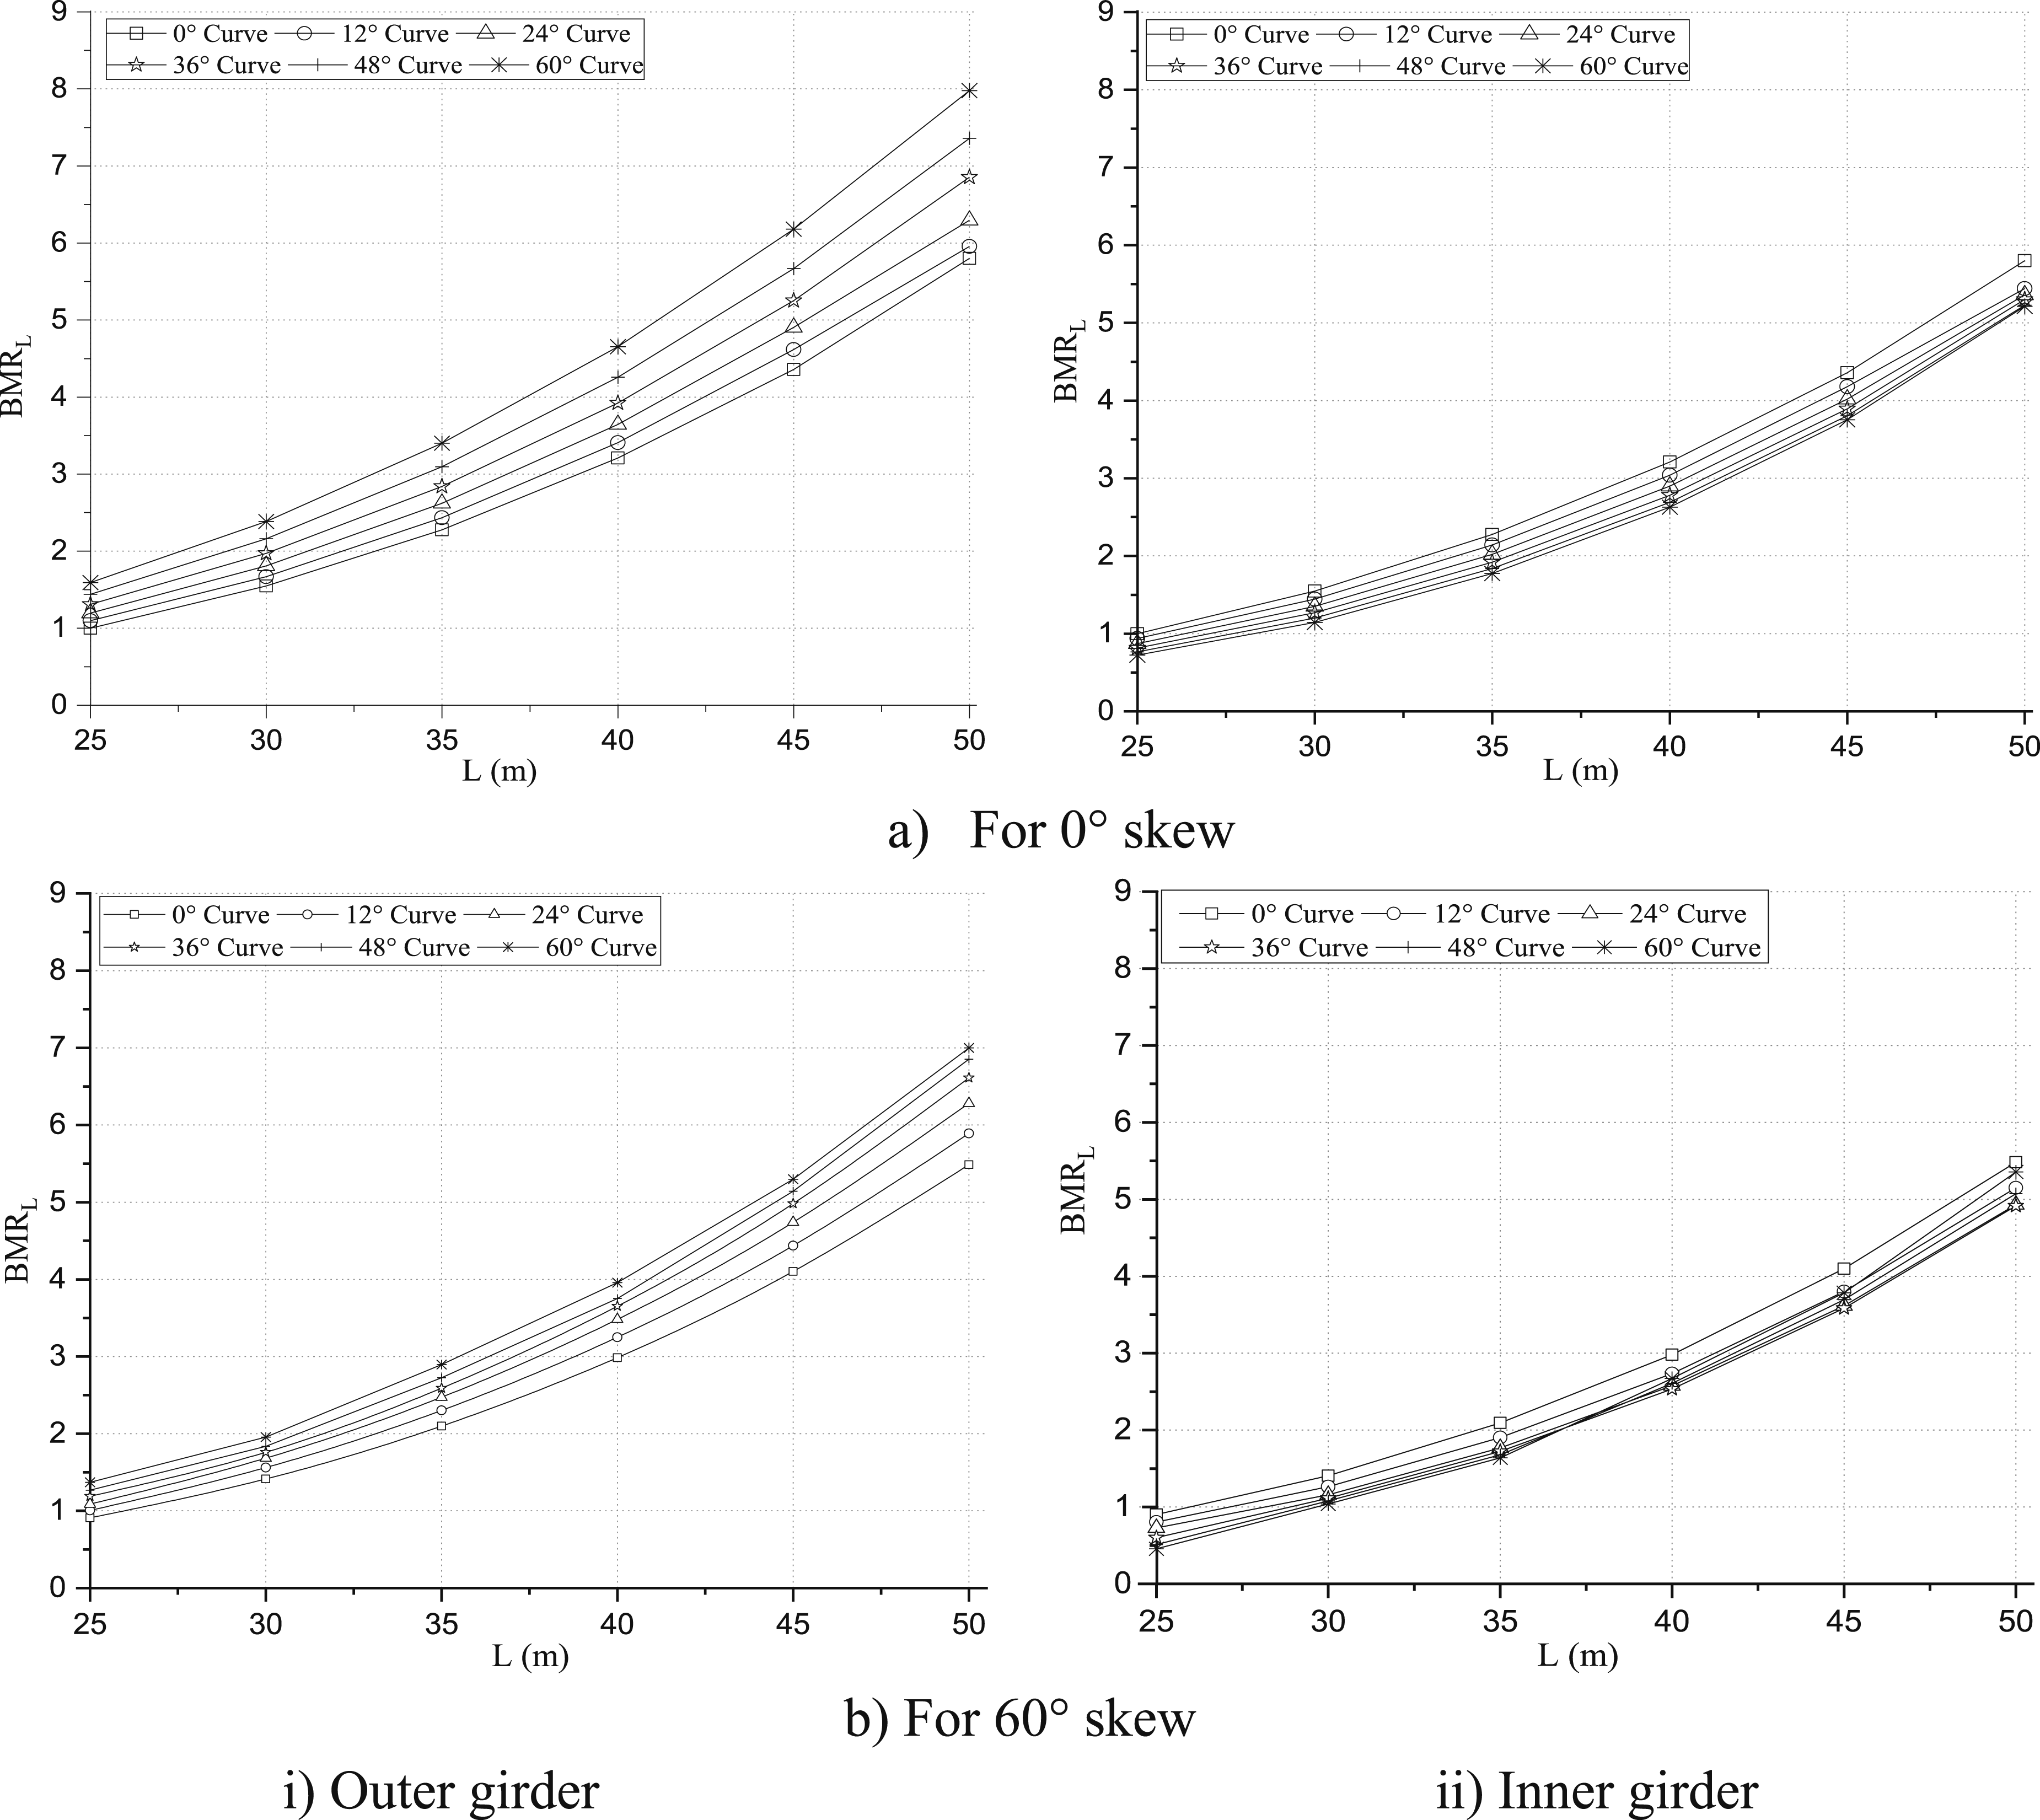
For the non-skewed bridge, the BMRL,DL in the outer girder increase by about 6 to 8 times relative to the straight bridge, and in the inner girder by about 6 times, as the span length and the curve angle rise. Regarding the combined effect of skewness and curvature, it has been discovered that for a skew-curved bridge, the BMRL,DL in the outer girder increase by about 5.5 to 7.0 times for a similar variation, while decreasing by about 5.5 times for the inner girder.
The variation of BMRL under LL (BMRL,LL) with span length is exposed in Figure 15. Although the span length has nearly a linear impact on BMRL,LL in bridges. It has a much smaller impact on BMRL,LL than it does on BMRL,DL, because live loads are not evenly distributed and are concentrated. The BMRL,LL increases significantly with the curve angle. For the outer girder, the curve angle and span length have a more pronounced effect, whereas their impact is relatively less on the inner girder. Due to curvature, the live loads move towards the outer girder, resulting in more bending moment. However, the BMRL,LL in both girders of the skew-curved bridge decreases slightly with the skew angle. Therefore, the magnitude of BMRL,LL in both the outer and inner girders is reduced when skewness is included in curved bridges. The BMRL,LL in the outer girder of a non-skewed bridge (θ = 0°) increases from 2 to 2.5 times to about 1.7 times as the span length and curvature increase. When the span length and curvature are increased for a bridge with a 60° skewness, the BMRL,LL for the outer girder of the bridge rise by nearly 2 to 2.4 times, while it decreases by about 1.6 times. Variation of bending moment ratio with span length for different curve angles under LL.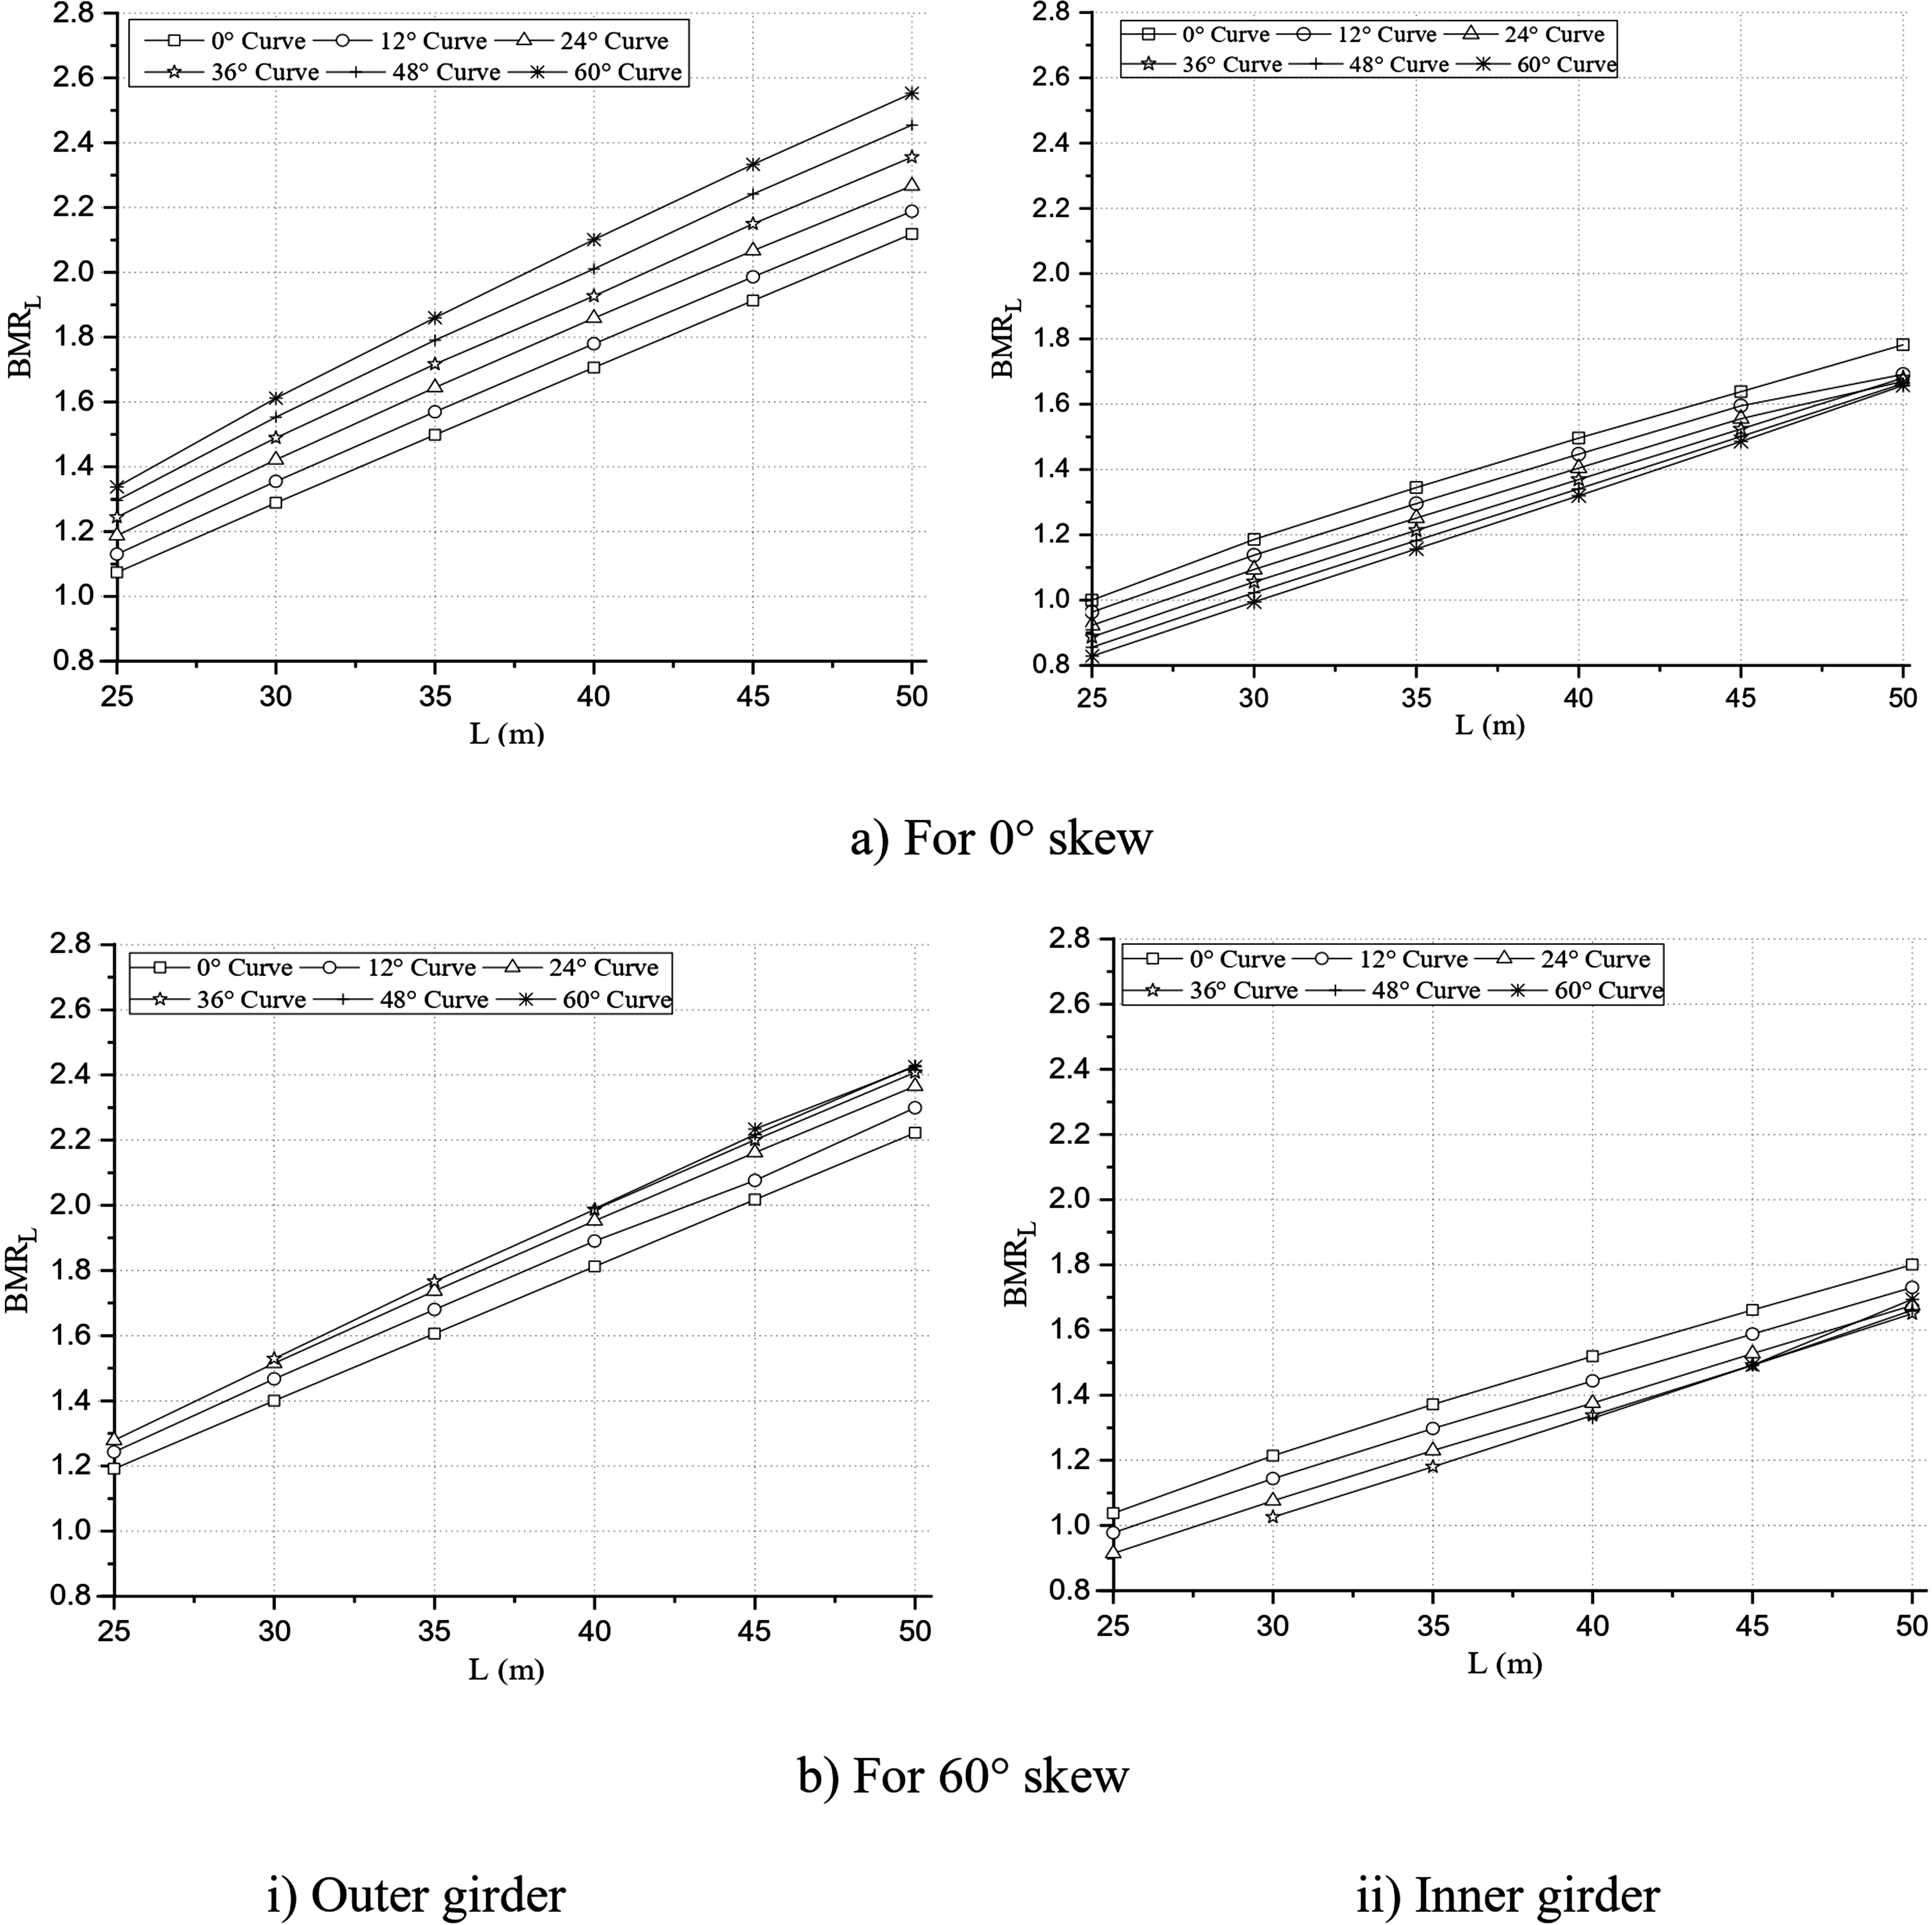
Figure 16 depicts the variation of SFRL for various skew and curve angles in both the girders under DL (SFRL,DL) with the span length. The SFRL,DL is seen to increase with the span length in both the girders of skewed and non-skewed bridges, but this increase is more pronounced for the outer girder. Regardless of the skewness, as span length increases, so does the impact of curve angle on SFRL,DL in the outer girder.; however, these effects are minimal for the inner girder. For span lengths under 35 m in the inner girder of a non-skewed bridge (Figure 16(a)), the SFRL,DL decreases up to a 48° curve angle before increasing, whereas for a skew-curved bridge (Figure 16(b)), it decreases up to a 24° curve angle before increasing. The increasing curvature causes considerable torsion and twisting beyond a certain curve angle (48° for non-skewed bridges and 24° for skewed bridges), which shifts some of the load towards the inner girder and raises SFRL,DL again. Because skewness increases torsional effects and accelerates load redistribution across girders, this transition already happened at a smaller curve angle in skew-curved bridges. With the skew angle in both girders of the skew-curved bridge, the SFRL,DL rises significantly. So, the inclusion of skewness in curved bridges increases the magnitude of SFRL,DL, both in outer and inner girders. Skewness causes the supports to become non-orthogonal, which results in load components acting diagonally and producing more transverse and torsional shear effects. Both girders experience increased total shear demand as a result, especially the outer girder, where curvature effects are more pronounced. This can be observed from the SFRL,DL values in the outer girder at 0° skew and 60° curve (Figure 16(a)) and 60° skew and 60° curve (Figure 16(b)). Variation of shear force ratio with span length for different curve angles under DL.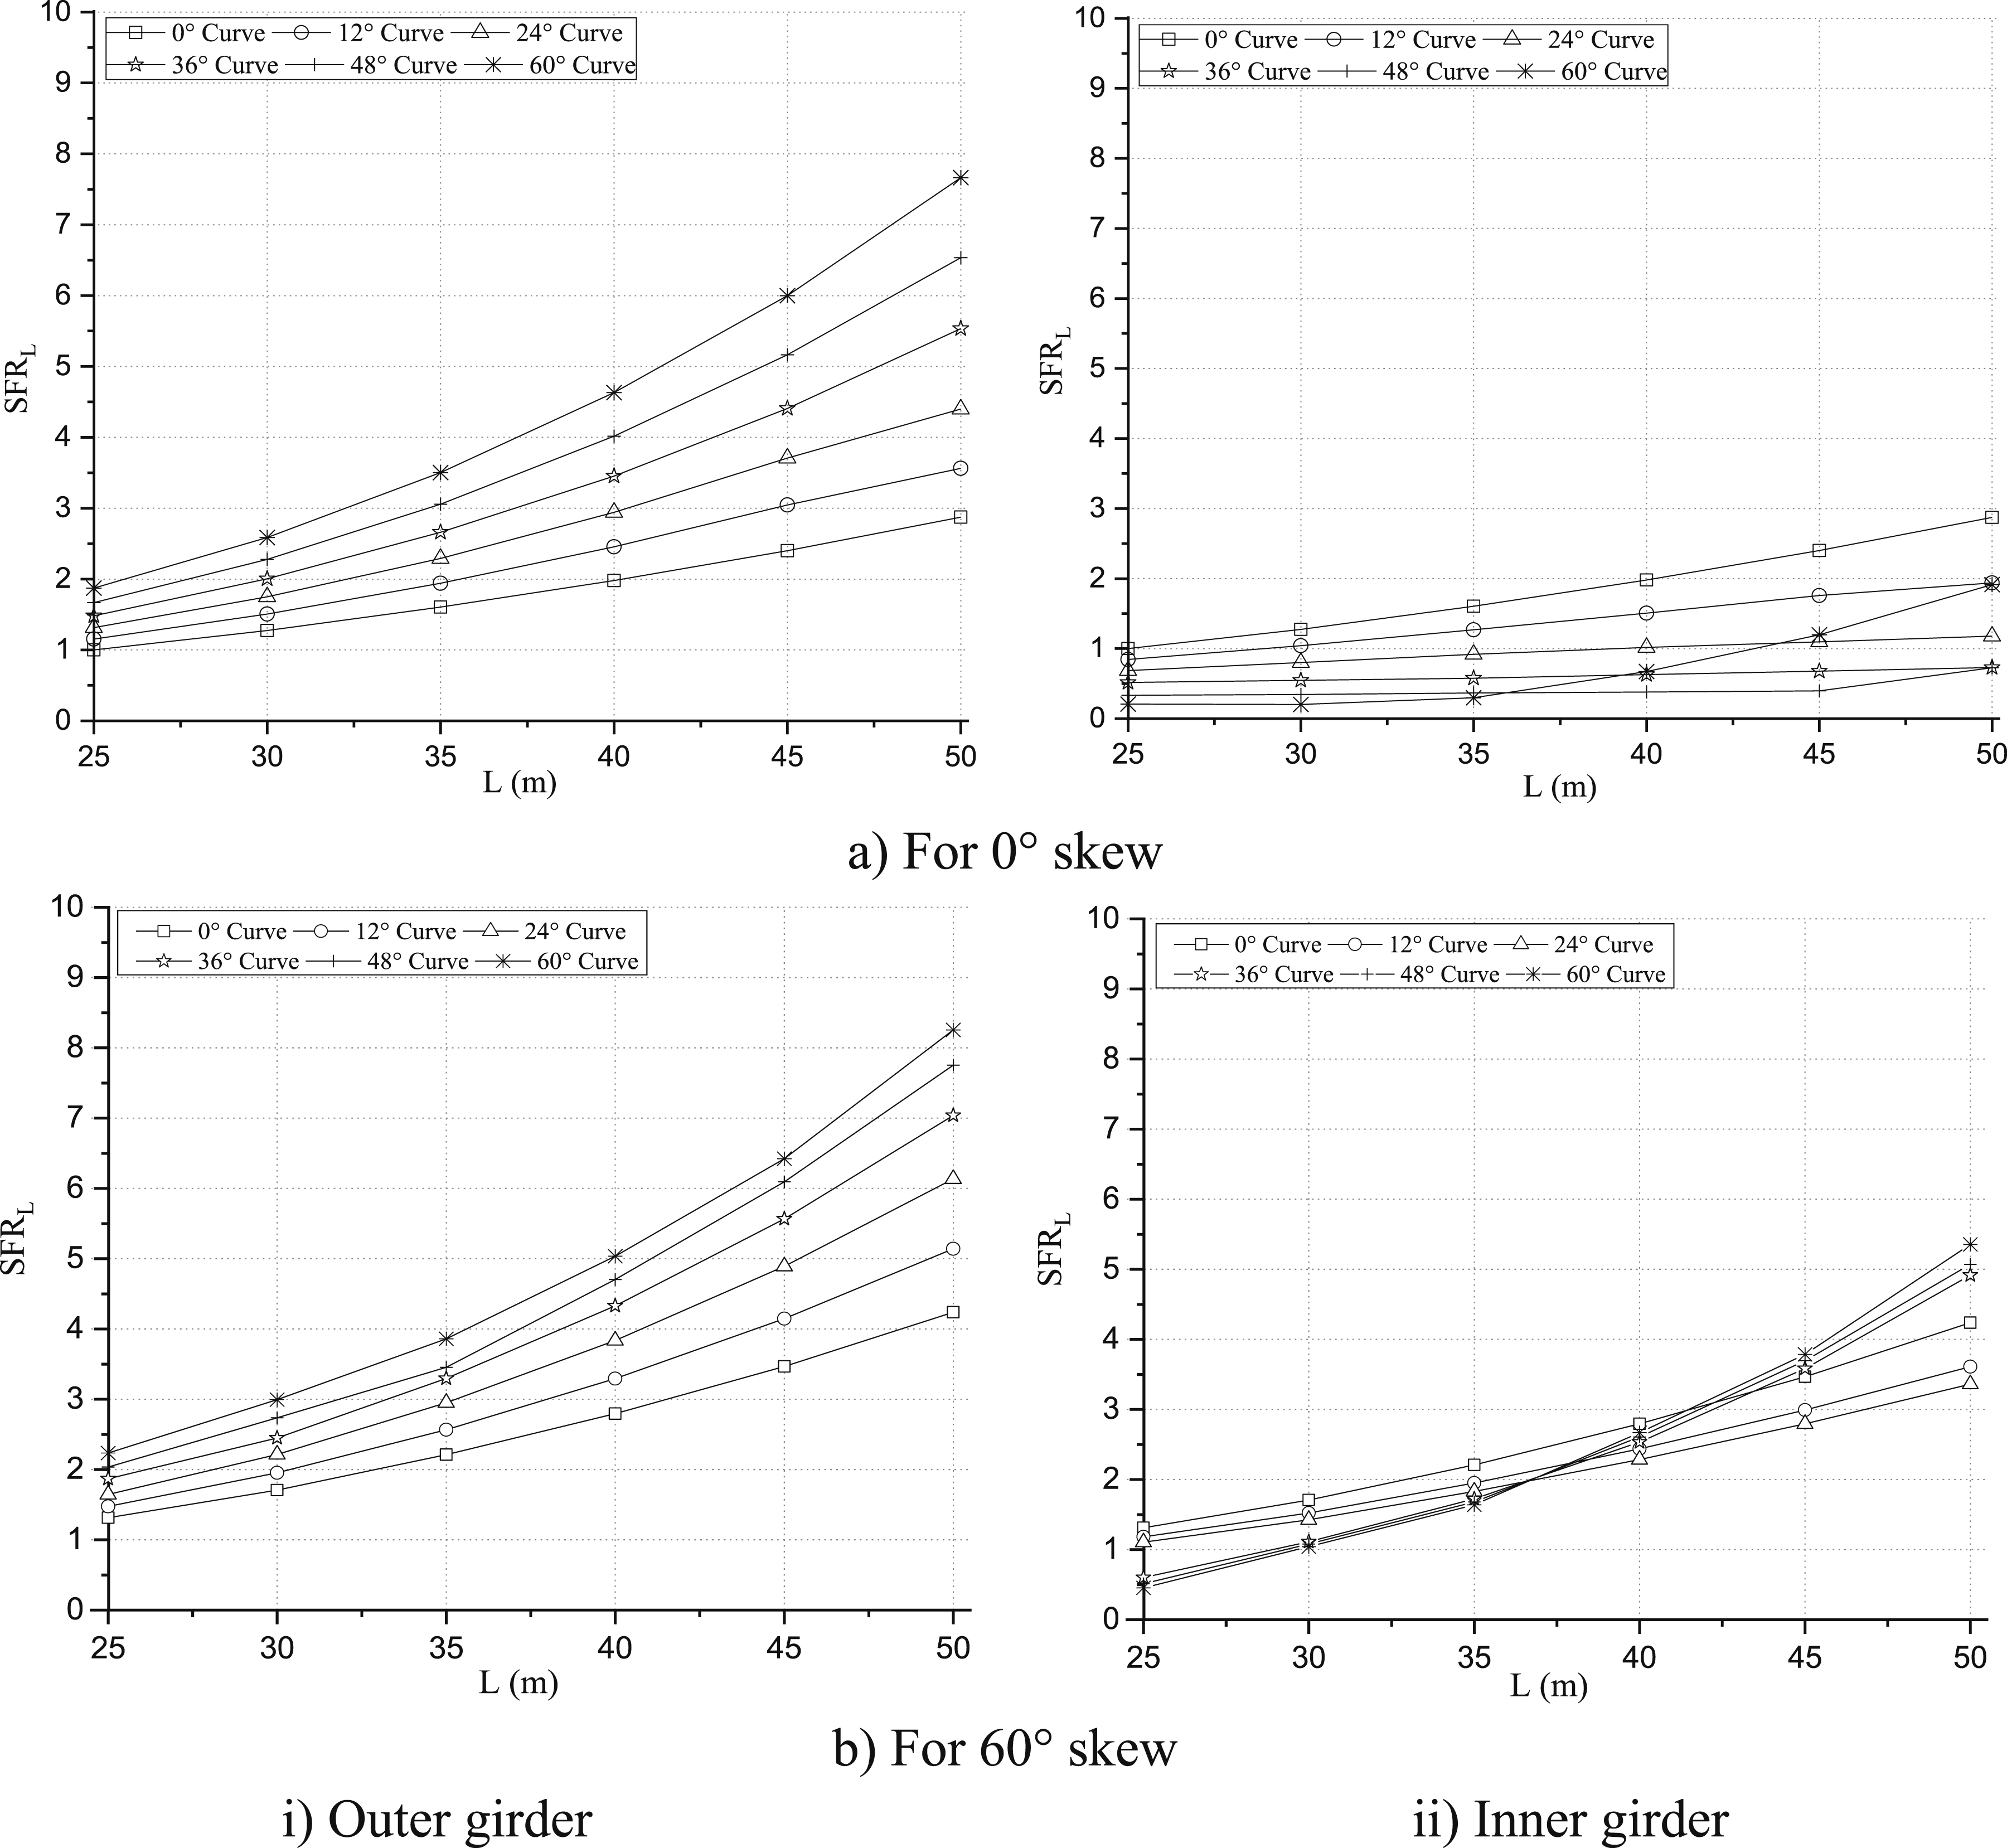
The SFRL,DL for the outer girder of a non-skewed (θ = 0°) increases from about 3 to 8 times to about 1.3 times as the span length rises from 25 to 50 m and the curvature rises from 0 to 60°. For a bridge with a 60° skewness, the SFRL,DL for the outer girder rises by about 4 to 8.5 times, while for the inner girder it rises by about 3 to 5.5 times for the same variation in span length and curve angle.
The variation of SFRL due to LL (SFRL,LL) with the span length for different skewness and curvature is presented in Figure 17. In the outer girder, SFRL,LL is seen to increase with the curve angle while slightly decreasing in the inner girder. Since live loads act over small areas, their effects are highly dependent on the load’s location rather than the span’s overall length. For both non-skewed and skewed bridges, the SFRL,LL rise significantly in the outer girder, due to load moving outward. In the outer girder, the effect of the curvature and span length is greater. As the span length rises, the rate of the rise in SFRL,LL in the outer girder of the skew-curved bridge (Figure 17(b)) over the curved bridge (Figure 17(a)) decreases when the skewness is added. In the inner girder of the skew-curved bridge, the impact of skewness is negligible. The load path becomes more diagonal when skewness is applied, creating torsional effects that redistribute shear. This is evident from the SFRL,LL values, which are approximately 1.8 and 2, respectively, at 0° skew and 60° curve (Figure 17(a)) and 60° skew and 60° curve (Figure 17(b)). Compared to SFRL,DL, SFRL,LL is significantly less affected by span length. Variation of shear force ratio with span length for different curve angles under LL.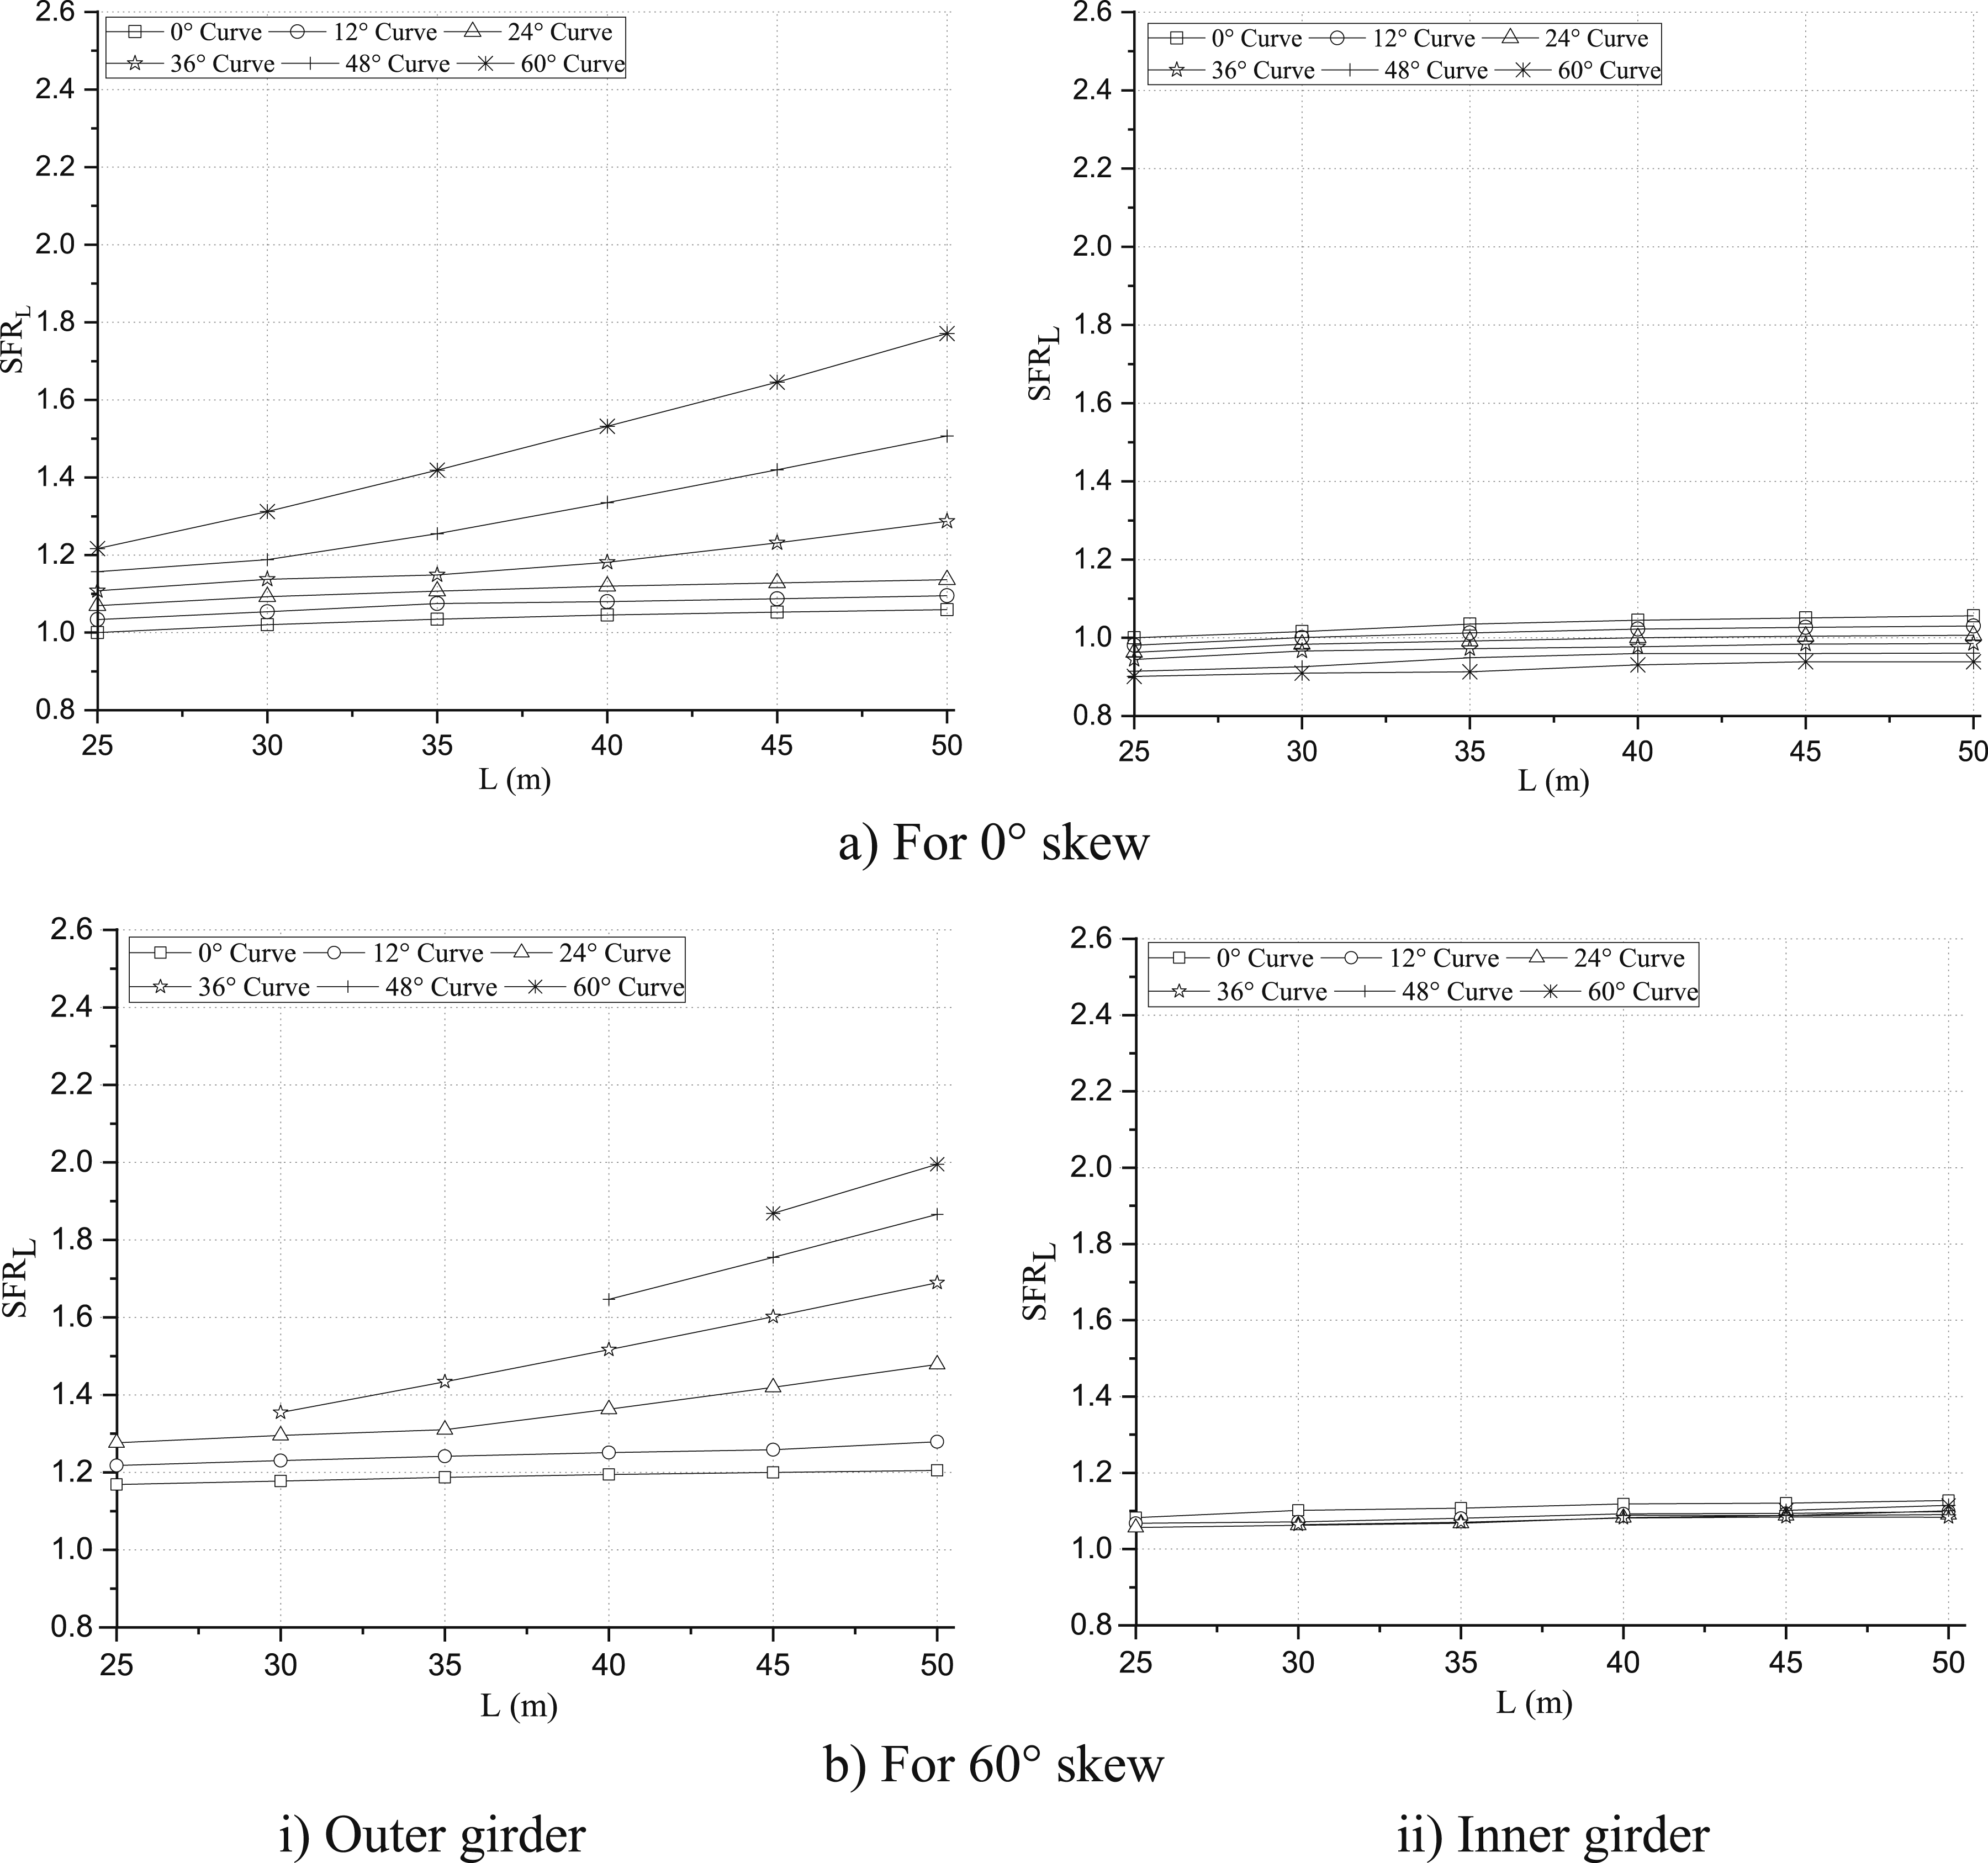
When the span length and curvature are increased, the SFRL,LL in the outer girder of a non-skewed bridge rises by about 1 to 1.8 times, whereas it is negligible in the inner girder. The SFRL,LL in the outer girder of the bridge rises by about 1.2 to 2 times, whereas it is negligible in the inner girder.
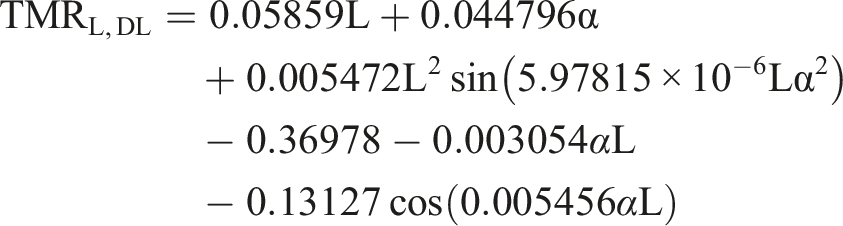
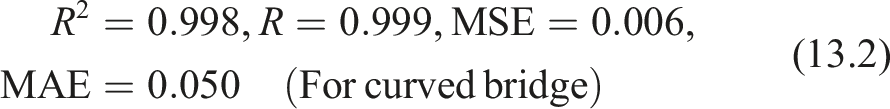
The variation of TMRL in both girders caused by DL (TMRL,DL) with the span length having varying skewness and curvature is shown in Figure 18. It is found that in both skewed and non-skewed bridges, the TMRL,DL increases substantially and non-linearly with span length. The TMRL,DL in both girders considerably rises with the curve angle. Regardless of the skew angle, the impact of the curvature on TMRL,DL increases with the span length. These factors intensify the twisting and warping behaviour of the bridge deck. With curvature, the impact of the skew angle rises significantly. The rate of increment in TMRL,DL is increased with span length in both girders of a skew-curved bridge when skewness is introduced. Skewness causes the supports to become non-orthogonal, which increases twisting in both girders by creating more eccentric load pathways. The TMRL,DL values for the outer girder are approximately 10 and 15 at the curved bridge (Figure 18(a)), and skew-curved bridge (Figure 18(b)), whereas the corresponding increments for the inner girder are 8 and 12, respectively. Variation of torsional moment ratio with span length for different curve angles under DL.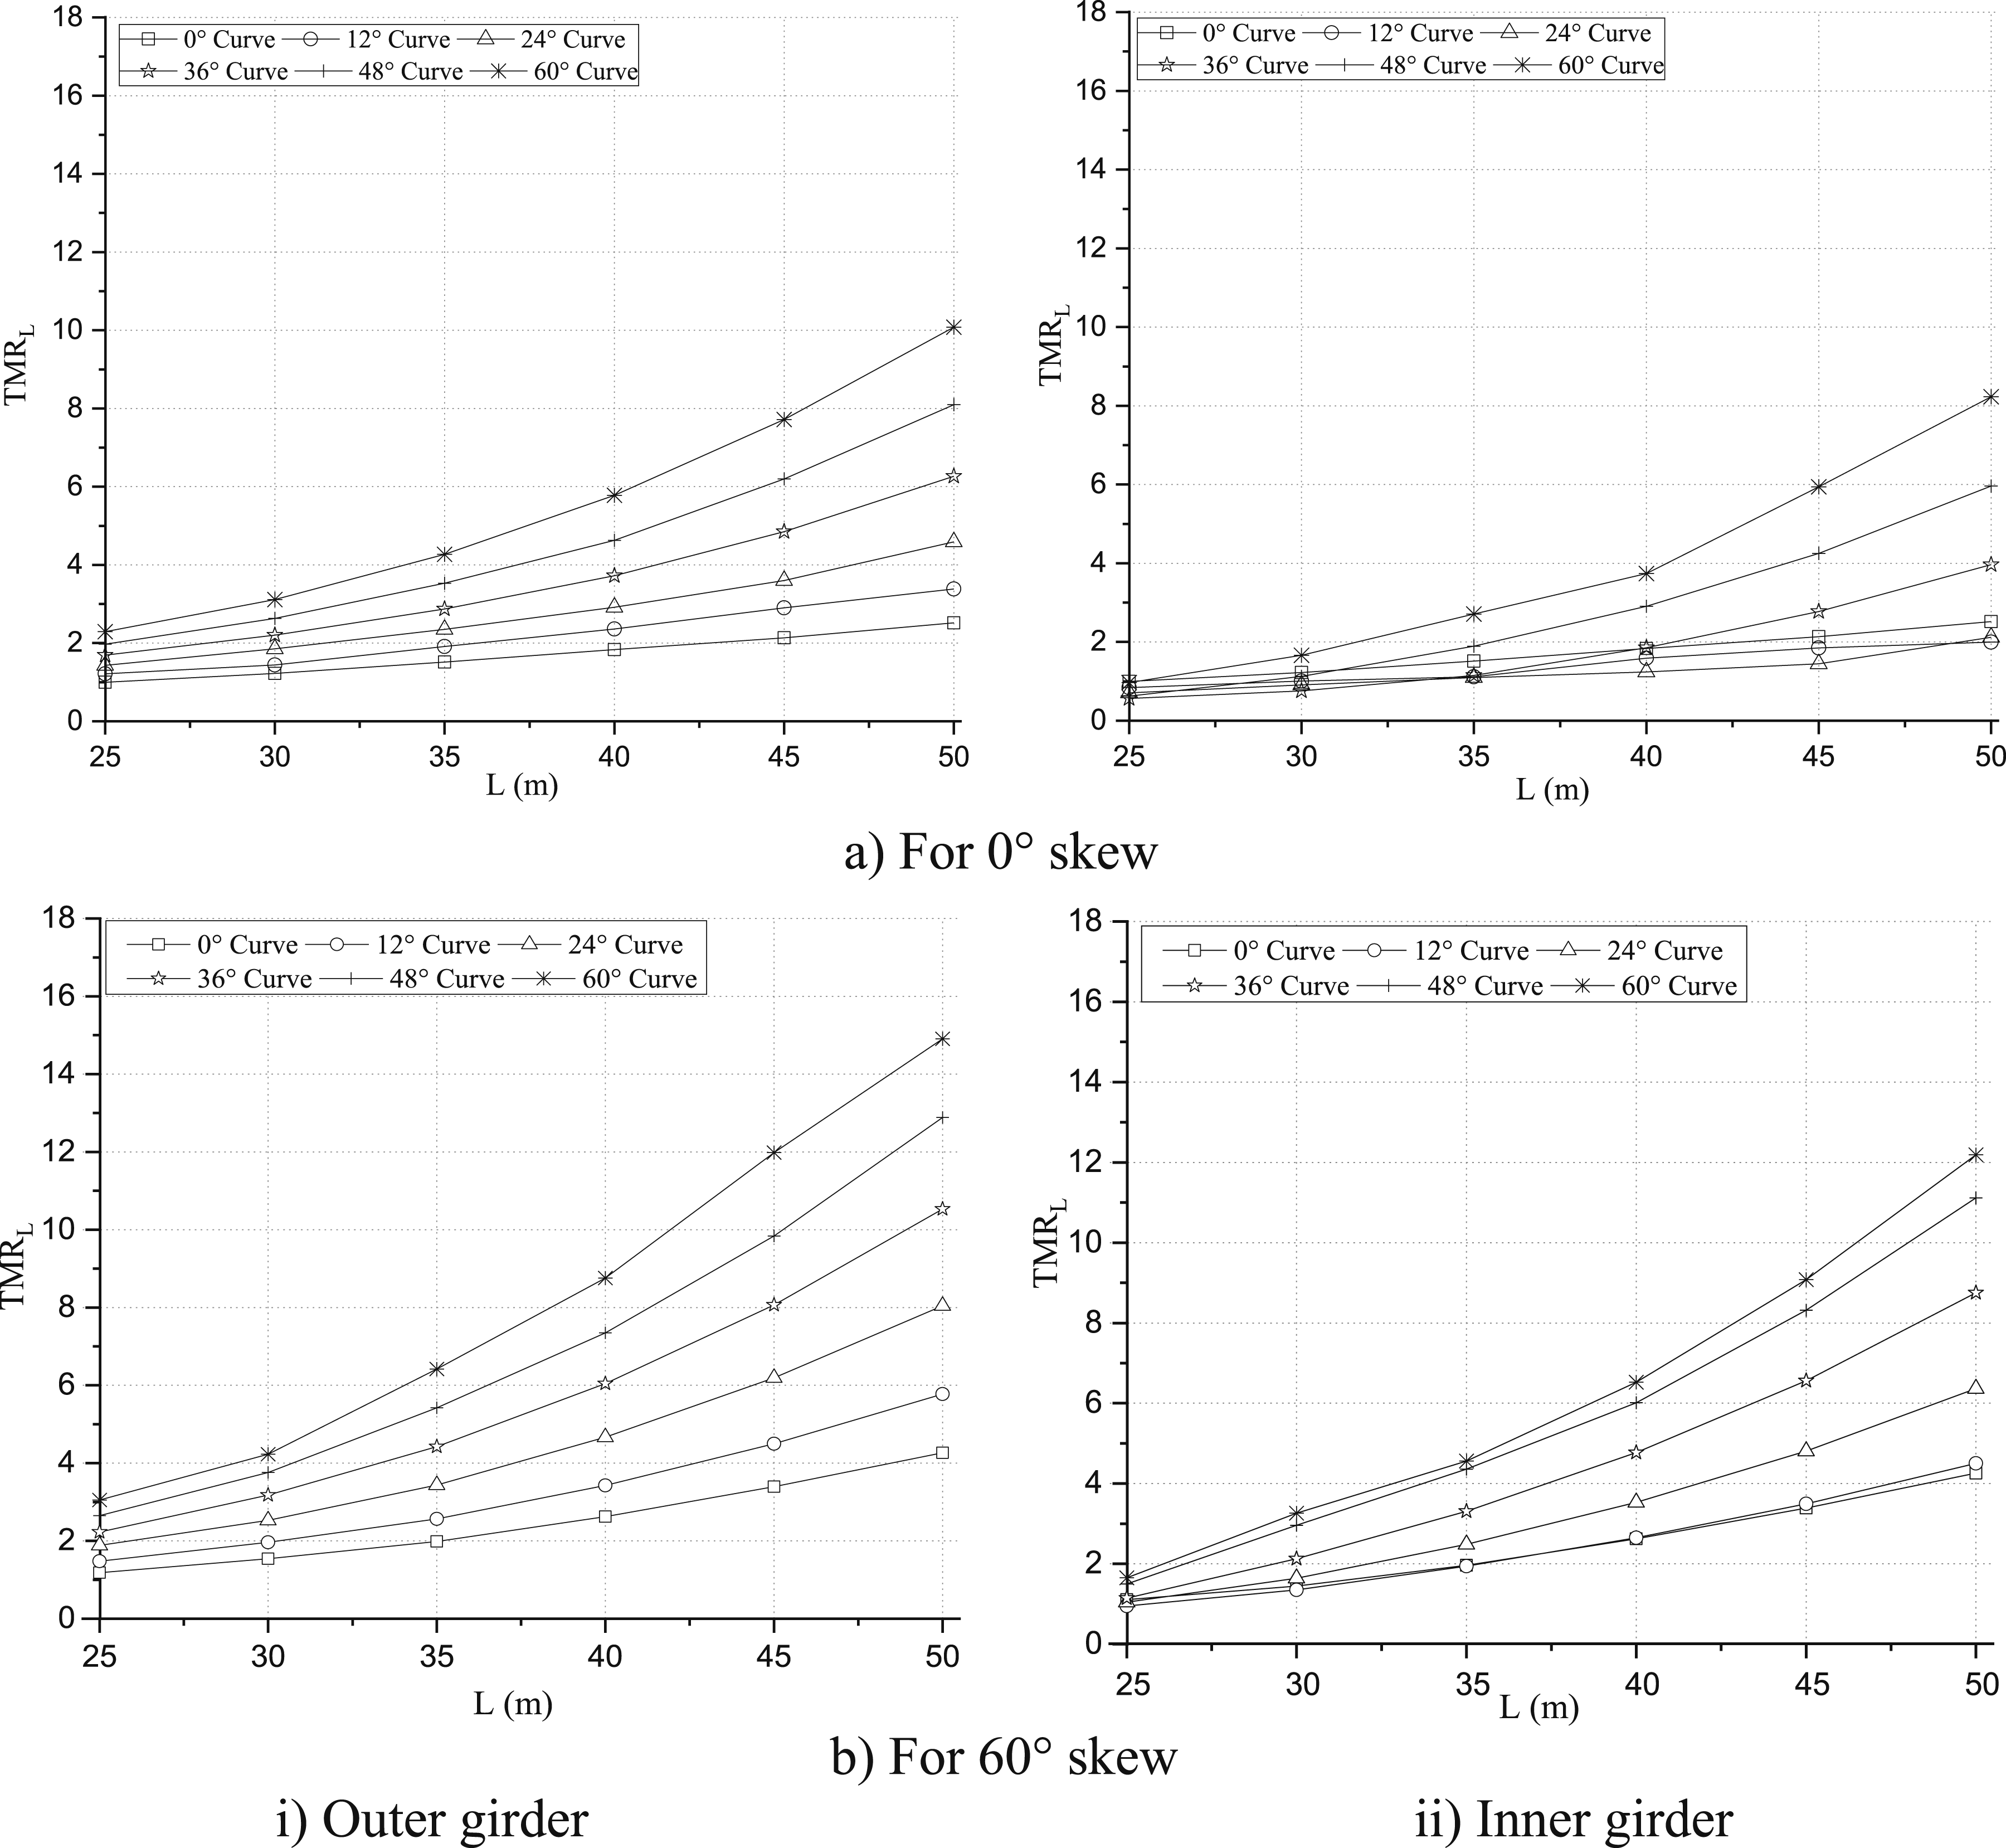
The TMRL,DL in the outer girder of a non-skewed bridge increases from 2.5 to 10 times for the span length from 25 to 50 m and curve angle from 0 to 60°, while it increases from 2.5 to 8 times for the inner girder. For a bridge with a 60° skewness, the TMRL,DL in the outer girder increase by about 4 to 15 times, while in the inner girder, it rises by nearly 4 to 12 times for the same variation.
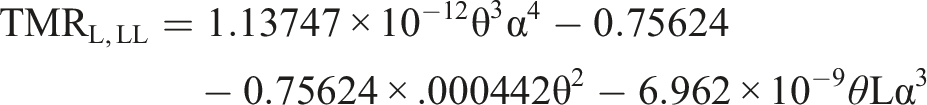
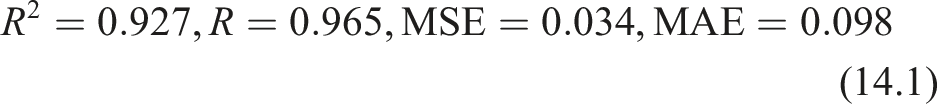
Figure 19 illustrates the variation of TMRL under LL (TMRL,LL) with various skew and curve angles. The TMRL,LL is seen to rise noticeably with both the span length and curve angle for both non-skewed and skewed bridges. The curve angle has a greater impact on the outer girder than on its inner girder. Up to a curve angle of 24° for all span lengths, the TMRL,LL in the outer girder of a non-skewed bridge is negligible; following that, it rises in proportion to the span length and curve angle. Torsional effects in the outer girder are minimal for small curve angles (less than 24°) since the live load is almost symmetric about the bridge axis. The impact of curve angle is minimal in the inner girder up to 35 m in span length; after that, it rises with span length for curve angles greater than 48° (Figure 19(b)), due to greater warping and load redistribution. When skewness is present, TMRL,LL behaves differently in the outer girder of a skewed bridge than it does in the inner girder for all curved bridges. Additionally, it increases as the skew angle in both girders rises. Variation of torsional moment ratio with span length for different curve angles under LL.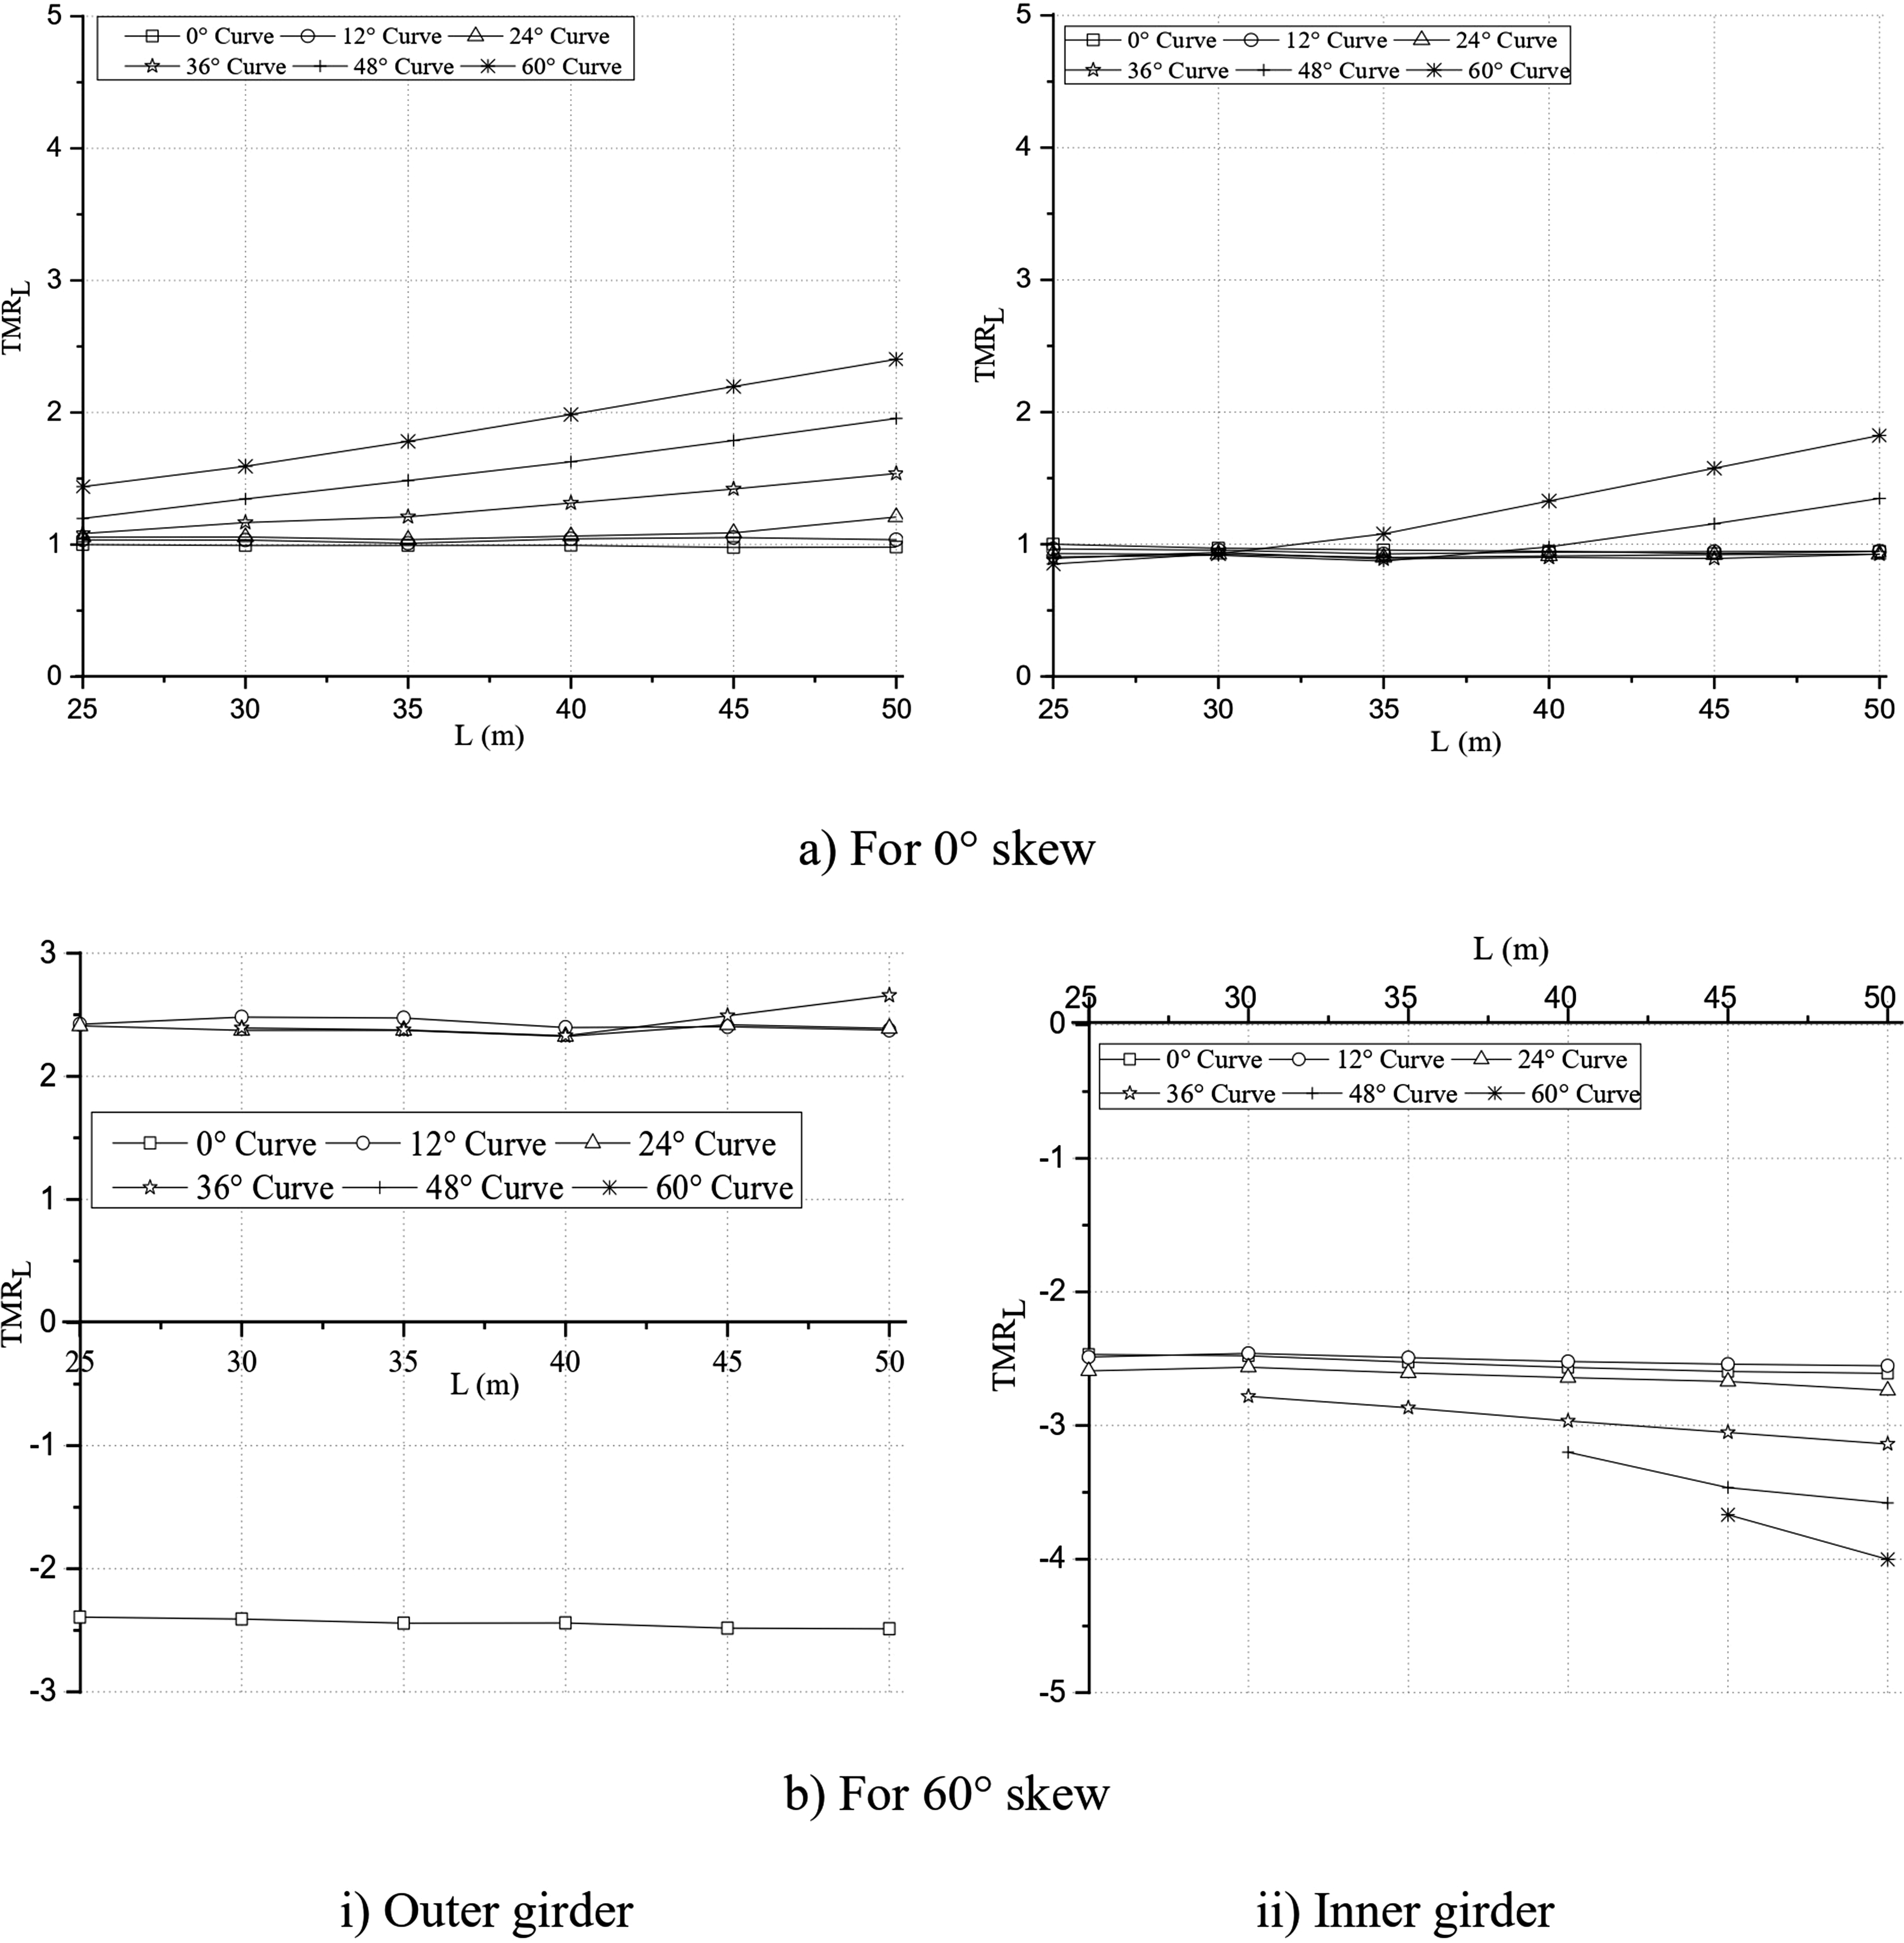
The TMRL,LL in the outer girder of a non-skewed bridge (θ = 0°) becomes approximately 1 to 2.5 times for the, while it becomes approximately 1-1.8 times in the inner girder. The TMRL,LL in the outer girder of the bridge increases by approximately 2.4 to 3.7 times for the bridge with a 60° skewness; in the inner girder, it increases by around 2.5 to 4 times for the same variation in the inner girder.
Figure 20 illustrates how VDRL,DL vary for various skewness and curvature in both girders with the span length. The vertical displacement ratio under DL (VDRL,DL) increases dramatically and nonlinearly with increasing span length. In general, the span length and curve angle have an increasing relationship in terms of how the curve angle affects VDRL,DL in the girders of both skewed and non-skewed bridges. The bridge deck bends and twists more when its spans are longer and its curvature is higher. Up to 24°, the curve angle has no discernible impact on the inner girder. The outer girder has a significantly greater impact of curvature than the inner girder. For the skew-curved bridge, however, the rate of increase in VDRL,DL in both girders decreases considerably. A more effective load-sharing system between girders and supports is produced when skewness is added because the supports become inclined. This successfully lowers the rate at which VDRL,DL rises with span length in both girders by redistributing a portion of the vertical deformation into torsional and transverse actions. This is evident from the VDRL,DL values at 0° skew and 60° curve in Figure 20(a) and (b), respectively. Variation of vertical deflection ratio with span length for different curve angles under DL.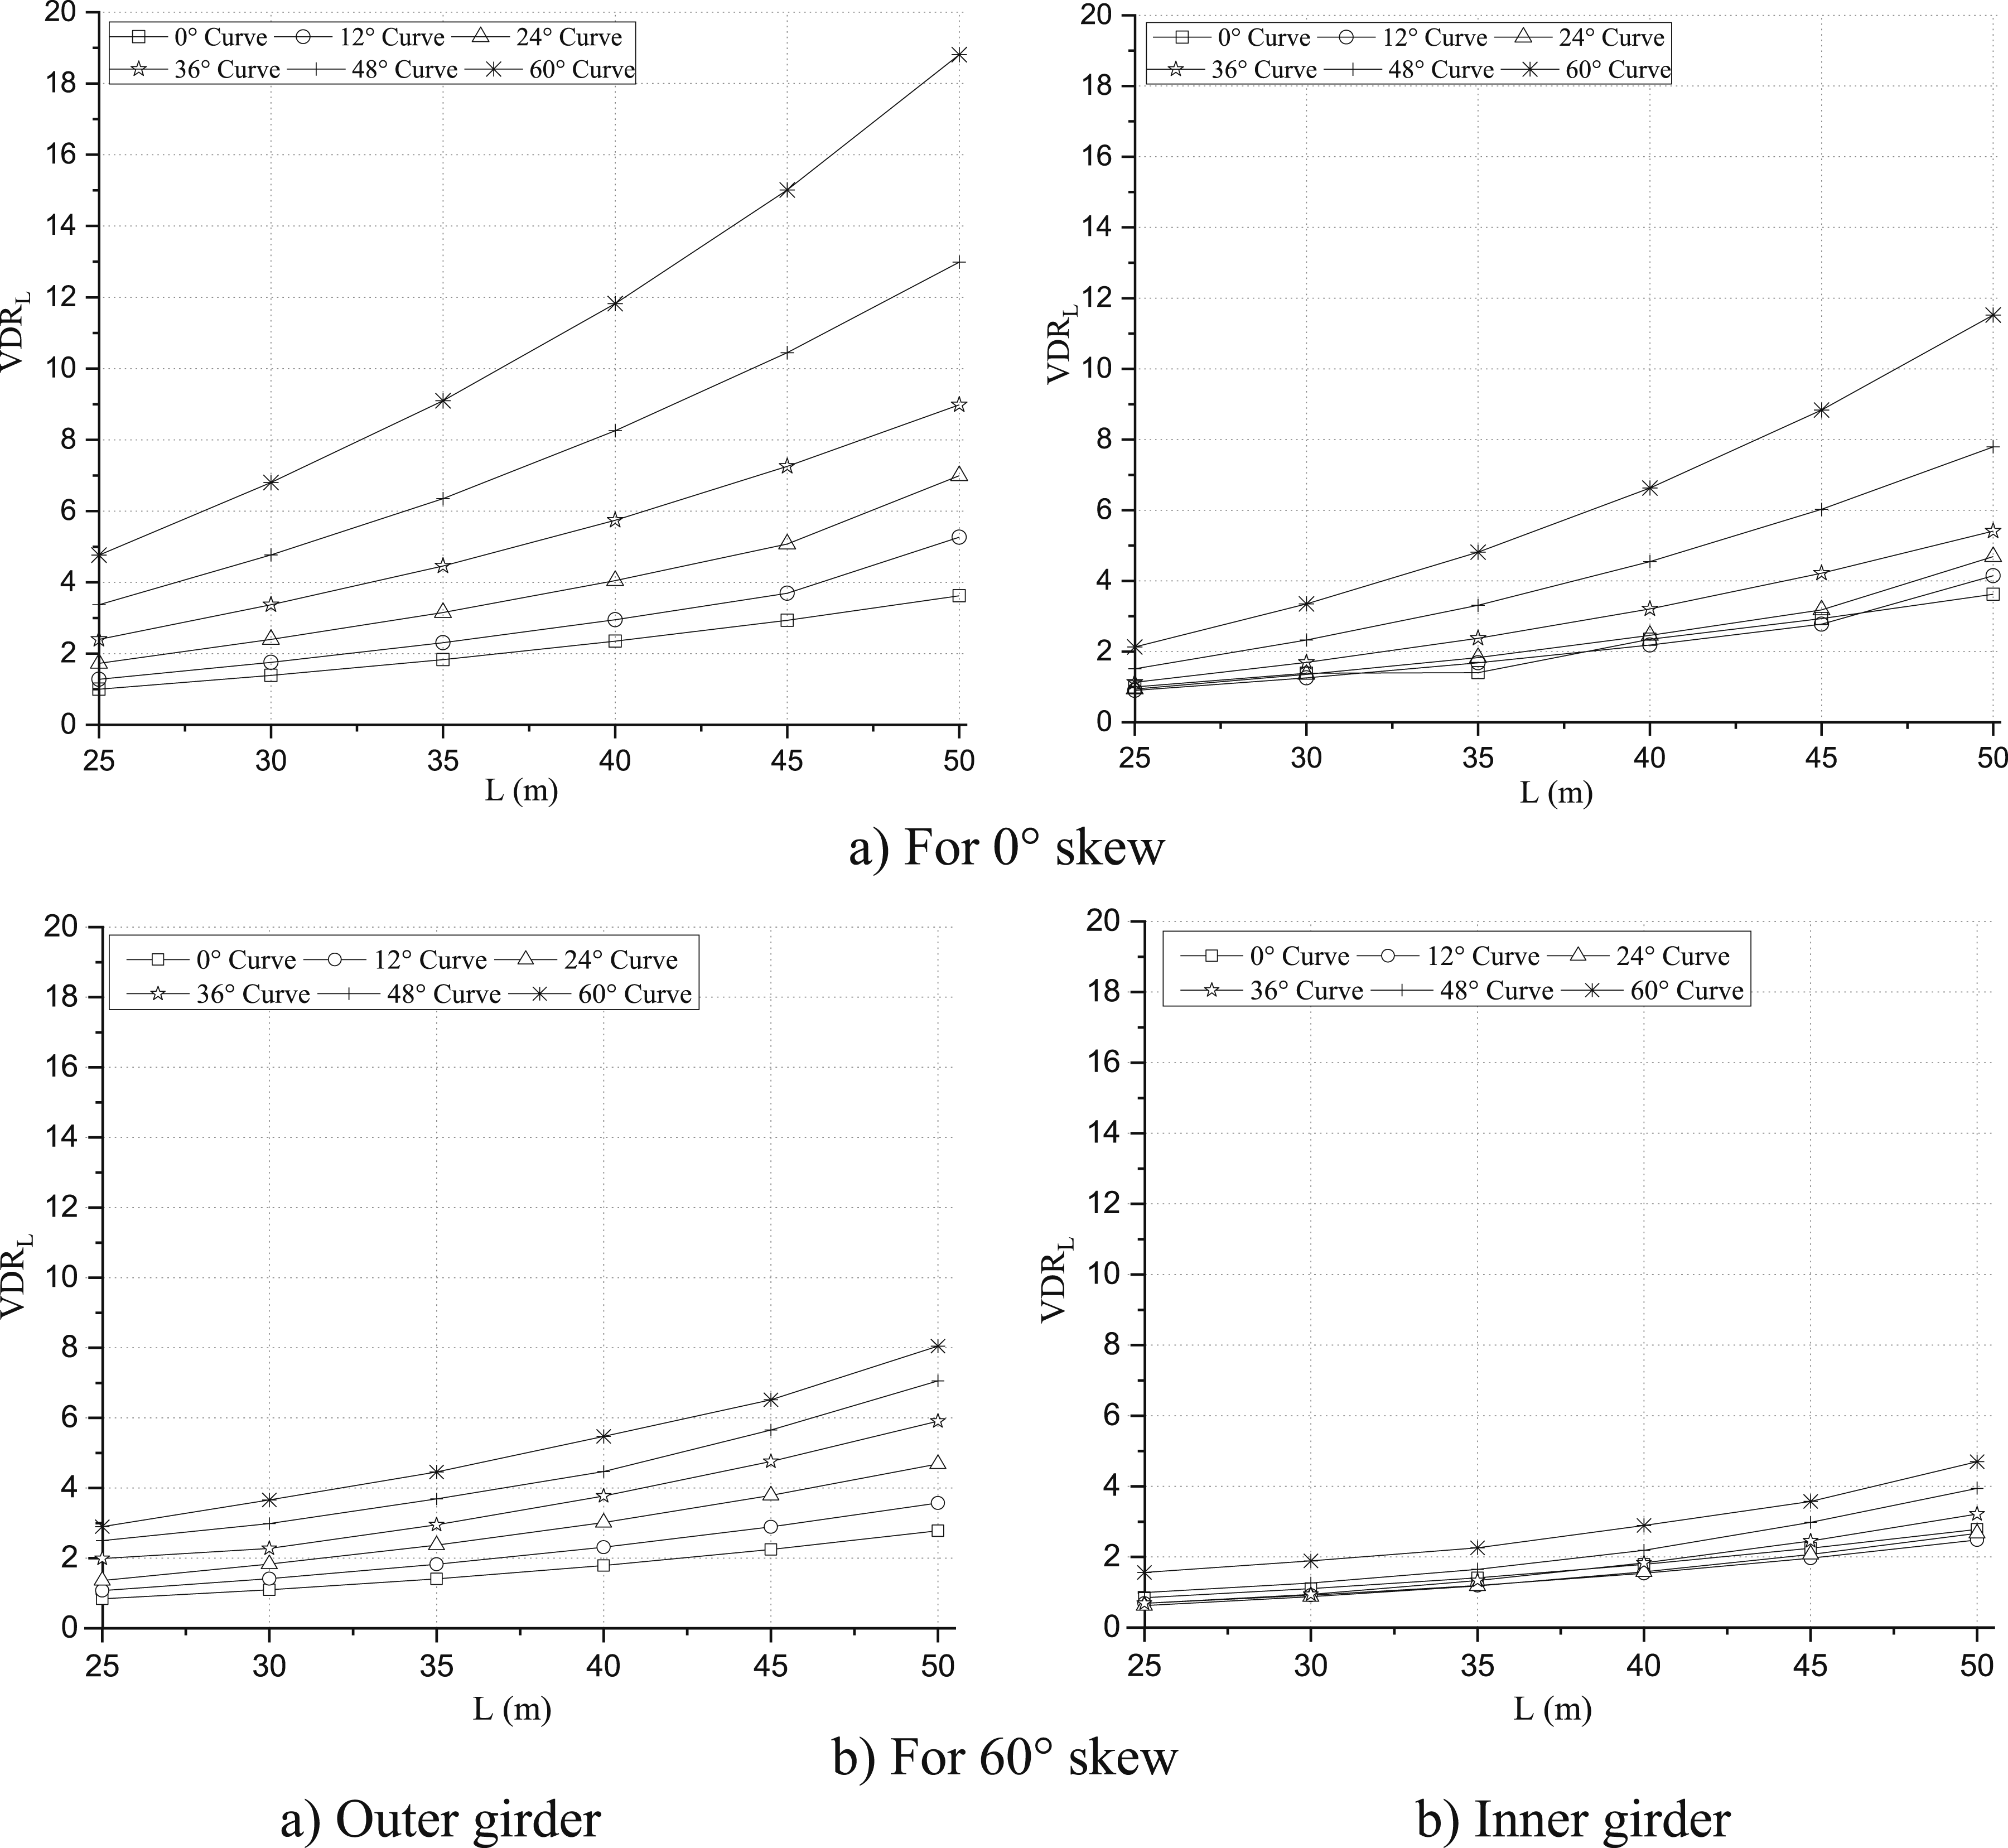
The VDRL,DL of a non-skewed bridge outer girder rises by about 3.5 to 19 times while by about 3.5 to 12 times as the span length rises from 25 to 50 m and the curvature increases from 0 to 60°. For a bridge with a 60° skewness, for the outer girder, the VDRL,LL increases by about 3 to 8 times, while in the inner girder, it increases by about 2.5 to 5 times for the same variation.
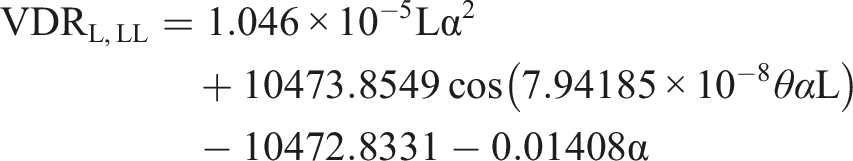
For various skewness and curvature, Figure 21 shows the change of VDRL under LL (VDRL,LL) with the span length. When the outer girder’s curvature is 24°, and the inner girder’s is 36°, respectively, the influence of the span length on VDRL,LL is negligible; however, as curvature and span length increase, the effect becomes considerable. Live loads are localised and almost symmetric for short spans and for the curvature 24° to 36°, their impact on vertical displacement in both girders is minimal. Longer lever arms and eccentric loads increase vertical displacements as span length and curvature increase, especially in the outer girder. Except for the extreme curve angles considered in the study, for the inner girder, the impact of span length and curvature on VDRL,LL is minimal for the inner girder. For skew-curved bridges, the outer girder exhibits a more pronounced skewness impact. When a curved bridge has more skewness, the impact of the curve angle is minimal. When skewness is introduced, the supports become non-orthogonal, redistributing loads diagonally and reducing direct vertical bending. This is evident from the VDRL,LL values at 0° skew and 60° curve in Figure 21(a) and (b), respectively. Variation of vertical deflection ratio with span length for different curve angles under LL.
The VDRL,LL of a non-skewed bridge (θ = 0°) outer girder increases by about 1.2 to 5.7 times while increasing by about 1 to 2 times for inner girder as the span length rises from 25 to 50 m and the curve angle rises from 0 to 60°. The VDRL,LL in the outer girder of a bridge with a 60° skewness increases by about 1 to 2.5 times, while it decreases by about 0.7 to 1 times for a comparable variation in the inner girder.
An increase in the number of cells in a box-girder bridge enhances torsional rigidity. So, in the following section, the effect of the number of cells on the behaviour of the skew-curved bridge is investigated.
Effect of the number of cells
In this section, the effects of changing the number of cells, holding the total volume of the material constant, on the various ratios are examined for different combinations of curvature and skewness. These dead load (DL) and live load (LL) response ratios are abbreviated as BMRN, SFRN, TMRN and VDRN. The maximum bending moment for any number of cells, N (1 or (2) of a skew-curved bridge under either DL or LL is compared to the maximum bending moment for a single-cell straight bridge for the bending moment ratio (BMRN). The definitions and implementation of all the other percentages are the same.
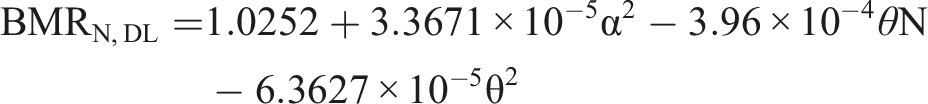
Figure 22 shows the variation of BMRN in single-cell and double-cell bridges under dead and live loads for different skewness and curvature. The maximum bending moment ratio under DL (BMRN,DL) and LL (BMRN,LL) in both single-cell and double-cell of skewed as well as non-skewed bridge (θ = 0°) is found to increase with the curve angle; however, the increase is not much. The effect of the number of cells is almost insignificant on both BMRN,DL and BMRN,LL for non-skewed bridges, because load distribution is nearly symmetric. While for skew-curved bridges, the BMRN,DL and BMRN,LL are slightly lesser for the double-cell bridges as compared to the single-cell bridge, by enhancing load distribution, double-cell skewed bridges marginally lower bending moments. The values of BMRN,DL are lesser for the skew-curved bridges (Figure 22(b)) as compared to their values in curved bridges (Figure 22(a)), when skewness is introduced in the curved bridges. While the values of BMRN,LL are higher for the skew-curved bridges (Figure 22(b)) as compared to their values in curved bridges (Figure 22(a)). Variation of bending moment ratio with curve angle for different number of deck cells.
For both single-cell and double-cell bridges with zero skewness, BMRN,DL is found to rise by about 16% as the curvature increases from 0 to 60°. However, the BMRN,LL rises by about 14% for both single-cell and double-cell bridges. For the skew-curved bridges having 60° skewness, the BMRN,DL is about 10% for a single-cell bridge, and 15% for a double-cell bridge, less than that for a single-cell straight bridge. However, in relation to the number of cells, the BMRN,LL in a skew-curved bridge with 60° skewness is about 28% for a single-cell bridge and 20% for a double-cell bridge higher than that in a single-cell straight bridge.
Figure 23 depicts the change of SFRN for single and double cell bridges under both DL and LL with various curves and skew angles. In the case of SFRN under DL (SFRN,DL) and LL (SFRN,LL) in both single-cell and double-cell of non-skewed bridge (θ = 0°) is found to be insignificant with the curve angle, because the load path is nearly symmetric. When comparing the double-cell bridge to the single-cell bridge, the value of SFRN,DL is slightly greater. However, there isn’t much variation in the values of SFRN,LL between single and double cell bridges. For the bridges having 60° skewness, the SFRN,DL and SFRN,LL increase with the curve angle. The value of SFRN,DL and SFRN,LL are higher for the skew-curved bridges (Figure 23(b)) as compared to their values in curved bridges (Figure 23(a)), because of the combined effects of diagonal load transmission and torsion. Variation of shear force ratio with curve angle for different numbers of deck cells.
In contrast to those in the straight bridge, the SFRN,DL and SFRN,LL are about 1% (insignificant) for single and double cell bridges as the curve angle increases from 0 to 60°. For the skew-curved bridge with 60° skewness, the SFRN,DL is about 8% higher than that for a single-cell straight bridge for both single-cell and double-cell bridges. When the curve angle increases from 0 to 60°, in relation to the number of cells, the SFRN,LL in a skew-curved bridge with 60° skewness is roughly 12% greater than that in a single-cell straight bridge.
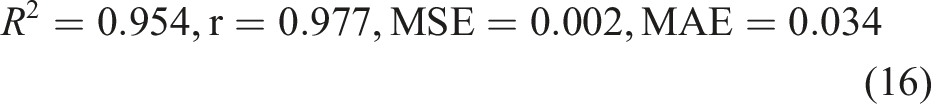
The effect of cell number on TMRN under both DL and LL for different curvature and skewness is illustrated in Figure 24. TMRN,DL is defined as the ratio of the maximum torsional moment of a skew-curved bridge with 1 or 2 cells. This value is normalised with respect to the maximum torsional moment of a single-cell bridge with a 6° curve. Regardless of the number of cells, it is discovered that the TMRN,DL rises quickly with the curve angle for skewed and non-skewed bridges, because twisting is amplified by curvature, almost no matter the number of cells. However, the TMRN under LL (TMRN,LL) reduces with the increment in curvature for a non-skewed bridge; while for a skew-curved bridge, it dramatically rises as the curve angle increases. Since live loads are localised and mostly carried along the longitudinal axis, this results in reduced torsion. In contrast to skewed bridges, where eccentric load routes cause torsional effects to rise with curvature. The influence of the number of cells on TMRN,DL is insignificant, while the TMRN,LL is slightly lesser for the double-cell bridges as compared to the single-cell bridge. The response of TMRN,LL in a skew-curved bridge contrasts with straight bridge. The values are lower for skew-curved bridges as compared to their values in curved bridges, because skewness redistributes live loads diagonally, reducing peak torsion. For a straight bridge, the TMRN,DL increases by about 12 times as the curve angle rises from 0 to 60° for both single and double cell bridges. The TMRN,LL of such bridges decreases by about 24% and 28% for both single-cell and double-cell bridges. For the skew-curved bridge having 60° skewness, the TMRN,DL become about 10 times for single and double cell bridges. While the TMRN,LL in a skew-curved bridge with 60° skewness is approximately 25% higher than that in a single-cell straight bridge. Variation of torsional moment ratio with curve angle for different numbers of deck cells.
Figure 25 shows the impact of skewness and curvature on the VDRN for both the single and double cell bridges. For both the bridges, the VDRN under DL (VDRN,DL) and LL (VDRN,LL), rises with respect to the curve angle, since curvature increases vertical deflections by shifting loads outward. In a double-cell bridge, the influence of the curve angle is lessened. For the skew-curved bridge (θ = 60°, α = 60°), the values of VDRN,DL and VDRN,LL of the skew-curved bridge are less than those of the curved bridge. Skewness makes the load pathways more diagonal, which improves the bridge’s ability to withstand vertical displacements. Variation of vertical deflection ratio with skew angle for different numbers of deck cells.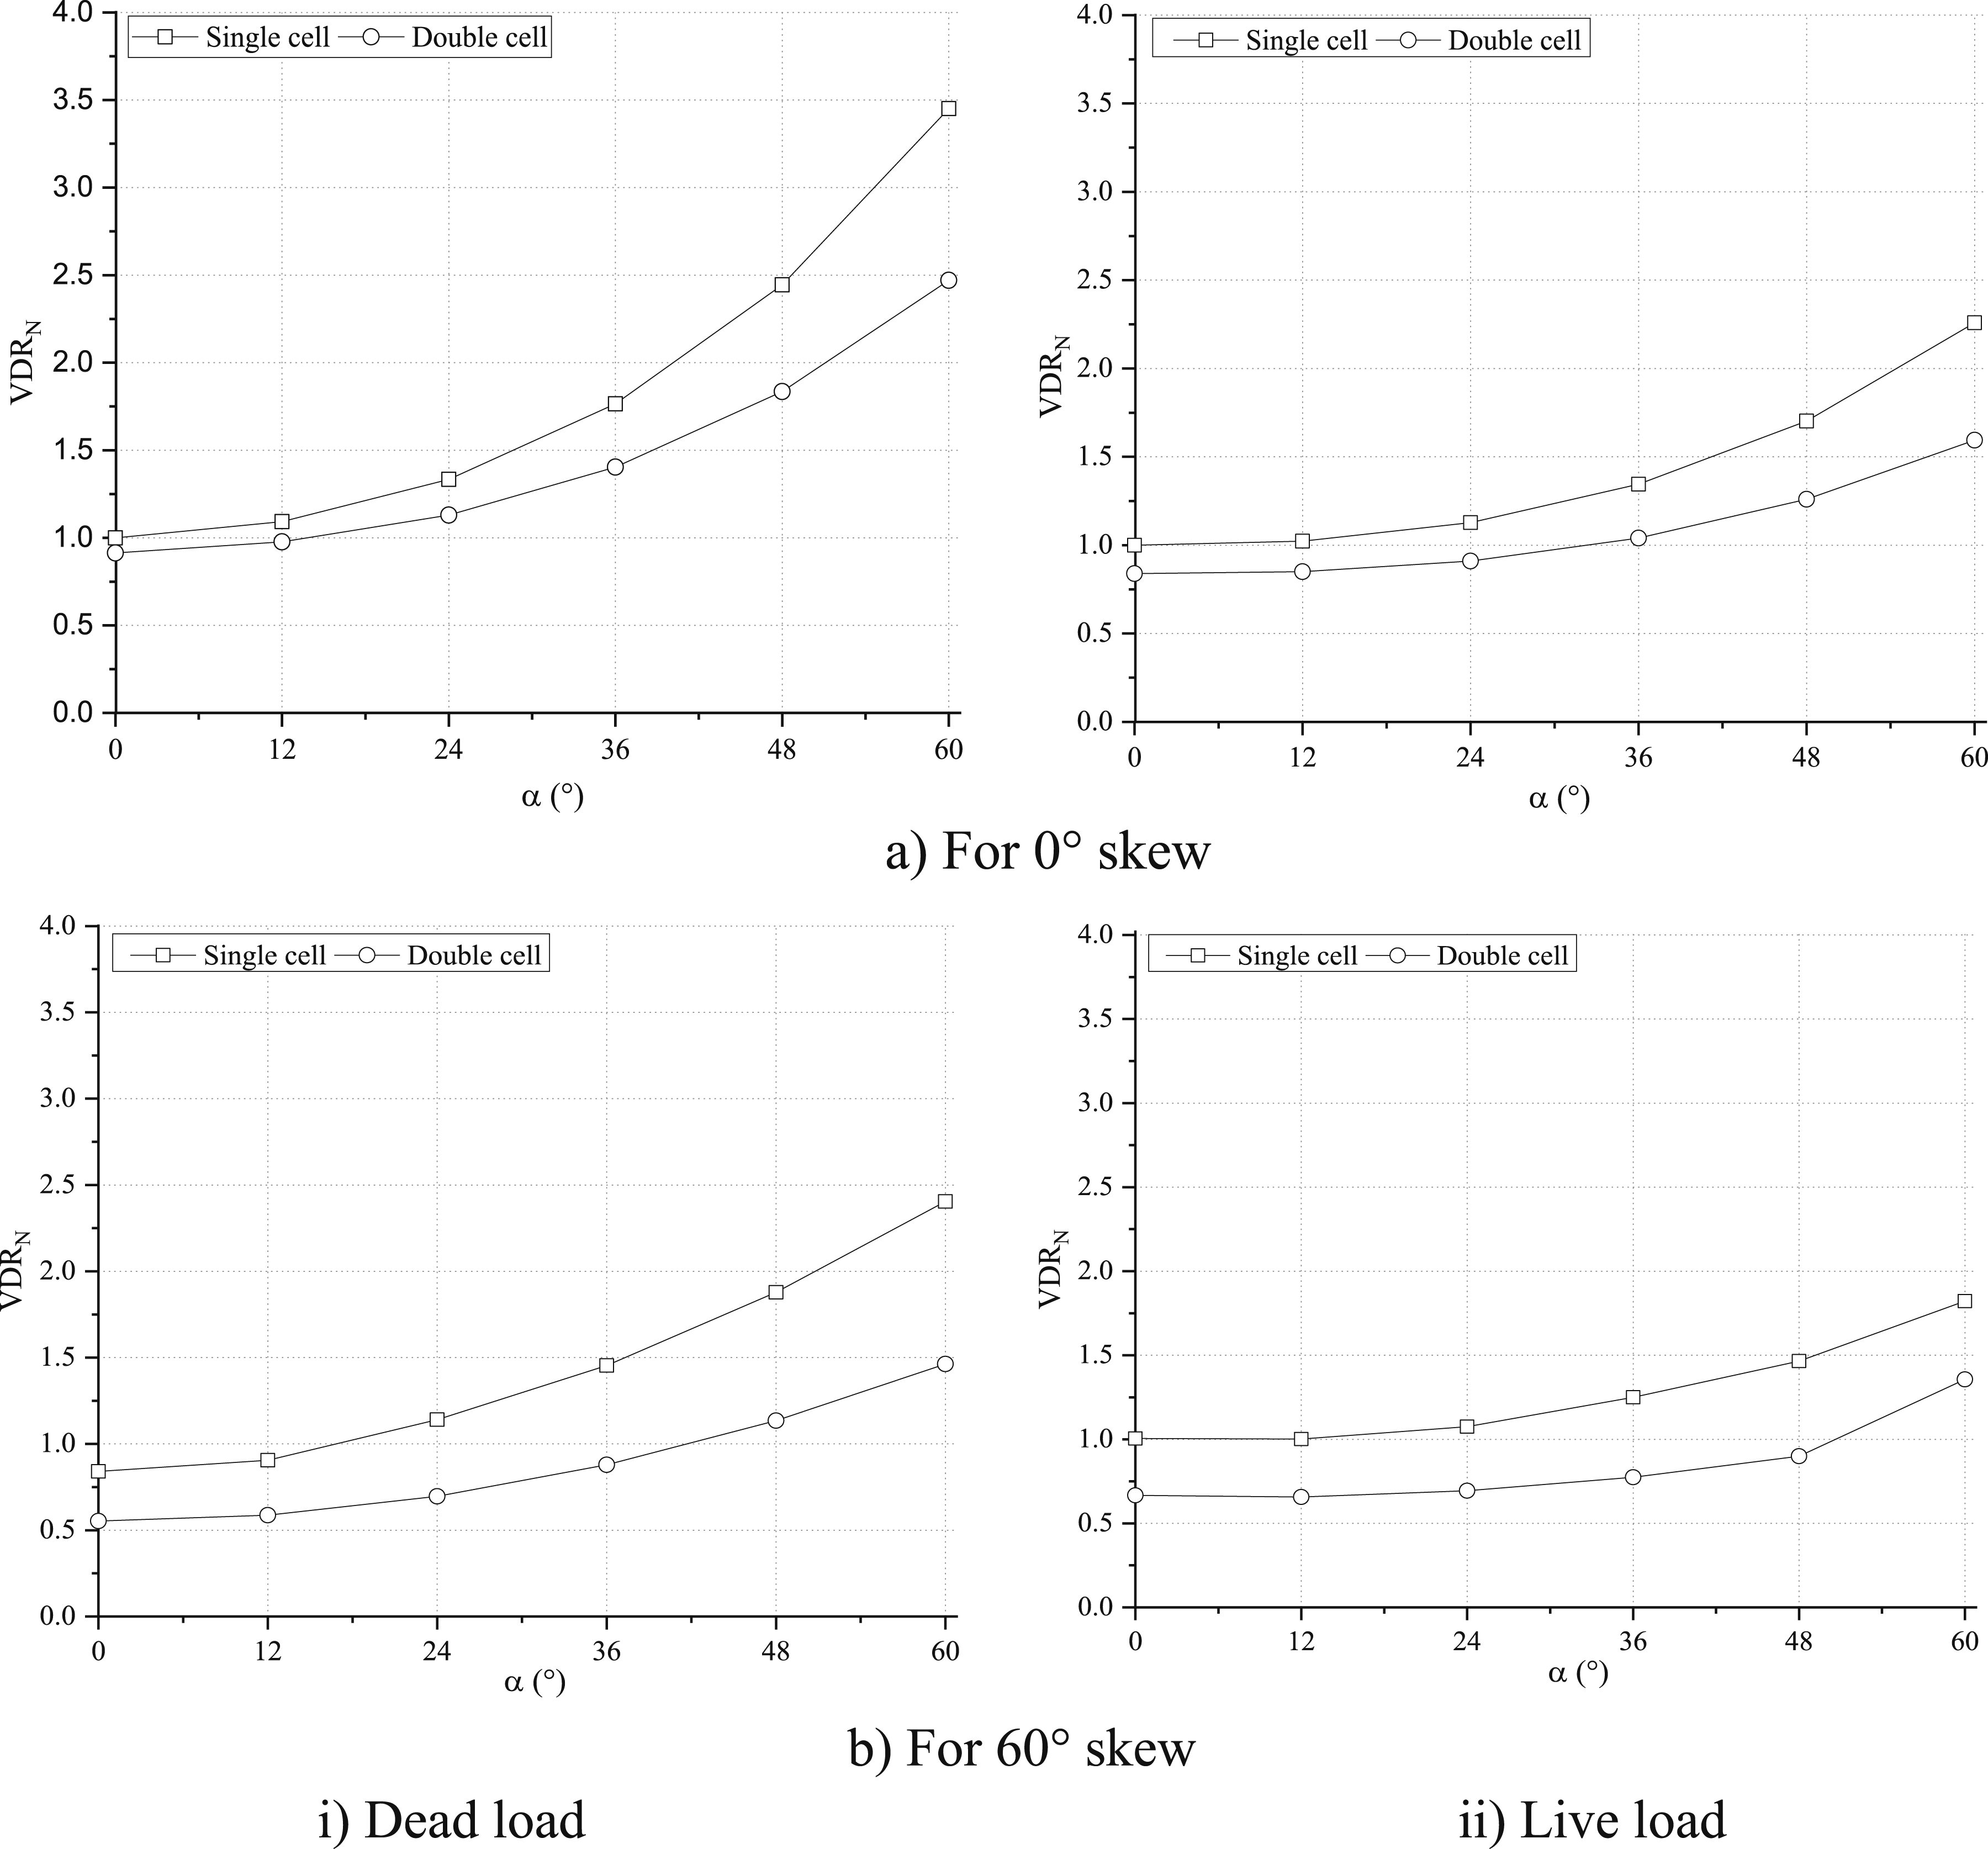
This can be observed from the VDRN,DL values at 0° skew and 60° curve (Figure 25(a)), and 60° skew and 60° curve (Figure 25(b)), which are about 3.5 and 2.5, respectively. The respective values of VDRN,LL are 2.25 and 1.7, respectively. Compared to a single-cell curved bridge with equivalent curvature, a double-cell skew-curved bridge demonstrates greater efficiency. In comparison to a single-cell straight bridge, the respective changes in VDRN,LL are about 2.25 times for single-cell and 1.5 times for double-cell bridges. For the skew-curved bridge for a 60° skew angle, the VDRN,DL becomes about 2.5 times for a single-cell bridge, and 1.5 times for a double-cell bridge, compared to a single-cell straight bridge. The VDRN,LL becomes about 1.8 times for a single-cell and 1.3 times for a double-cell bridge, compared to a single-cell straight bridge.
Torsional stiffness must be increased by increasing the number of cells. Also, as the responses in the double-cell bridge are significantly less compared to the single-cell bridge, the cross-sectional area of the double-cell can be further decreased to achieve a similar response as in the single-cell, so the double-cell bridge is good in increasing the torsional stiffness, as well as from an economic point of view.
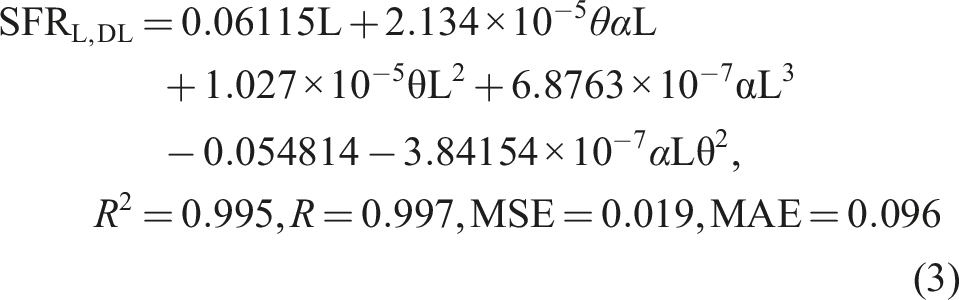
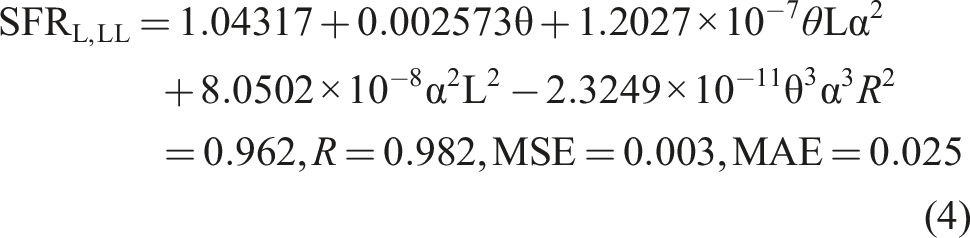
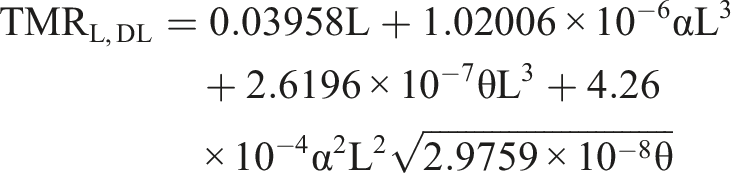
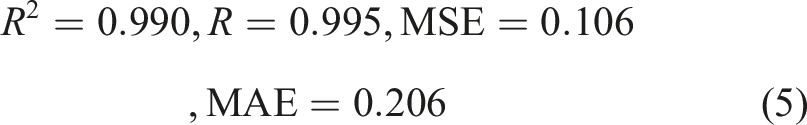
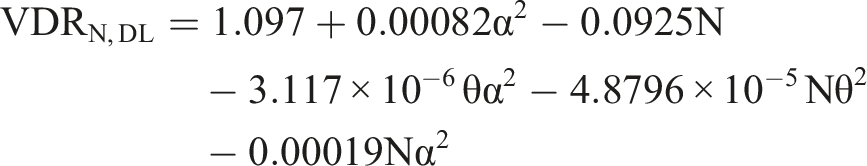
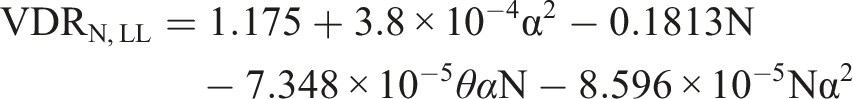
Development of equations
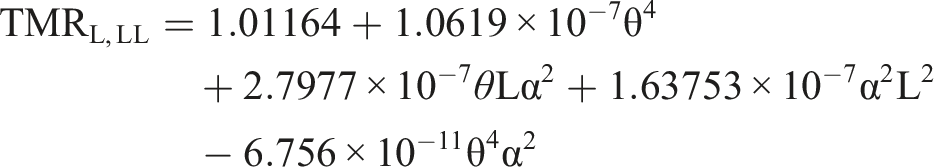
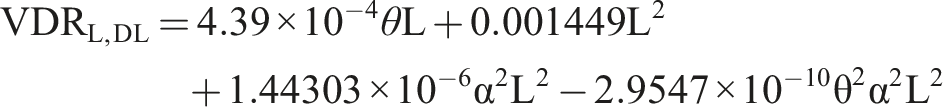
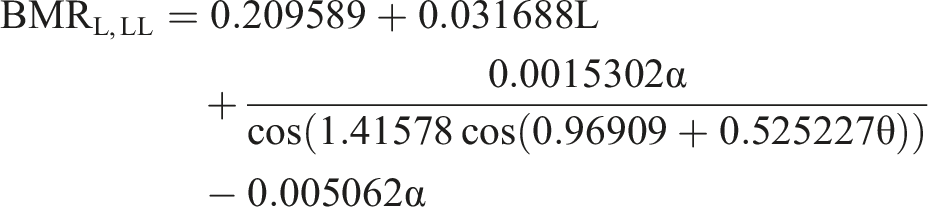
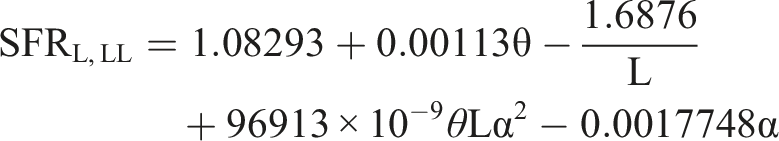
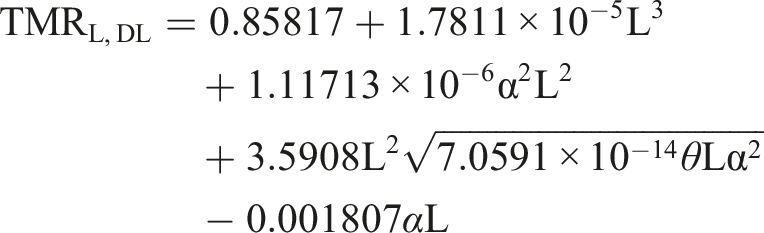
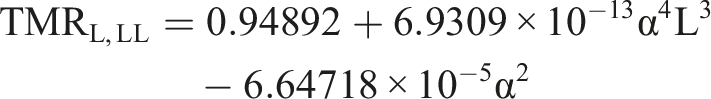
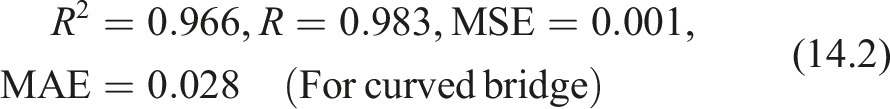
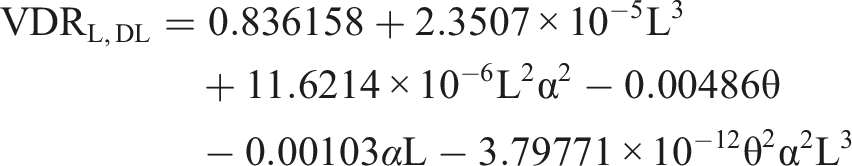
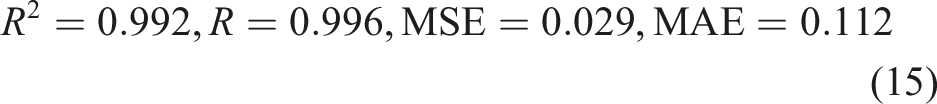
This section includes equations developed using a statistical method in estimating force and deflection ratios in skewed, curved and skew-curved bridges. The equations contain equations of the various span lengths and cells under dead as well as live (IRC) loads. For span length, bending moment ratio (BMRL), shear force ratio (SFRL), torsional moment ratio (TMRL), and vertical deflection ratio (VDRL) are the terms used to present. For the number of cells, the bending moment ratio (BMRN), shear force ratio (SFRN), torsional moment ratio (TMRN), and vertical deflection ratio (VDRN) of the box-girder bridge under both DL and LL are the terms used to present.
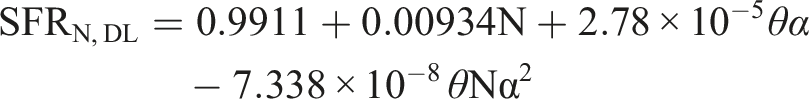
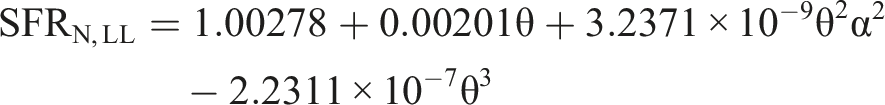
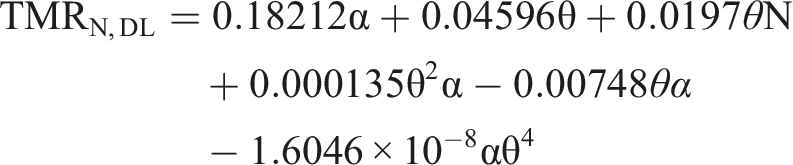
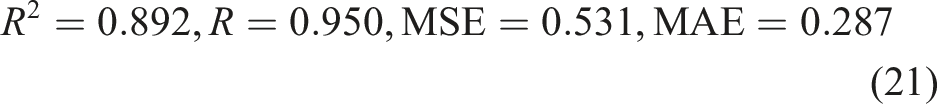
Based on sensitivity analysis, the parameters (skew angle, curvature, span length/number of cells) that significantly influenced the structural response are selected as predictors in the regression model. Using nonlinear least-squares regression, functional relationships of the form are fitted for response variable F: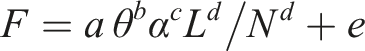
Effect of span length
For outer girder


For Inner girder

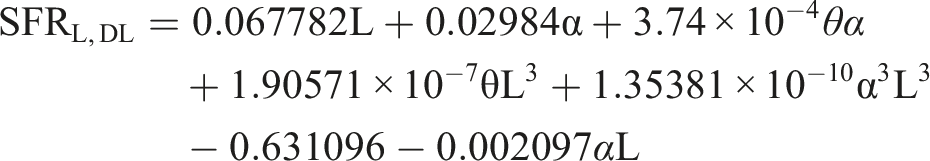
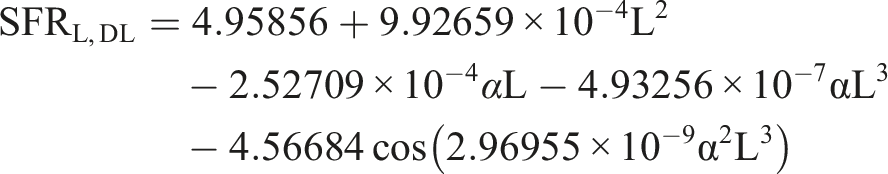

Effect of cell


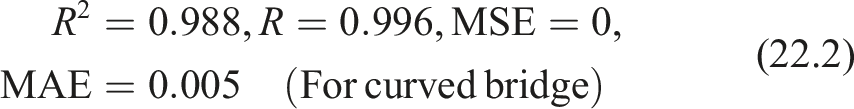
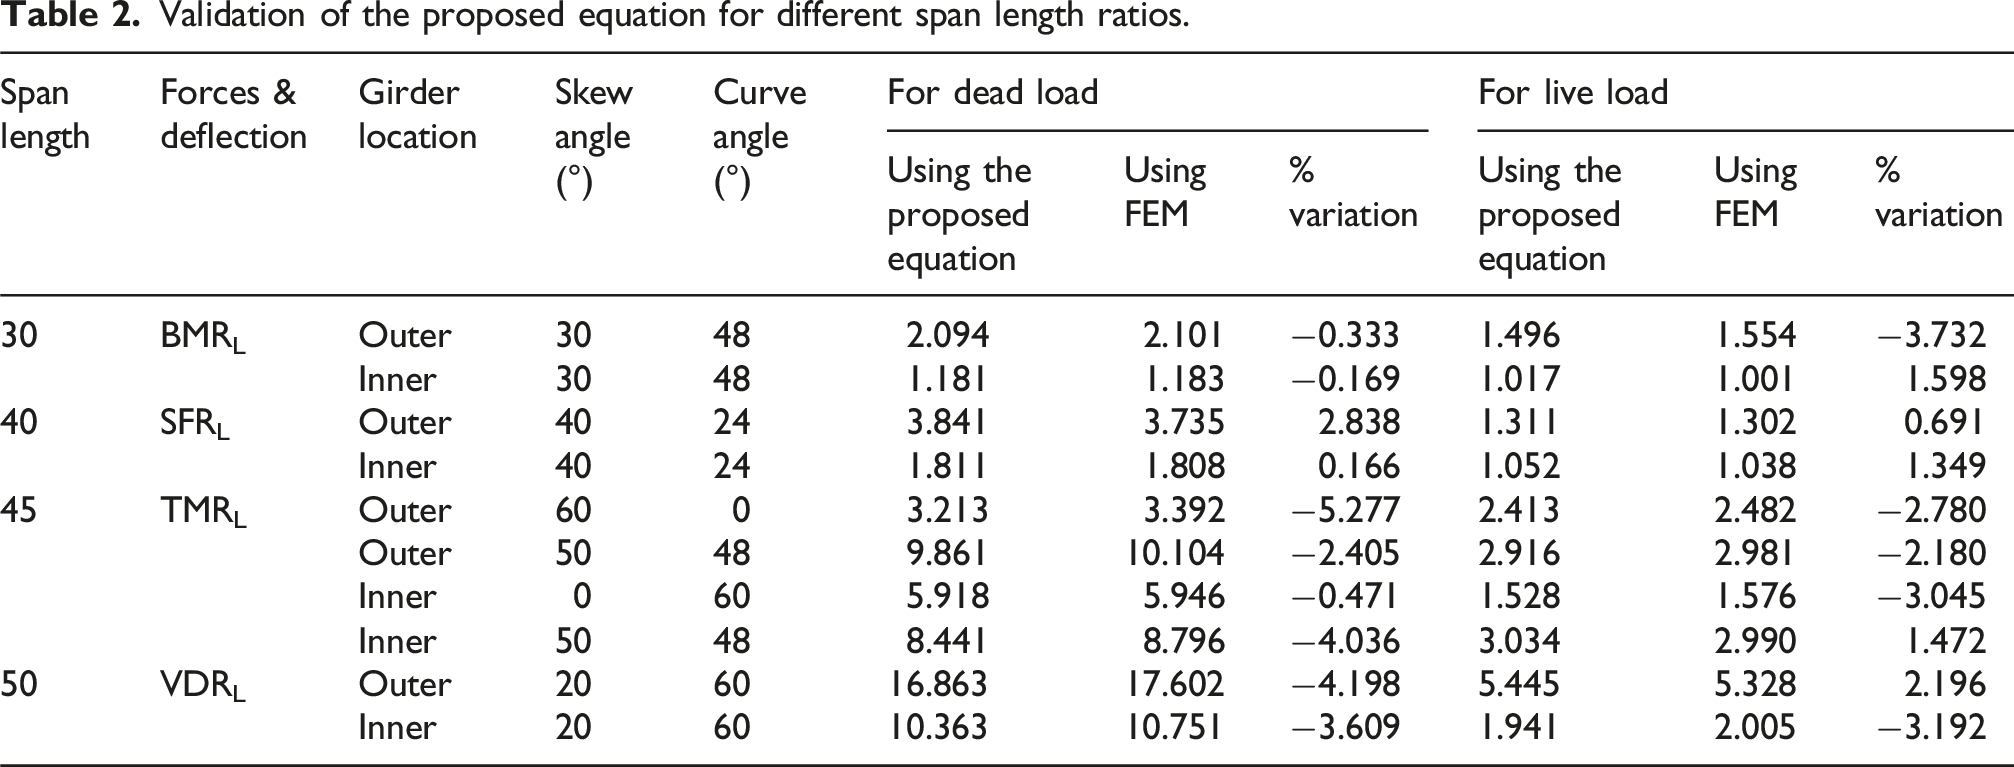
Validation of the proposed equation for different span length ratios.
Validation of the proposed equation for different No. of cell.
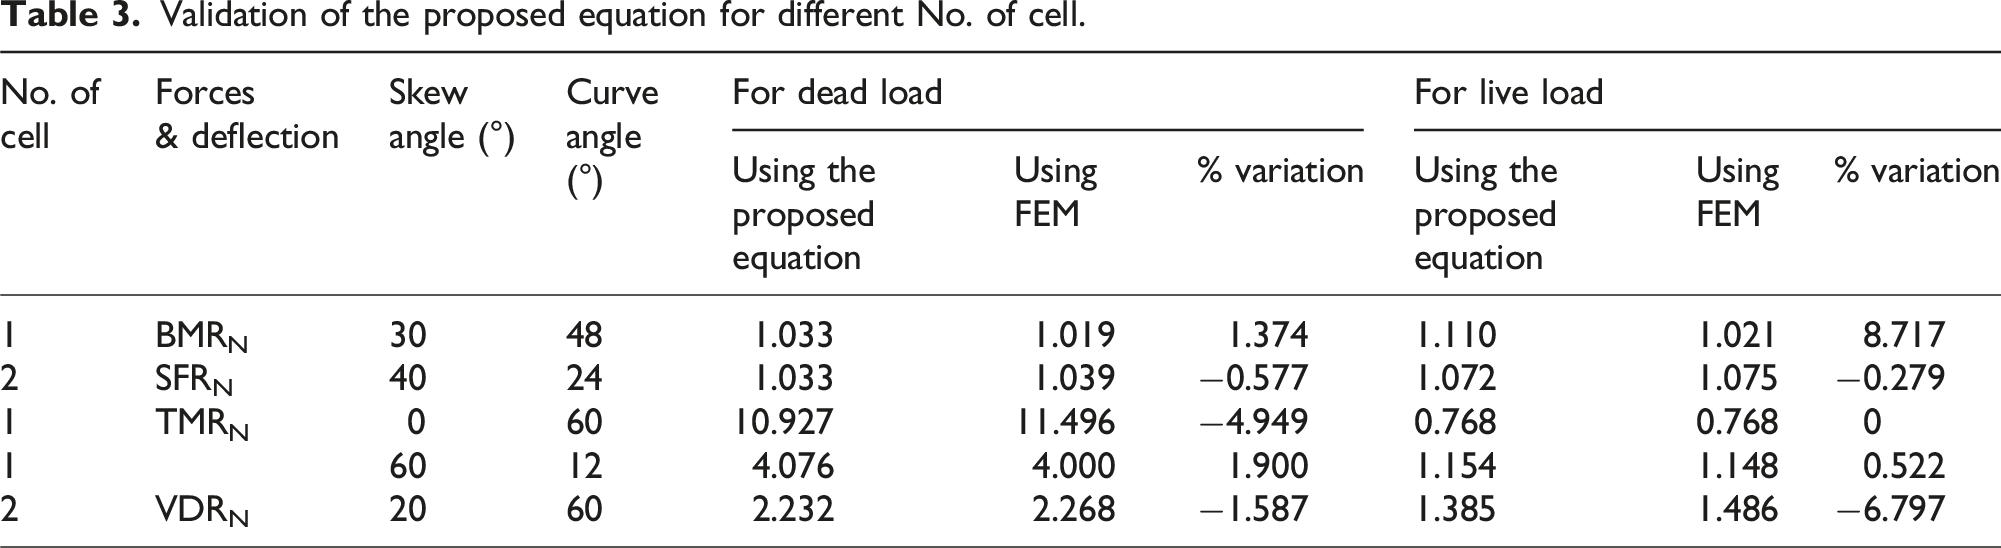
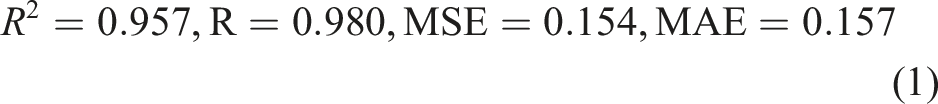
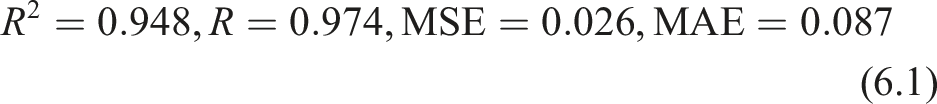
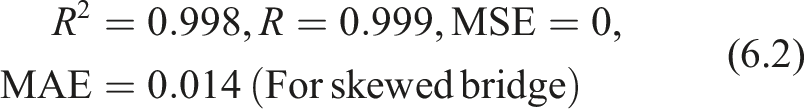
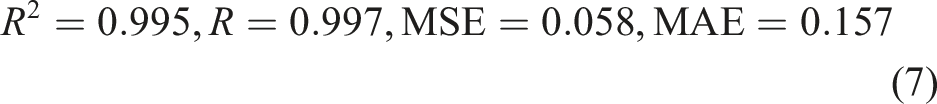
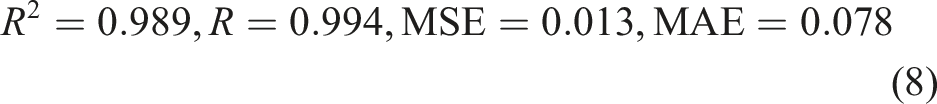
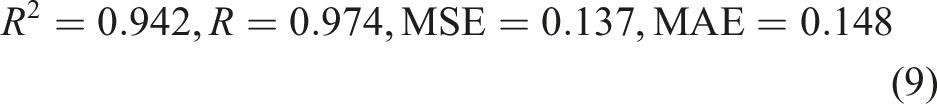
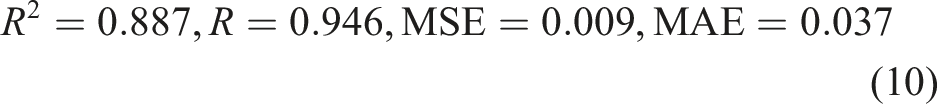
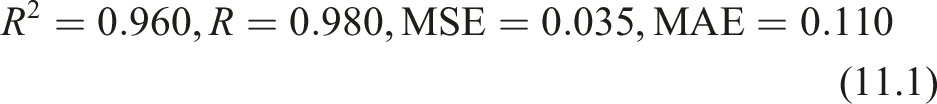
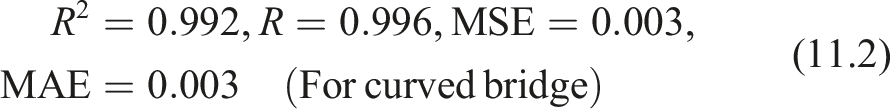
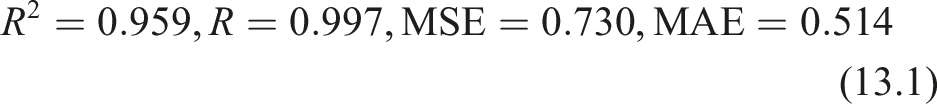
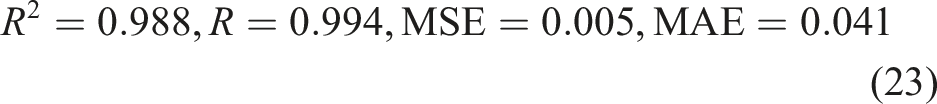
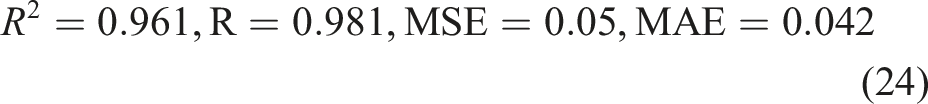
Along with the similarity found in Tables 2 and 3, the statistical indicators that accompany the suggested equations also confirm their reliability. The high values of the correlation coefficient (R) and coefficient of determination (R2) are a confirmation that there are a strong and good linear relationship and a good fit between the result of the prediction and the finite element. Moreover, the insignificant values of the Mean Squared Error (MSE) and Mean Absolute Error (MAE) can be interpreted as a low level of dispersion and low average deviations, which proves that the predictions do not vary significantly with the span length and number of cells and are not biased systematically. All these measures of statistics support the appropriateness of the equations created to estimate the global response parameters of skew-curved RC box-girder bridges in the range studied.
Conclusions
In this study, a skew-curved bridge is analysed using the finite element method, subjected to dead and Indian live loads, after validating the present approach with the published results. The study considers the number of cells, span length, curve angle, and skew angle as parameters. The following concisely summarises the conclusions reached by the studies: • Bending moment and vertical deflection of double cell curved bridges having high skewness are considerably less compared to curved bridges. • It is determined that the forces and deflection are highly resisted by the curved bridge having high skewness compared to curved bridges. • The rate of the increment in bending moment reduces with the span length in the curved bridges having high skewness compared to the curved bridge. • In comparison to a curved bridge, the skew-curved bridge exhibits a considerably greater shear force for the same span length. • As the skew angle in both girders rises, so does the rate at which the torsional moment increases for span length. • The increment in torsional moment under dead load reduces for the skew-curved bridge. Also, the live load torsional moment in bridges having skewness >5° changes sign in both the girders. • In both girders, deflection significantly decreases for spans greater than 40 m. For longer spans, a bridge with more skewness and curvature may be preferred because of the noticeably lower deflection, particularly in girders with larger skew angles. • The deflection of a double-cell bridge having skewness 60°, curvature 60°, is 2.5 times less than a single-cell curved bridge keeping the same volume of material. Compared to a single-cell curved bridge with identical curvature, the double-cell skew-curved bridge demonstrates greater efficiency. • The impact of skewness and curvature in the outer girder is more than that in the inner girder. • The results from the equations of forces and deflections are closely matched with the finite element results. These equations are useful for determining the maximum responses of skew-curved bridge decks based on the responses of straight bridge decks.
Limitations and Scope of the study
i) Only static linear elastic analysis of skew-curved box-girder bridges made of reinforced concrete is included. ii) Thermal stresses, seismic excitations, and dynamic loading effects are not considered. iii) Steel and concrete are represented as homogeneous, linearly elastic materials. iv) In accordance with realistic engineering limits, the study considered skew and curve angles up to 60°.
Footnotes
Authors’ contributions
Author 1, Preeti Agarwal: literature review, modelling, and analysis. Author 2, Deepak Kumar Singh: supervision and compilation. Author 3, Ashok Kumar Pandey: supervision and proofreading.
Funding
The authors received no financial support for the research, authorship, and/or publication of this article.
Declaration of conflicting interests
The authors declared no potential conflicts of interest with respect to the research, authorship, and/or publication of this article.
Data Availability Statements
Some or all data, models, or codes that support the findings of this study are available from the corresponding author upon reasonable request. 1. A bridge is modelled in the SAP2000 software that can be provided. 2. A datasheet prepared in Excel and graphs prepared in Origin graph can also be provided.