
Abstract
Crude oil is the primary fuel and its price has a direct impact on oil exploration, exploitation, and other activities, as well as on the environment and on our economy. Hence, it is among the world's most abundant resources today. Crude oil is essential to the functioning of every modern economy. Considering crude oil's high volume of trading, speculators, analysts, and economists have vested interest in correctly projecting the commodity's future spot price. However, predicting such an apparently uncertain, economic environment is one of the primary challenges of econometric models. Oil price forecasts based on fundamental, technical, and time series analysis have been met with mixed success. This highlights the requirement for more refined methods of predicting future crude oil prices.
This study uses a neural network to objectively foretell the price of crude oil. There are thirteen predictors and one dependent variable in this study. In this study Neural Networks (NN) and time series techniques are used to forecast time series data and out of these NN have been found to be the most proficient method. The split in the data is 70-30. 30% of the data is being used to verify the accuracy of the network's predictions. Speculating on the future cost of crude oil, requires the employment of feed forward and back propagation algorithms. Latest neural networks techniques are quite predictive as time series models are beaten by even the simplest of neural networks. The results of the investigation showed that the back propagation algorithm is superior in predicting the cost of crude oil. Hence, ANN can be used by financiers, and forecasters.
Introduction
In the current business and economic environment, achieving realistic objectives or avoiding catastrophic failure needs accurate forecasting of a broad variety of financial parameters. The number of tried-and-true techniques for predicting financial time series is available in literature (Klassen, 2002). Multivariate time-series forecasting may be benefitted from the use of robust models such as the Box and Jenkins (ARMA) approach to stationary time series, which was found in the relevant literature. In order to keep things simple, traditional econometric models usually assume that variance of the disturbance is same (Sampath et al., 2018).
Several financial and economic time series, such as currency rate, inflation rate, etc., nevertheless show periods of extraordinarily significant volatility followed by times of relative tranquility. In cases like these, the variance is not constant throughout the course of the sample period, pointing to a kind of heteroscedasticity problem in which the variance of the disturbance depends on the size of the prior disturbance (Aziz et al., 2020)
Crude oil is a vital part of the international economy. It is playing an essential role in the development and growth of economies across the world, both developed and developing. There are a number of causes for the oil market's dramatic price swings, such as political events, harsh weather, financial sector speculation, and others (Cheng et al., 2022). Hence, fluctuations in oil prices have a magnified effect on a broad range of goods and services, which in turn, impacts local economies and cultures. Knowing how prices will likely evolve in the future is essential for protecting price fluctuations (Guleryüz, 2020).
Without having daily access to crucial information like oil supply, demand stocks, and GDP making prediction is much more difficult than the current scenario. There is a chance that the era of cheap oil will come down while oil consumption in OECD nations has decreased. Several studies have suggested that demand elsewhere will keep rising in the near future. But, non-OECD countries like China, where there is a rise in the middle class, are mostly responsible for the increase in global oil consumption (Perwej & Perwej, 2012). Moreover, because most oil originates in the unstable Middle East, further price volatility may be expected. So, it is useful for market traders and people to get a sense of the future direction of oil prices (Phua et al., 2000).
The light yellow crude oil found deep under the Earth's crust may be refined into several different types of fuels via a process called fractional distillation. Crude oil is processed into petroleum products in a similar fashion (Sarangi & Dublish, 2013). In today's globe, crude oil is one of the most important energy sources. It is more unrealistic to support the use of fossil fuels in view of their undeniable role in global warming and their other terrible effects on ecosystems (Sarangi & Sarangi, 2010).
A global movement is afoot to eventually eliminate fossil fuel consumption as a solution to the climate crisis. Oil plays an important role in global economy and culture, and it provides a substantial portion of the world's energy needs. In light of recent developments, experts now estimate that daily world consumption for petroleum might rise to as high as 95 million barrels. The volatility of oil makes it impossible to make accurate projections of crude oil prices, despite the fact that such predictions have far-reaching effects (Kimoto et al., 1990). ANN Method has developed into a potent instrument for predicting various data types in tandem with the emergence of automated systems and the desire to eliminate the need for human labor. In this study, we propose a technique for forecasting oil prices using artificial neural networks (Behradmehr, 2018).
The price of crude oil, along with economic and political factors, is highly correlated with the health of the economy. We offer a methodology for pinpointing the time lag in a selected data set. If you want a look into the future of the time and price series, since the previous years data have the largest influence on any prediction model, lag calculations are essential to foresee the future time and price series (Khullar & Singh, 2022). ANNs are well suited for usage as a prediction model due to their ability to replicate non-linear and complex interactions among input and output. Additionally, ANN may generalize, or extrapolate results beyond the specific context in which they were first developed. And since it doesn't impose any artificial links on the data, ANN is able to uncover previously unseen connections (Shaik et al., 2021).
One of the many methods which are being applied now and that have also been used in the past to anticipate future crude oil prices relies on experts or professionals with extensive experience in the sector (Graves et al., 2005). They achieve this by displaying their predicted prices on a graph after transforming the data using regression techniques like ARMA models because the oil market is so volatile, it is also a typical practice to simply assume that the current data or prices are predictive of what the future will bring (Gupta & Pandey, 2018).
Oil price fluctuations have taken the world off surprise. The oil-importing countries will be impacted in a variety of ways. Both the crude oil market and the road to economic recovery have been arduous. Since it is difficult to foresee the effects of these shifts, they need to be measured against the most crucial factors when assessing a country's economy (Khan et al., 2011). Macroeconomic factors provide more reliable comparisons than single entities.
Review of Literature
Vo et al. (2020) In order to forecast oil prices utilizing long-short-term memory in both directions, the BOP-BL model was devised. There are two main parts to the proposed model. The three Bi-LSTM layers in the core unit enable both forward and reversible feature learning. Using the first module's completely connected layer or characteristics of the second module oil price forecasts can be provided. In comparison to LSTM, CNN-LSTM, and CNN-Bi-LSTM networks, their technique showed the greatest prediction accuracy with RMSE & MAE values of 1.55 as well as 1.2, respectively.
Gabralla et al. (2019) analyzed the consistency of daily forecasting price of WTI crude oil from January 4, 1999, to October 10, 2012. The performance of machine learning algorithms on 3, 4, and 5 attribute datasets was evaluated to see how well they predicted outcomes and devised a model to predict movements in crude oil prices quite some time ago. When compared to other popular models like ANN, the Fibonacci technique, the golden ratio prototype, delayed loading values, and SVM, they discovered that their approach produced the best results in predicting future crude oil prices. Particle swarm optimization employing a long short-term memory approach was used to improve the performance of the approached model.
Gupta and Pandey (2018) advocated a model using ANN in order to predict future crude oil prices. The proposed model has the lowest root-mean-squared error (7.68) compared to the others. Crude oil price forecasts utilize a combination of LSTM, GRU, and AdaBoost-LSTM models. As compared to their respective baselines, AdaBoost-LSTM or AdaBoost-GRU models fared quite well. While using LSTM with Prophet to Predict Future Crude Oil Prices, it was discovered that the prophet algorithm produced the most reliable predictions.
Behradmehr (2018) developed an improved model for forecasting the spread between the New York and Gulf of Mexico prices of crude oil using wavelet transform and neural networks during periods of low market volatility. An artificial neural network was trained on the data after it was wavelet-smoothed to reduce noise in this integrated model. This research revealed that reducing noise in the data was beneficial for oil price predictions. The ARIMA econometric linear model and artificial neural networks were both used to forecast oil prices during further research by Pourkazemi and prediction errors were reduced by using OECD nations’ reserves as just an input in this study.
Gupta and Pandey (2018) tried to predict crude oil prices using Long Short Term Memory based recurrent neural networks. They experimented with different types of models with different epochs, look backs and other turning models. The results obtained are promising and presented a reasonably accurate prediction for the price of crude oil in near future.
Güleryüz and Özden (2020) used LSTM and FBPr on a dataset consisting of 32 years’ worth of weekly oil prices to boost confidence in forecasts for the price of Brent crude oil. The optimal model has been achieved. The accuracy of the predictions was evaluated by first training on a reduced portion of the whole dataset and then testing on the remaining subset. Only 25 of the 32 years data were utilized as the actual training data. The LSTM and FBPr models’ R2 values peaked at 0.92 and 0.89 during training and 0.62 and 0.89 during testing, respectively. The findings demonstrate the LSTM model's superiority over competing approaches in predicting future oil prices.
Chen et al. (2017) used Brent oil price trends of the past to predict the future direction of oil prices. Four types of errors were calculated for this research to guarantee the reliability of the model or its error estimates. Mean absolute error (MAE) was 1.1962, while the RMSE was 1.9164. They were able to understand the dynamics of the crude oil market better by incorporating crude oil price forecasts into their own work, and acknowledged the use of a deep learning model to highlight the nonlinear aspects of oil price fluctuations. This model was used to assess the dramatic change in crude oil prices and to make predictions about their potential future movement. To evaluate the model's performance, they utilized a database of past WTI crude oil prices. Predictions made with the model performed better in experiments.
Moitra et al. (2021) employed a limited memory neural network instead of a convolutional neural network to make crude oil price predictions. The findings gave cause for optimism, indicating that future crude oil price forecasts might be more accurate and a hybrid model incorporating both LSTM algorithms and in-depth network analysis was offered. The results showed that the new model is an improvement over the old one in terms of accuracy, consistency, and reliability.
Aziz et al. (2020) used RNN-LSTM networks to look into the future of crude oil costs based on historical data and technological concerns. They used historical estimates of crude oil prices for training the model, and then compared its predictions to those of competing approaches using accuracy metrics. The model's predictions of crude oil price changes showed that RNN-LSTM algorithm performed very well.
Jammazi and Aloui (2019) studied oil price projections using wavelet analysis and neural network modeling. Since predicting the future price of crude oil is difficult, Yao and Wang proposed a multi-stage forecasting approach based on EMA, LSTM, or even the GM model. Results showed this model to be rather accurate, especially for series demonstrating long-term effects at lower frequency, and that the GM model (1, 1) has outstanding performance with trend of projecting crude oil prices, which were made accessible on a daily, weekly, and monthly basis.
Sarangi (2017) used GARCH and ANN models to examine the bullion trading market, focusing specifically on gold. This topic is of great interest to analysts, researchers, and especially investors, as it can help them make the most of their money. There is conclusive evidence that ANN models outperformed GARCH models in terms of reducing forecasting error.
Material and Methods
The investigation was conducted using quantitative methods. This study makes use of statistical, mathematical, and computational methods to conduct an empirical analysis of observable data. Quantitative research seeks to use mathematical and statistical methods, models, and hypotheses to interpret and explain findings. There is an emphasis on using statistical methods to collect objective data. Findings will be definitive, and the study attempts to quantify the outcomes and their prevalence by sifting through the data for generalizable patterns. Fourteen different factors were considered for this analysis. There is just one dependent variable and thirteen independent ones. Data was gathered from the NSE and the PPAC. The information about the USD/INR exchange rate was obtained from the RBI.
Dataset
The timeline for this data collection begin in April 2012 and extended through August 2020. All of the factors were averaged over the course of a month within that time frame.
Sources of Data
Both the CPI and the USD/INR exchange rate data come from the Reserve Bank of India's website. NSE's website is mined for stock prices and the NIFTY 50 index. Information on crude oil's supply, demand, price, and volume of trade may be found on the PPAC webpage.
Selection of Oil Companies
Among the most powerful companies in the international oil and gas industry are Reliance Industries Limited, Bharat Petroleum Corporation Limited, and Hindustan Petroleum Corporation Limited, Oil and Natural Gas Corporation, Mangalore Refinery and Petrochemicals Limited, and the Indian Oil Company.
Models and Methods
Both the feed forward and reverse propagation algorithms of the Artificial Neural Network were used in this research. (ANN). The factors that affect the cost of crude oil are isolated using multiple linear regression models. Artificial neural networks (ANNs) are computer models that take their architecture and functions directly from those of biological neural networks. Nonlinear ANNs are used to model or identify patterns in data that include complicated interactions between inputs and outputs.
The term “neural network” may also be used to describe an ANN (Smagulova & James, 2019). Three possible linked layers make up ANNs. In this brain region, the first layer contains cells called entry neurons. Records are sent from the first layer neuron straight to the second layer, whose output neurons are then passed on to the third layer. Standard neural networks have one input layer, one output layer, and many hidden layers in between. During the training process, we make changes to the weights and biases that make up that layer. Seventy percent of the data is utilized to train the model, while the remaining thirty percent is used for validation (Swapna et al., 2023) (Figure 1).
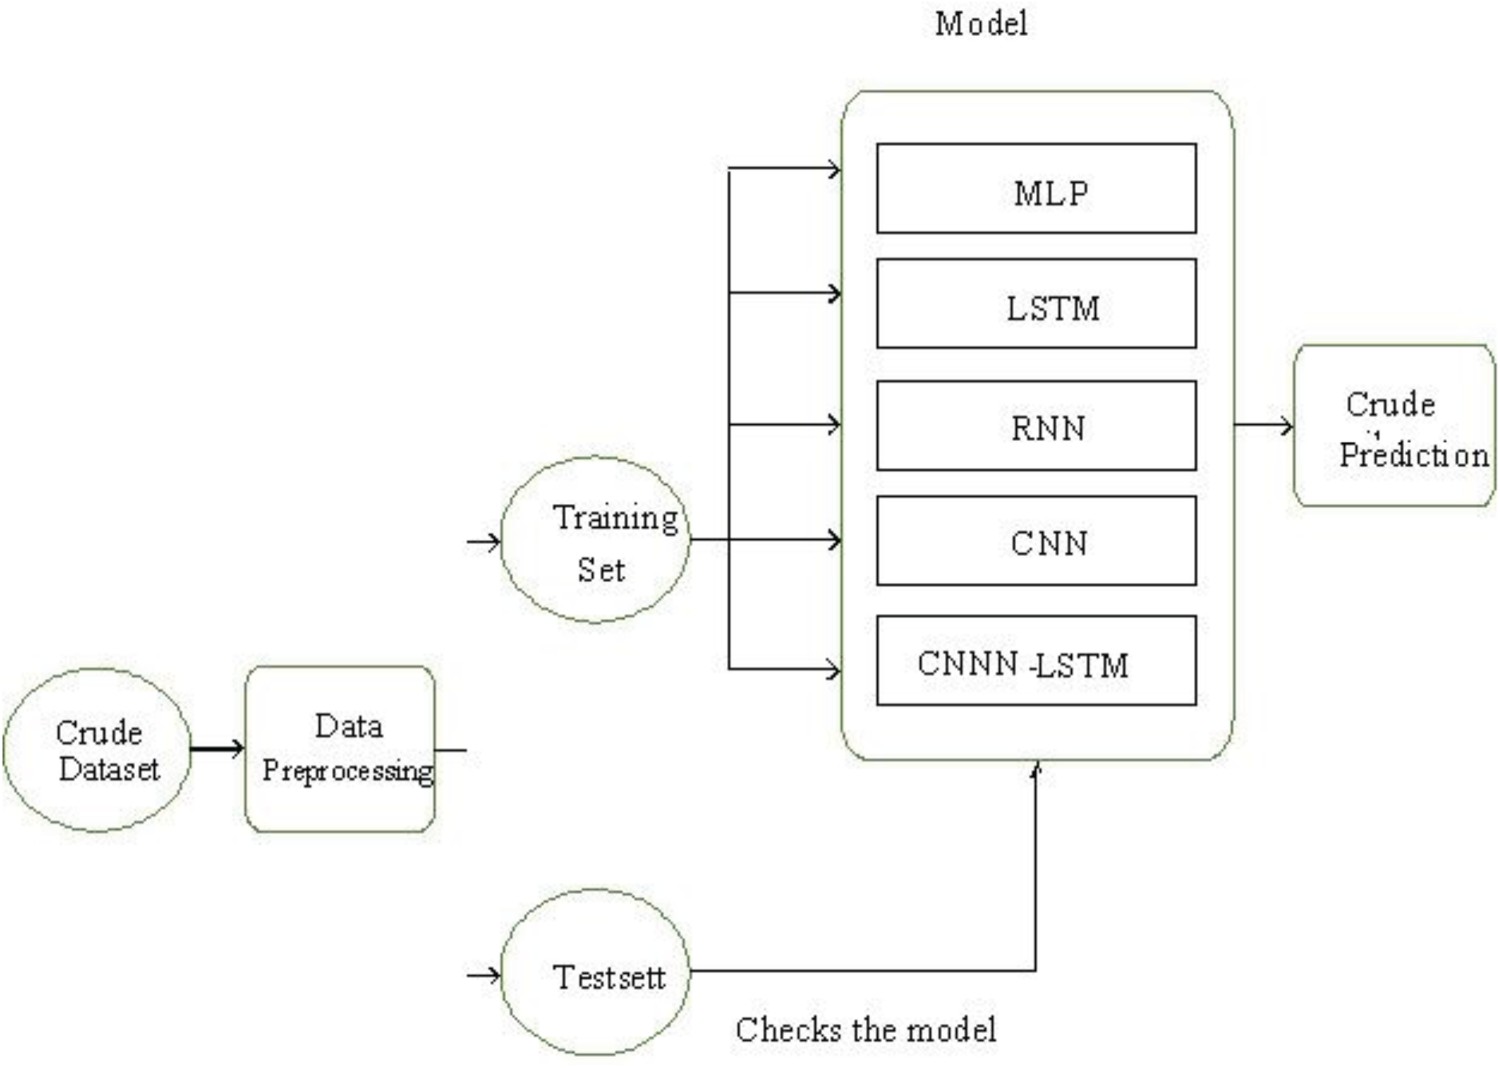
Architecture of a proposed deep learning (neural network) model for crude oil.
Steps for implementation of Deep Learning (Neural Network) Models
Step 1: importing oil prices constraints.
Step 2: Install libraries and packages.
Step 3: Data is pre-processed.
Step 4. Data sets are divided into training and testing sets.
Step 5: The best crude oil prices was forecasted using the machine learning and deep learning techniques.
The performance of the model is tracked using the test set. The model produces an error, a valuation mismatch, or an incorrect prediction when an irrelevant value is provided as an input.
Neural networks are made up of a thousand simple processing units connected closely. The construction and operation of these systems are based on knowledge of biological neurons. A non-linear approximation is one that is used in numerical or computational models of neural networks. Deep learning models of biological neural systems are called neural networks. A model neuron serves as the foundation for the majority of neural networks. It is a single-output neuron since it has numerous inputs but only one output. A weight is given to each input, and the value of the input is multiplied by the allotted weight. The neuron will be guided as it collects these weighted inputs and produces its output by a threshold value and activation function. This idea suggests that neurons function similarly.
In artificial neural networks, a node layer consists of an input layer, one or more hidden layers, and an output layer (ANNs). The Nodes are linked together and given a threshold and weight. A node becomes active when its output reaches a predetermined threshold. In the absence of this, the data is sent to the next layer of the networks.
Feed Forward Algorithm
This biologically-motivated classifier is called a feed forward neural network. It is made up of many layers of basic processing units that resemble neurons. Each layer has units that are connected to one another. It is the most basic kind of neural network.
Back Propagation Algorithm
The simulation in this approach makes use of predetermined weights. Mean Absolute Error and Root Mean Squared Error are computed to compare and assess the accuracy of the final result. It is possible for an ANN to have a varying number of inputs, a varying number of hidden layers, and a varying number of outputs (Wang & Leu, 1996). As the number of layers of intricacy grows, so does the difficulty of unraveling them. The precision and accuracy of the final product may be improved by increasing the number of hidden layers (Swapna et al., 2024).
Forecasting the Crude oil Prices Using ANN
The ANN technique is one of the powerful deep learning models. In this the total observations are divided in to three sets training, testing and validation. The first 50% of the observations as the training, the second 25% as validating and the last 25% as the testing. The first 50% data has been developed in models. Next, the model is evaluated with the rest 50% data. Finally, the model accuracy was then assessed and compared to the MSE, RMSE, MAE, MAPE, and R2.
The actual, projected and error values from the crude oil prices are found to analyze the model performance.
Multiple Linear Regression Model
Crude oil production, consumption, exports, and imports, along with key six stock prices, exchange rate, inflation, and the Nifty index are just a few of the thirteen independent variables in this analysis. Crude oil price is the dependent variable.

Multiple regression in economics for crude oil prediction uses machine learning (ML) to model complex relationships between oil prices (dependent variable) and factors like production, consumption, imports and exports, and economic indicators (independent variables), with techniques ranging from basic linear regression to advanced.
The starting prices represent both the dependent variable and the independent variable of the research. Forecasting and regression analysis need standardization of the data, which is impossible without standardization (Tang & Fishwick, 1993). The data-normalization formula is:

Independent variables: Data sets include the US dollar Indian rupee exchange rate, the Nifty 50 index, the consumer price index, crude oil output, crude oil consumption, and total crude oil exports and imports. Stock Quotes for BPCL, IOC, RIL, ONGC, MRPL, and HPCL. Normalized values of the data were utilized for forecasting analysis and regression analysis in this research.
Forecasting Performance Evaluation Tool
Root Mean Square Error (RMSE): The dissimilarity of numbers is quantified by the Root Mean Square Error (RMSE). The model's predictions and observed values are shown below. The RMSE-measured deviations are known as residuals. This technique also referred to as “Root Mean Square Deviation.” (RMSD). The root-mean-squared deviation (RMSD) is useful for forecasting since it sums the mistakes together. It is a test of how well the model works (Swapna et al., 2020).

Mean Absolute Error (MAE): The difference between two continuous variables is known as the Mean Absolute Error (MAE). For continuous variables, the MAE is a useful accuracy metric. By averaging the amount of the errors over a collection of forecasts, we get MAE. However, it does not account for the magnitude's directionality.

Mean absolute percentage error (MAPE): One way to evaluate a forecasting method's predictive accuracy is by the calculation of its Mean Absolute Percentage Error (MAPE). Precision is expressed as a percentage. It is defined by the formula:

The results of this paper shows time series data how well it fit the different model and identify a best model for analysis and prediction of crude oil prices at identified data. In this study, the models that have been identified to be more appropriate for the statistical analysis using the available data.
Variables of the Study
Variables of the study are categorized as independent and dependent of the source. The name of variables of crude oil price in the international market exhibits characteristics of the variable with respect to its source. The nature of the variable represents the availability of the source to expand the crude oil business in the international market which leads to the economic growth a nation.
In this study, a variable Indian crude oil price serves as the dependent variable. This variable exhibits the average price of crude oil imported and consumed in India. One of the independent variable, the consumption of crude oil represents the total domestic usage of crude within India. Higher consumption levels generally indicate stronger industrial and economic activity, which may influence price levels.
The variable, imports of crude oil represent the quantity of oil brought into the country to meet domestic demand. Higher import levels may signal increased consumption demand. These variables are sourced from the Oil Industry Analysis and Planning Unit.
The Consumer Price Index (CPI) and the USD/INR exchange rates, which are obtained from the source from the Reserve Bank of India (RBI) and are the additional independent variables. Along with the Nifty index, which is also supplied from NSE India, the model also incorporates oil firm share prices for six major public companies: RIL, BPCL, HPCL, IOC, ONGC, and MRPL.
The above Figure 2, shows that there is good correlation coefficient value and this is a good fit to the data. Forecasting accuracy should also be assessed. The MSE, RMSE, MAPE and R2 are used.
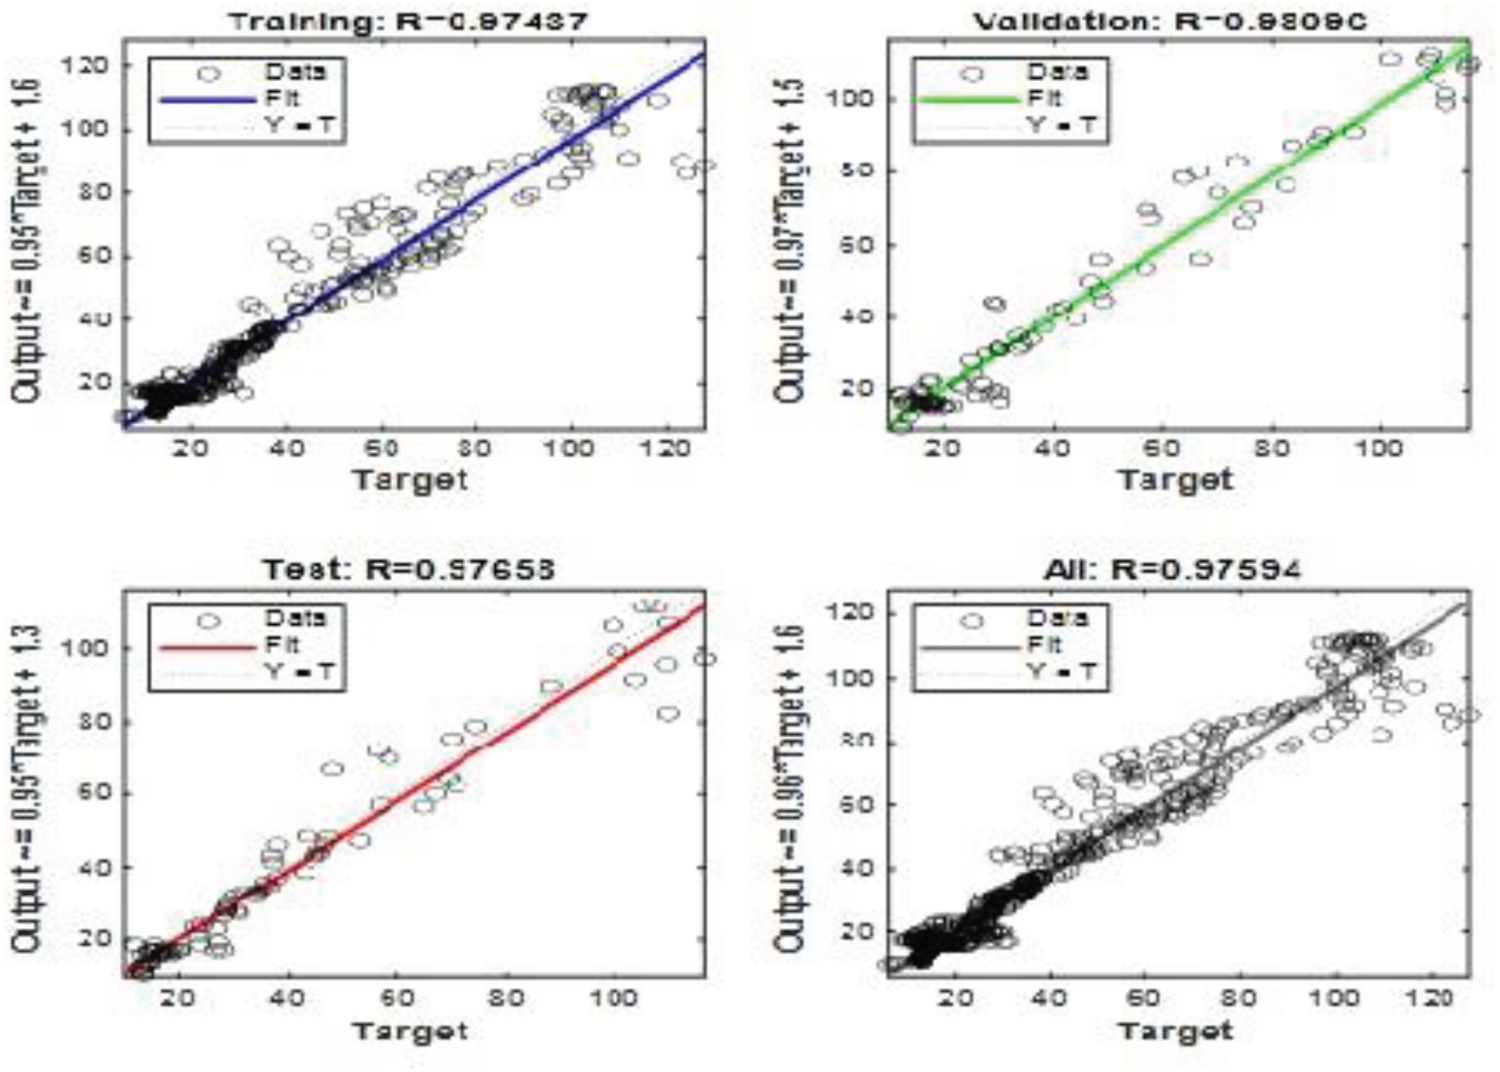
Crude oil prices – actual, predicted and validation plot using ANN.
Validation performance refers to how well an Artificial Neural Network generalizes to unseen data during the training process. It is a major source of indicator whether the model is learning meaningful patterns or simply memorizing the training data.
This model is identifying the performance best at its epoch value. The mean square error used for minimize its error at the best epoch value and which is used for identify the best model. The MSE of ANN model used for training, validation and test the data significantly. The output from the model shows that the MSE in the validation step is least at epoch 4 which has the best validation performance equal to 36.7897 means there is over fitting.
Forecasting the Crude Oil Prices Using ANN
Forecasting crude oil prices is a challenging task due to their high volatility, non-linear patterns, and influence from geographical and economic factors. Artificial Neural Networks (ANNs) are effective model for forecasting because it learns non-linear relationships between previous price movements and future values.
The ANN model exhibits the strong validation and testing performance in crude oil price forecasting. The small gap between training, validation, and test errors indicates good generalization capability. The ANN model effectively captures nonlinear patterns in crude oil price movements, and making it a reliable tool for short-term price forecasting. The output form the crude oil price data on actual, expected and residual crude oil prices are used to evaluate the model's performance.
From the result output of ANN model, it shows that the best validation Performance is 1.3718 at epoch 40 means out of 46 iterations has been done to compare the data, at 40 iterations the best performance is reached means there is best fitting.
The above Figure 3 shows that there is equal and good correlation coefficient value for training and testing data and this is a good fit to the data. Forecasting accuracy should also be assessed. The MSE, RMSE, MAE, MAPE and R2 are used.
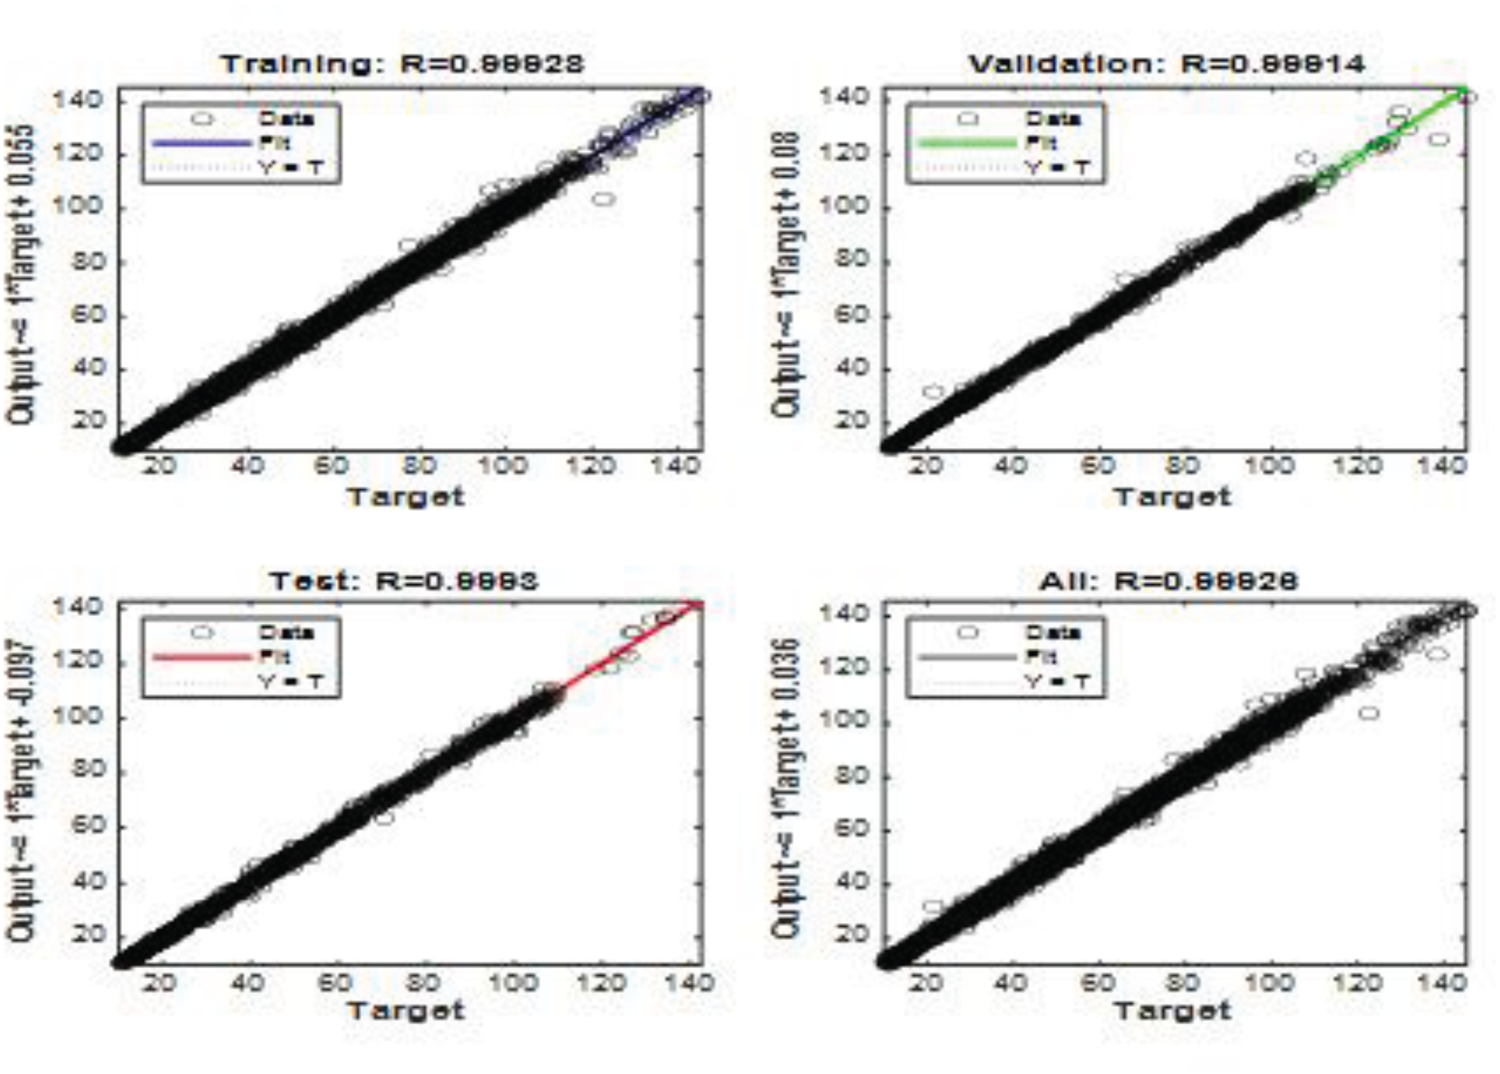
Crude oil prices – validation plots for training and testing data using ANN.
In general phenomenon of time series statistics a model is classified as efficient at its higher R2 and minimum error estimates. From the output of ANN model, it is exhibited that the numerical value of R2 is quit higher 0.99 and the minimum MAE and MAPE values 0.70, 1.71 respectively crude oil price is identified when compare to the other model. Therefore, the ANN model fits well to the crude oil price.
Artificial neural networks (ANNs) are computer models that take the architecture and function cues directly from those of biological neural networks. Nonlinear ANNs are used to model or identify patterns in data that include complicated interactions between inputs and outputs.
Time series plot of real and anticipated values using feedforward neural network is shown in Figure 4. The forecasted prices are not drastically different from the actual numbers. The expected cost at various time points is shown graphically. We may deduce that the expected price is not too far off from the real price to the graph. Figure 4 shows a comparison between the back propagation estimate and the actual price of crude oil. Beginning with a fairly larger discrepancy between predicted and observed values, errors gradually decreased. This is due to the fact that the network makes adaptive weight adjustments, which also helps to minimize errors.
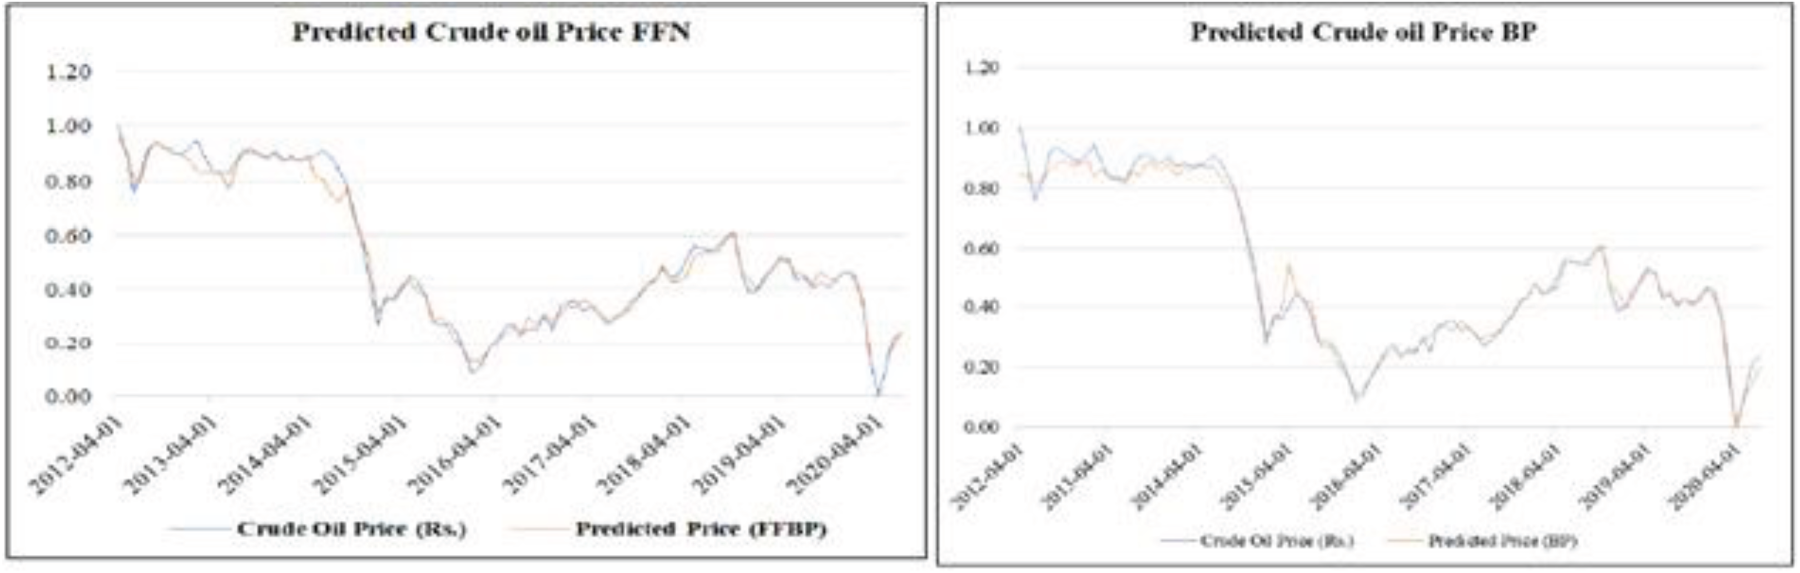
Feed forward and backward neural network used to predict the price of crude oil.
Table 1 represents the crude oil time series analysis, multiple linear regression model (MLRM) often used to predict values based on its past observations. In general, AIC and BIC values help in identify the appropriate model by quantifying between model pattern and its parameters. AIC and BIC values generally balance the model fit of the data but they may differ in complexity. The MLRM model is good fit to the crude oil data at its AIC value 423.142 and BIC at 398.235.
The Multiple Linear Regression Model Results.
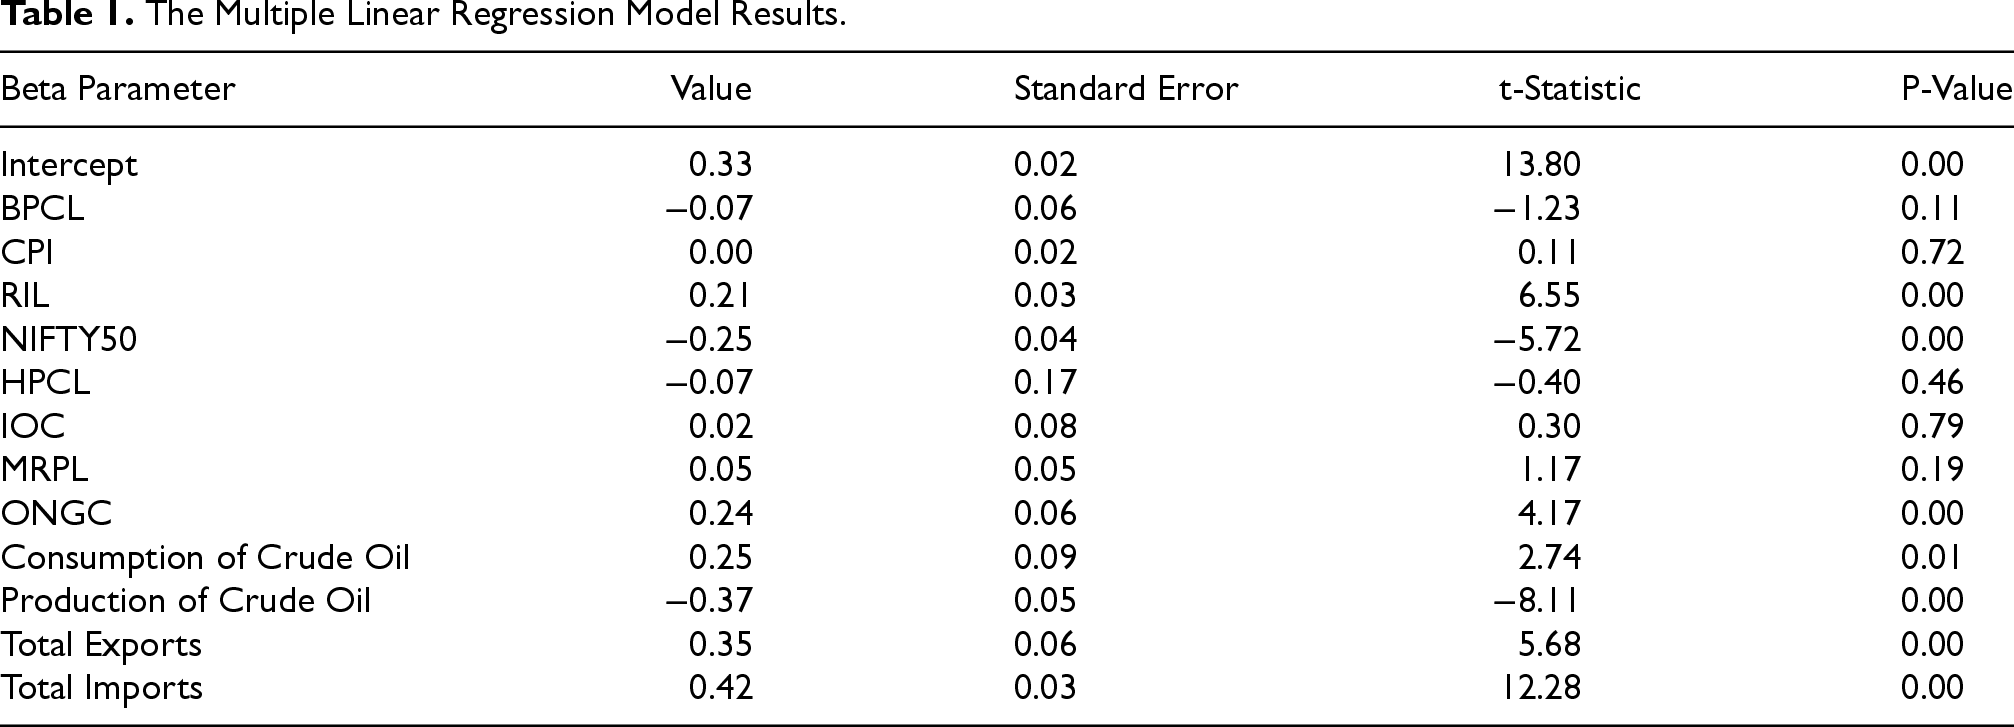
The Multiple Linear Regression Model Results.
Multiple linear regression model used to measure the prediction of crude oil price at several independent variables and one dependent variable. It is suitable model to predict the crude oil price in the international market. From the output of this model it is observed that the multiple linear regression model has higher MAE, MAPE values 17.08, 61.45 respectively and lowest R2 value 0.48, therefore the multiple linear regression model is not an appropriate model for forecasting the monthly cost of crude oil.
A close examination of the preceding data reveals that the Nifty 50, ONGC, output, RIL, exports, and imports all have significant effects on the price of crude oil. Figure 5 displays the price estimates produced using the MLRM. The graph shows several deviations between the projected and actual values since the regression model is a one-way model that only takes into account the input variables.
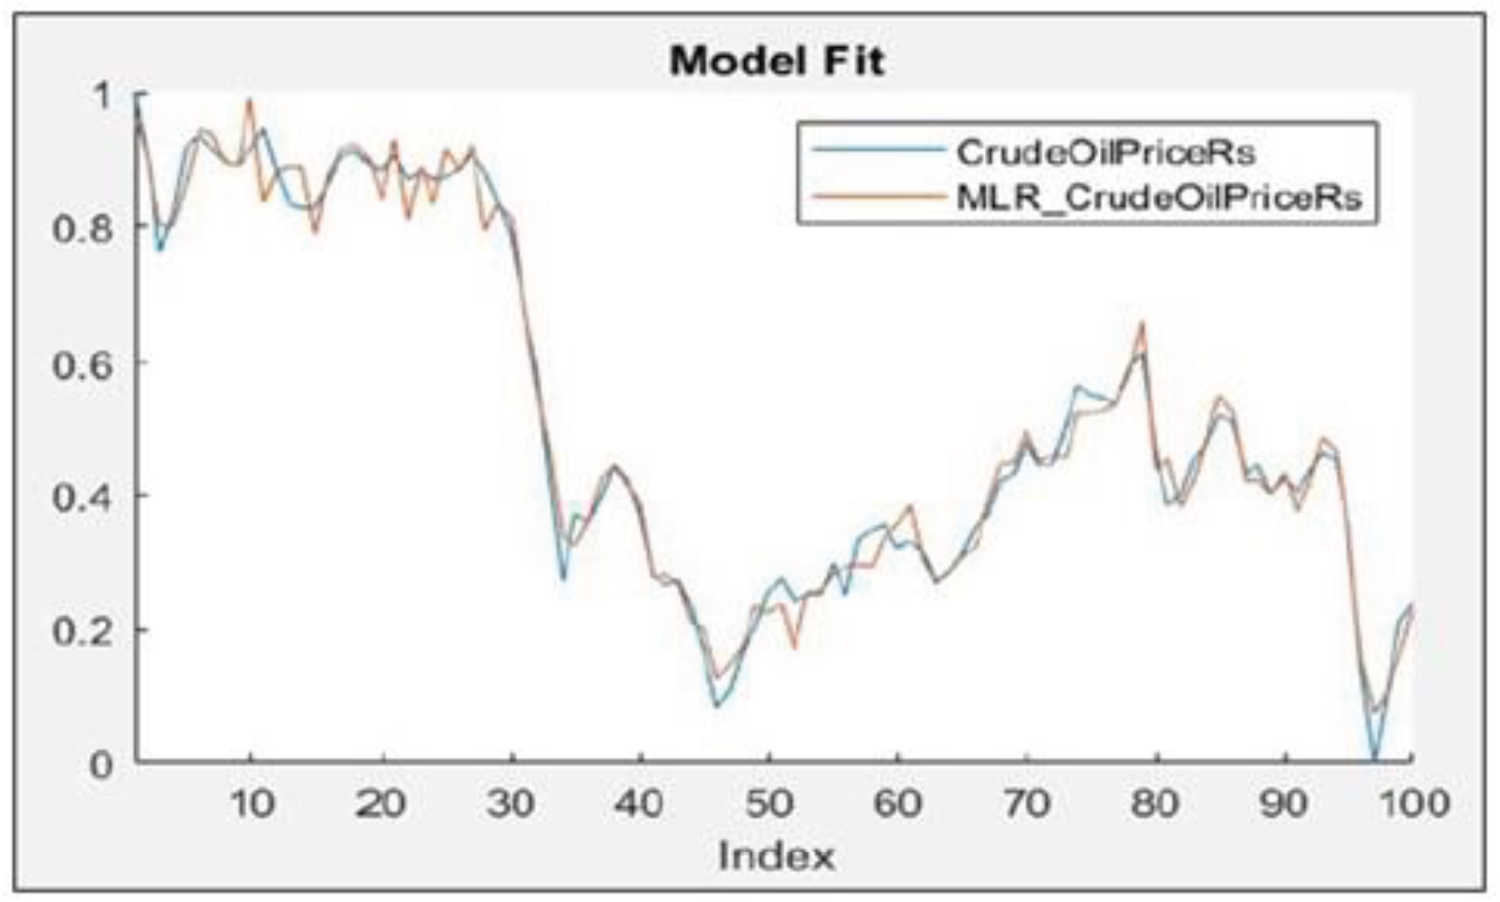
MLRM model fit.
The most widely traded commodity is crude oil. Many nations’ economies are directly tied to the price of crude oil. Crude oil prices are extremely unstable, swinging wildly in response to changes in supply, demand, and even outside influences. High returns are usually expected by the investors. Here's when forecasting comes in handy for cutting costs and boosting returns. Root Mean Squared Error, Mean Absolute Error, and Mean Absolute Percentage Error are some examples of performance indicators used to evaluate the accuracy of the anticipated output.
Estimation errors for both feedforward and backpropagation neural networks are listed in Table 2. Training the data refers to the construction of a mathematical model using deep learning algorithm for analysis of crude oil and testing the data refers to evaluate the accuracy of output from the model. A more effective model is one with smaller standard deviations.
Forecasting Results of Feedforward and Backpropagation.
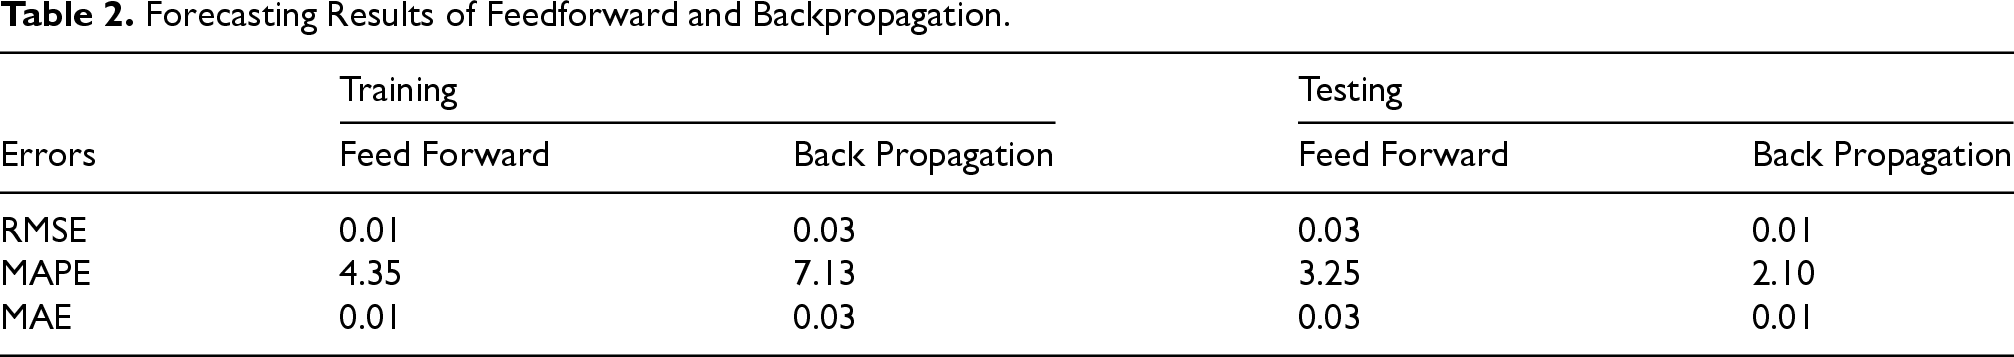
Forecasting Results of Feedforward and Backpropagation.
The feedforward neural network did better than the backpropagation one during training. It is clear from the results of the tests that the Backpropagation neural network is quite effective in validating the data. Therefore, when comparing the two methods for predicting the price of crude oil, Backpropagation neural network comes out on top.
We construct a neural network to get the best crude oil price lag in AI crude oil price prediction. ANN solves difficult issues that conventional methods cannot. This research predicted oil prices using feedforward and back propagation algorithms. Backpropagation outperformed feedforward in price prediction. Backpropagation forecasts oil prices better based on RMSE, MAE, and MAPE. Using regression, we can see that crude oil prices are influenced by consumption, the Nifty 50, ONGC, production, RIL, exports, and imports.
Profits might be increased, hence investment risk decreases. It is helpful for entering new markets and managing existing investments. To make accurate predictions, ANN models should be used in the future. The study's components are some of the factors that affect crude oil prices. Moreover, models of neural networks based on RNNs, CNNs, and LSTMs are more robust and efficient for use in the future. These models may recur data points beyond the data sets, making them suitable for future investigation. The model will use fundamental data and market movements to increase accuracy and performance.
Footnotes
Funding
The authors received no financial support for the research, authorship, and/or publication of this article.
Declaration of Conflicting Interests
The authors declared no potential conflicts of interest with respect to the research, authorship, and/or publication of this article.