
Abstract
Background
We have used a contrast injection scheme termed as “guided catheterization method (guided method).” By using a large-bore 5-Fr catheter and 0.032-in guidewire, a contrast medium could be injected without removing the guidewire. Using a neurovascular phantom, we studied the influence of leaving the guidewire on the contrast injection pressure. Image quality was compared with that obtained using a 4-Fr regular angiography catheter (conventional method).
Methods
Actual contrast injection pressure, flow rate, flow volume, and several variables from the time-density curve (TDC) were obtained using the guided method and the conventional method. Catheterization parameters included flow rate, the viscosity of a contrast medium (CM), and catheter length. The pressure limit of a contrast injector was set as 1200 psi. Digital subtraction angiography (DSA) images on the neurovascular phantom were acquired. The DSA images were processed, and TDC on a specific region of interest was obtained. Variables from TDC were calculated and compared between the different catheters.
Results
The ranges of actual contrast injection pressure with the conventional and the guided method were 138–299 psi and 184–451 psi, respectively. A minimal reduction of the actual flow rate was found under some conditions with the guided method. Comparable opacifications in DSA images were achieved in all conditions. Although peak intensity was different by flow rate or CM, all TDC variables did not differ based on the catheter. There were no significant harmful events during the 90 experiments.
Conclusions
With adjustment of the pressure limit, cerebral angiography using the 5-Fr, large-bore catheter without removal of the guidewire is feasible, safe, and expected to provide image quality comparable to that of the 4-Fr regular catheter.
Introduction
Despite the recent popularity of noninvasive imaging techniques such as magnetic resonance (MR) angiography and computed tomography (CT) angiography,1–4 cerebral catheter angiography remains the gold standard in neurovascular angiographic imaging.5–7 As the global population is aging, vascular tortuosity is become more common in patients due to the process of aging and combined atherosclerosis. 8 It is often difficult to overcome vascular tortuosity using a conventional angiography catheter, and various catheter shapes may be required. Surprisingly, there has been little advance in the conventional catheterization method compared with great progress in the various technologies for neurointerventional procedures.
To cope with the increasing demand in conventional cerebral angiography, we started to apply an angiographic method, which we coined as the “guided catheterization” method (guided method). Briefly, this system consists of a 5-French (Fr), large-bore (0.054 inches in inner diameter) angiography catheter, a 0.032-in stiff guidewire (GW) and a continuous flushing system with heparinized saline. With this system, a contrast medium (CM) could be injected while the guidewire was in place, which obviated the need for guidewire removal for CM injection during angiographic image acquisition. 9
Since the GW was inserted in the catheter all the time, we could save procedure time, get better arterial navigation even in tortuous vessels, and improve stability of the catheter tip position. However, there was a limitation of reduced injectable residual catheter lumen due to loss of the space occupied by the GW despite increasing the inner diameter (ID) of the catheter and using a thinner GW. Therefore, we could expect a higher injection pressure in the mechanical injector to achieve the target flow rate for optimal cerebral angiographies considering the Poiseuille equation.10,11 As the flow rate is associated with image quality, any effect of difficulties in achieving the target flow rate on image quality needs to be evaluated. 12
The pressure limit should not be set too high or too low for both protecting the whole catheterization system and achieving the target flow rate.13,14 Until now, the pressure limit has been set empirically from 300 − 600 psi for fear of potential arterial injury during selective angiography. 15 We thought a detailed understanding of the CM injection dynamics according to the changes of the injection parameters in both conventional and guided catheterization methods will help determine the proper pressure limit for usual cerebral angiography.
This experiment aimed to determine the injection pressure required in the conventional angiography catheter system, which we commonly use in our routine cerebral angiography and the guided catheterization method. Using a neurovascular phantom, we evaluated the change in the CM injection pressure and quantitatively analyzed the image quality according to the injection volume and rate, catheter length, and viscosity of the CM.
Materials and methods
Angiography catheters and guidewire
A 4-Fr conventional angiography catheter (JUNGSUNG MEDICAL, Seoul, Korea) had a 0.041-in ID. Two available lengths of the 4-Fr catheter were 100 and 125 cm. A 5-Fr angiography catheter (Grafia; SUNGJIN-HITECH, Suwon, Korea) had a soft tip and a 0.054-in ID. The available length of the guided angiography catheter was 100 cm. The GW (Anguis; SUNGJIN-HITECH, Suwon, Korea) had elastic nitinol core with black polyurethane jacket and a 0.032-in outer diameter. The GW was fortified by the modification of the inner core wire. The calculated hydraulic diameter of the guided method was 0.022-in.
Catheterization parameters and conditions
Catheterization parameters were selected as follows: 4 cc/s or 6 cc/s for flow rate; 100 cm or 125 cm for length; and iopamidol 300 mgI/mL (viscosity: 8.8 cP at 20 °C, 4.7 cP at 37 °C; Pamiray. Dongkook Lifescience, Seoul, Korea) or iodixanol 270 mgI/mL (viscosity: 12.7 cP at 20 °C, 6.3 cP at 37 °C; Visipaque. GE healthcare, Chicago, Illinois) for different viscosity settings. As a result, we could set 10 different conditions, which we designated using the letters A to J (Table 1). Every injection with a 100-cm catheter was repeated ten times, whereas every injection with a 125-cm catheter was repeated five times to minimize the number of injections. Thus, the total number of angiographic experiments was 90.
Conditions developed by the combination of catheterization parameters.
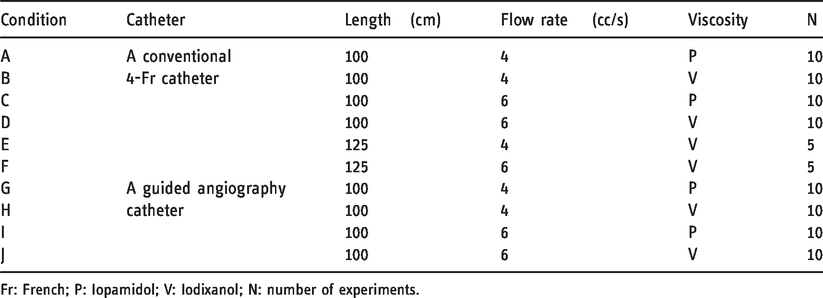
Fr: French; P: Iopamidol; V: Iodixanol; N: number of experiments.
Neurovascular phantom model and flow system
We used a house-made neurovascular silicone model fabricated using the 3-D printed middle cerebral artery (MCA) aneurysm model covering the right internal carotid artery (ICA) from the cervical to the middle cerebral artery M2 segment and the anterior cerebral artery A3 segment. After connecting the vascular phantom to the flow circuit, the configured flow system consisted of a bath, a pump, an arterial phantom, and an acrylic hollow cistern filled with a sponge and a drainage bottle (Figure 1). We decided to add the sponge to mimic the vascular resistance of the cerebral capillary system, which requires further validation. Since we needed to inject CM repeatedly through the circuit, we continuously infused the system with fresh fluid using a peristaltic pump (Ecoline VC-380; ISMATEC, Wertheim, Germany) and drained it out together with the injected CM during the experiment. We performed the experiment at room temperature. The fluid was a 50:50 glycerol/water mixture. The calculated viscosity of the fluid was approximately 8.3 cP at 20 °C. The bath (BW-05G; Lab Companion, Seoul, Korea) contained the fluid at room temperature. Since fluid consumption would be huge if we fully depended on the pump to maintain systolic pressure, the potentiometer of the pump was set to 18% (63 rpm) and the outflow tract was elevated 190 cm above the phantom. In this manner, we could achieve a systolic pressure of 100 − 120 mmHg. We monitored the pressure to confirm constant systolic pressure. Further, we installed the sponge material in the same manner as in the previous study.
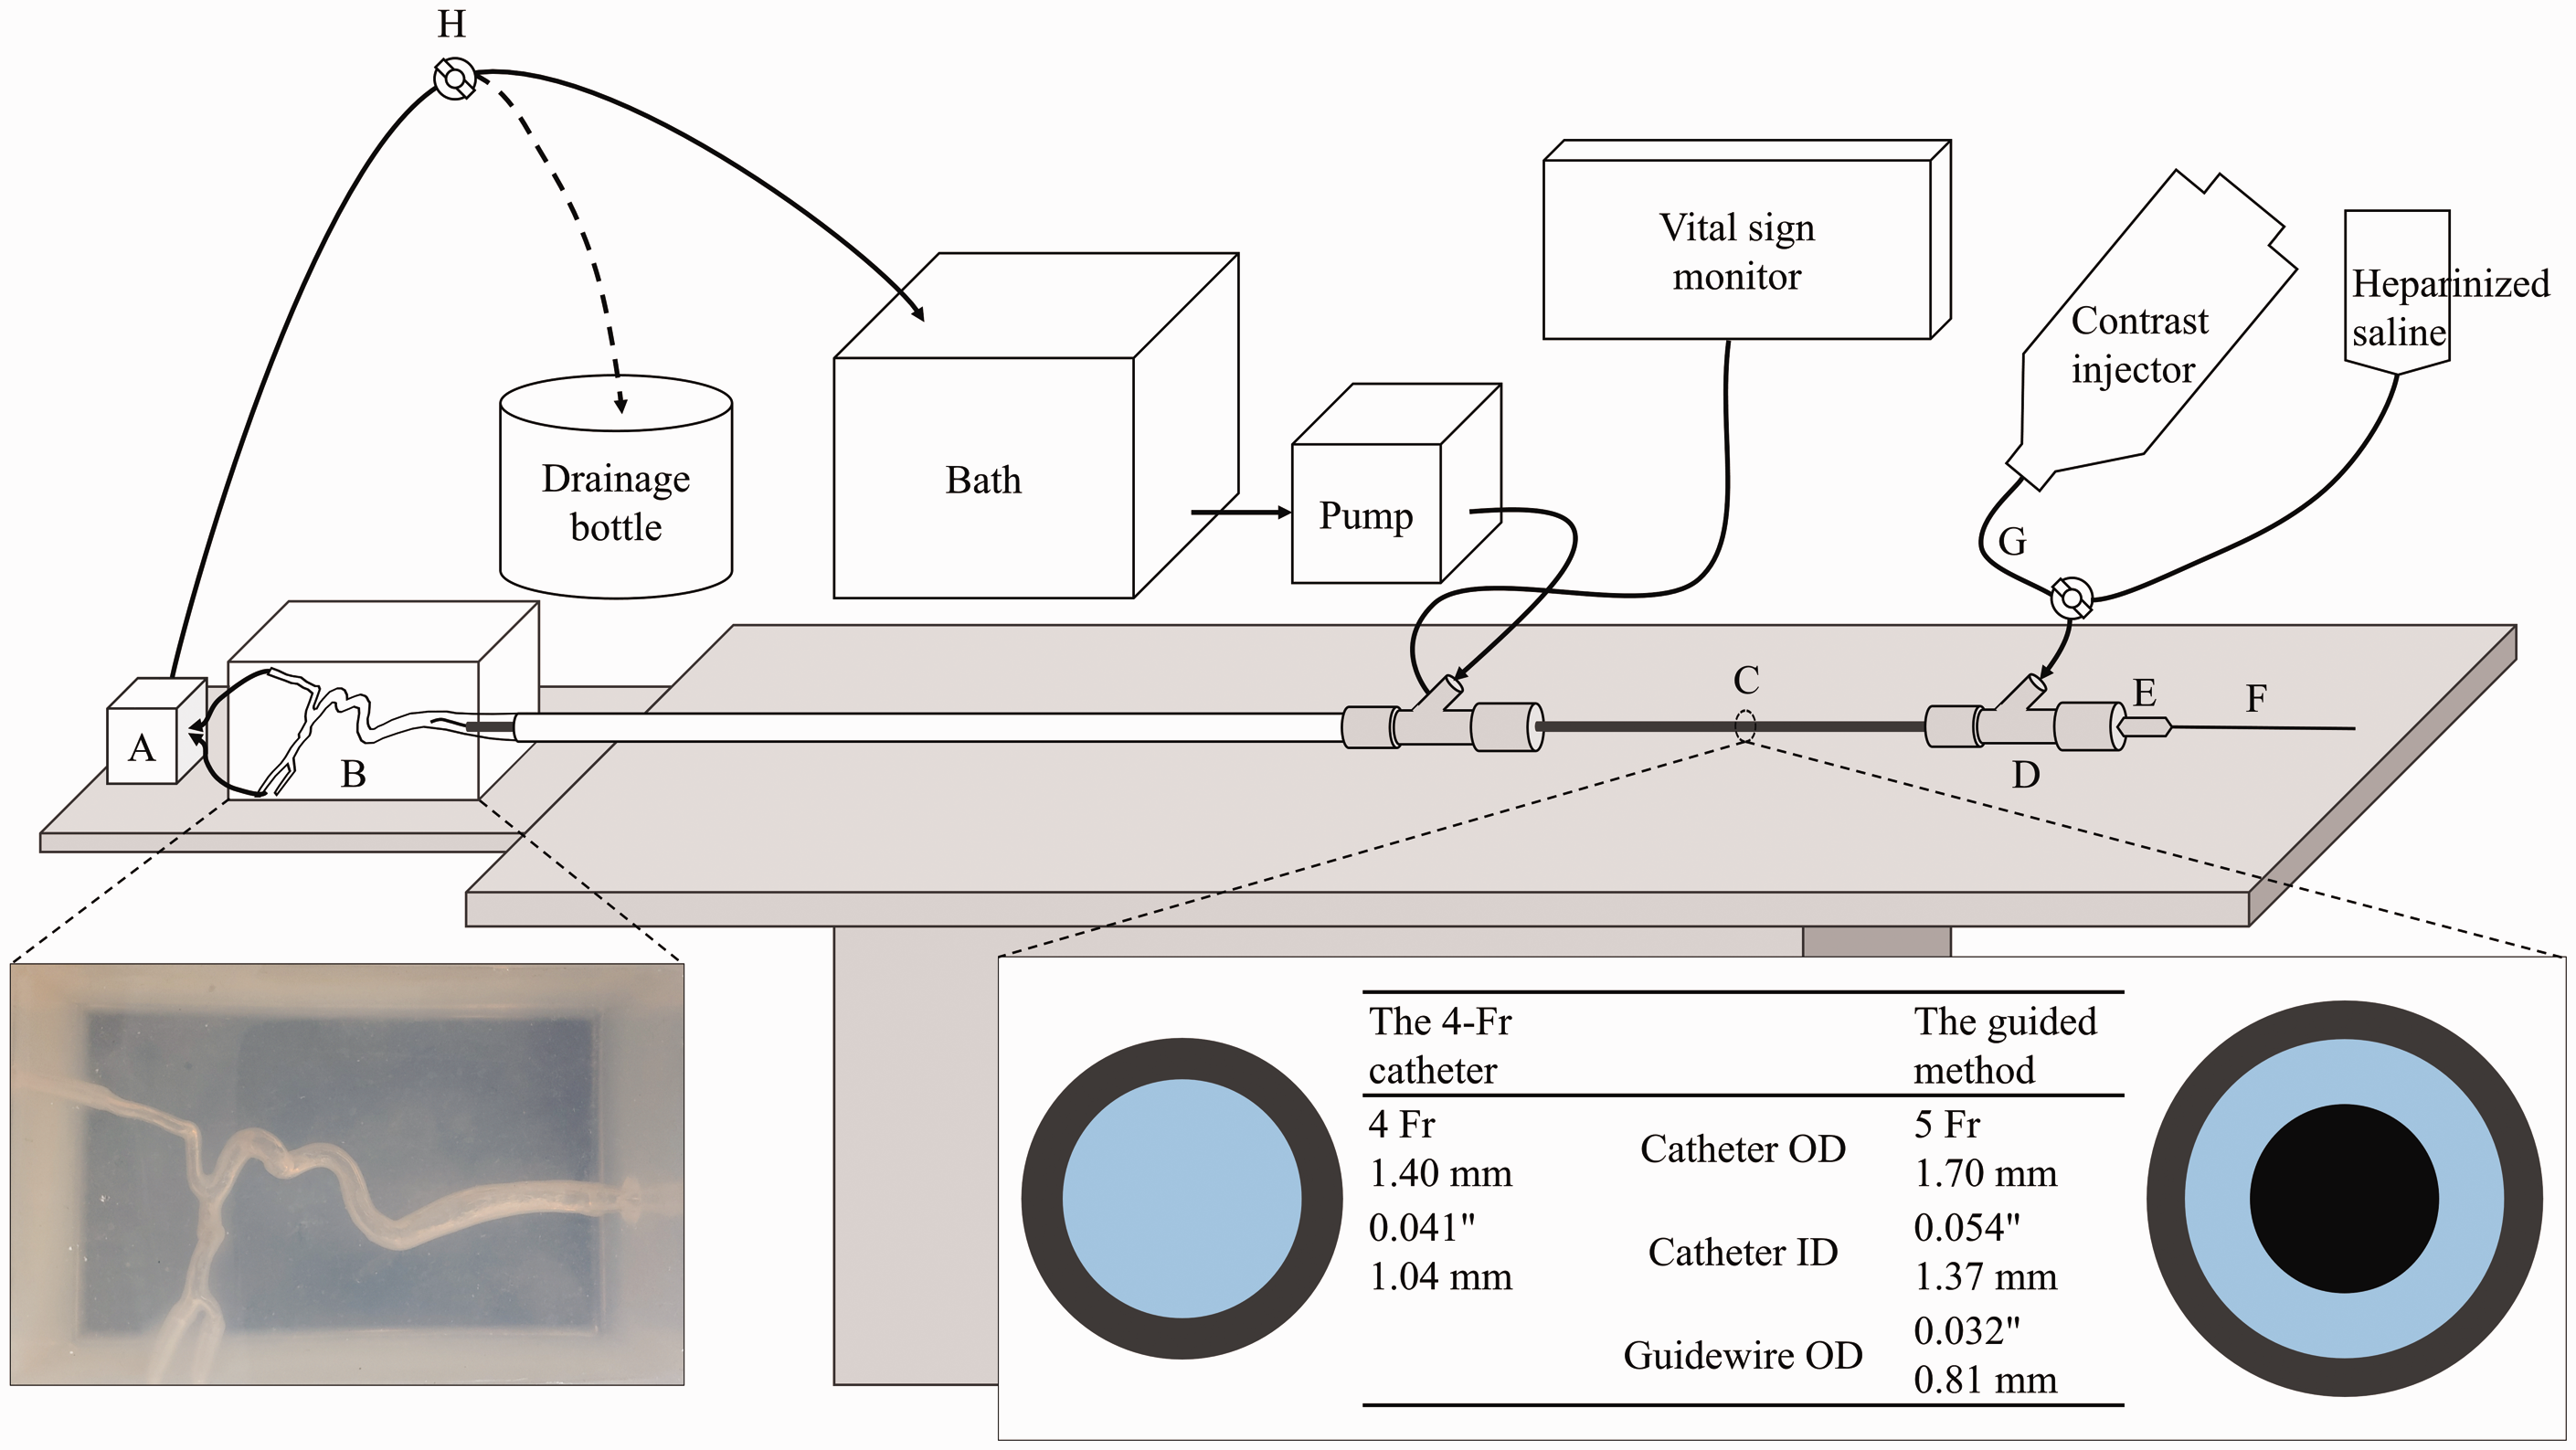
Illustration of a neurovascular phantom, a flow system, and a contrast injection system. The table on the bottom right shows the configuration and dimension of the two catheters. Gray color indicates a catheter; blue, inner space of a catheter filled with a contrast medium or saline; black, a guidewire. When conducting the experiment, contrast-contaminated fluid was drained out. The depicted continuous heparinized saline flushing was not installed in this study although being used in the real practice. ‘a’ indicates an acrylic hollow cistern filled with sponge; b, a neurovascular phantom; c, a tested angiography catheter (The guided catheterization method was depicted in this figure); d, a hemostasis valve; e, a fixator to prevent the guidewire from moving during the injection; f, a guidewire; g, extension line; h, valve.
Contrast injection system
A CM was injected through a catheter by an automated power injector (Medrad Mark V ProVis; Bayer, Leverkusen, Germany). A pressure limit was intentionally set at 1200 psi to eliminate any limitation in the injection with variable injection conditions. We set the flow rates and injection volumes. The injection duration was set at 1.5 s. The tip of each catheter was placed below the mid-cervical ICA, the starting point of the neurovascular phantom. We primed the inner lumen of the catheter with the CM before injection to eliminate any dead space. The traveling course of the CM was as follows: a power injector, a 150-cm straight extension line, a rotating hemostasis valve (GUARDIAN II No-Click version; Teleflex, Wayne, Pennsylvania), and a tested angiography catheter (Figure 1). After every injection, we could obtain the actual contrast injection pressure, flow rate, and injected volume from the injecting machine. All results were recorded.
Digital subtraction angiography (DSA) acquisition
The frontal C-arm of a biplane angiographic machine (Artis Zee; Siemens, Erlangen, Germany) was used. The position of the phantom under the flat panel detector remained fixed. We acquired DSA images on the frontal plane with the following acquisition conditions; no C-arm angulation, no collimation, small focal spot, a 32-cm field of view, and a 100-cm focal spot-to-detector distance. DSA images were acquired in the pre-specified protocol for Syngo iFlow. The protocol obtained DSA images at variable rates in three steps, such as 7.5 frames per second (fps) for an initial 4 s, 4 fps for the next 6 s, and 2 fps until the acquisition stopped. At the beginning of image acquisition, the background was obtained for the initial 1 s, to be subtracted from subsequently obtained opacified images. The injection of a CM by a power injector precisely connected to an angiography machine was then started.
Post-processing of DSA acquisitions
Post-processing of DSA acquisitions was performed with Syngo iFlow (Siemens, Erlangen, Germany) in a workstation. The application provided contrast intensity values in the specific region of interest (ROI) over time. The degree of contrast intensity was correlated with the degree of CM concentration. 16 We manually defined the ROI at the MCA proximal M1 segment, especially between the aneurysm and the origin of the MCA M1, to avoid superimposition. We used a round ROI, and the area was 3 mm2 (calculated diameter: 1.95 mm). The reference time (t = 0) was defined as the moment when the DSA acquisition was initiated. A mask image was automatically set as the first DSA image. The results were saved in spreadsheet files. The data were analyzed using OriginPro software (Version 2020. OriginLab Corporation, Northampton, MA, USA). The software was able to analyze the TDC and report the following variables: bolus arrival time (BAT), time to peak (TTP), full width at half maximum (FWHM), peak intensity, and slope. BAT denoted the point where the curve was beginning to rise. TTP was the duration between times at the peak intensity and at the reference time. FWHM referred to the duration between times at half peak intensity on the upslope and that on the downslope. Slope meant a degree of ascending slope in the TDC.
Statistical analysis
The results are presented as mean values with standard deviation (SD) or median values with interquartile range (IQR), as appropriate. Statistical analyses were conducted using parametric tests or nonparametric tests, as appropriate. A two-sided alpha level of 0.05 was applied in this study. We used the statistical tool R (Version 3.6.3. Vienna, Austria) and SPSS (IBM SPSS Statistics for Windows, Version 24.0. Armonk, NY) for analyses.
Results
Actual contrast injection pressure, flow rate, and volume
The Actual CM injection pressures varied with the choice of catheter, flow rate, viscosity, and catheter length. Table 2 presents the actual median pressures with IQR for all conditions, and Figure 2 shows the plots of the actual pressures. The actual median pressures for all conditions ranged from 146.50 to 436.50 psi. When a 4-Fr catheter was used, the pressure ranged from 138 to 262 psi, and the mean pressure was 201.18 ± 50.60 psi. With the guided method, the pressure ranged from 184 to 451 psi, and the mean pressure was 318.43 ± 81.91 psi. The actual pressure in these conditions, with a flow rate of 6 cc/s, exceeded 300 psi. When a 125-cm, 4-Fr catheter was used for iodixanol injection, the maximum pressure at flow rates of 4 cc/s and 6 cc/s were 174 psi and 299 psi, respectively. The actual flow rates and volumes were achieved as set for all conditions; however, the actual flow rate could not achieve the set value when a guided angiography catheter with more viscous CM (condition H and J) was used. The actual flow rates were 0.1 cc/s less than the targeted values. Although these values were statistically significant, the differences appeared random.
The results of actual contrast injection pressure, flow rate and volume in all conditions.
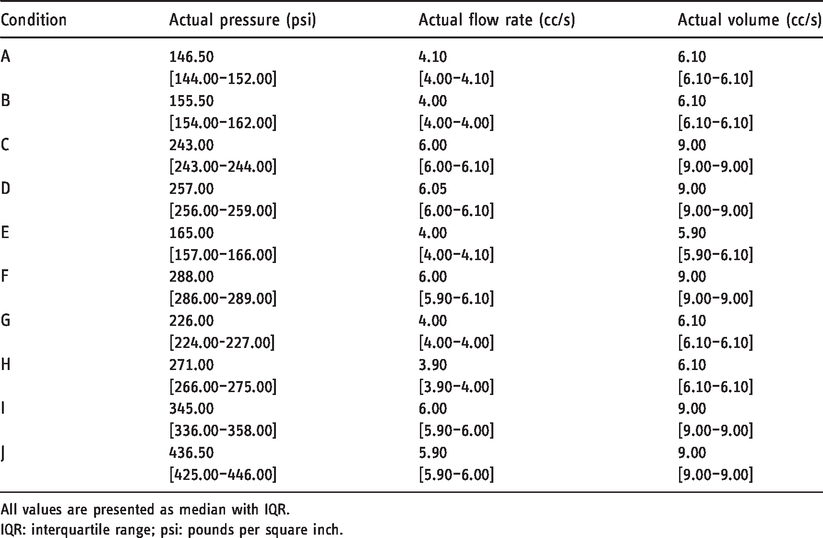
All values are presented as median with IQR.
IQR: interquartile range; psi: pounds per square inch.
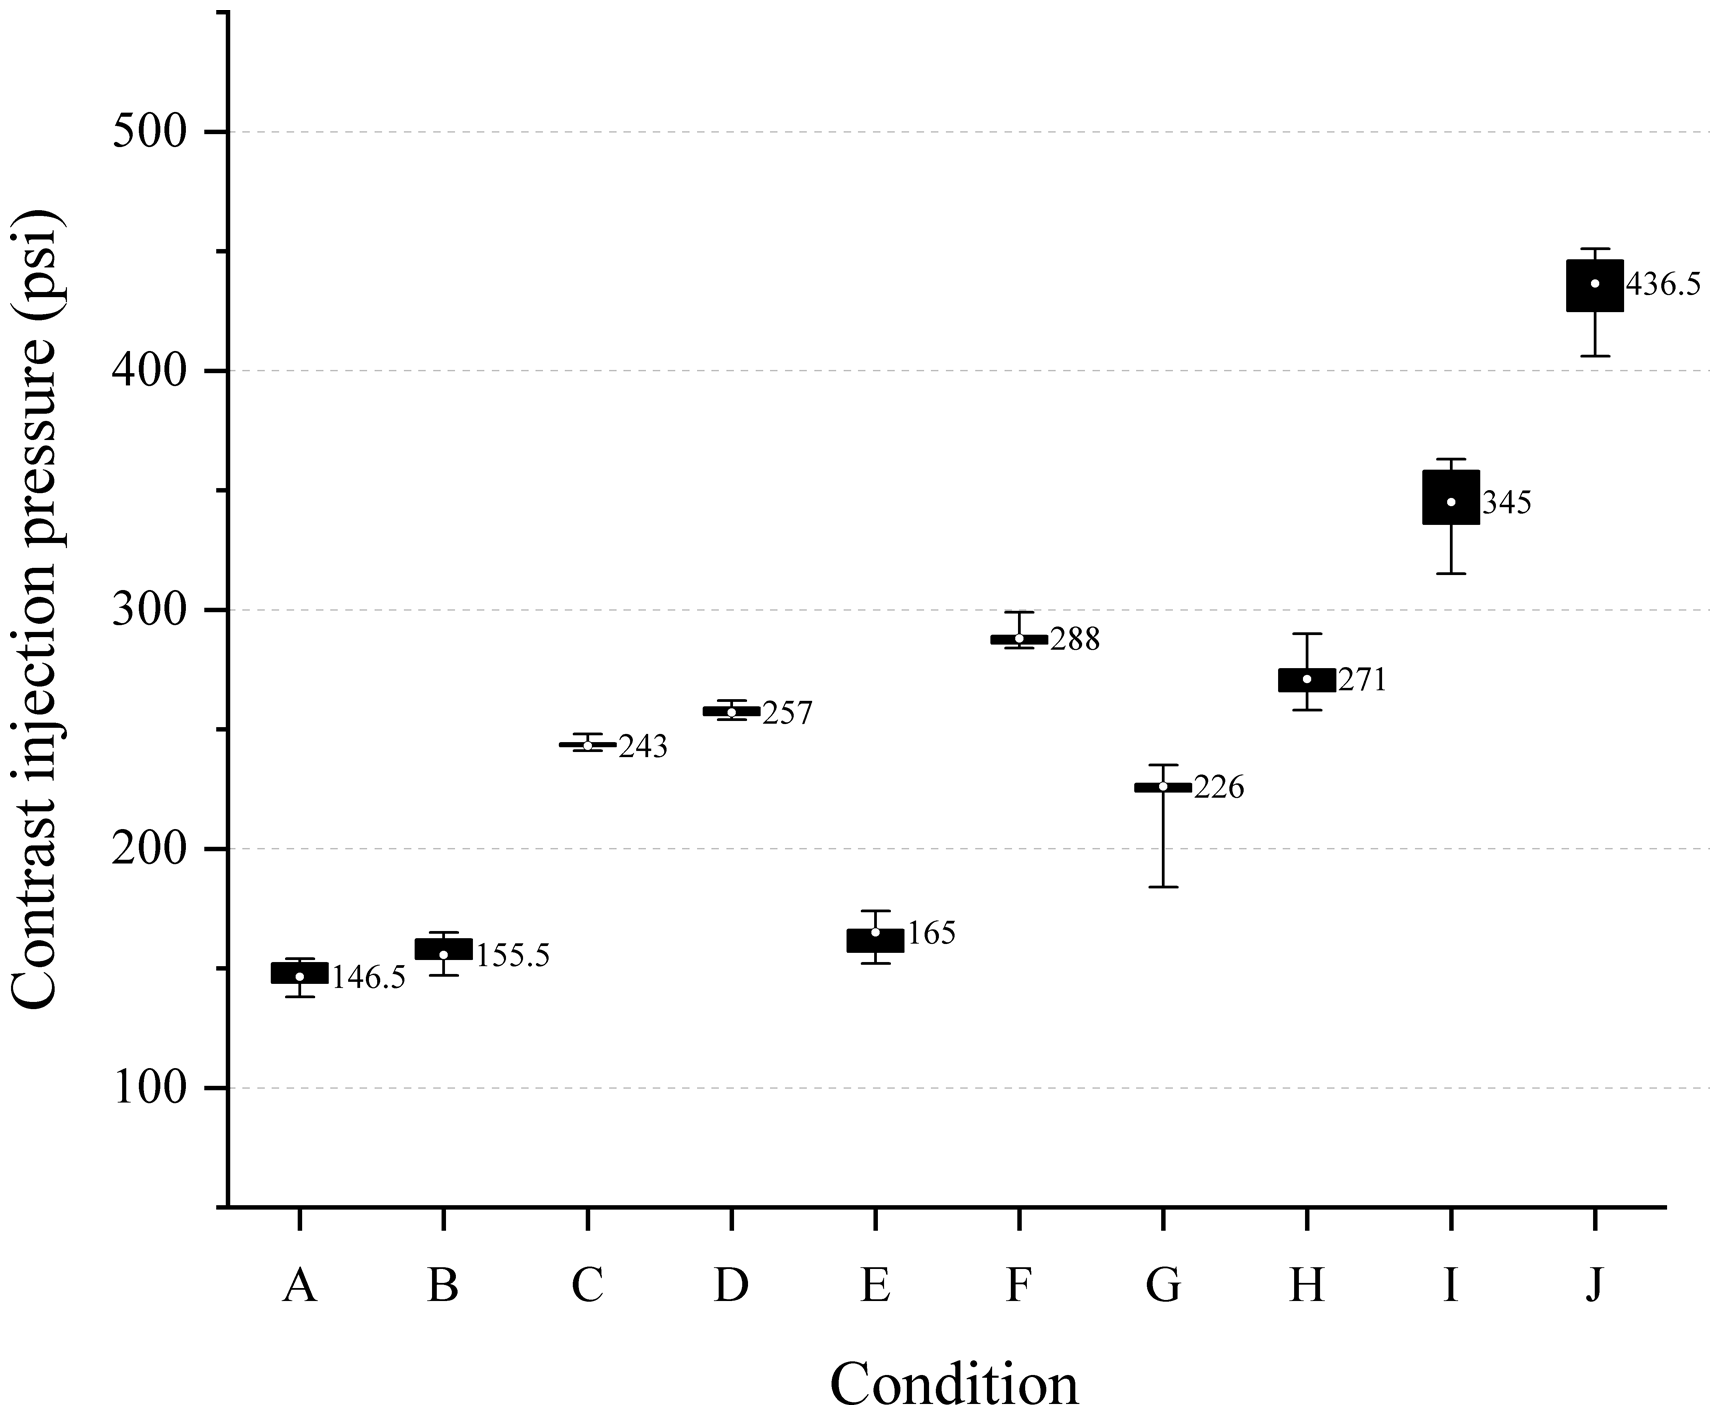
Actual contrast injection pressure in all conditions. Median values for all conditions are presented as a number. Box indicates the range of IQR. Whisker shows minimum and maximum values. A 4-Fr and 100-cm catheter was used in condition A, B, C, and D. The guided angiography system was used in condition G to J. A 4-Fr and 125-cm catheter were used in conditions E and F.
The results of variables of time-density curve in all conditions.
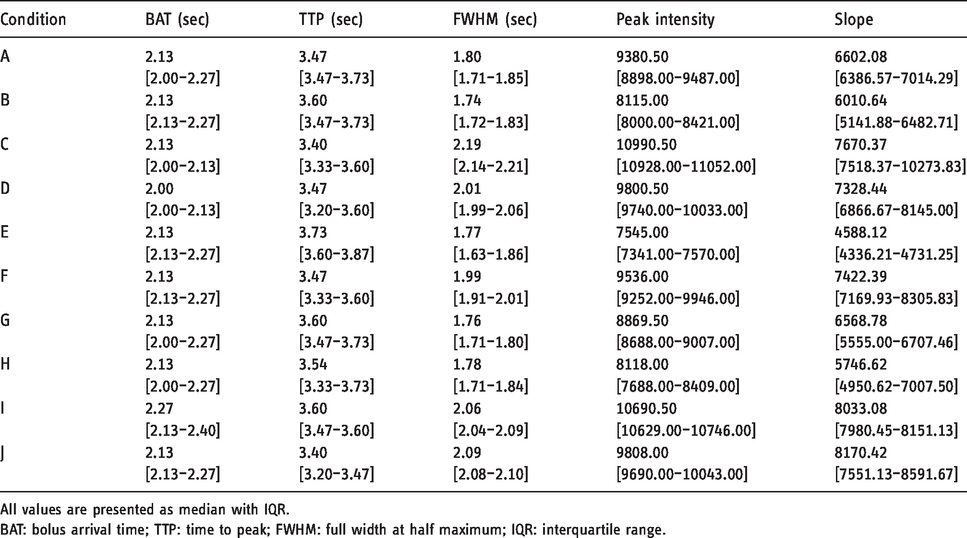
All values are presented as median with IQR.
BAT: bolus arrival time; TTP: time to peak; FWHM: full width at half maximum; IQR: interquartile range.
Variables from the TDC (Table 3)
Figure 3 shows a DSA image acquired between 3 s and 4 s in each condition. Grossly, full opacification is noted in all conditions between 3 s and 4 s. On analyses of median BAT and TTP, no significant differences were found among the different conditions. The ranges of median BAT and TTP were 2.00—2.27 s and 3.4 − 3.73 s, respectively. The conditions with a flow rate of 4 cc/s showed no differences in FWHM. Some statistical differences were observed between conditions C and I, and between conditions C and D. However, there were no meaningful trends to explain these findings. When a high-concentration or large-volume CM was injected, the peak intensity had a larger value than those of the corresponding conditions. With a fast flow rate, the degree of ascending slope was steeper than those of the corresponding conditions. Finally, we analyzed all TDC variables between the different catheters. No statistically significant differences were observed in all variables even when the catheters were varied.
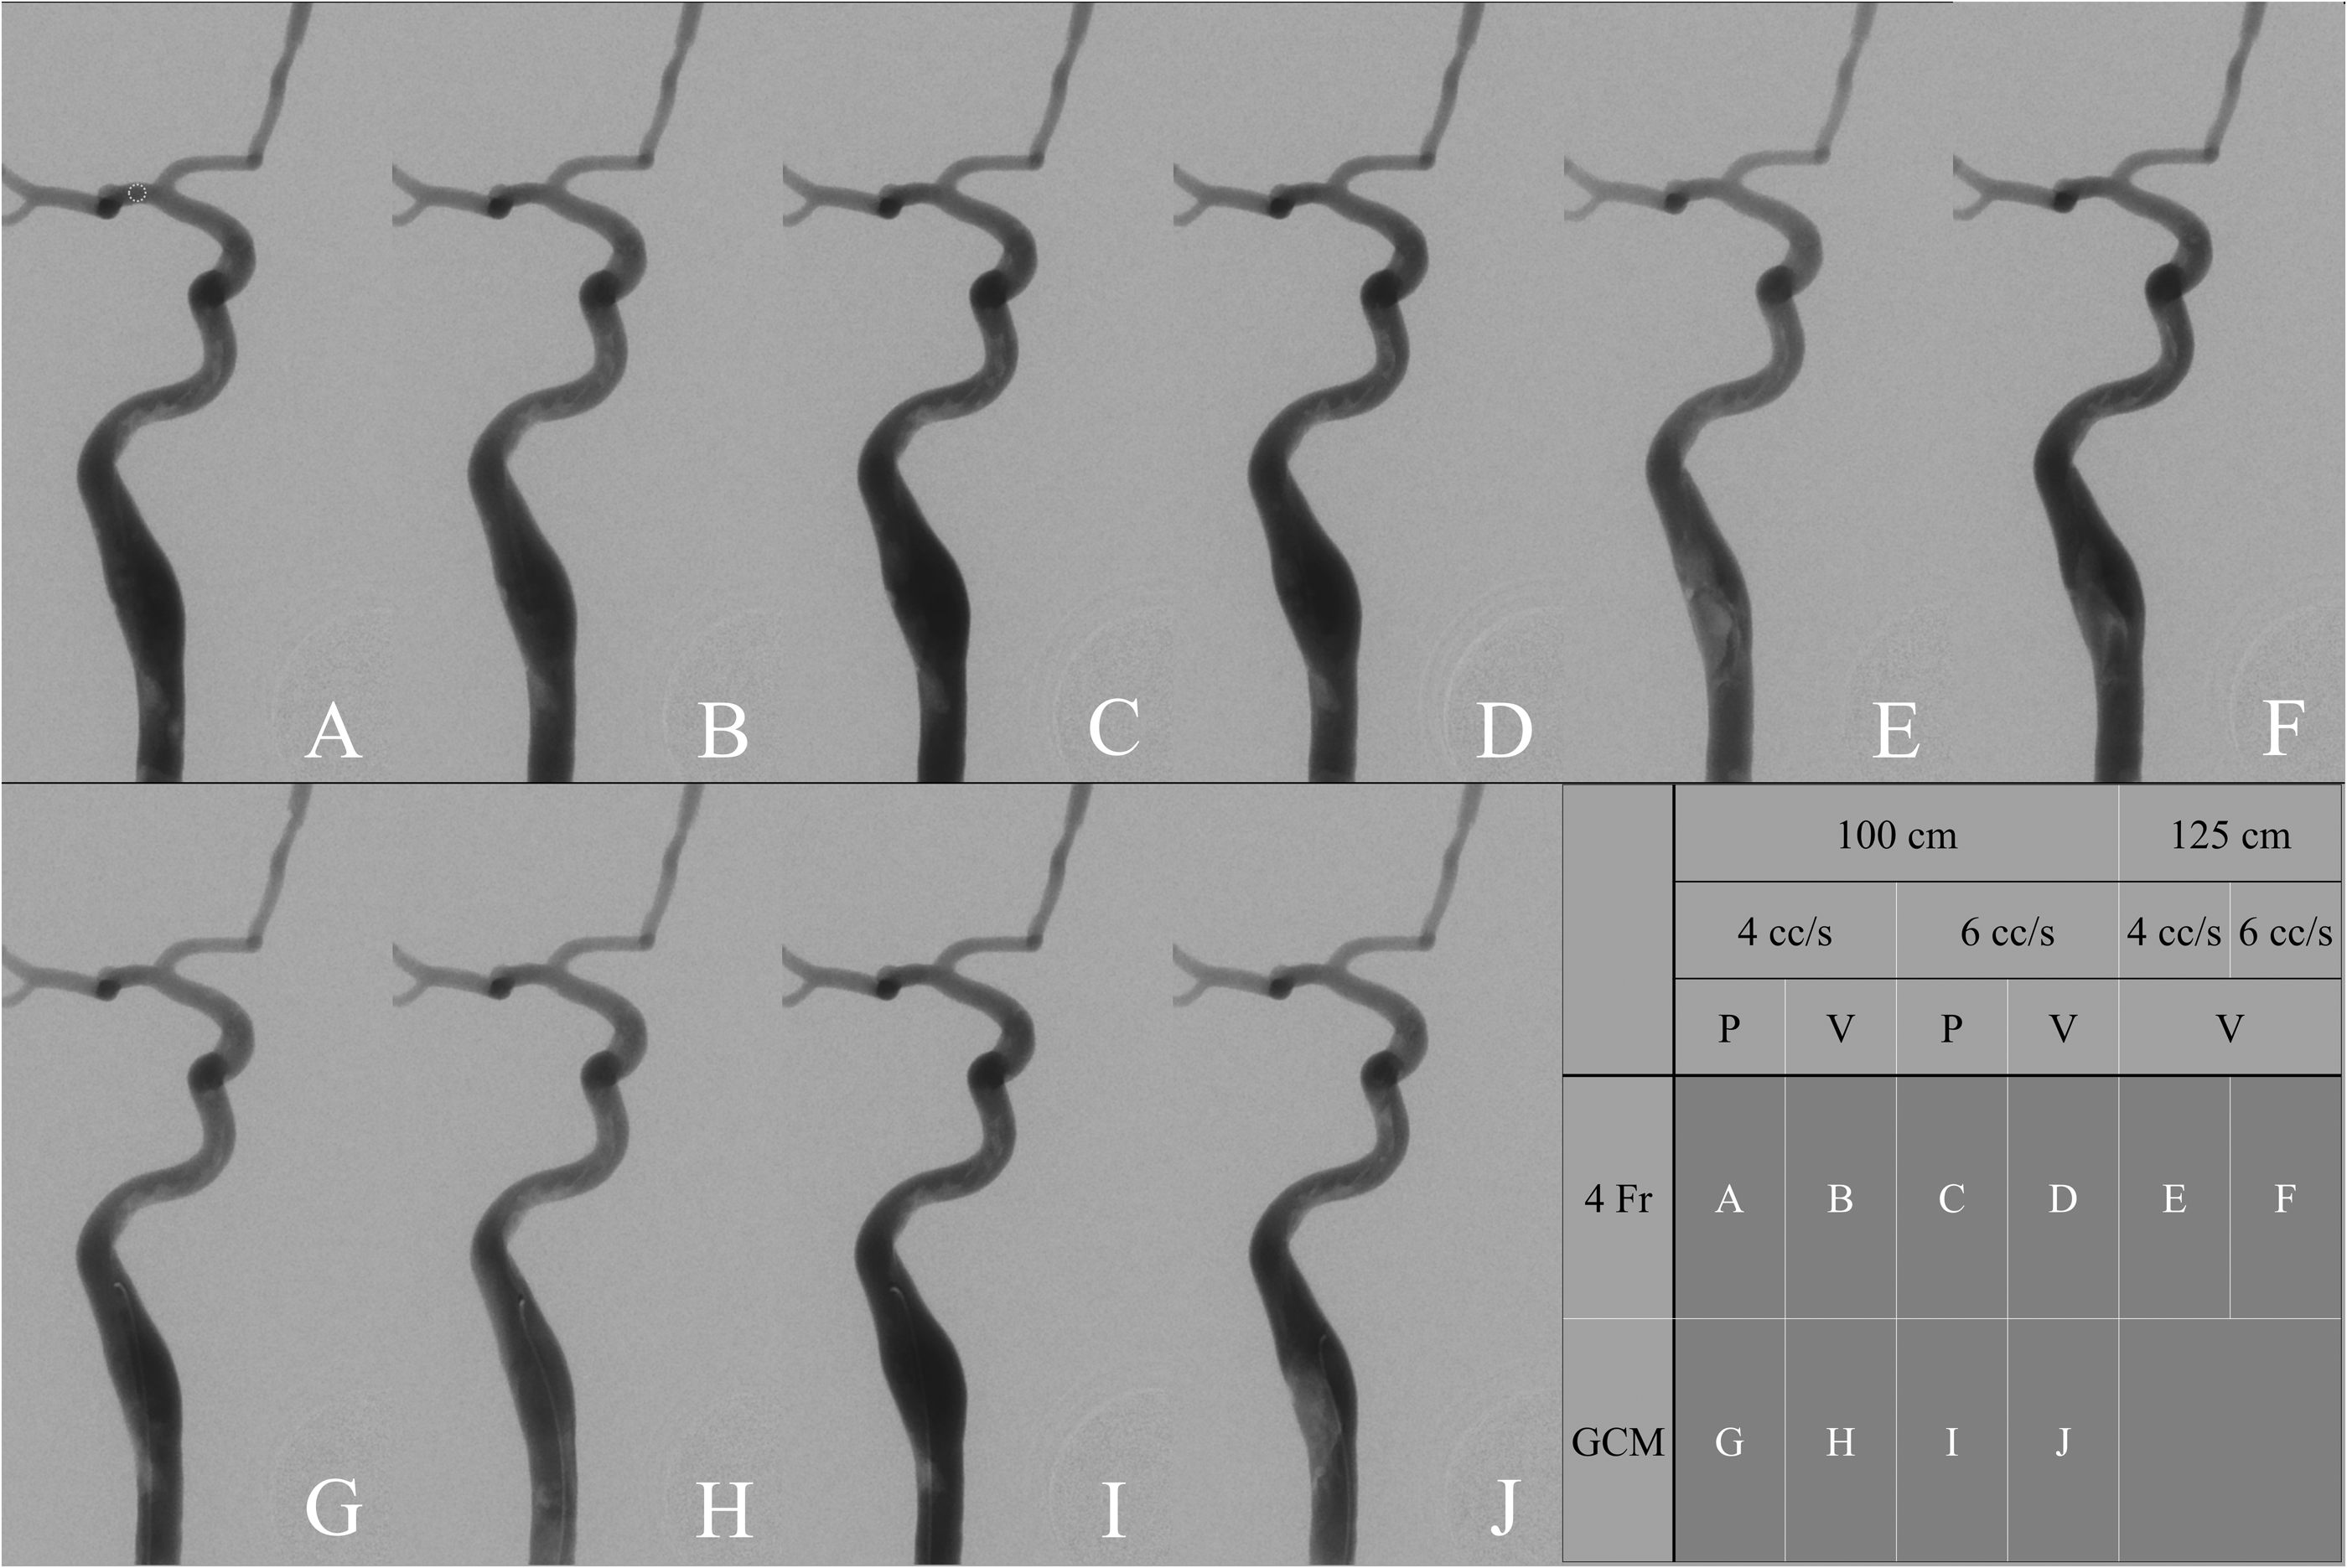
Digital subtraction angiography (DSA) image acquired in each condition between 3 s and 4 s after pressing injection button. The white dotted circle in Figure 3-a indicates the region of interest (ROI). The table on the bottom right shows briefly how all conditions are combined. GCM: Guided Catheterization Method; P: Iopamidol; V: Iodixanol; Fr: French.
Discussion
The guided catheterization method was proposed to perform a better, convenient, and safe cerebral angiography. Moreover, we have observed that a cerebral angiography was possible using a 5-Fr guiding catheter with a 0.035-in GW for some neurointerventional procedures. Hence, we adopted this approach to a 5-Fr diagnostic angiography catheter with a 0.032-in GW. Regarding the thinner GW we used for guided method, potential limitation of less trackability of the 0.032-in GW was one of the concerns in the beginning of the experience with the guided method. So the GW was fortified by the modification of the inner core wire within the black polyurethane jacket. Before long, the guided catheterization method became popular in our institution and mostly replaced the role of a conventional 4-Fr catheter. This angiography system had the following possible advantages: feasibility to navigate and select a tortuous artery, stable catheter positioning, ease of placing a GW inside a catheter at any time during the procedure, obviates the need to flush a catheter when inserting or removing a GW, relatively short total procedural time that results in less radiation exposure compared to a conventional 4-Fr catheter, and prevents wedging of an end-hole catheter onto an arterial wall by a slightly advanced GW from a catheter tip.
Nonetheless, the potential ledge effect was concerned. However, unlike the significant ‘shoulder’ we could face in case of using a long sheath (a Shuttle for example), there was no such an issue at all. We thought that the difference was due to relatively small ‘shoulder’ of the guided method.
Another limitation was found during cerebral angiography. Some operators felt high resistance while pushing a plunger by hand to inject the CM. Furthermore, a suboptimal opacification in DSA images was occasionally noted with a pressure contrast injector with a 300-psi pressure limit. Therefore, to obtain high-quality images, we felt the need to study the effect of the configuration of the guided catheterization method on contrast injection pressure.
The pressure requirement for the target flow rate was increased in the guided method compared with the use of a conventional 4-Fr catheter due to the concentric configuration of the guided method. Although the calculated cross-sectional area of the guided catheter is slightly larger than that of the 4-Fr catheter, the required pressure inevitably increases because the wetted perimeter of the guided method is twice as much as that of the 4-Fr catheter. Considering the wetted perimeter and the cross-sectional area together, the hydraulic diameter of the guided method is theoretically about half as much as the diameter of the 4-Fr catheter. Moreover, the configuration through the guided catheterization method would be heterogeneous, which may develop turbulent flow inside a catheter, leading to high pressure requirements. 17 Although the pressure trends could be predicted, in reality, the actual values were discordant.
Further, the CM injection pressure was measured in various conditions using a contrast injector. When a conventional 4-Fr catheter was used, none of the examined cases showed a pressure of above 300 psi, although the pressure limit was set to 1200 psi. Therefore, the routine 300-psi pressure limit is apparently acceptable when performing angiography with a conventional 4-Fr catheter. When a guided angiography catheter was used, the results of actual pressure for the conditions with a flow rate of 4 cc/s were within the 300-psi pressure limit; however, with a flow rate of 6 cc/s, a higher pressure was required, which still was below 450 psi even when a higher-viscosity CM was used.
In terms of injection volume, we could achieve complete injection of the intended volume; however, there were some differences in the actual flow rate. We found that flow rates in the guided method were slightly less (about 0.1 cc/s) than the targeted value when a more viscous CM was used. Thus, we believe that using a relatively less viscous CM is preferable for use with the guided catheterization method.
The TDC values indicate contrast intensity over time. The TDC is affected by iodine delivery rate (IDR), which is obtained as the iodine concentration multiplied by flow rate. 18 Therefore, we may observe differences in the analyses of variables from the TDC if it is significantly affected by a slightly slower flow rate. The following variables were obtained from the curve: BAT, TTP, FWHM, peak intensity, and slope.18–21 On analyses of these variables, no differences were observed because of the effect of a catheter. Notably, the slightly slower flow rate observed in some conditions using the guided method did not cause any differences. This finding was supported by a similar degree of opacification observed on DSA images across the conditions. Hence, we believe that the guided method also could produce an image quality similar to that with the use of a conventional 4-Fr catheter.
There were no harmful events, such as rupture of the injection system, during the experiments.
Several limitations of this study should be considered. Some conditions were omitted in the experiments with a 125-cm catheter. Moreover, a 125-cm guided angiography catheter was not available. Considering the experimental data, the actual contrast injection pressure can be predicted for a 125-cm catheter. The experimental temperature was not maintained around the physiological body temperature. Hence, the effect of temperature on viscosity should be considered when interpreting the results. Additionally, the images acquisition interval might have been be too large in this study. It resulted in extremely low time resolution to detect subtle image quality differences caused by the slightly slower flow rate. Finally, the number of experiments per condition might be too small to reveal statistical significance.
Further study using clinical data would be necessary to evaluate the guided catheterization method in reality.
Conclusions
We found that the “guided catheterization” method was technically feasible for a cerebral angiography, although it required a little higher but clinically acceptable range of injection pressure in certain conditions, compared with that of conventional catheterization system. We measured contrast injection pressure in various conditions without pressure limitation and confirmed that the difference in image quality between two catheters was not significant. Our experimental data show that the use of the guided catheterization method with adjustment of the pressure limit setting above its maximum value is feasible, mechanically safe to the system, and provides comparable image quality.
Footnotes
Declaration of conflicting interests
The author(s) declared no potential conflicts of interest with respect to the research, authorship, and/or publication of this article.
Funding
The author(s) received no financial support for the research, authorship, and/or publication of this article.