
Abstract
Researchers select data collection methods for a variety of reasons. In our research on experiential education programs, we perceived that when we collected students’ reflections using different methods, the data we received was different. However, we found few existing studies to help us characterize what was different across our data sets to inform our decisions about which methods to use. Thus, the purpose of our study was to compare data richness across three data sets from previous studies of engineering students studying abroad, each collected using a different method (written diaries, interviews, video diaries). We used linguistic inquiry as a lens for exploring data richness and considered two dimensions of richness: depth of content and level of reflection. In comparing our data sets, we identified differences in both dimensions. We found that each data set demonstrated depth of content in different ways, but the data from interviews and video diaries revealed greater levels of reflection than the data from written diaries. Our study contributes a more nuanced understanding of the data richness that can be achieved using different qualitative data collection methods. We identify unique patterns in the depth of content and level of reflection dimensions across data collection methods, which may inform a researcher’s choice of which method to use in a study.
Introduction
A central decision that researchers make for each new study is the selection of a data collection method. The advent of new technologies and communication methods have inspired qualitative researchers to explore an expanding array of new approaches to collecting data (Creswell & Poth, 2023). However, the range of emerging qualitative methods can make it challenging for researchers to select the method or methods most appropriate for their study. Several criteria have been suggested to help researchers in choosing between methods, including considerations of time required for researchers and participants, access for populations who may be marginalized by certain approaches, ethical concerns related to privacy and confidentiality, and trust in the authenticity of the data collected through digital methods (Creswell & Poth, 2023; Thomas Dotta et al., 2024). Last, but not least, researchers must consider the research question of interest and identify a form of data that will allow them to answer the question (Creswell & Poth, 2023; Maxwell, 2013).
In the context of higher education, researchers face the additional consideration that data collection can also be an educational intervention (Cao & Henderson, 2021). Whether intentional or incidental, asking students to respond to questions about their educational experiences can be an opportunity for reflection and learning. Similarly, assignments designed for educational purposes can also be used as data collection by researchers seeking to understand student learning. Though some researchers may question the blurring of lines between education and research (Cao & Henderson, 2021), we believe that it is impossible to avoid impacting students through such a study, and therefore a responsible research design will consider what is best for student learning. We faced this question as we sought to study to engineering students’ experiences studying abroad. Experiential education programs (e.g., study abroad) in higher education settings frequently integrate reflection activities as a research-based approach to support student learning (Moon, 2004). Because of the central role of reflection in experiential learning, researchers often analyze reflection data to understand students’ learning processes (Davis & Knight, 2023; Savicki & Price, 2015). We identified diary studies as a unique connecting point between formal research design and the reflection assignments common in experiential education programs. However, diary studies can take many forms, and we wondered which approach would result in the richest reflection data—both for research insights and student learning. Though several researchers have defined data richness (Braun & Clarke, 2013; Charmaz, 2003; Maxwell, 2013), we found few examples where reflection approaches or qualitative data collection methods have been compared on this characteristic.
The purpose of our study was to compare data richness across three existing data sets from studies of engineering students studying abroad, each collected using a different method (written diaries, video diaries, interviews). We include written diaries as a common form of reflection in experiential education programs, interviews as a common qualitative study design in higher education research, and video diaries as a newer method in both education and research. We review definitions of data richness and introduce linguistic inquiry as a lens for exploring data richness. In our analysis, we identify unique patterns in both the depth of content and level of reflection demonstrated across data collection methods, which may inform a researcher or educator’s choice of which method to use in a particular context. Importantly for student learning, interviews and video diaries in our study demonstrated greater levels of reflection across most dimensions compared to written diaries. Our study contributes a new framing through which to consider data richness and proposes level of reflection as a useful dimension to consider, particularly in the context of educational research.
Literature Review
In this section, we discuss diaries as a data collection method, along with their strengths and weaknesses. We then propose a natural alignment between diaries and the reflection activities commonly used in experiential education programs in the higher education context. Finally, we review previous comparisons of qualitative research methods, define data richness in the context of our study, and present our research questions.
Diary Data Collection in Qualitative Research
A diary is a regular record kept by an individual over a period of time. Diaries are characterized by being contemporaneous (i.e.,recorded close to actual events) and personal (i.e.,controlled by the individual; Alaszewski, 2006). Many social science fields collect diaries to understand the everyday lives of individuals. Diaries can be solicited (i.e.,collected for research purposes) or collected for another purpose (e.g., a classroom reflection) and then analyzed for a study (Bartlett & Milligan, 2015; Cao & Henderson, 2021). Diaries have been collected as handwritten journals, digital journals, and more recently, audio and video diaries. The content of diaries can be highly structured (e.g., filling out a questionnaire), totally unstructured narrative, or semi-structured to balance flexibility with research relevance. In this way, diary studies can be carried out with a range of epistemological and theoretical groundings and result in quantitative or qualitative data (Cao & Henderson, 2021; Hyers, 2018). In this paper, we focus on diaries as they are used in qualitative research, where they have long been recognized as a way to capture personal life narratives (Alaszewski, 2006; Hyers, 2018).
Diaries offer several affordances that can result in meaningful insights for studies in a range of contexts. In particular, diaries can give researchers access to phenomena that are hard to observe through other means. For example, diaries can be used to study populations that are remote or marginalized or to study sensitive topics, which participants could be uncomfortable discussing with an interviewer (Alaszewski, 2006; Bartlett & Milligan, 2015). The longitudinal nature of diaries allows narratives to be recorded closer to actual events, reducing challenges with remembering what occurred and the participant’s response (Alaszewski, 2006; Hyers, 2018). Diaries are often used in combination with other methods, such as interviews or document analysis. Using multiple methods can provide several angles to understand complex topics (Baker, 2023; Gibson et al., 2013) and address weaknesses of individual methods, such as the challenge of maintaining participant engagement in diary studies (Baker, 2023; Rudrum et al., 2022). Diary studies can be labor intensive for researchers because they generate significant amounts of data (Rudrum et al., 2022) and for participants, which can bias recruitment towards individuals willing to keep a diary (Alaszewski, 2006). The design of a diary study must therefore consider both the strengths and weaknesses of this method within a particular context.
Connecting Diary Studies and Reflection in Experiential Education Programs
Building on this understanding of diaries, we saw a connection between diary studies and the reflection activities common in experiential education programs. Experience-based learning occurs in many forms ranging from unmediated learning outside formal education to experiences designed and mediated by an instructor within a formal education setting (Andresen et al., 2020; Moon, 2004). In our study, we use the term experiential education programs to refer to the latter type of learning experience specifically within the context of higher education. Common forms of experiential education programs in higher education include study abroad, community-based learning, internships, or research experiences for students. Reflection is a term often used in higher education, but with a variety of definitions (Harvey et al., 2016; Hatton & Smith, 1995; Rogers, 2001). Rogers (2001) synthesizes across educational theorists, describing reflection as: a cognitive activity (with some affective and metacognitive components), involving active engagement, responding to an unusual situation, critically reviewing one’s beliefs, and integrating a new understanding based on one’s experience. Reflection is a component in various learning theories, including Experiential Learning Theory (Kolb, 2015) and Transformational Learning Theory (Mezirow, 1991), in which reflection allows an individual to learn from experience and put that learning into action. Based on these learning theories, many experiential education programs incorporate reflection activities (Ash & Clayton, 2009; Moon, 2004). These activities have been identified as a contributor to student learning in study abroad programs (e.g., Chwialkowska, 2020; Vande Berg & Paige, 2012; Whatley et al., 2021), service learning (e.g., Kiely, 2004), and internships (Bhuwandeep, 2022; Levine et al., 2008). Ash and Clayton (2009) summarize the literature on reflection for learning by saying that, when intentionally designed, reflection can generate, deepen, and document learning.
Given the frequent use of reflection in experiential education programs (Ash & Clayton, 2009; Moon, 2004), we propose diary studies as a promising research approach to enhance our understanding of student learning through experiences. Although Hyers (2018) suggests that diaries fit well in educational research studies, diary studies are underutilized in higher education research (Cao & Henderson, 2021). In the context of experiential education programs, the longitudinal nature of diaries could be particularly helpful in identifying points of struggle and moments of breakthrough (e.g., Turzańska, 2014). Keeping a diary can help students process specific events to develop new understanding (Hyers, 2018). This kind of processing occurs immediately following an event and is thus best captured in the moment. However, many studies in higher education rely on interviews, focus groups, or surveys that occur long after critical events (Cao & Henderson, 2021; Huisman, 2024; McAllister-Grande & Whatley, 2020; Tight, 2013). Diary studies offer an in-the-moment perspective on student learning that much of the current research is lacking. Similarly, the longitudinal perspective can offer insights into student development over an entire program, where early weeks may offer different experiences compared to later weeks (Ward, 2001; Wrobetz et al., 2024). In sum, we saw several connections between diary studies and the reflective activities typically used in experiential education programs, but wondered what diary format would fit best in this context—both to support student learning and to provide insights about student learning for research.
Comparing Qualitative Data Collection Methods
In leading and researching study abroad programs, we have tried several formats for reflection activities (e.g., interviews, written diaries, photographs, video diaries) and noticed differences in the depth of the resulting reflection data. We wanted to characterize those differences to inform our choice of reflection methods for future programs and research studies. We found few comparisons of reflection activities in the higher education research literature; however, prior studies have compared diary methods to other forms of data collection (Baker, 2023; Danielsson & Berge, 2020; Fitt, 2018; Litovuo et al., 2019; McDonnell et al., 2017). Danielsson and Berge (2020) identify affordances of video diaries compared to interviews or observations, including: lack of interference from researchers, generation of a “thick” data set, and supporting deep conversations in follow-up interviews. Similarly, Fitt (2018) found that audio diaries supported participant expression and reduced participants’ tendency to self-edit compared to written diaries. McDonnell et al. (2017) use the metaphor of camera lenses to describe the differences in data from interviews (wide-angle lens) compared to diaries (telephoto lens). Monrouxe (2009) describes how participants include mundane events in audio diaries which are often left out in other formats. Diaries can also better capture sense-making processes compared to interviews, where memory decay may result in a focus on the final outcome rather than the process (Monrouxe, 2009; Olorunfemi, 2024). Though these studies touch on some aspects of interest to our study, they do not fully describe the differences we observed in our data sets, which we eventually conceptualized as differences in data richness.
The quality of qualitative data is often described as data richness (Charmaz, 2003; Maxwell, 2013; Ogden & Cornwell, 2010). Data richness has been variously described as when participants: disclose feelings and views that are inaccessible in ordinary discourse (Charmaz, 2003), go beyond the “surface” of a topic to offer a thorough perspective (Braun & Clarke, 2013, p. 34), or respond with sufficient detail to provide a complete picture of a situation (Maxwell, 2013). These definitions have been operationalized in various ways in prior studies comparing data richness across qualitative methods (e.g., Gothberg et al., 2013; Ogden & Cornwell, 2010; Roberts et al., 2025). For example, Gothberg et al. (2013) in studying focus group data compared participant interactions, breadth of topics, disclosure of sensitive information, adherence to the topic, and depth of conversation. Ogden and Cornwell (2010) in analyzing interview responses considered length, degree of description (e.g., emotions, quantifiers, adverbs), level of personal content, level of analysis, and descriptions of behavior. Much of the prior work exploring the question of data richness has compared in-person and remote data collection approaches. Roberts et al. (2025) summarize these comparisons in their scoping review, finding that there is some evidence of greater depth for in-person data collection, but that depth is not always clearly defined or operationalized in such studies. Taken together, these studies highlight a lack of clarity in defining and measuring data richness in qualitative research.
Building on these examples, we suggest that data richness may look different in different study contexts. For example, we were interested in understanding student learning during study abroad programs. In this context, “adherence to the topic” and “breadth of topics” are less important because we are open to the different learning experiences and topics students may bring up based on their experiences. Similarly, because we focus on individual reflections, we do not consider “participant interactions” as one might in a focus group. On the other hand, we are interested in the level of reflection present in the data, because of the essential role that reflection plays in the experiential learning process. For this study, we operationalize data richness by considering two aspects: depth of content and level of reflection. By synthesizing the definitions and literature discussed in this section, we define depth of content as detail provided about an event or experience, the individual, their emotions, their analysis, and their behaviors. We will define level of reflection as we describe the conceptual framework in the next section.
Research Questions
Based on our literature review, we identified the following research questions to guide our comparison of our three qualitative data sets: • RQ1: How do the three qualitative data sets compare in their depth of content? • RQ2: How do the three qualitative data sets compare to other common language types in their depth of content? • RQ3: How do the three qualitative data sets compare in their level of reflection?
Conceptual Framework
In this section, we propose linguistic inquiry as a method that can offer a new perspective on the differences in data collected across qualitative methods. We then present our approach for measuring the two aspects of data richness in our data sets.
Overview of Linguistic Inquiry
People choose different words depending on our environment, audience, and mode of communication. These words can be analyzed to compare differences between individuals or explore one person’s state of mind (Koutsoumpis et al., 2022). Earlier qualitative studies utilized content analysis of written documents (Allport, 1947) and verbal language (Gottschalk & Gleser, 1969; Weintraub, 1989) to draw conclusions about psychological states. The Linguistic Inquiry and Word Count (LIWC) tool was developed to bring computing power to linguistic analysis (Boyd et al., 2022). This application categorizes each word in a text according to its function and meaning and calculates scores based on the relative frequency of particular words. The LIWC has been updated four times since it was first released in 1992, with expanded dictionaries that reflect changing use of language. LIWC-22 is the latest version, containing updated dictionaries based on a corpus of text ranging from speeches to e-mails to Reddit posts (Boyd et al., 2022). Prior studies using the LIWC have analyzed the impact of written disclosures on individuals’ health (Francis & Pennebaker, 1992), the correlation between college admission essays and academic performance (Pennebaker et al., 2014), and markers of intercultural competence in blogs written during study abroad (Hanegreefs et al., 2023). We chose to use the LIWC because the tool is widely used, consistently updated, and the dictionaries have been validated by a team of researchers across several decades (Boyd et al., 2022). The LIWC also publishes statistics on the test corpus data used to train the model (Boyd et al., 2022), which allowed us to compare our data to common forms of language. This level of transparency is not offered by alternative tools (e.g., MAXQDA or ATLAS.ti).
The developers of the LIWC explain that context influences the words that people use (Boyd et al., 2022), and therefore it is important to select particular variables for analysis based on the research questions and context of a study rather than reviewing all the categories offered through the tool. This approach aligned with our goal of evaluating specific aspects of data richness, which we sought to operationalize through the categories offered in the LIWC-22 dictionary. First, there are linguistic categories, which represent linguistic constructs such as pronouns, prepositions, or conjunctions. Second, psychological process categories (e.g., cognition, affect, and social processes) have been developed and revised over different versions of the LIWC through psychometric evaluation to determine which words in the text corpus correlate positively with these categories. A group of judges has reviewed candidate words to add or remove from these categories in each revision of the LIWC (Boyd et al., 2022). Both the linguistic and the psychological process categories are calculated as the percentage of words in a text that are included in that LIWC dictionary. Third, the LIWC includes four summary variables that have been developed through previous research to capture more complex constructs: analytical thinking, clout, authenticity, and emotional tone (Cohn et al., 2004; Kacewicz et al., 2014; Newman et al., 2003; Pennebaker et al., 2014). The calculations for these variables are not published, but their calculation has been updated in LIWC-22 to reflect language changes, and the metrics are reported as percentiles based on standardized scores from comparison corpora (Boyd et al., 2022). In the next section, we present our conceptual framing and how that informed the LIWC categories we included in our analysis.
Operationalizing Data Richness Using the LIWC
Operationalizing Depth of Content Aspect of Data Richness
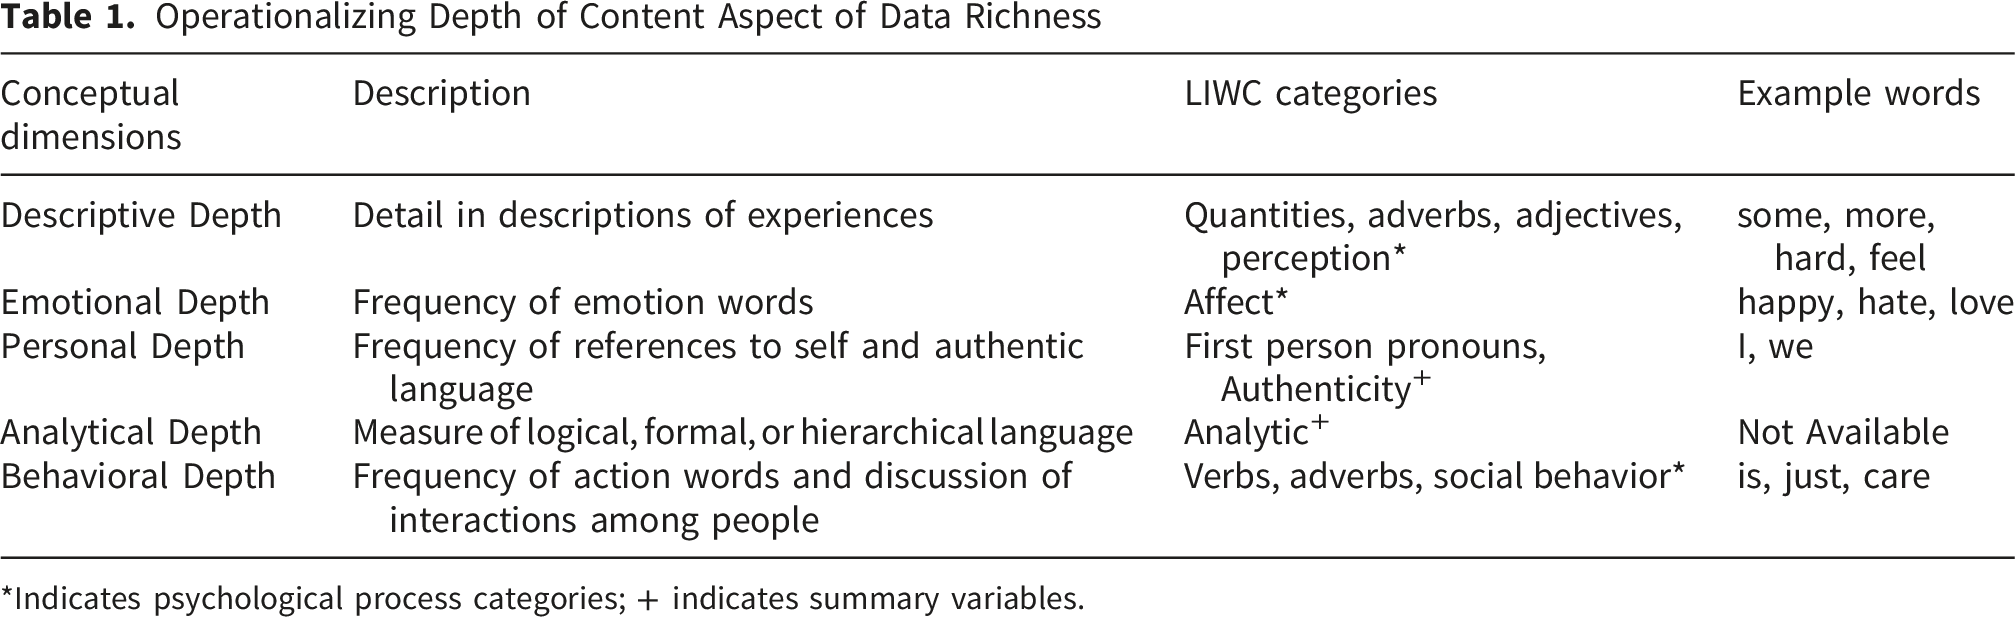
*Indicates psychological process categories; + indicates summary variables.
Operationalizing Level of Reflection Aspect of Data Richness
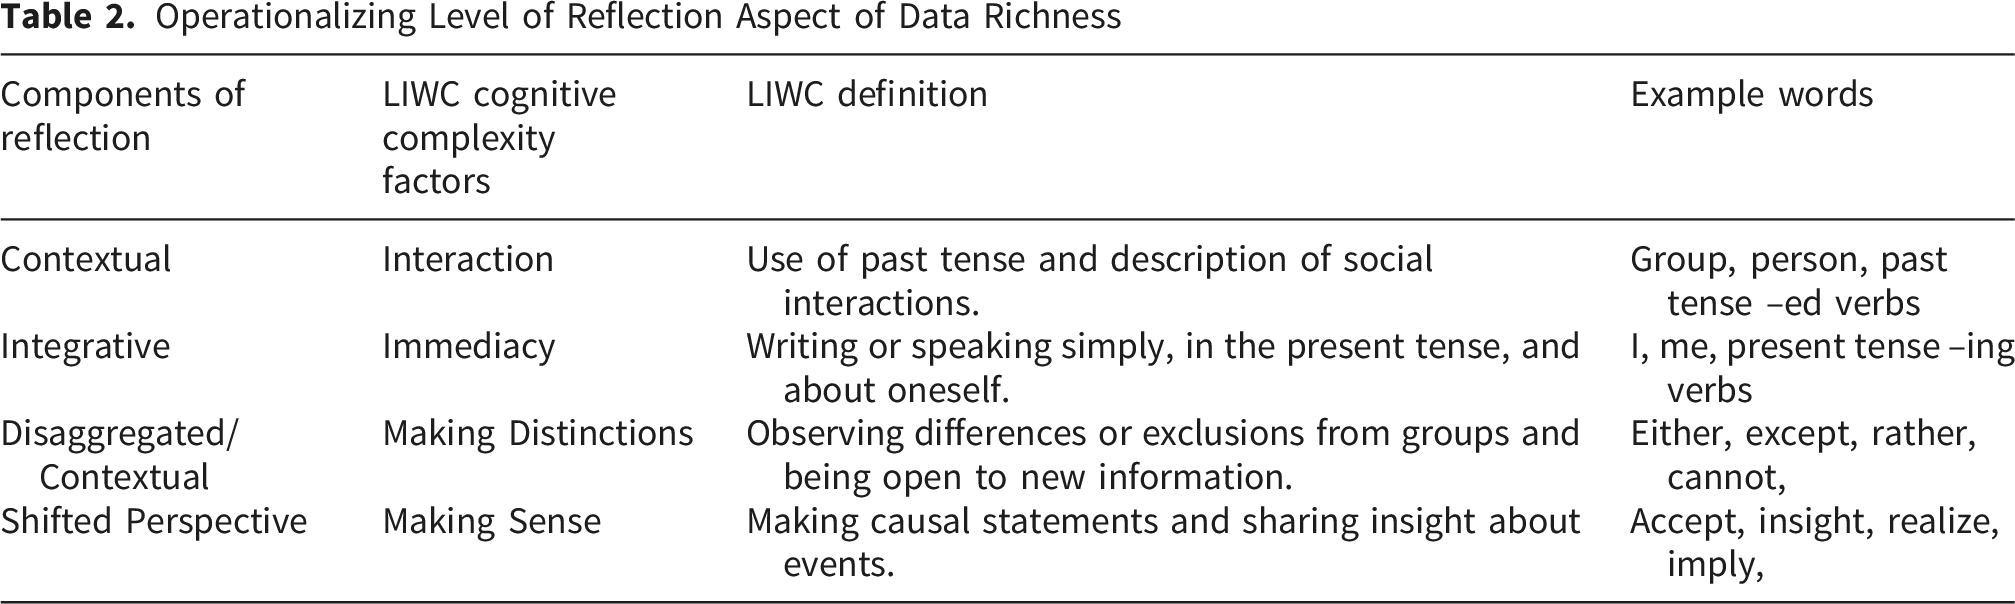
In subsequent studies, Savicki and Price (2017, 2021, 2022) demonstrated how these characteristics of reflection align with four variables from the LIWC literature which they name cognitive complexity factors (shown in Table 2). These variables were identified by Pennebaker and King (1999) through factor analysis to group dimensions of language developed in earlier studies. These factors integrate cognitive and affective language and, given this higher order language usage, are indicative of cognitive complexity. Savicki and Price (2022) suggest the following connections between the cognitive complexity factors and level of reflection. Immediacy can indicate reflection that includes an individual’s beliefs, assumptions, and expectations. Making Distinctions may demonstrate processing differences in culture or worldview. Interaction indicates less introspection and more collaborative processing, but describing one’s response to social interactions is often central to making meaning. Making Sense may indicate shifted perspectives and accommodation of new worldviews (Savicki & Price, 2022). Savicki and Price have provided evidence of construct validity (Savicki & Price, 2021) and criterion validity (Savicki & Price, 2022) for using these cognitive complexity factors to measure reflection.
Methods
We analyzed data from three studies of student learning in study abroad programs that used different methods of data collection: written diaries (Study 1), interviews (Study 2), and video diaries (Study 3). These studies were approved by the Purdue University Institutional Review Board, and all participants signed consent forms before participating in the studies. We will first describe our positionality and discuss why we believe it is reasonable to compare the data from these studies. We will then explain the data collection process for each study and the data analysis approaches we used to compare the data across studies.
Positionality
The authors of this paper are both white women educated in engineering as undergraduates and educational research in our advanced degrees. Author 1 designed all three research studies included in this analysis, personally collected and analyzed the data for Studies 1 and 2, and collaborated on the data collection and analysis for Study 3 with Author 2. Author 2 supported data collection and analysis for Study 3 and previously analyzed data from Study 2. We developed these studies from an interpretivist perspective, in which we sought to understand student experiences and the meaning they drew from those experiences. In the current study, we are conducting a secondary data analysis of these data sets in which we take a post-positivist perspective through our use of content analysis with pre-defined categories (Neuendorf, 2017), in alignment with our research questions. Both authors were involved in the data analysis for this study (discussed further below).
Comparability of These Data Sets
A potential challenge in addressing our research questions is that our data sets were not collected from the same participants. Nevertheless, we believe that a comparison is worthwhile because 1) An ideal study using three data collection methods with the same participants is impracticable; 2) The three studies were similar in most other aspects. First, as mentioned earlier, all studies were designed and carried out by the same researcher (Author 1) based on the same research objective and epistemological framing. Each study used the Critical Incident Technique (CIT) to collect stories from students about their experiences abroad. CIT asks participants to tell a story about a specific event, including what happened, how they responded to the situation, and what they learned from this experience (Douglas et al., 2009). The participants for all studies were engineering students at universities in the United States, and most participants were in the 18-24 age range (some postgraduate students in Study 2 were slightly older). In the following sections, we will provide details about the unique aspects of each study, which can inform our interpretation of the findings. However, based on these commonalities, we believe that a comparison of the data sets can provide useful insights for researchers and educators considering these different methods. We acknowledge that the comparison of only three studies is a limitation; however, by focusing on fewer studies we were able to limit the differences across studies, which is essential to addressing our research questions.
Study 1 – Written Diaries
The participants for Study 1 were undergraduate engineering students in their second semester at one university who completed a two-week study abroad program in various locations. Additional participant and program characteristics are included in Appendix A. As a requirement of this program, the students kept written diaries in which they reflected on their experience at multiple points during the program in response to reflection prompts. The reflection prompts asked students to discuss key events from their program and provided several reflection questions to help the students process these events. Because the reflections were required for the program, no incentives were provided. Author 1 selected 29 written diaries from across the different program locations based on students’ responses on a pre-post administration of the Global Perspectives Inventory (GPI; Research Institute for Studies in Education, 2017). She aimed for variation in the sample by selecting written diaries from some students whose GPI scores increased, some whose scores decreased, and some whose scores stayed the same between the pre- and post-surveys. The average length of the written diaries was 6040 words, with a total of 175,157 words across all the written diaries included in our analysis. Previous analysis of the written diaries for student learning outcomes can be found in Davis and Knight (2021). We could not include additional written diaries in this study because of data availability (we had access to these diaries because of their use in the prior study).
Study 2 – Interviews
The participants for Study 2 were current or recently graduated undergraduate (72%) and postgraduate (28%) engineering students who had completed different types of study abroad programs. Author 1 conducted interviews with 24 participants from short-term study tours, 9 from short-term classes abroad, 35 from research/internships abroad, and 10 from semester abroad programs (79 total participants). Additional participant and program characteristics are included in Appendix B. All interviews took place after the students returned home from their programs and asked students to describe their program, motivations for participating, take-aways for their future, and connections between engineering and culture. A large portion of each interview focused on one CIT question, where Author 1 asked students to provide two critical incidents from their time abroad. The specific prompt was: Talk about two specific experiences that were significant to you during your time in [country name]. For these examples, I’d like you to think of a time where you felt that you learned something important (and this could be any kind of learning, about research, culture, travel, yourself, etc.) Author 1 used follow-up questions to help students expand on their stories, based on previous CIT studies (Bott & Tourish, 2016; Hess et al., 2017; Walther et al., 2011). The participants in this study did not receive incentives. Through analysis of the interview transcripts, Author 1 identified 173 critical incidents, which she analyzed for student learning processes (Davis & Knight, 2023, 2025). For our current analysis, we removed all words spoken by the interviewer, after which the average length of the interviews was 4299 words, with a total of 335,317 words across all the interviews.
Study 3 – Video Diaries
The participants for Study 3 were ten undergraduate engineering students completing semesters abroad in different locations. Additional participant and program characteristics are included in Appendix C. These students recorded video diaries from their phones over a 15-week period. We used a phone application to prompt students each week to submit a reflection. We included a prompt similar to the one for Study 2 and asked students to make a video about 5-8 minutes in length. Most of the video diaries were 8 minutes or more and sometimes participants recorded a second video in the same week. Some students recorded videos every week, while others primarily recorded videos in the earlier weeks of their travel. The students in this study received $5 for each video and an additional $25 if they completed 80% of the requested reflections. The reflections were transcribed into a single document for each student, which was provided to them as an additional incentive for participation. The average length of the video diaries for one participant across the 15-week period was 9084 words, with a total of 90,840 words across all the video diaries we included in our analysis. Our previous analysis of student learning based on this data set is reported in Wrobetz et al. (2024).
Data Analysis
The authors developed and implemented the analysis plan together through regular meetings and discussions of the prior literature. Author 2 then imported data from each of the studies above into LIWC-22 and ran a text analysis based on the most current dictionaries. She analyzed each student’s transcript or written diary individually and averaged scores for each data collection method. To answer RQ1, we compared the depth of content dimensions shown in Table 1 by adding the relevant LIWC category scores. Author 2 calculated a z score for each dimension, normalizing to a mean of 0 and a standard deviation of 1. Any z scores above 0 represent a positive deviation from the mean score, and z scores below 0 represent lower-than-average results. Author 2 then used a one-way Welch’s ANOVA to test for statistically significant variations between the data collection methods. She ran a pairwise Games-Howell post-hoc comparison to determine which of the data sets differed and calculated the effect size using Hedges g. Each of these methods were chosen to accommodate our data sets, which have widely different sample sizes and variances (Field et al., 2012). Finally, the authors worked together to identify quotes from each data set that demonstrate the depth of content differences identified through the LIWC analysis.
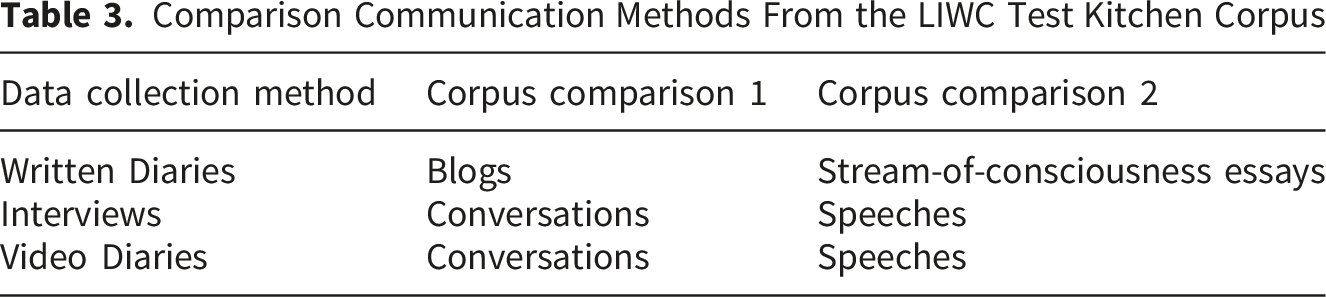
Comparison Communication Methods From the LIWC Test Kitchen Corpus
To answer RQ3, Author 2 ran our data through the 2007 LIWC dictionaries which contain the categories used by Savicki and Price (2017) to analyze reflective processes. She then calculated the cognitive complexity factors defined in Pennebaker and King (1999) by multiplying each category by the rotated factor and summing each resulting score. Author 2 converted the factor scores to z scores, performed a Welch’s ANOVA and Games-Howell test, and calculated the Hedges g to determine effect size, following the same approach as we used to answer RQ1. Finally, both authors compared the z scores, ANOVA results, and effect sizes to demonstrate differences in level of reflection across data collection methods.
Results
RQ1: How do the Three Qualitative Data sets Compare to Each Other in Their Depth of Content?
Depth of Content Scores for Each Data Collection Method
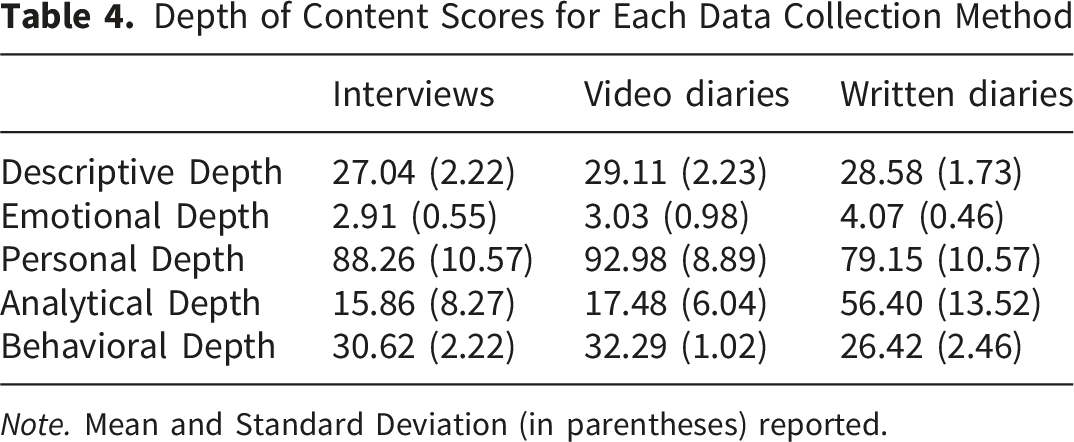
Note. Mean and Standard Deviation (in parentheses) reported.
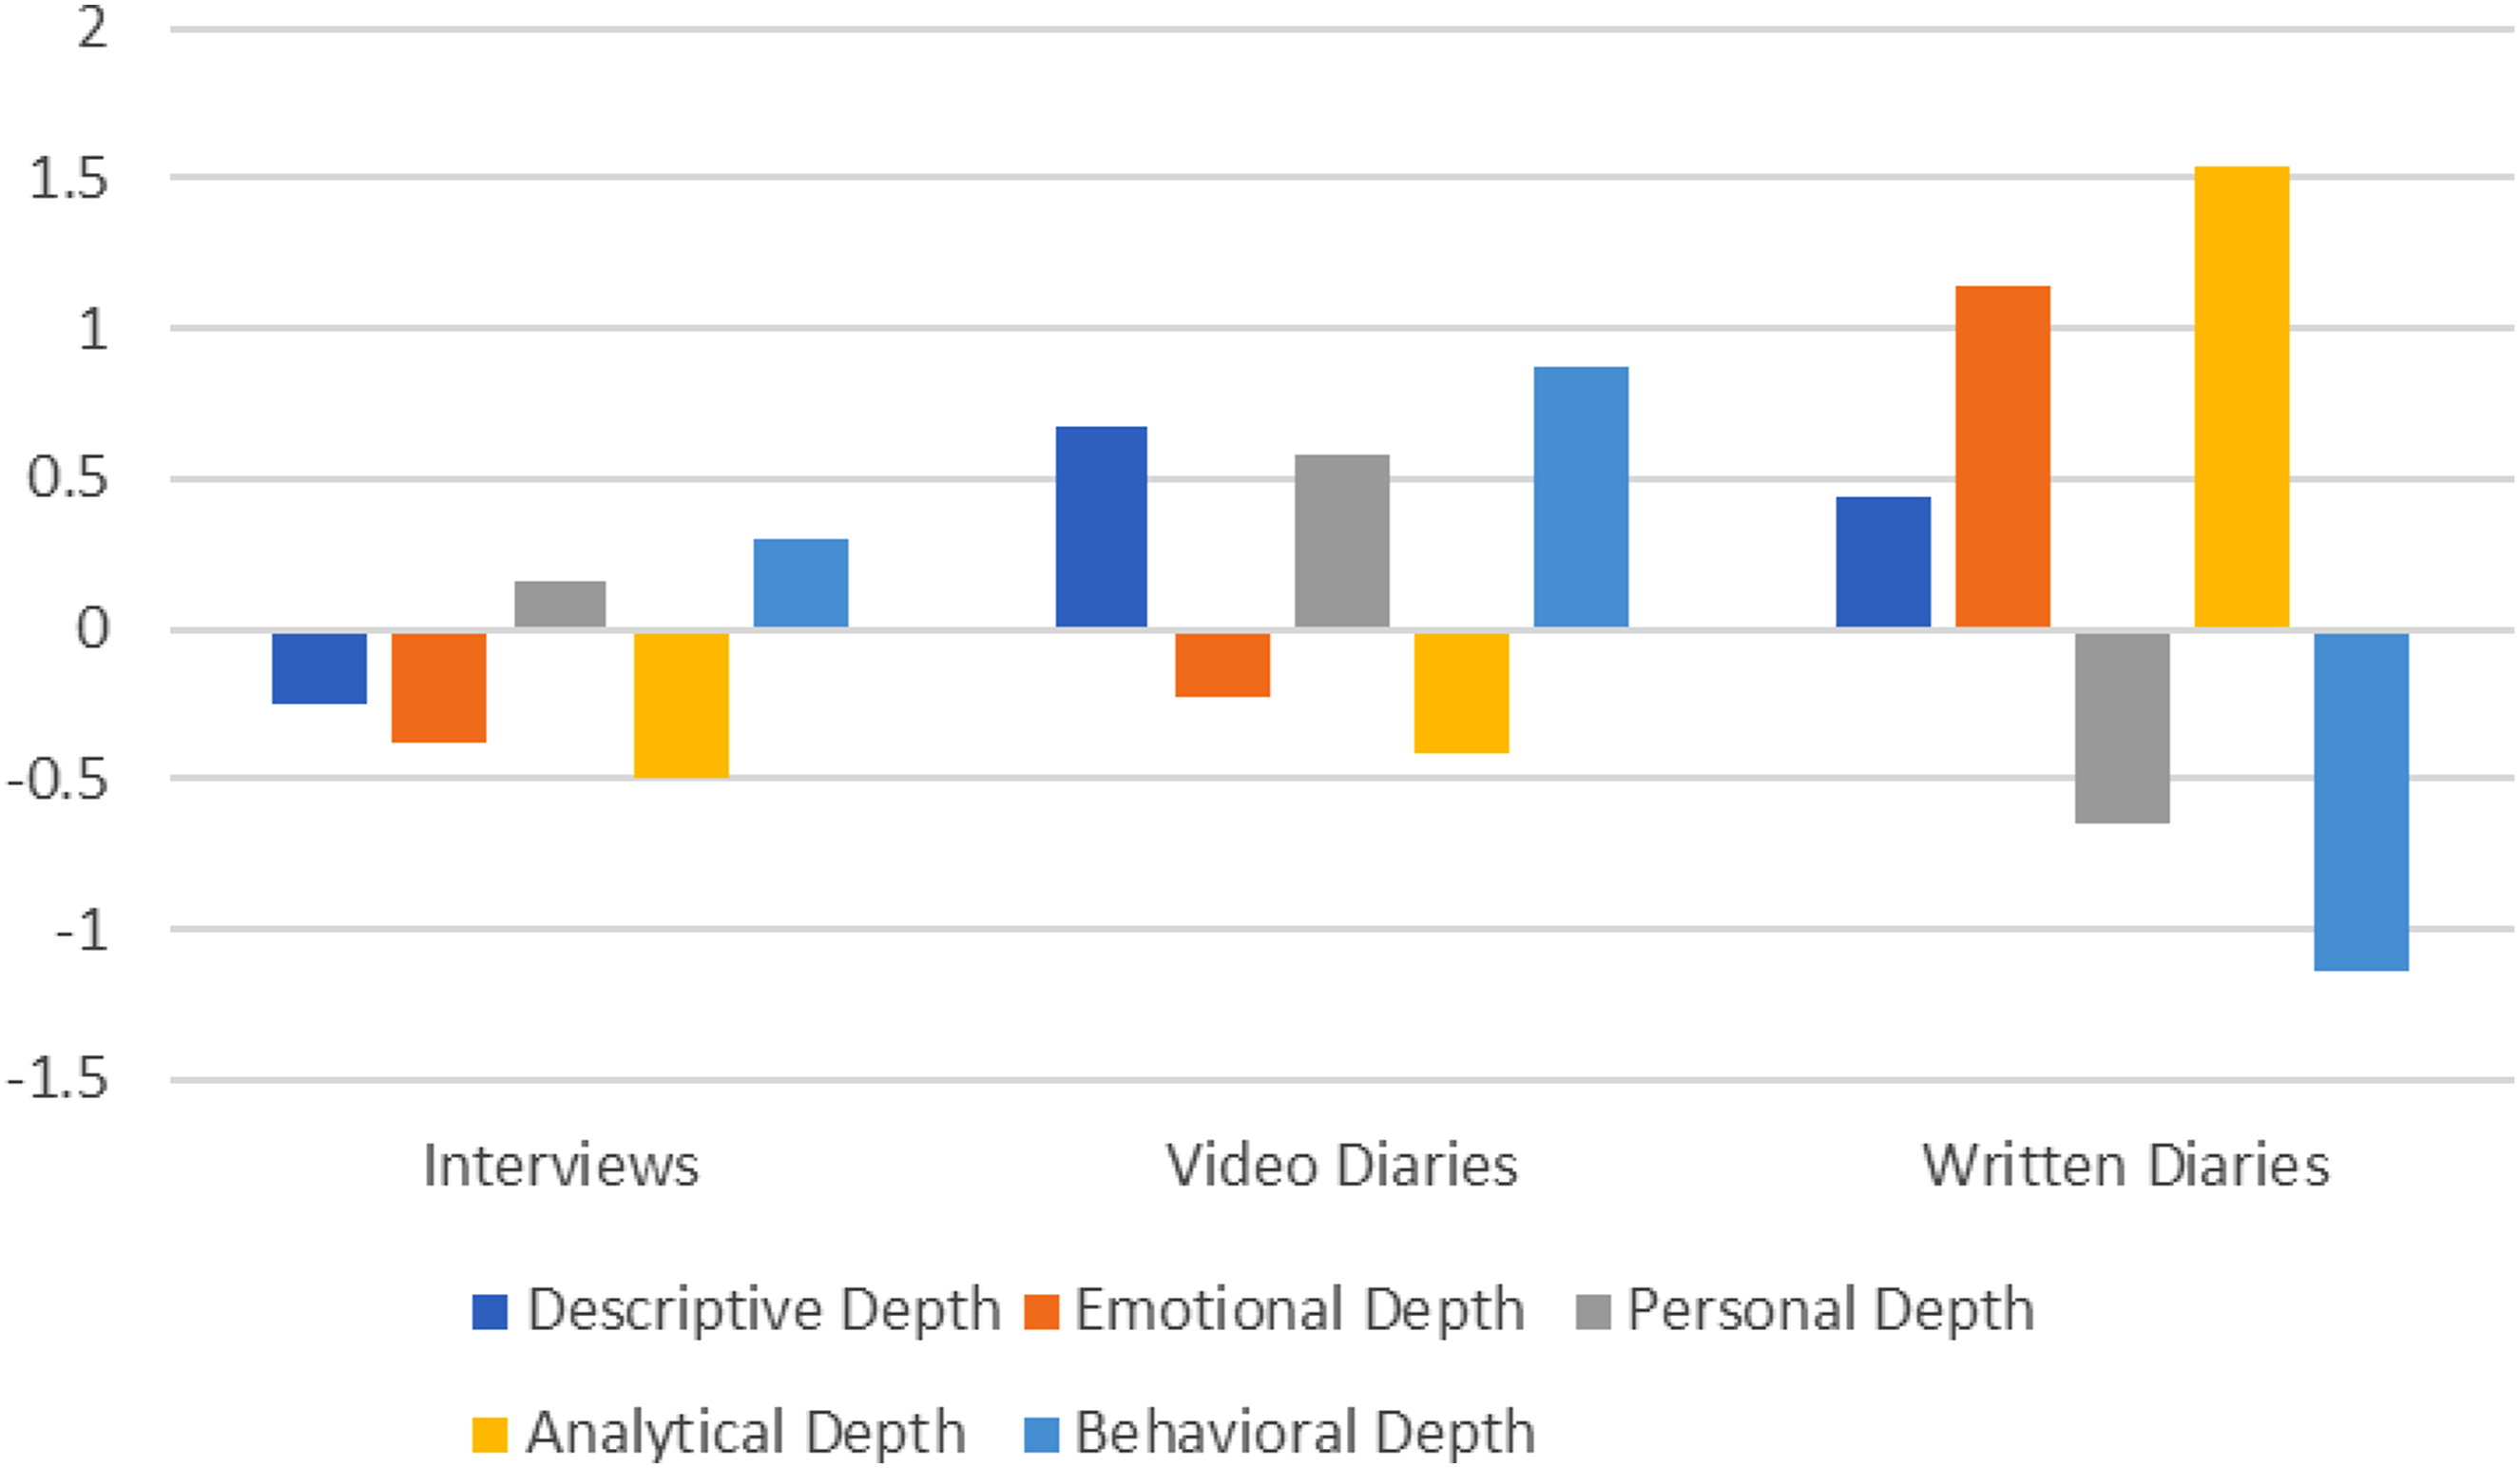
Comparing depth of content dimensions across data collection methods (z scores)
Based on the z scores, we can see that the interviews and video diaries in our data sets are more similar in their depth of content compared to written diaries. The written diaries tend to have more analytical and emotional depth, meaning that the students used more emotion words, and were more likely to use formal or hierarchical language. In contrast, in the interviews and video diaries, students demonstrated more personal depth, meaning they referred to themselves more often and demonstrated authenticity in their responses. Similarly, these methods elicited more behavioral depth, including more action words and more descriptions of interactions among people.
Results of Welch’s ANOVA Comparing Depth of Content Across Methods
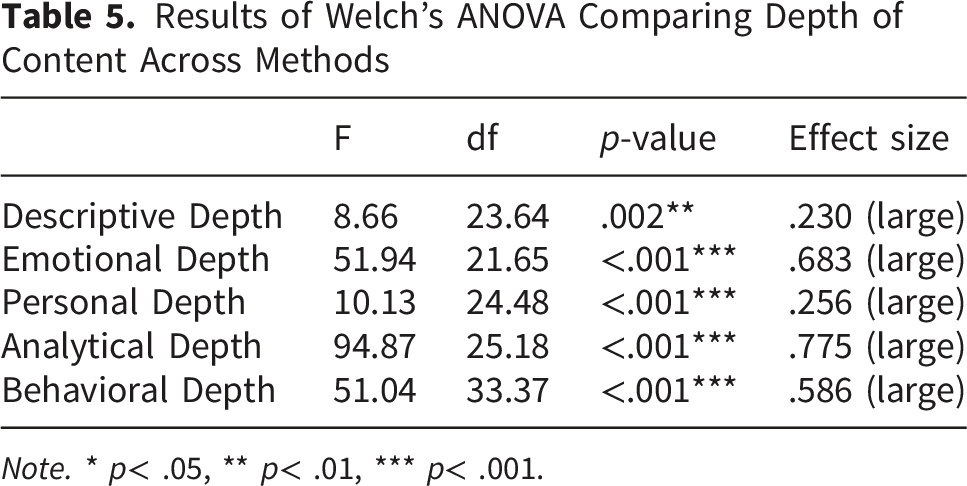
Note. * p< .05, ** p< .01, *** p< .001.
Pairwise Comparison of Depth of Content Across Data Collection Methods
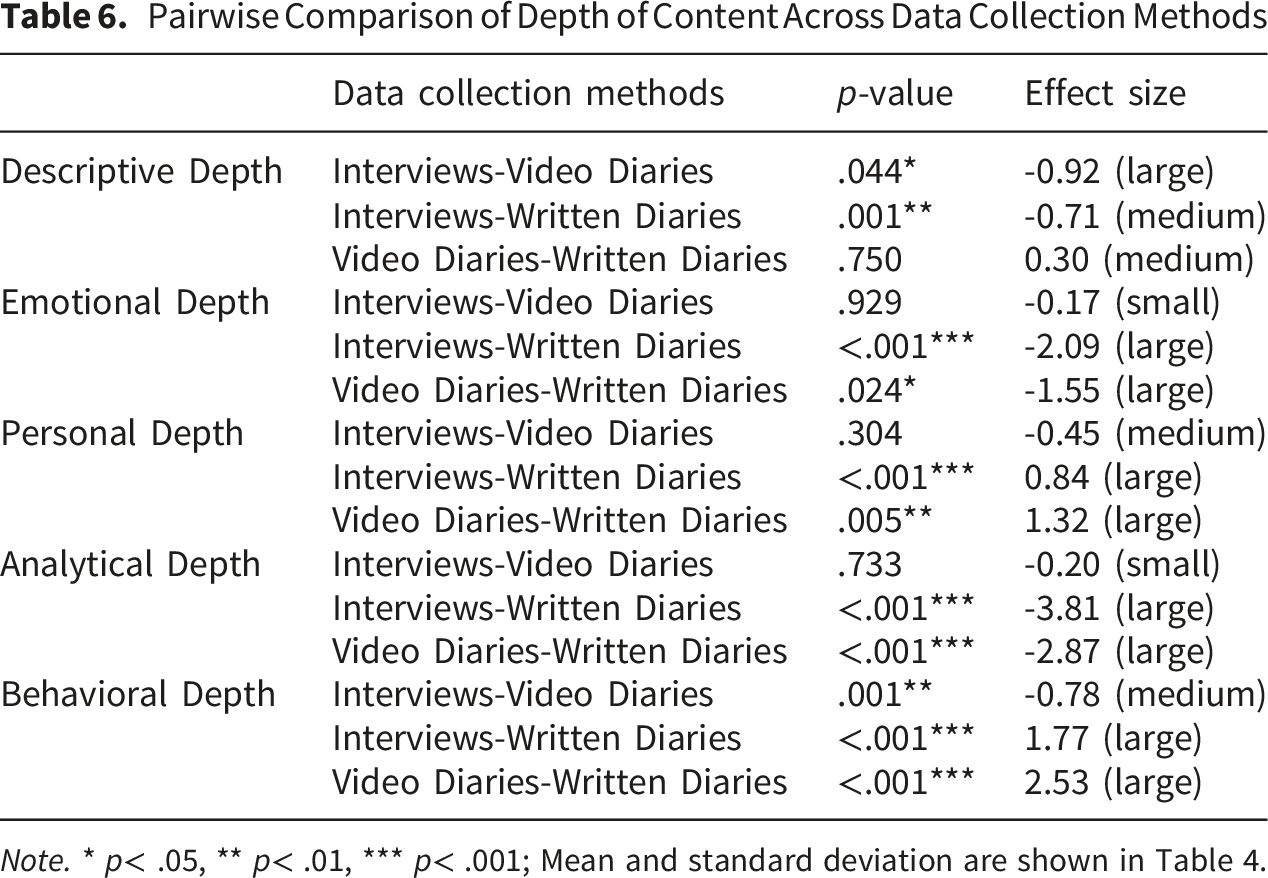
Note. * p< .05, ** p< .01, *** p< .001; Mean and standard deviation are shown in Table 4.
Similar to the z scores, these findings indicate that the interviews and video diaries in our data sets are similar, lacking significant differences in the dimensions of emotional, personal, and analytical depth. The written and video diaries are similar in descriptive depth and differ significantly from the interviews in this dimension. The most notable differences are between the written diaries and the other two methods, where written diaries score significantly higher (with large effect sizes) for emotional and analytical depth and significantly lower (with large effect sizes) for personal and behavioral depth. These results confirm the findings from the z scores.
At a high level, these scores capture the “reporting” tone that is often found in written diaries, with lots of description and analysis, but with the author more removed from the content. For example, one student wrote about their time in Chile: “The next day began with a tour of the Universidad Catolica, which I believe was said to be the best engineering school in Chile. It was gorgeous…The entire university had earthquake-resistant supports underneath each building. They were called isolators and made it so when the ground moved, the buildings did not.”
This quote focuses on describing facts about the campus but provides little personal content. In contrast, the students in our study spoke more authentically in video diaries and interviews and told stories with themselves as the main characters interacting with others. In a video diary, one student described a trip to the airport this way: “I was a little confused because I never really had an issue going through security with food. So, I looked at him and he was like, ‘No,’ he’s like, ‘only liquid, only liquid.’ So, I understand that he’s asking me to throw away my food because I thought he meant I couldn’t have food unless it was liquid…Then I get my food, and I throw it away in front of him. And he didn’t say anything either. He watched me throw away my food and he didn’t say anything.”
Similarly, in our interviews, students spent more time describing their own interpretations of events and interactions among people. One student realized their own lack of connection to their environment: “I think I just got a better appreciation for how people can interact with the wider region around them. We typically just drive places; we don’t really walk everywhere. I think you miss a lot when you just drive. Or if you’re on a highway, and there’s the noise barriers, and you can’t even see what’s next to the highway. We don’t have a really good sense for what’s around us.”
These quotes demonstrate the more formal and descriptive language that is typical in our written diaries as compared to the more personal and active narratives that we saw in our interviews and video diaries. The differences between the interviews and video diaries are more subtle, and perhaps most noticeable in the greater descriptive depth in the videos, where the students were closer to their experiences rather than reflecting back over a longer period.
RQ2: How do the Three Qualitative Data Sets Compare to Other Common Language Types in Their Depth of Content?
Comparing Our Written Diaries to Similar Language Types
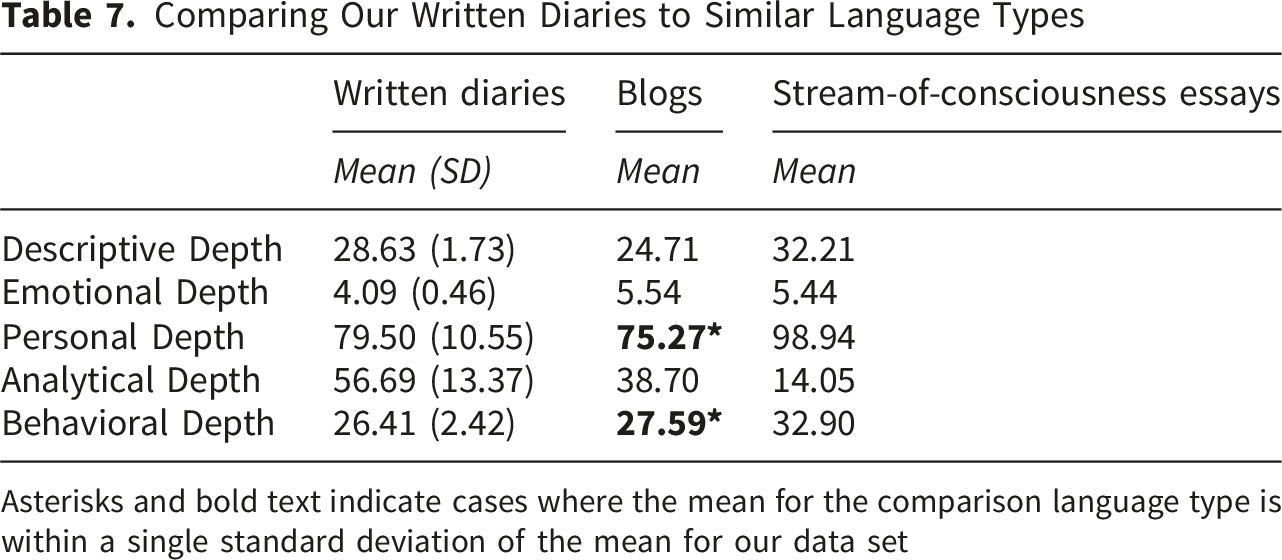
Asterisks and bold text indicate cases where the mean for the comparison language type is within a single standard deviation of the mean for our data set
Comparing Our Interviews to Similar Language Types
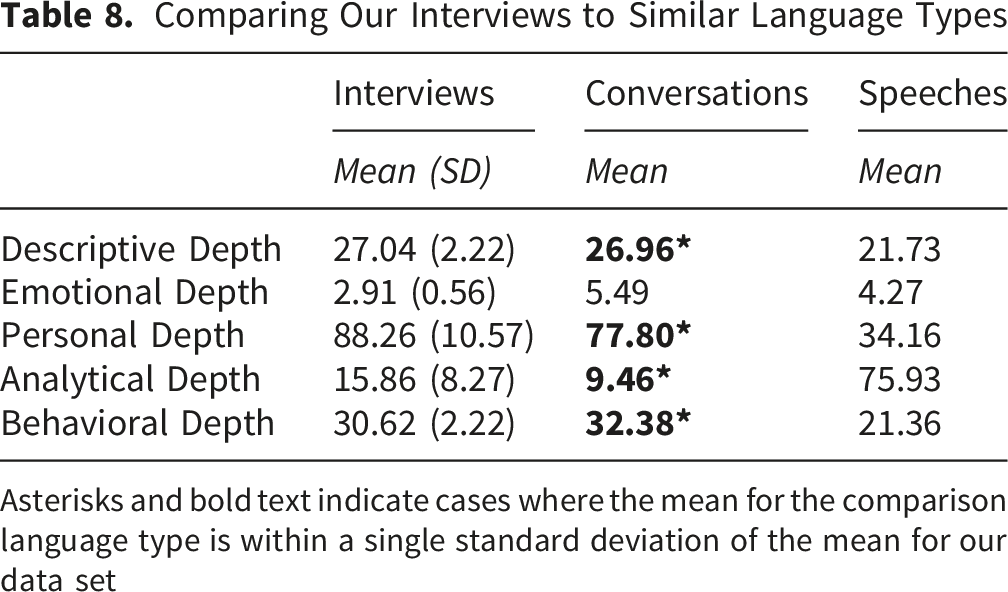
Asterisks and bold text indicate cases where the mean for the comparison language type is within a single standard deviation of the mean for our data set
Comparing Our Video Diaries to Similar Language Types
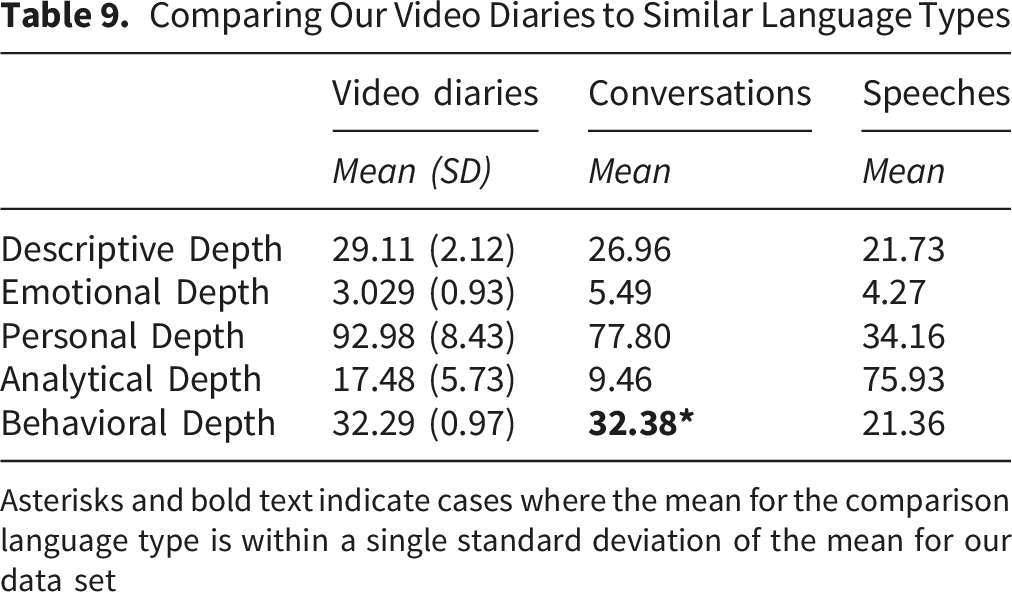
Asterisks and bold text indicate cases where the mean for the comparison language type is within a single standard deviation of the mean for our data set
The written diaries in our study are most similar to blogs, falling within one standard deviation of the mean in both the personal and behavioral depth categories. These written diaries differ from stream-of-consciousness essays by at least one standard deviation in all depth of content categories. In particular, our written diaries show less personal depth and higher analytical depth than stream-of-consciousness essays, indicating more self-editing and greater focus on interpreting situations rather than just describing them.
The interviews in our study are more similar to conversations than speeches, which makes sense as they are not scripted and rehearsed. In terms of depth of content, conversations fell within one standard deviation of the mean for our interview data set on four out of the five dimensions. However, it is interesting to note that our interviews have lower emotional depth than both the conversations and the speeches in the LIWC Text Kitchen Corpus. Compared to speeches, our interviews also have much higher personal depth and much lower analytical depth. This pattern suggests that our interviews are less formal and more personal than speeches, which may indicate that a positive rapport was established between the interviewer and the participants. However, the lack of analytical depth in our interviews could suggest a weakness for studies where understanding a participant’s interpretation of a situation is important. It is interesting to note that the depth of content in the speeches is closer to our written diaries than to the interviews.
The video diaries in our study are also more similar to conversations than speeches, but they differ from conversations more than the interview data. This finding suggests that, although the video diary method could offer students a chance to prepare their answers (compared to interviews), the students in our study did not seem to take this approach as the resulting data set does not look like speeches. At the same time, our video diaries are noticeably different than the conversations as well, particularly in terms of personal and analytical depth. Overall, our video diary data seems to capture a somewhat more analytical response than the interviews while also being more personally and behaviorally deep than the written diaries.
RQ3: How do the Three Qualitative Data Sets Compare to Each Other in Their Level of Reflection?
Level of Reflection Scores for Each Data Collection Method
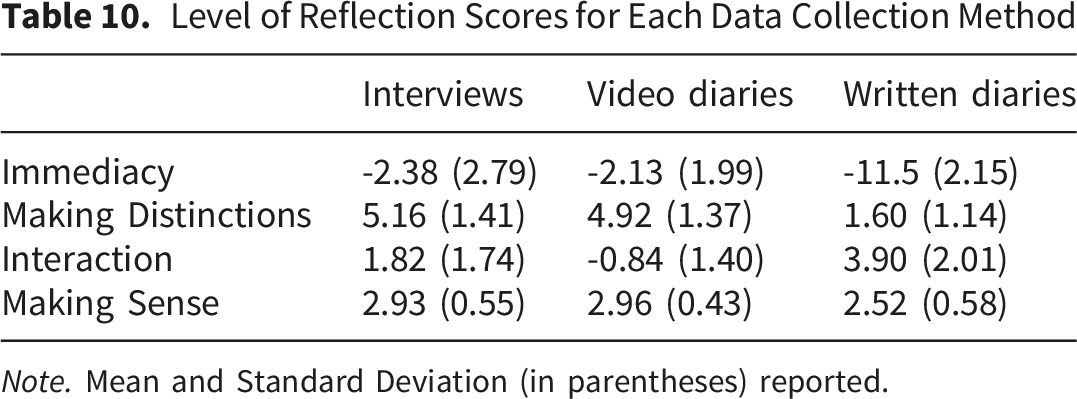
Note. Mean and Standard Deviation (in parentheses) reported.
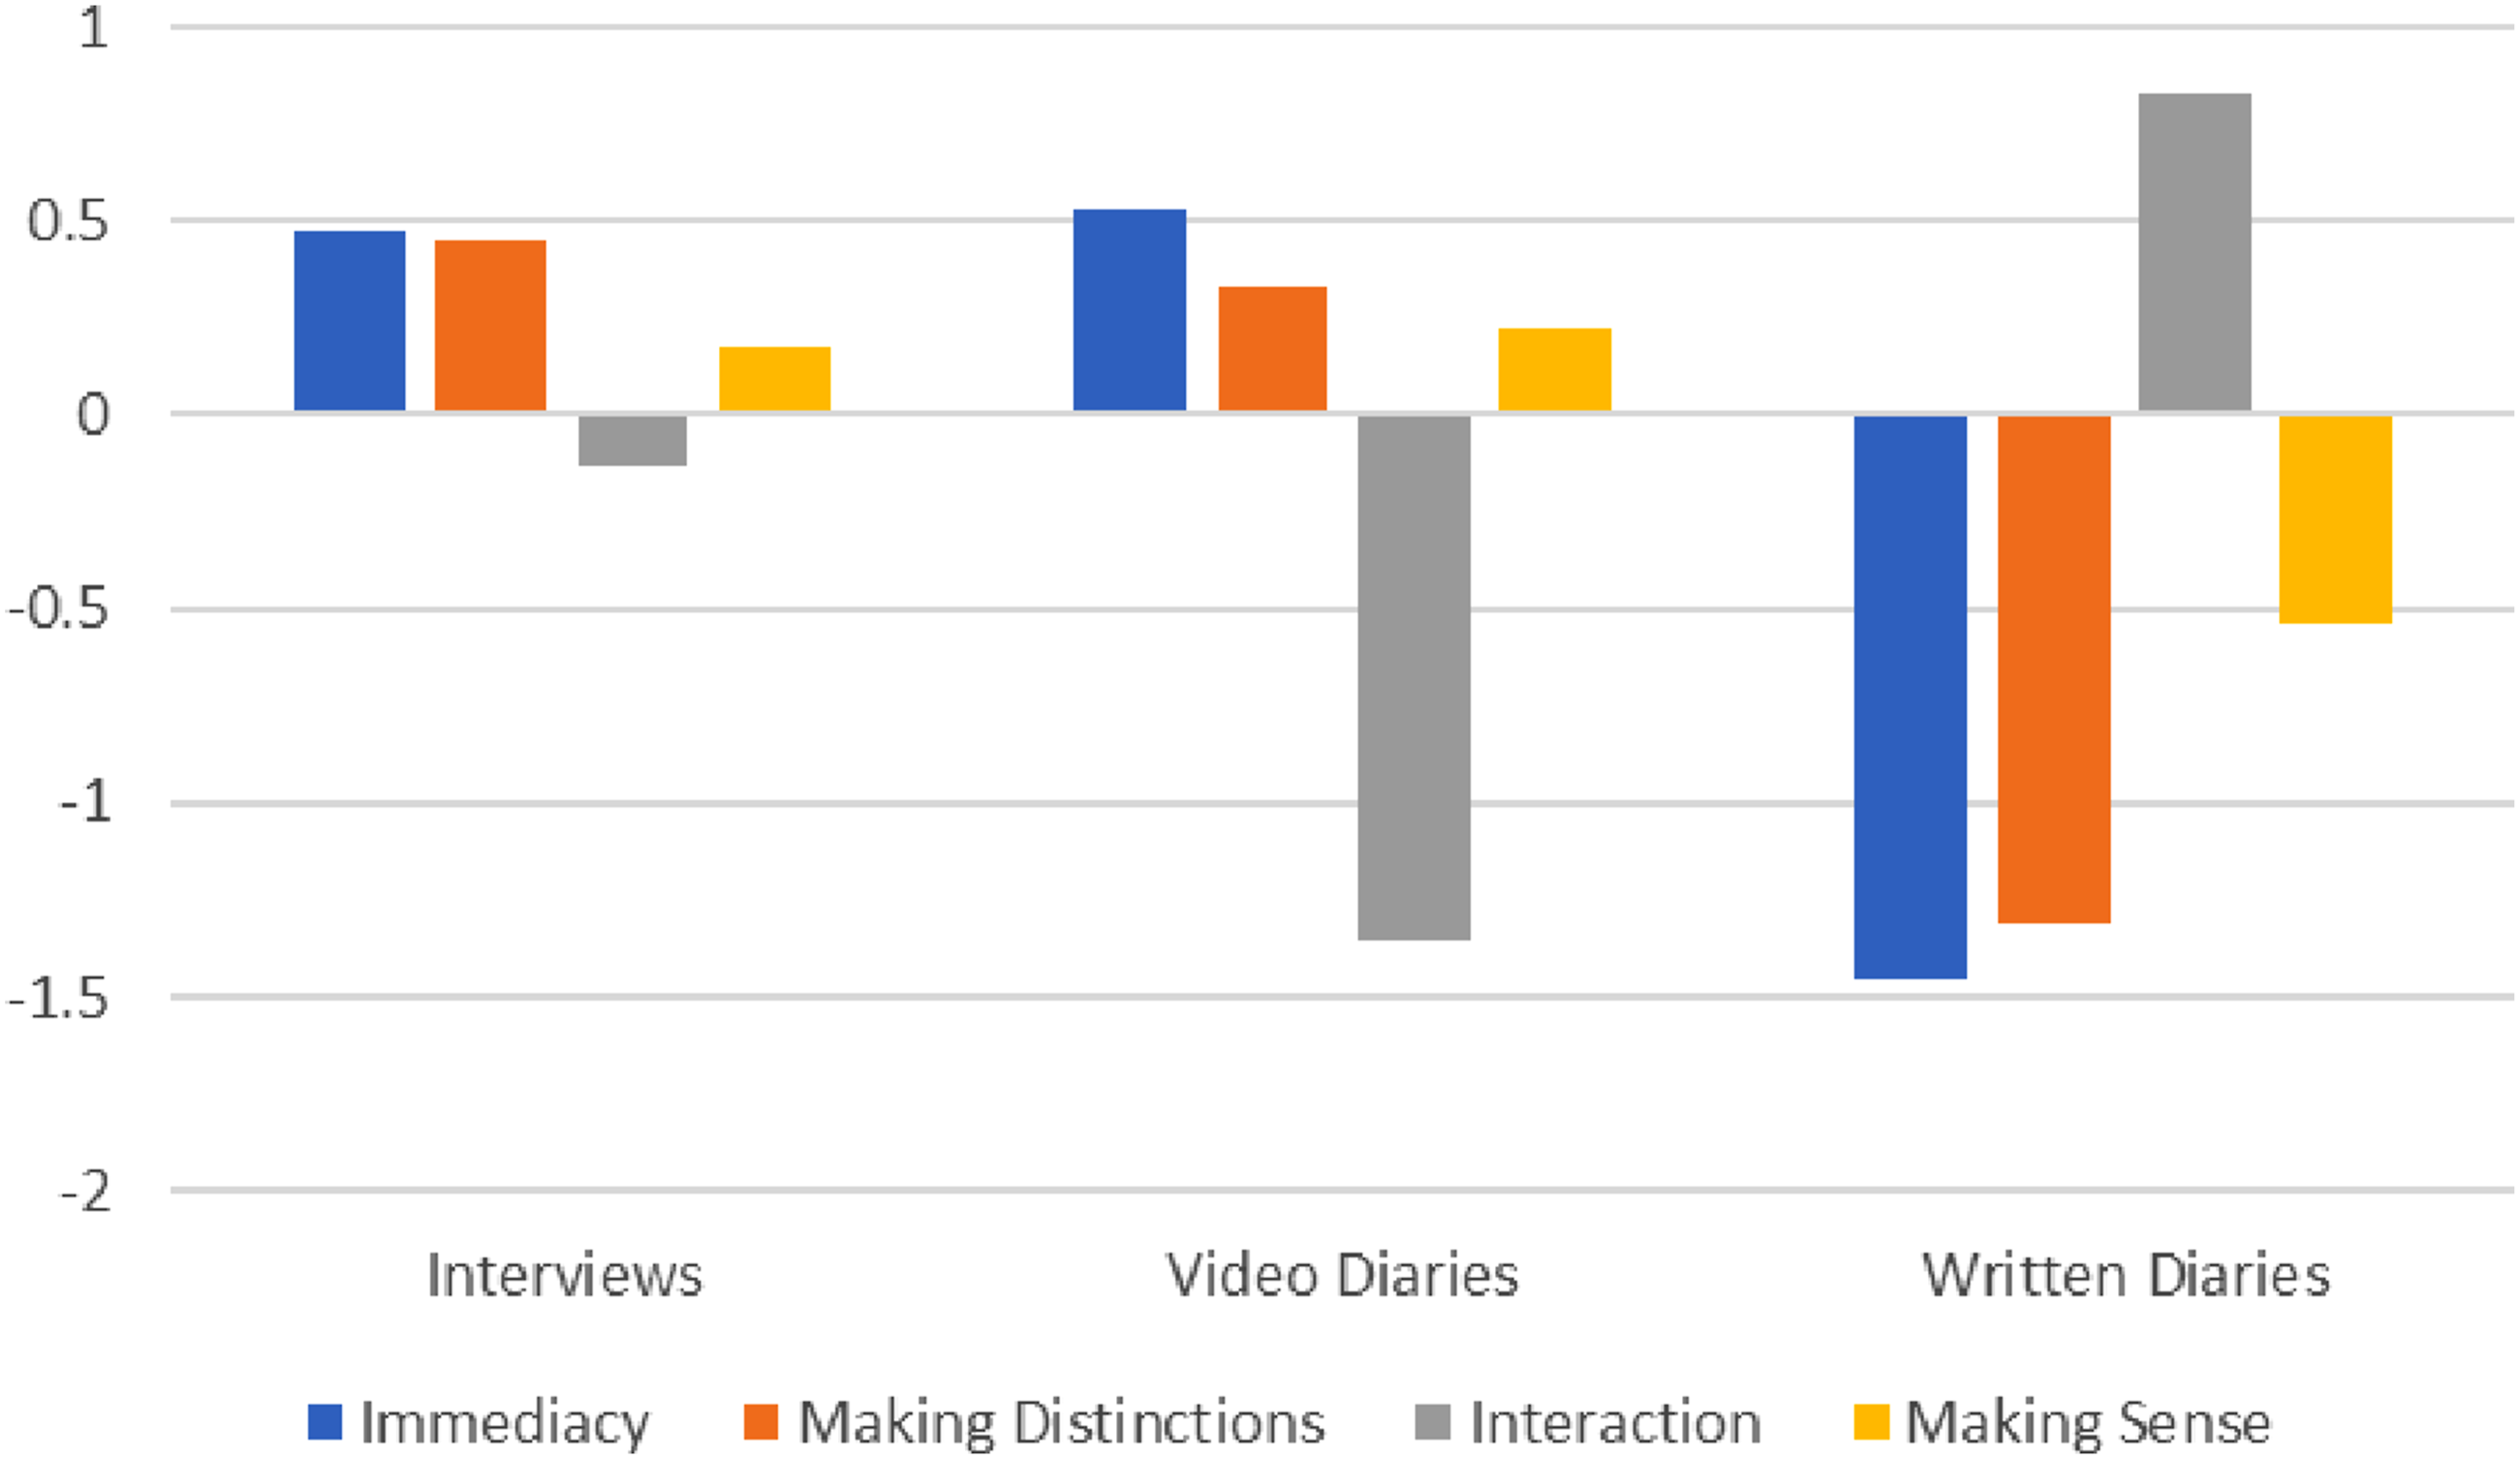
Comparing level of reflection dimensions across data collection methods (z scores)
Results of Welch’s ANOVA Comparing Level of Reflection Across Methods
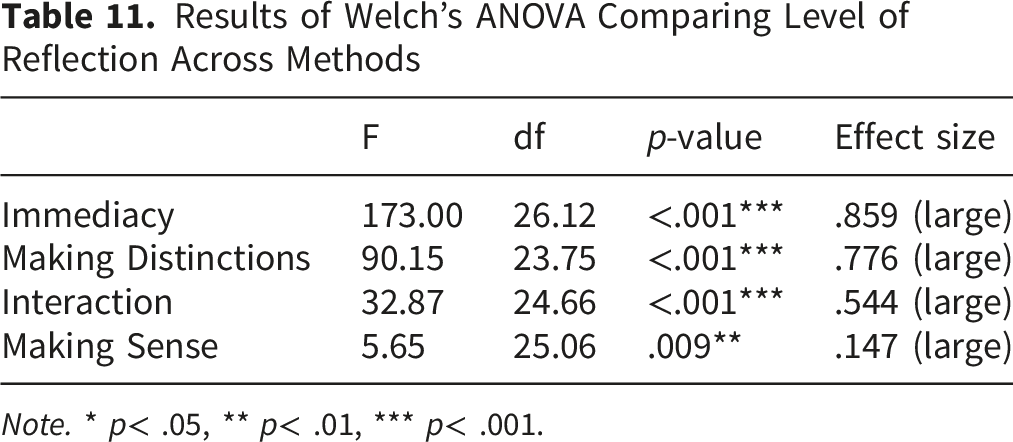
Note. * p< .05, ** p< .01, *** p< .001.
Pairwise Comparison of Level of Reflection Across Data Collection Methods
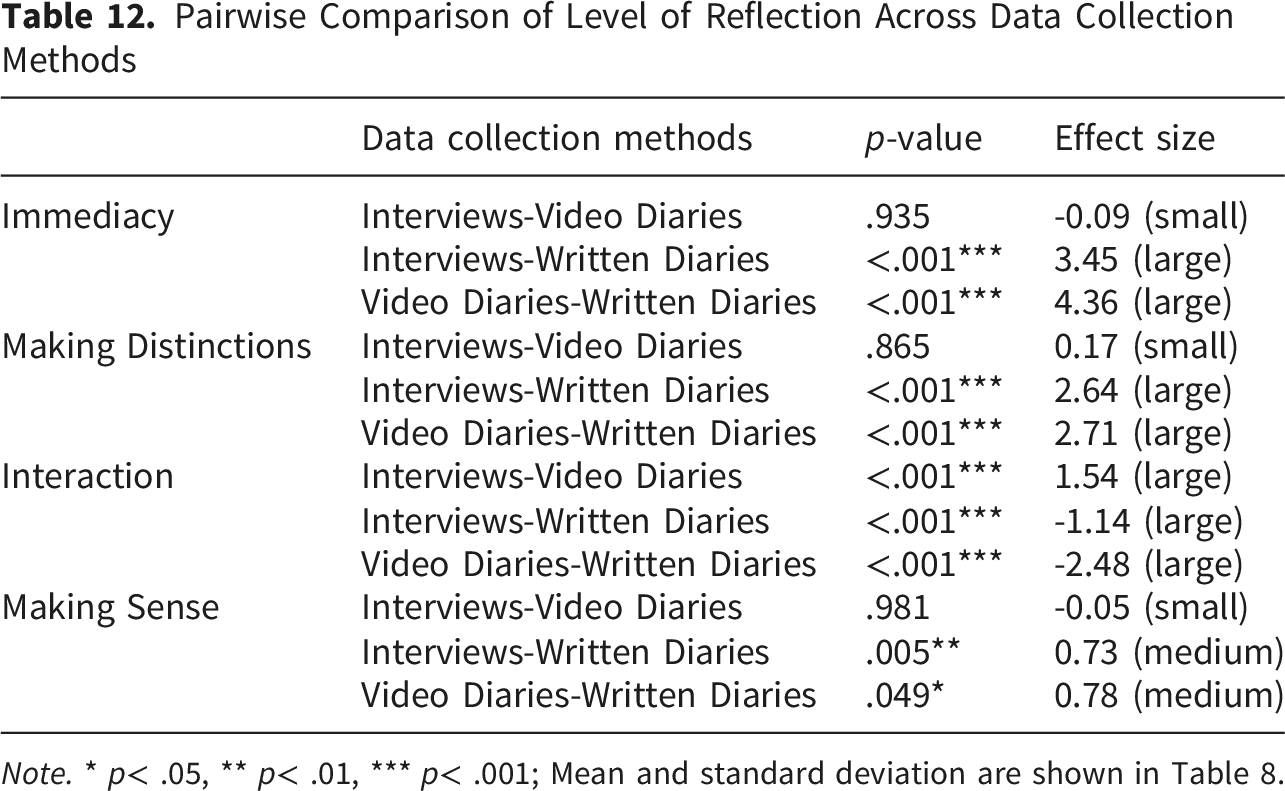
Note. * p< .05, ** p< .01, *** p< .001; Mean and standard deviation are shown in Table 8.
As we saw in our findings for RQ1, our interview and video diary data sets are similar to each other (only one significant difference) while our written diaries are significantly different from both other methods across all dimensions. However, in contrast to RQ1, where we saw high depth of content in the written diaries for some dimensions, here we see (for the most part) lower levels of reflection compared to the interviews and video diaries. Most notably, the students in our study demonstrated significantly lower scores in the Immediacy, Making Distinctions, and Making Sense categories in the written diaries. Lower Immediacy scores are likely related to the differences between writing and speaking (i.e.,we use longer words and more formal language in writing) but may also indicate less introspection as students refer to themselves less often and may not describe their personal values or expectations. The difference in scores for Making Distinctions suggests that students were more likely to observe contrasts and differences in culture or worldview in the interviews and video diaries compared to the written diaries. Similarly, differences in the Making Sense dimension suggests that students were less likely to describe shifted perspectives in their written diaries compared to the other data collection methods.
The one area where the written diaries scored significantly higher than both other methods is the Interaction dimension, which focuses on a combination of social interactions and past tense verbs. It is also notable that this dimension was especially low for the video diaries—the only significant difference between the videos and the interviews. This pattern is likely a function of three things: speaking in past tense, types of study abroad programs, and the social nature of interviews. First, the students in written diaries were more likely to write in past tense compared to the video diaries, where students spoke mostly in present tense. Second, the students in the written diaries were part of a group study abroad program, whereas the interview students came from many different programs (some individual, some groups) and the video diary students were all traveling individually. Finally, the interviews were conversations between participants and the interviewer, giving them more social interaction language compared to the video diaries. Overall, however, these results suggest a higher level of reflection in both the interviews and the video diaries compared to the written diaries in our study.
Discussion & Implications
Our study explored differences in data richness across three qualitative data collection methods: written diaries, interviews, and video diaries. We used linguistic inquiry to compare these data sets for depth of content (i.e.,detail provided about an experience) and level of reflection (i.e.,cognitively complex thought processes). In response to RQ1, we found different strengths for depth of content among the three data collection methods. Our written diary data had greater analytical and emotional depth compared to the other two methods, but was lower in personal and behavioral depth. The interview and video diary data sets were similar, but interviews had somewhat less descriptive and behavioral depth that the videos. In response to RQ2, we compared our data to other common language types in the LIWC Test Kitchen Corpus. We found that the written diaries were similar in their depth of content to blogs (though notably more analytical), and the interviews were similar to conversations. The video diaries were also similar to conversations but demonstrated more personal and analytical depth. In response to RQ3, we found that the interview and video diary data sets demonstrated higher levels of reflection across most dimensions compared to written diaries. The written diaries were higher in the Interaction dimension, which may be related to the specific types of programs represented in that study. Overall, we found that data richness differed both in depth of content and level of reflection across our three data sets.
Our study contributes a better understanding of the data richness that can be achieved using different qualitative data collection methods. Although several previous studies have compared data collected through different methods (e.g., Baker, 2023; Danielsson & Berge, 2020; Fitt, 2018; Litovuo et al., 2019; McDonnell et al., 2017), we offer a new perspective to the conversation by using linguistic inquiry to consider differences in both depth of content and level of reflection. First, we found unique patterns in the depth of content dimensions, which may inform a researcher’s choice of which method to use in a study. For example, prior studies found written diaries are more self-edited than audio diaries (Fitt, 2018) and less personal and more “matter of fact” than interviews (Baker, 2023, p. 698). We noted a similar trend in the formal language of the written diaries in our study, but the written diaries also contained more descriptive and analytical depth, which may be desirable in certain studies or educational contexts. Similarly, the video diaries in our study demonstrated more descriptive and emotional depth than interviews, which supports claims that participants may feel more comfortable without an interviewer present and express themselves freely (Danielsson & Berge, 2020). At the same time, the differences between video diaries and interviews were smaller when compared to the written diaries, which may reflect previous findings that individual participants can prefer one method over the other (McDonnell et al., 2017). Overall, our study offers a more nuanced framing of depth of content and demonstrates how linguistic inquiry can reveal distinctive patterns of strengths and weaknesses in the richness of qualitative data.
Second, we found that the interviews and video diaries in our study demonstrated greater levels of reflection across most dimensions compared to written diaries. The differences in the depth of content (where each method demonstrated unique strengths) and level of reflection (where journals were clearly weaker) suggests these are different aspects of data richness that should be considered separately. It is important to note the differences in the LIWC variables that we used to operationalize depth of content versus level of reflection. The depth of content variables characterize which types of content were discussed and what kind of language was used, whereas the level of reflection factors integrate cognitive and affective language to demonstrate cognitive complexity. In written diaries, the students in our study would describe a situation in detail but fail to introspect about its personal impact. Similarly, they might use logical language to analyze an event but stop short of reflecting on contrasting perspectives or inferring causation. It is possible that the greater effort involved in writing results in the loss of reflective content, or it could be related to discomfort that engineering students may feel with writing due to its lack of emphasis in their typical curricula (e.g., as compared to math or design-based activities; Conrad, 2017). Monrouxe (2009) suggested that audio diaries can lead to sense-making during the think-aloud process and shares examples from a participant narrative. Perhaps this connection is reflected in the differences we found between written diaries and both interviews and video diaries. We did not find other studies comparing the level of reflection elicited by different data collection methods but hope that our analysis inspires future researchers to expand on this line of inquiry. As educators, we believe that better understanding this aspect of data richness can have implications for both educational research and student learning.
Our findings have several implications for research and educational practice. First, our comparison of methods can inform the selection of methods for research studies, depending on the dimension(s) of content that are most important for a study. For example, a study seeking rich descriptions might prefer written diaries whereas a study seeking personal information may prefer interviews. Second, our study supports previous arguments that multiple methods can strengthen a study (Baker, 2023; Filep et al., 2018; Gibson et al., 2013) by specifying the unique contributions each method could make in terms of data richness. Third, we built on previous work using the LIWC to characterize data richness (Abrams et al., 2015; Flynn et al., 2018; Ogden & Cornwell, 2010) and proposed updated dimensions of depth of content based on the latest LIWC library. We additionally introduced level of reflection as another aspect of data richness, building on work by Savicki and Price (2017, 2021, 2022). These contributions to the study of data richness in qualitative research can inform future research to understand the data generated using different methods. Additionally, our study highlights the natural connection between diary methods and reflection activities used in experiential education programs. Our findings suggest that educators should consider using video diaries in these programs to enhance students’ level of reflection and encourage in-the-moment reflection, both of which have the potential to support student learning.
Limitations
Our study only considered data from one context: university students studying abroad. Other populations may respond differently to these data collection methods, so our findings may not generalize to other types of studies. For example, most participants in our studies were in the 18–24 age range, and we found anecdotally that many students in this age group prefer recording video diaries to writing diaries. However, different age groups may feel more comfortable with different methods. Our studies also only include students who chose to study abroad. These students are different from the general population of students as they are likely to be interested in global affairs, have a higher socioeconomic status, and may be more mature (McAllister-Grande & Whatley, 2020). These characteristics could make our data sets unique, even within the context of higher education. Additionally, our study is limited by the fact that we only compared data from three studies, which allowed us to reduce differences across studies and focus on comparing the data collection methods. Future research using a similar study design could explore whether our findings transfer to a broader range of research topics and contexts.
A second limitation is that there are some differences between the three studies that we are comparing. First, the reflection prompts for Study 1 were not identical to those used in Studies 2 and 3. We have previously analyzed the Study 1 data for critical incidents and identified similar categories to those found in Studies 2 and 3 (Davis, 2020), and therefore believe that the data is comparable in terms of content despite the differences in the original prompts. Another difference is that the interview protocol included additional questions beyond the CIT question and allowed the interviewer to ask follow-up questions. We considered only including responses to the CIT question in our analysis, but we felt that this would not fully capture the differences between the interview data and the other data sets. One fundamental advantage of interviews is that they provide the opportunity to ask more questions, so we decided to include all the data for an accurate comparison. A limitation with Study 3 is that it only included ten participants, though we have longitudinal data for each of them. This limited sample could be unrepresentative of study abroad students, though these students traveled to different locations and demonstrated different levels of reflection on average. Finally, although we have built on prior research and theory to select the LIWC categories used in our analysis, there are other categories that we could have chosen. We will continue to explore the use of linguistic inquiry to measure data richness and build on Savicki and Price’s (2021, 2022) suggestions for collecting evidence of validity for this method.
Footnotes
Acknowledgements
This material is based in part upon work supported by the United States National Science Foundation under Grant Number OISE-1658604. Any opinions, findings, and conclusions or recommendations expressed in this material are those of the author(s) and do not necessarily reflect the views of the United States National Science Foundation.
Ethical Considerations
Data from several studies is used in our analysis for this paper, each of which was approved by the Purdue University Institutional Review Board (IRB). • The Purdue IRB approved our interviews, which were conducted through two projects: IRB-2020-1394 (approved 12/10/2020) and IRB-2020-1557 (approved 11/19/2020). The participants provided written consent before participating in interviews. • The Purdue IRB approved the written journals in IRB-2021-81 (approved 03/16/2021). The participants provided written consent for us to use their journals for research purposes (the journals were originally collected as a class assignment). • The Purdue IRB approved the video reflections in IRB-2021-1554 (approved 11/19/2021). The participants provided written consent before completing any video reflections.
Consent to Participate
All participants in all the studies that we analyzed data from provided written consent to participate in the research study.
Consent for Publication
The consent forms for each study included the information that the data collected through the study would be used for publication. All participants signed a consent form before participation in each of the studies.
Funding
The authors disclosed receipt of the following financial support for the research, authorship, and/or publication of this article: Some of the interviews were collected as part of a study funded through the National Science Foundation (OISE-1658604). The authors received no financial support for studies through which we collected the remaining interviews, the written journals, or the video reflections.
Declaration of Conflicting Interests
The authors declared no potential conflicts of interest with respect to the research, authorship, and/or publication of this article.
Data Availability Statement
Our deidentified data could be shared with other researchers at their request and with approval from the Purdue University IRB.