
Abstract
There are many methods published about how to create non-Gaussian signals with given Power Spectral Density (PSD) and kurtosis, to use for vibration testing and/or fatigue life evaluation. However, some signals show significantly different fatigue damage characteristics, expressed as Fatigue Damage Spectrum (FDS), compared to others, highlighting the need for a proper understanding of their properties. A specific non-Gaussian signal generation method is studied in depth in this paper, where a Gaussian signal with defined PSD is multiplied with a slowly varying Amplitude Modulation Signal (AMS). This AMS is created by raising the absolute value of a Gaussian signal to a power p. A new algebraic expression for calculation of AMS parameter from given kurtosis is then presented. To investigate how kurtosis transmits from the excitation to the system response, simulations were conducted on single degree of freedom (SDOF) systems with varying AMS and system properties. A new kurtosis transfer model is then proposed and validated through vibration experiments on a cantilever beam. The results show that with a given input kurtosis, the response kurtosis can be accurately predicted from the SDOF resonance frequency divided by AMS cutoff frequency and SDOF system Q factor, which lays the foundation for fatigue life evaluation of structures under non-Gaussian excitations.
Introduction
Random vibration tests are widely used to evaluate fatigue life of structures. Using the Power Spectral Density (PSD) and Inverse Fast Fourier Transform (IFFT), Gaussian signals are generated by modern vibration controllers to simulate random excitation. In practice, however, field measured data are usually non-Gaussian,1,2 which may result in non-Gaussian response and a shorter fatigue life. 3
In recent years, there is an increasing interest in generating non-Gaussian signals with given PSD and kurtosis.4,5 The generated non-Gaussian signals can be broadly divided into two families: steady non-Gaussian with peaks and burst non-Gaussian. Commonly used methods for steady non-Gaussian signal generation include polynomial transformation, 6 filtered Poisson process, 7 phase manipulation, 8 and combination of shocks and random signals. 9 A comprehensive review can be found in. 10 For burst non-Gaussian signal generation, the most popular method is the amplitude modulation method. 11 A stationary Gaussian signal is generated and then multiplied with a slowly varying Amplitude Modulation Signal (AMS) that is independent of the Gaussian signal. The crux of this method is the modeling of AMS. The kurtosis of a signal generated using this method is governed by the kurtosis of AMS. Different methods have been proposed to model the AMS, for example, Beta distribution, 11 Gamma distribution 12 and Weibull distribution. 13 Among these methods, a wide range of kurtosis was covered by modeling the AMS with the absolute values of the standard normal distribution (called ‘absolute Gaussian method’ in this paper), 14 and only one parameter of the AMS needs to be iterated to reach target kurtosis value. The problem with current amplitude modulation methods is that the parameters of the AMS have not been linked to the target kurtosis of the generated burst non-Gaussian signal such that an efficient control of kurtosis can be realized, that is, the mathematical relationship between target kurtosis and the parameters of AMS has not been treated in much details.
Ideally, an accelerated fatigue test can be conducted using the generated non-Gaussian signals as excitations. However, the kurtosis transmission from excitation to structural response remains a key issue that needs to be addressed. By decomposing the burst non-Gaussian excitation signal by 3.2 times the half-power bandwidth at the damped natural frequency of the structure, a linear model for the transmission of kurtosis values between the decomposed signal of the excitation and the structural response is established in Lei et al. 15 Braccesi et al. 16 used four different PSDs with increasing bandwidth to show that the bandwidth of the input burst non-Gaussian signal does not significantly affect the kurtosis of structural response. Using higher-order spectra (HOS), Trap 17 showed that the non-Gaussianity due to non-stationarity is fully transferred to the response and is independent of the bandwidth of ideal bandpass filters. Kihm et al. 18 used a ‘kurtosis rate’ to describe the input-output kurtosis relationship in the case of burst non-Gaussian excitation with the aid of numerical simulations. The ‘kurtosis rate’ was shown to be related to the time required for the Single Degree of Freedom (SDOF) system IRF to decrease to some fraction of its initial amplitude, and the period of the bursts. The kurtosis of the output signal varies between 3.0 and the kurtosis of the input signal. By weighting and synthesizing the frequency response characteristics and the PSD components of the excitation, Lei et al. 19 established a kurtosis transmission prediction model under complex vibration conditions. Although an analytical expression was derived, the effects of key parameters such as the cutoff frequency of the non-Gaussian excitation and the system quality factor were not considered. Ren et al. 20 developed a modified time-domain randomization method for generating and controlling non-stationary non-Gaussian vibration signals in multi-shaker systems, incorporating amplitude modulation to regulate time-varying RMS characteristics. Although the transmission law of kurtosis has been studied by some researchers, problems remain unsolved. The explicit relationship between the kurtosis of the system response and the characteristics of system and AMS needs to be further developed.
To solve the aforementioned problems, the absolute Gaussian method is firstly studied in depth, giving algebraic expressions for calculation of AMS parameter from given kurtosis of burst non-Gaussian signal. A mathematical model is then proposed to quantify how kurtosis transmits from the excitation to the SDOF system response, incorporating the effects of AMS cut-off frequency and system Q factor. Experimental validation is conducted to verify the proposed model.
The remainder of this paper is organized as follows. In Section 2, the absolute Gaussian method is reviewed and a new algebraic expression for calculation of AMS parameter from given kurtosis is presented. In Section 3, the response of SDOF is computed using digital filters, and the effects of the cut-off frequency of AMS (U cut ) and Q factor on kurtosis transmission are analyzed. In Section 4, a new kurtosis transfer model is presented. In Section 5, a cantilever beam is used for experimental validation of the proposed model. Finally, the results and discussion are presented in Section 6.
Theoretical background
The n-th central moment M
n
of a random signal x(t) is defined as
For a Gaussian signal, the kurtosis is equal to 3. For signals with kurtosis larger than 3, the probability for high amplitudes is larger than for a Gaussian signal with the same Root Mean Square (RMS) value. The Probability Density Function (PDF) of signals with different kurtosis but same RMS value of 6 m/s2 is shown in Figure 1. From Figure 1 we can see that a higher kurtosis value leads to a wider tail. A wider tail means that the probability of large peak values is bigger, which leads to larger fatigue damage and quicker fail.
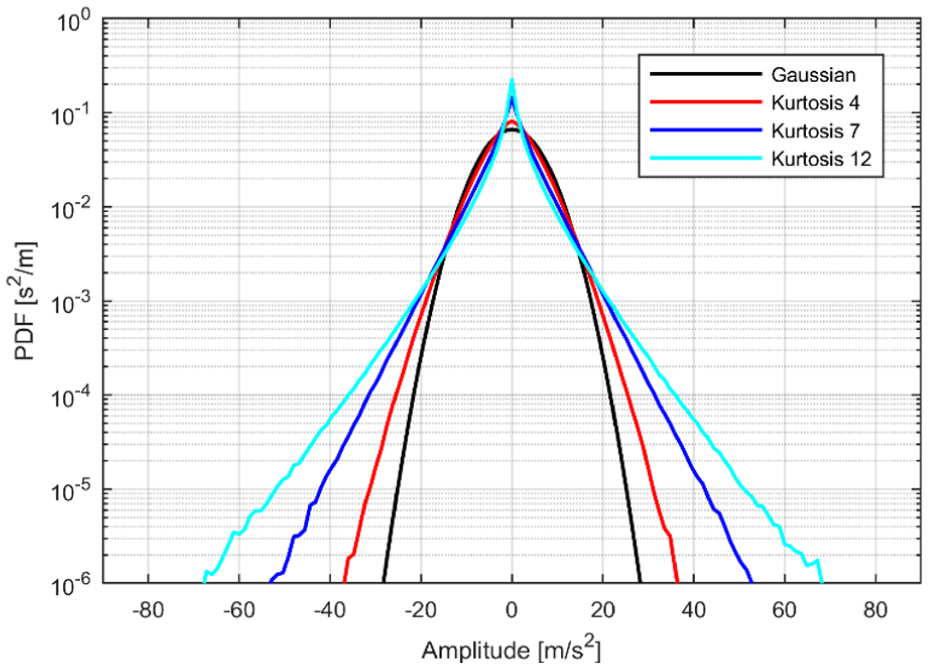
PDF for signals with the same RMS but different kurtosis values.
To generate a non-Gaussian signal y(t), a Gaussian signal G(t) with a given PSD is firstly created and then multiplied by a slowly varying amplitude modulation signal u(t):

Here, u(t) is defined as the absolute value of a Gaussian signal g(t), which is generated to have a cutoff frequency Ucut, raised to a power p. 15

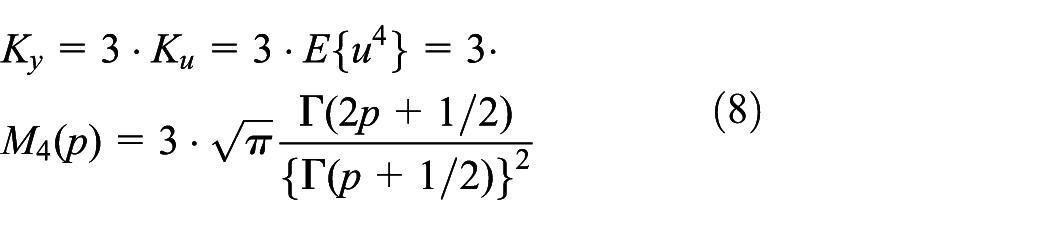
Since the Gaussian signal G(t) has a mean value of zero, the non-Gaussian signal y(t) also has a mean value of zero. G(t) and u(t) are independent, the kurtosis K y for y(t) is:
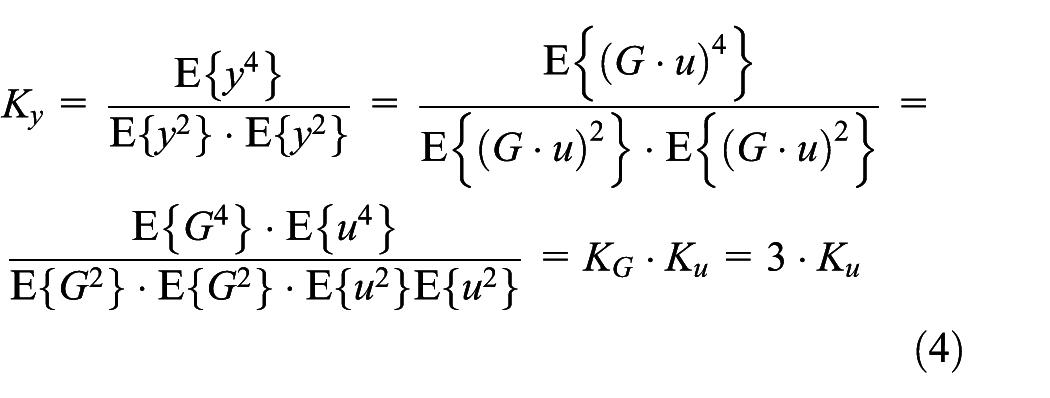
It has to be noted that the mean of u(t) is not zero, so K u is called ‘kurtosis with mean’.
In order not to change the PSD of G(t), u(t) is normalized to have a mean square value of one. Equation (4) can be simplified as:

To get a target kurtosis K y , the only thing needed is the fourth moment of u(t), E{u4}.
Using the following equation 21

A general formula for the m-th moment of u(t) as function of m and p is:
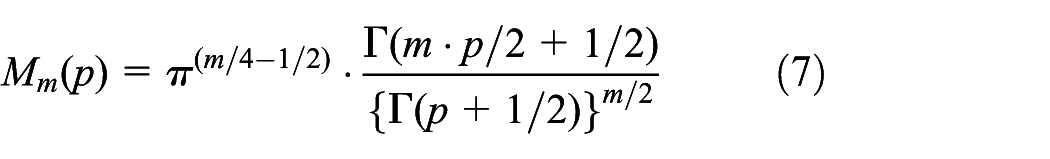
where
When m = 4, equation (5) can be presented as:
A check of the validity of equation (8) is given in Figure 2. The fourth moment of u(t) is calculated as function of p using equation (8) and compared with a simulation of E{u4} based on equation (3). As we can see from Figure 2, a good agreement is achieved.
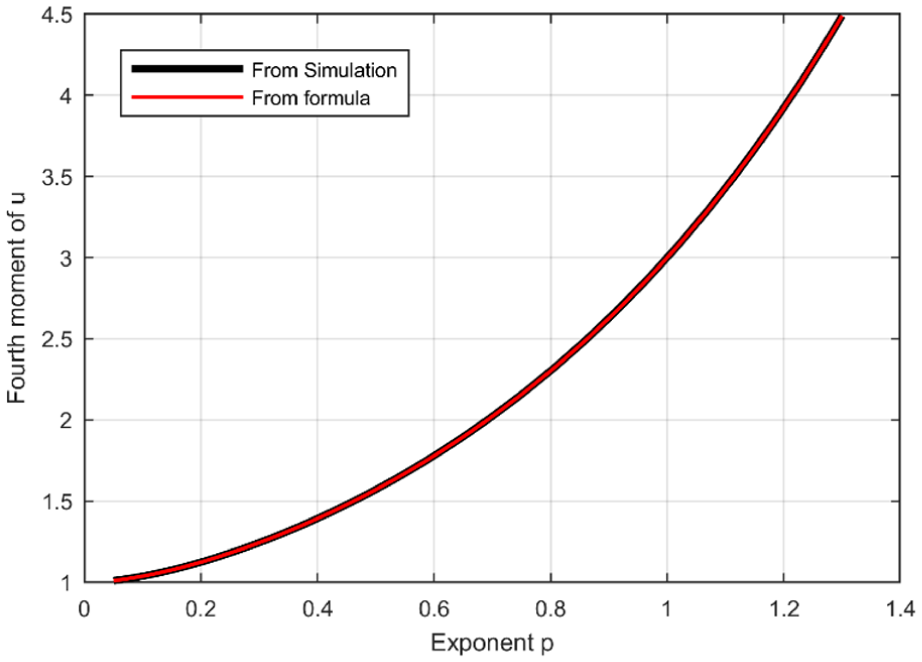
The fourth moment of the AMS u(t).
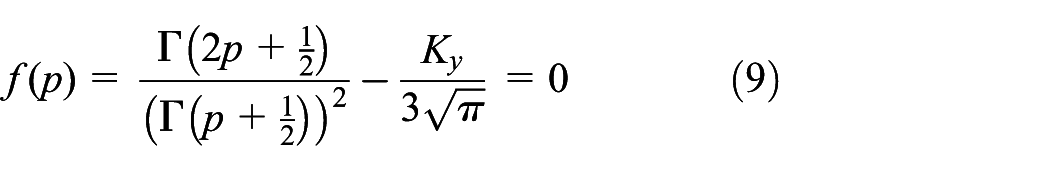
From equation (8), given a target kurtosis K y , the parameter p can be obtained by solving the following nonlinear equation:
With the calculated p, the AMS can be created using equation (3) and the non-Gaussian signal can be generated using equation (2).
A case study is presented here to demonstrate the aforementioned process. The vibration test specification NAVMAT profile, which refers to the U.S. Navy standard NAVMAT P-9492 random vibration test specification, is used as the reference PSD, 22 as shown in Figure 3.
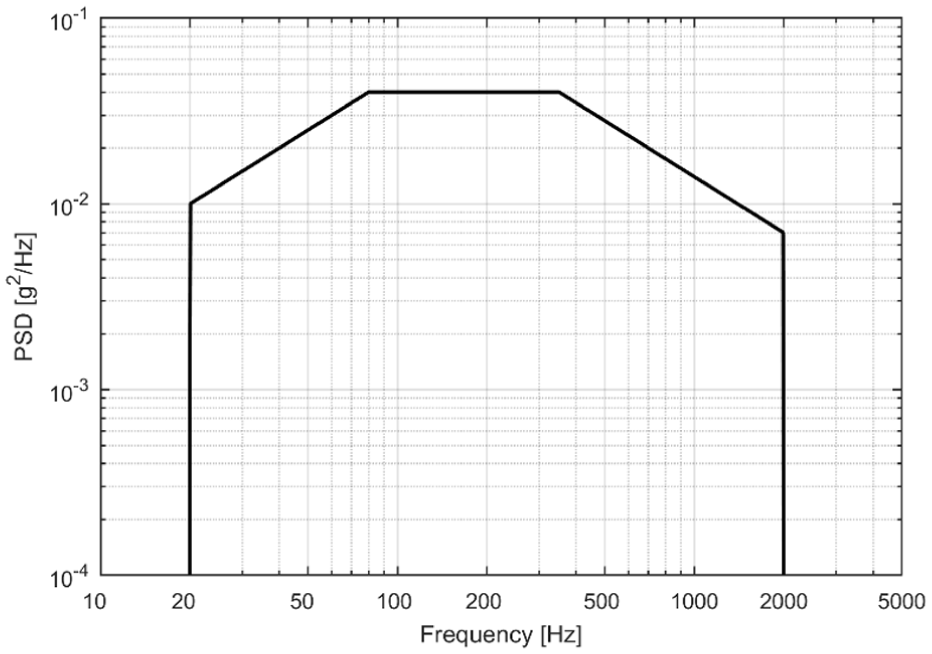
PSD for the NAVMAT profile used for simulations. RMS = 6.06 g.
The target kurtosis is set from 3.25 to 12 in steps of 0.25. The cut-off frequency Ucut for the AMS is set to 5 Hz. With a low Ucut, the synthesis of the low frequent Gaussian g(t) has a rather big random variation, so the function contains an iteration to fit the required tolerance. A good match is shown in Figure 4.
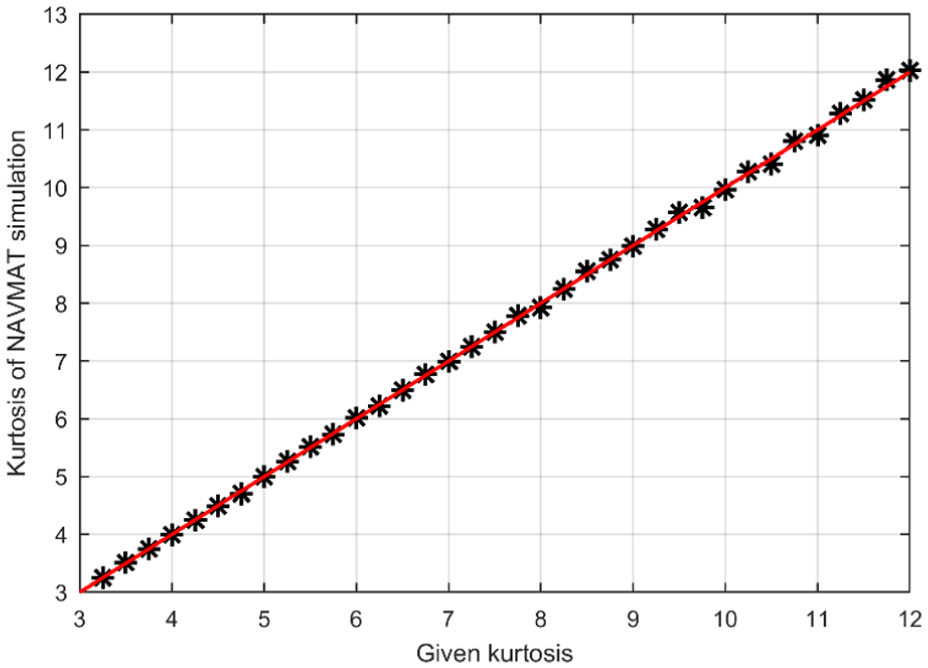
Kurtosis for simulated time signal is shown as a function of given kurtosis.
Influence of Ucut and Q-factor on kurtosis transmission
Damage potential of non-Gaussian signals is usually evaluated by Fatigue Damage Spectrum (FDS), which is based on fatigue calculated on responses of a series of SDOF systems, using cycle count, Miner’s rule and Wohler exponent coefficient. The damage is related to the response kurtosis, and how input signal kurtosis is transmitted to the response kurtosis is called kurtosis transmission. To study kurtosis transmission, a non-Gaussian signal with NAVMAT PSD, kurtosis 8 and Ucut 1 Hz is loaded to a SDOF system shown in Figure 5.
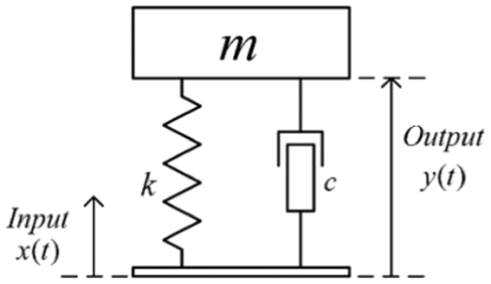
Linear SDOF system.
The pseudo velocity transfer function of the SDOF system can be expressed as 23 :
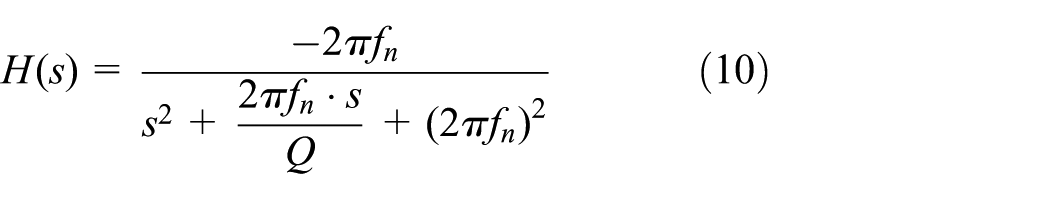
Where,
The pseudo velocity response of the SDOF system is calculated by the ramp invariant digital filter method. The response kurtosis of a series of SDOF systems are calculated and shown in Figure 6. From Figure 6 we can see that the response kurtosis is close to the input kurtosis of 8 for all
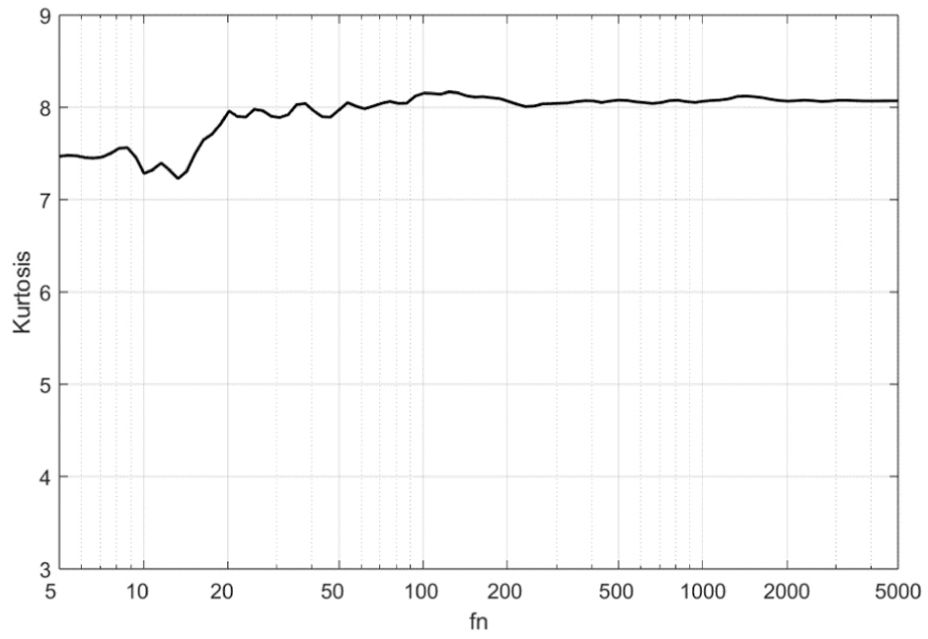
Kurtosis for SDOF filter responses for non-Gaussian signal with kurtosis 8 and U cut 1 Hz.
If the same test is done for kurtosis 8 but Ucut 40 Hz, the result is quite different, as shown in Figure 7.
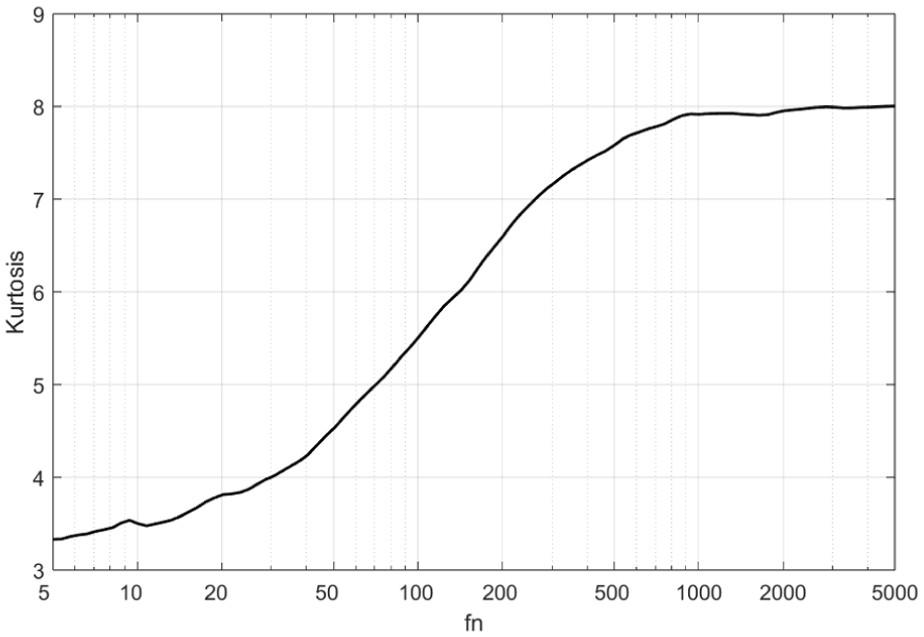
Kurtosis for SDOF filter responses for non-Gaussian signal with kurtosis 8 and Ucut 40 Hz.
From Figure 7 we can see that the response kurtosis changes from about 3 to 8 over the range of used
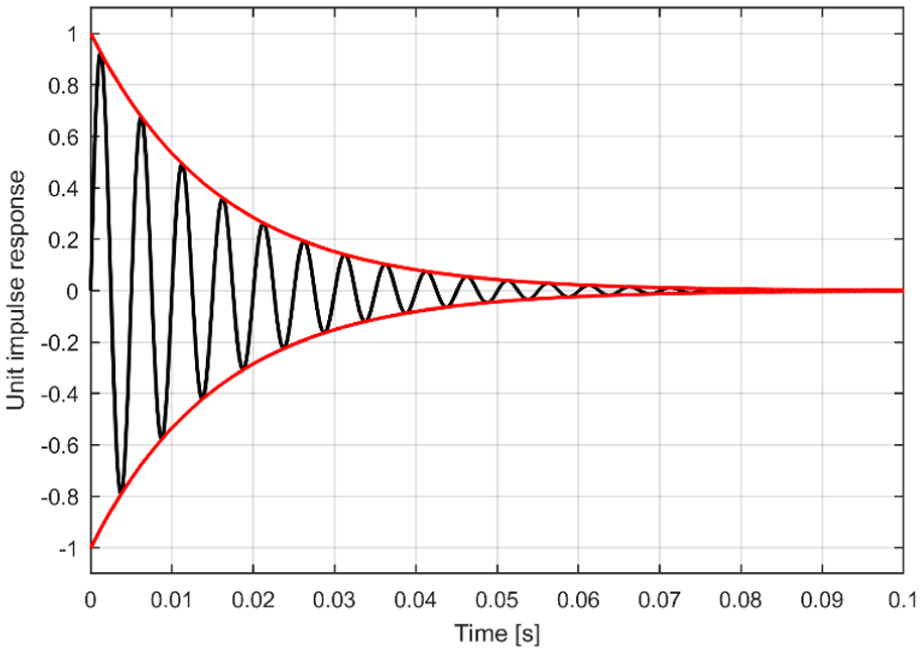
IRF and envelope for SDOF 200 Hz, Q = 10, pseudo velocity.
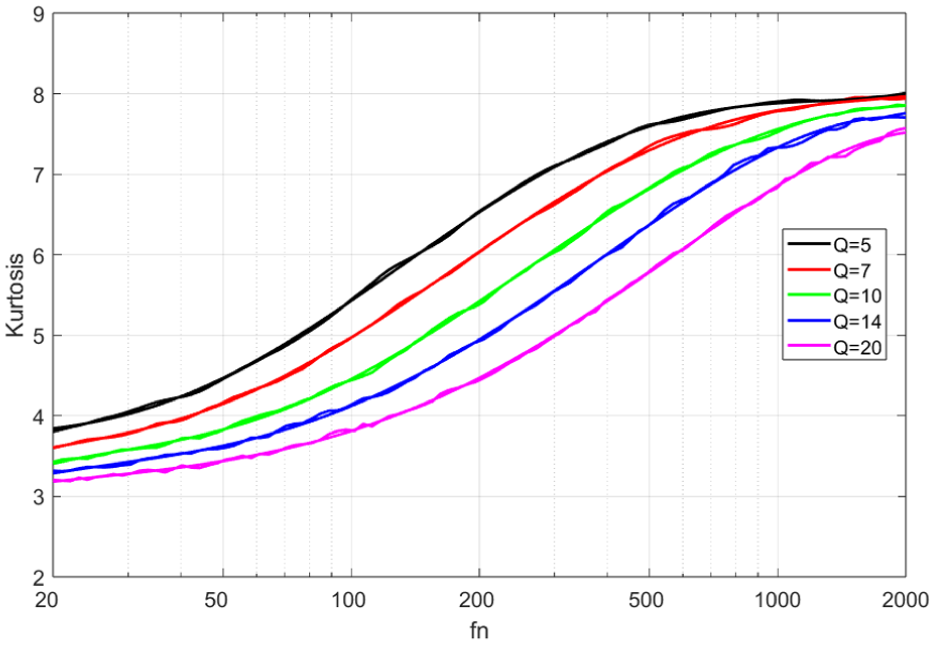
SDOF response kurtosis for different Q values.
As the length of SDOF IRF is depending on
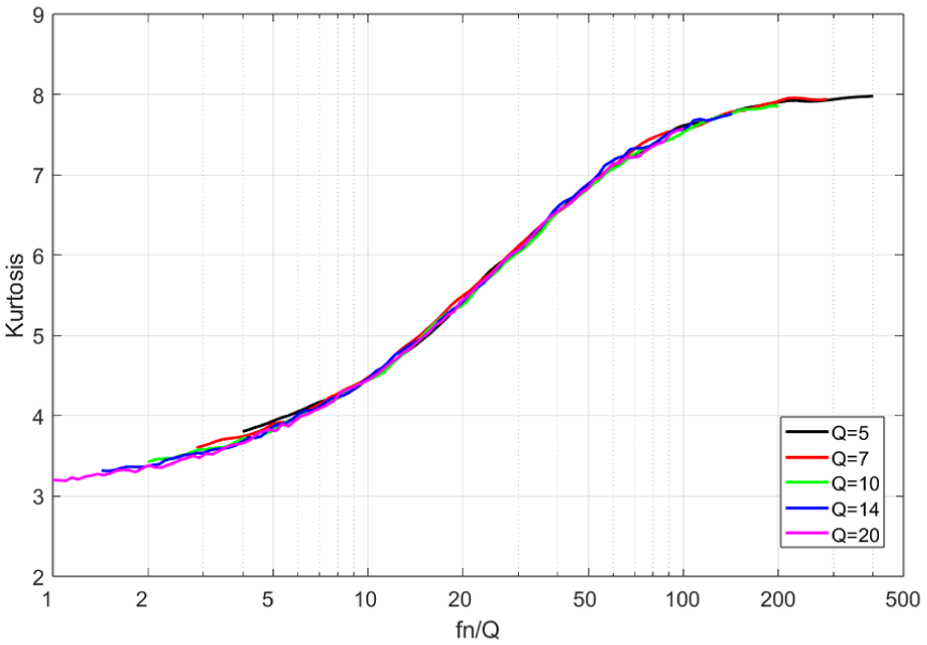
SDOF response kurtosis for different Q values against
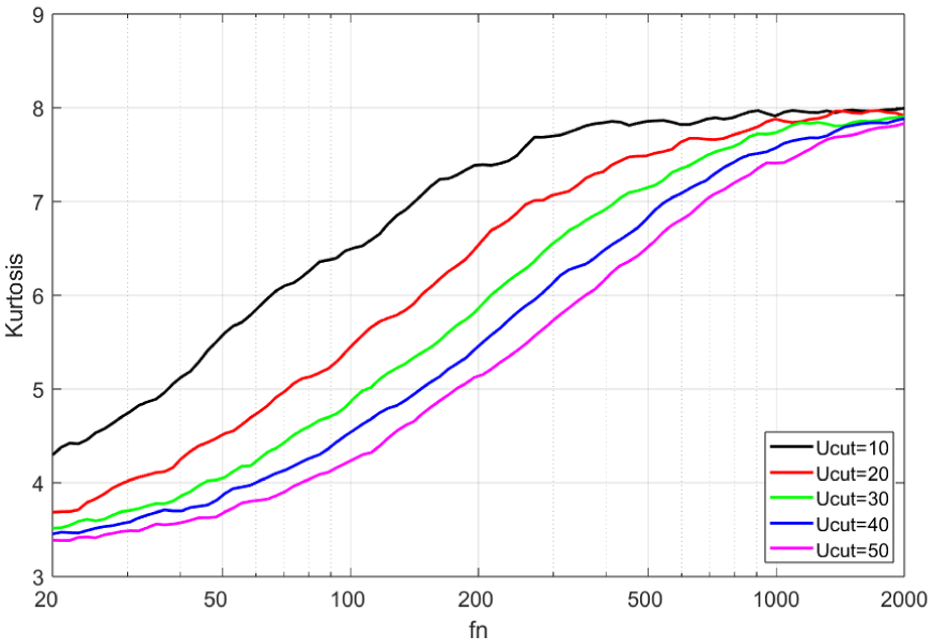
SDOF response kurtosis for different Ucut values.
As 1/Ucut determines some correlation time length for the signal, a new plot is made with
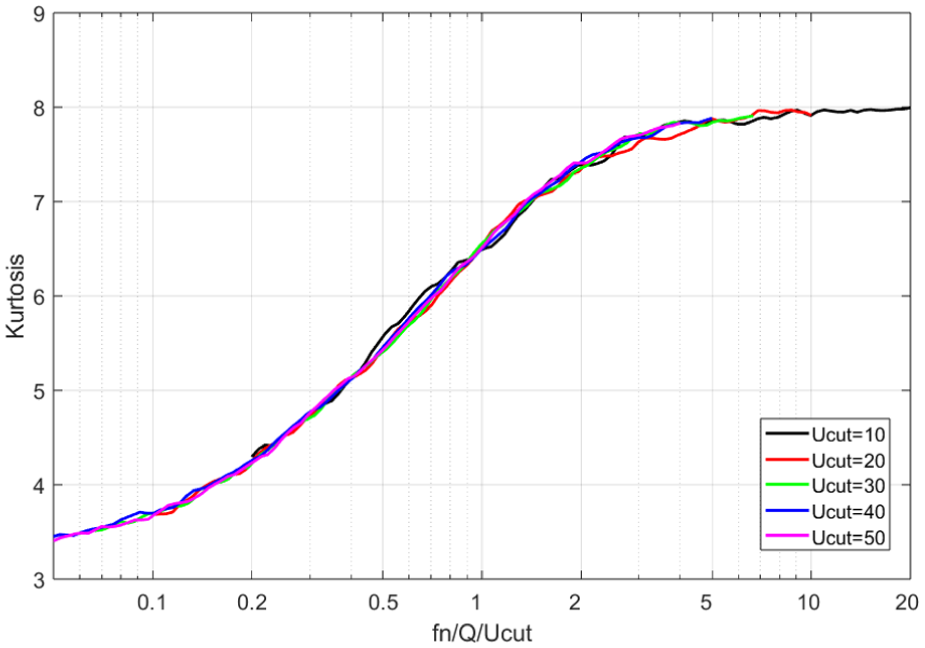
SDOF response kurtosis for different Ucut values against
A new kurtosis transmission law
A simulation is made with 64 combinations of input kurtosis
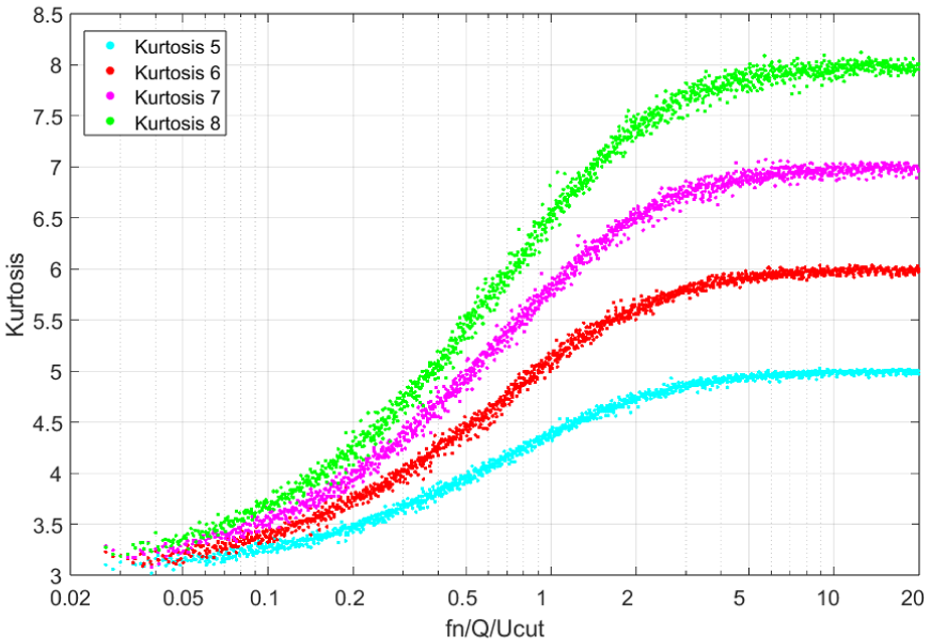
SDOF response kurtosis for 64 combinations simulations.
By assuming that there is a function Φ independent of input kurtosis, an algebraic expression for the response kurtosis is given by the equation
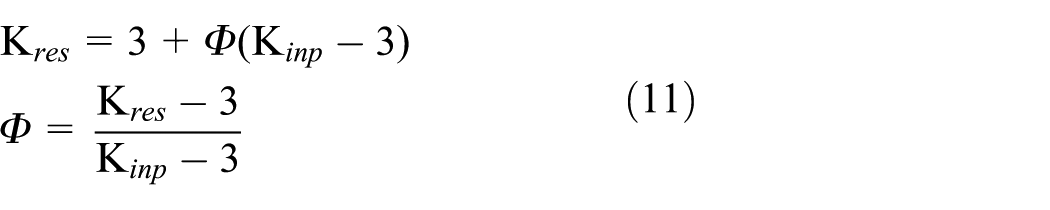
That is validated in Figure 14, where the result from all 64 simulations is recalculated to function Φ.
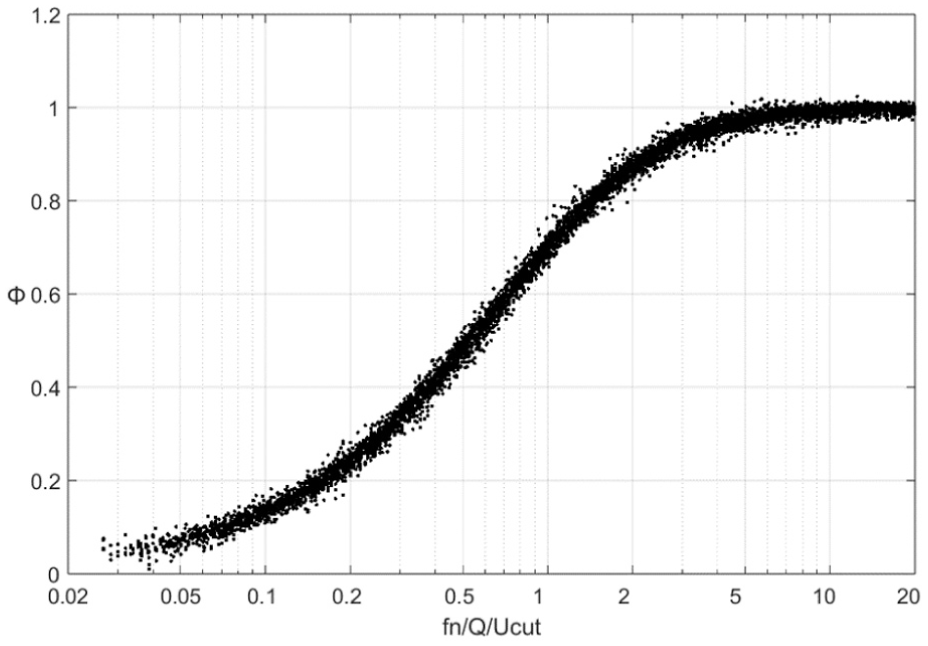
Function Φ.
A simple least curve fit to the function Φ in Figure 14 is made:
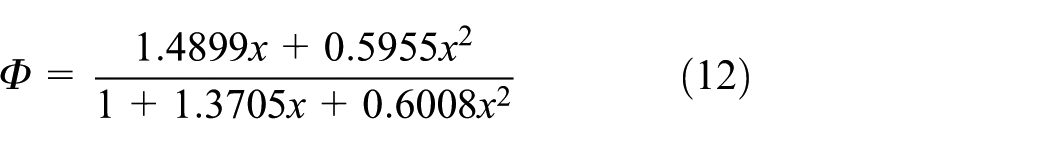
Where,

The fit is added to Figure 14 giving Figure 15 and to Figure 13 to give Figure 16.
Function Φ and added curve fit.
Comparison of SDOF response kurtosis between 64 simulations and new kurtosis transmission law.
With the fit given by equation (11), the estimated SDOF response kurtosis may be found as a function of input kurtosis and Ucut, defining the non-Gaussian signal,
To verify whether AMS statistics influence kurtosis shape, we simulated four signals with kurtosis 9 for comparison with a commercial signal (Ho 1 in Figure 17) showing measured kurtosis 9.06, whose generation method remains unknown, but there is a ‘transition frequency’ parameter set to 10 Hz. Three distinct AMS signals were used in simulation: a simple low-pass Gaussian signal multiplied by a NAVMAT Gaussian signal (Gauss*Gauss in Figure 17) yielding simulated kurtosis 9.03. The second AMS had Weibull distribution (Weibull in Figure 17), total signal kurtosis 9.03 and the third signal was synthesized from equation (9) (psdkurtsyntag in Figure 17), kurtosis 9.04. All those three had a nominal Ucut set to 10 Hz. Figure 17 displays the PSDs of these four signals.
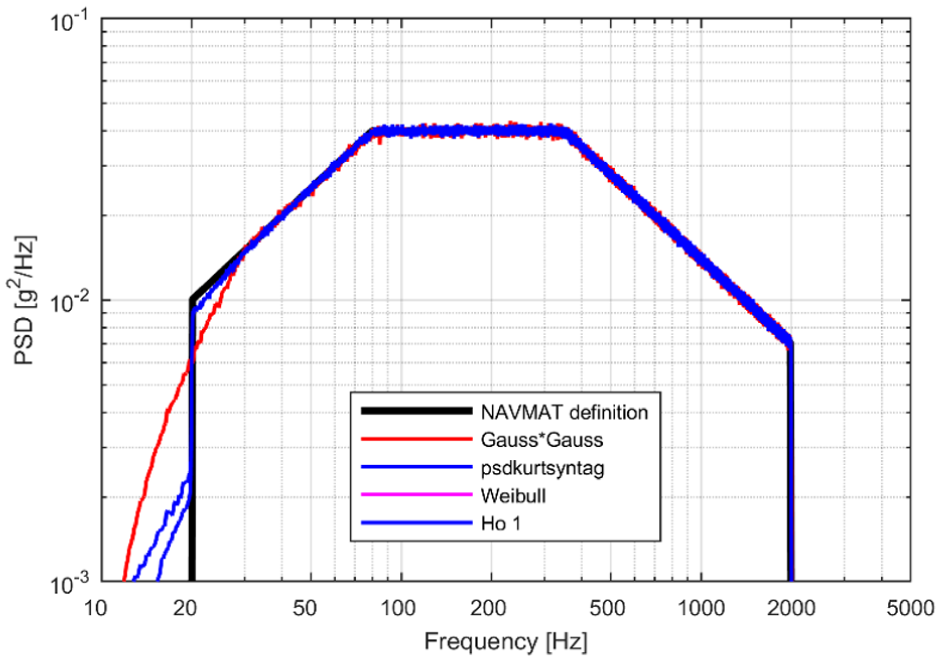
PSD for four different high kurtosis simulations and nominal low frequency cut-off for AMS.
SDOF systems response kurtosis for the four simulations is calculated as before. The plot of kurtosis, Figure 18 is against
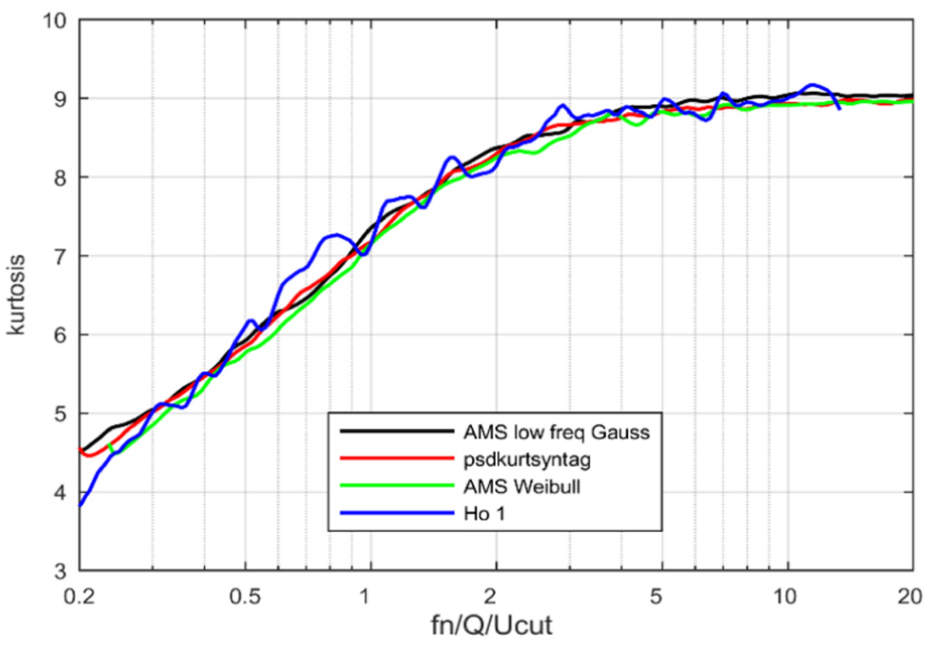
SDOF response kurtosis for four different simulations.
The result of the simulation is that the statistics of the AMS signal has small, if any, effect on the kurtosis curve shape.
It should be noted that although the application scope of the proposed kurtosis transfer model is restricted to linear SDOF systems, one particular useful application is the easy calculation of FDS, which makes the fatigue life evaluation of structures much simpler.
Experimental verification
To validate the proposed kurtosis transmission model, experimental verification was performed on a cantilever beam. The test setup is shown in Figure 19. The cantilever beam was excited by a vibration shaker. An accelerometer (PCB 356A15) at the base served as the input end and was connected to channel 0, while an accelerometer (PCB 352C33) at the free end served as the response end and was connected to channel 2. The excitation signal was monitored via a T-connector and recorded on channel 1. All signals were acquired using a National Instruments 9234 data acquisition device, and a host computer was employed for data storage. The sampling frequency is 2048 Hz, and the signal length is 2 22 samples.
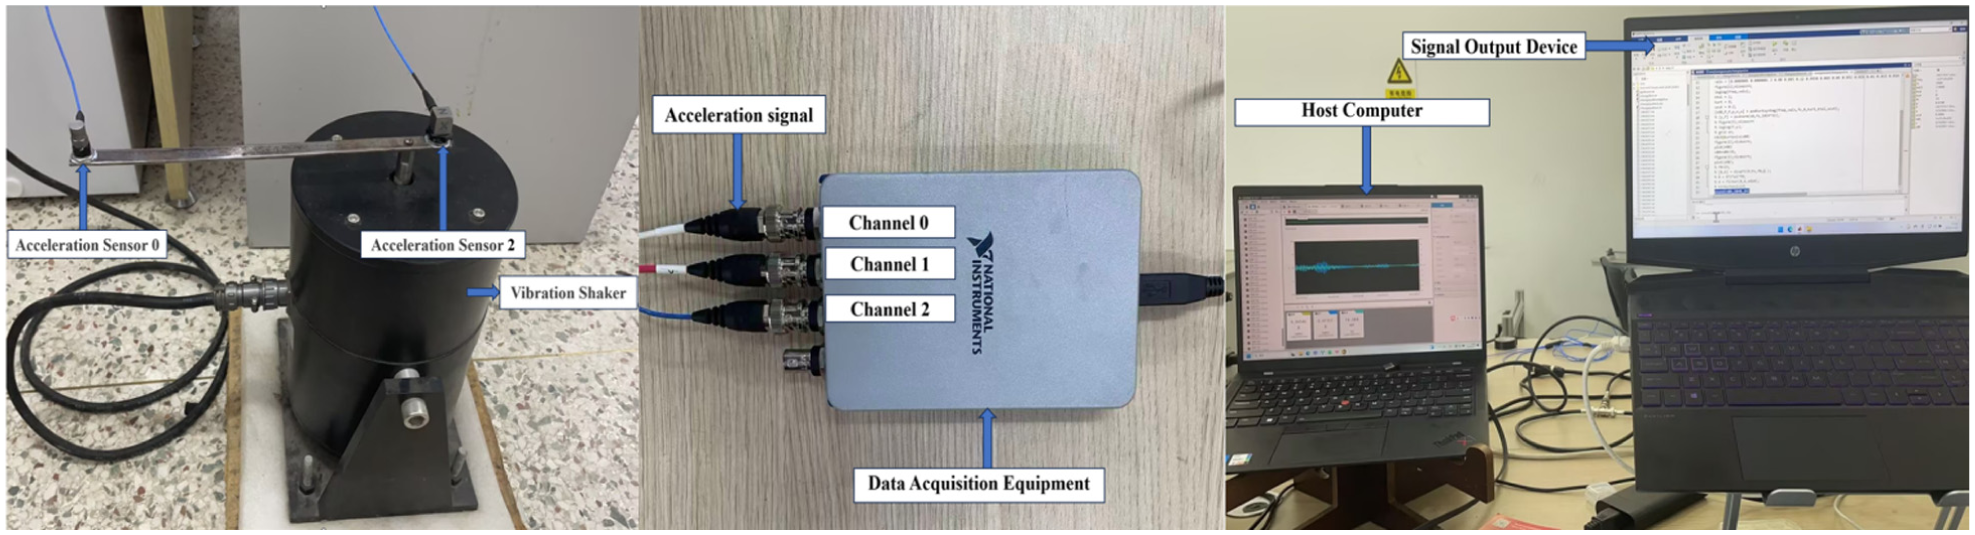
Experimental test setup.
The experimentally measured natural frequency is 23.125 Hz, as shown in Figure 20.
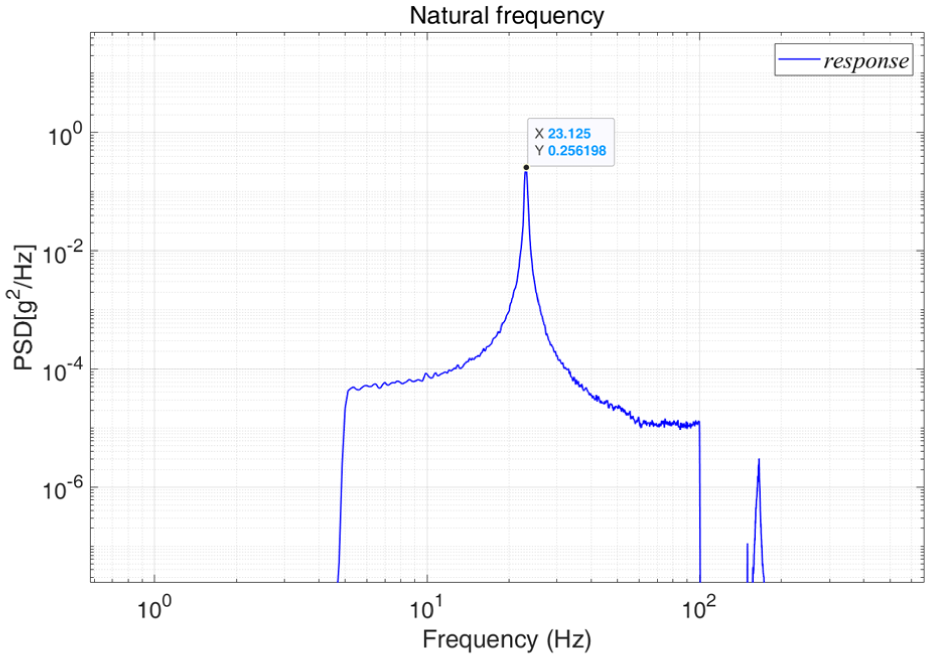
Measured response PSD.
Due to the nature of the vibration shaker system, the actual excitation reaching the beam becomes distorted, as shown in Figure 21. To ensure that the excitation PSD applied to the cantilever beam is flat around its resonance frequency, the input PSD was compensated for the frequency-dependent transfer characteristics of the shaker–fixture–beam system. This compensation was achieved by measuring the transfer function between the input signal and the beam response and iteratively adjusting the input PSD until the desired flat response around resonance was obtained. The PSD modification is shown in Figure 22.
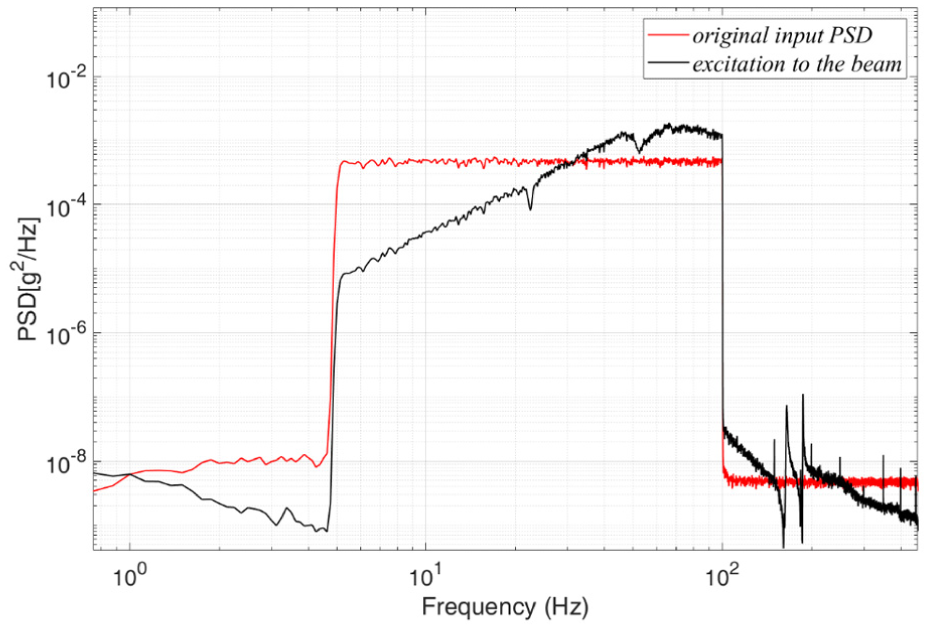
Original input PSD and excitation to the beam.
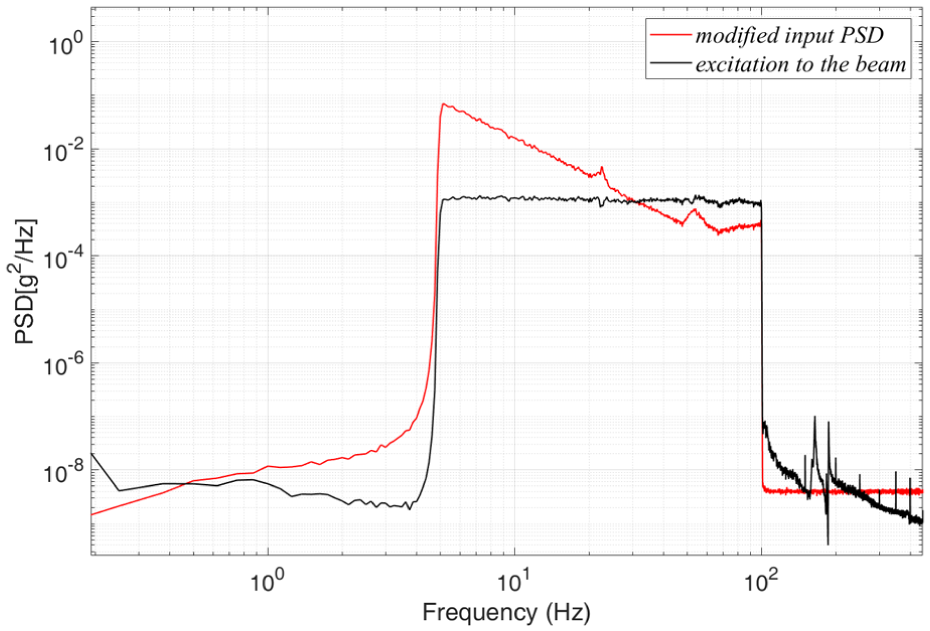
Modified input PSD and excitation to the beam.
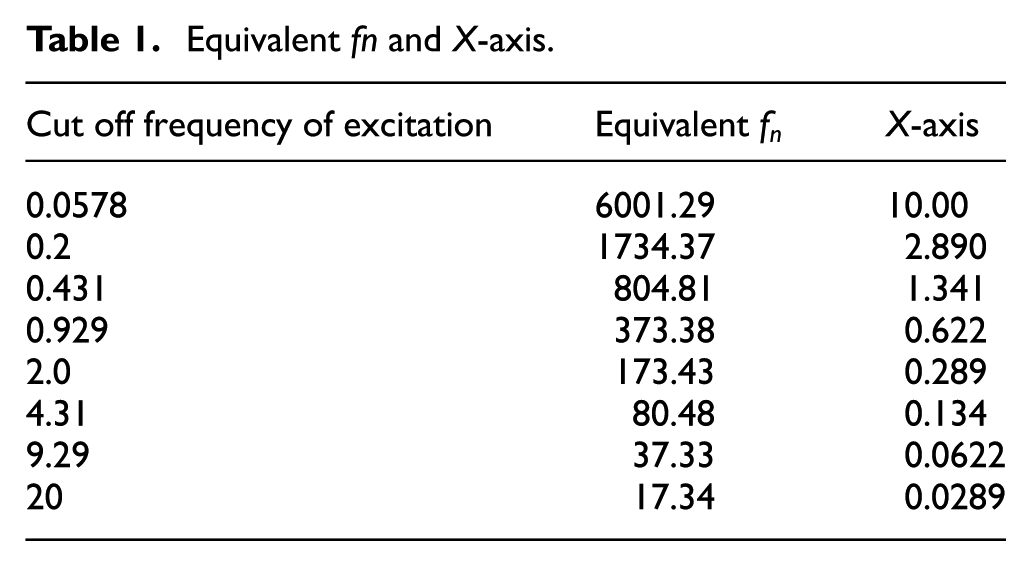
Theoretically, to validate the kurtosis transmission law, multiple cantilever beams with different natural frequencies are needed. In this paper, however, by adjusting the cutoff frequency of the non-Gaussian excitation, only one beam is needed. The equivalent
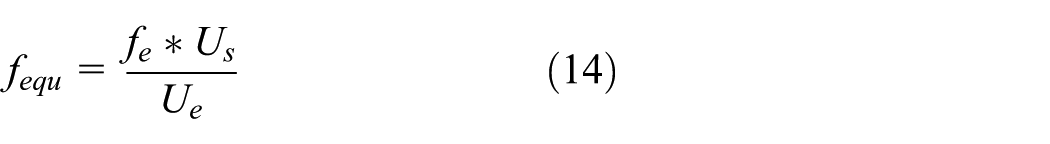
where:
The response kurtosis is calculated against (equivalent
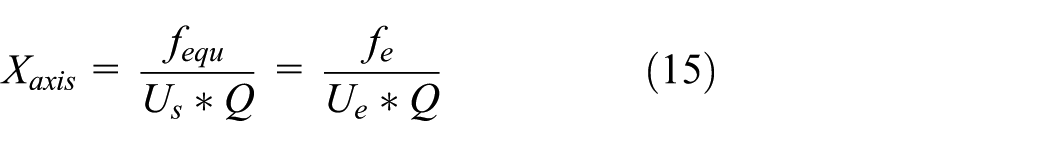
Experiments were conducted for eight different
Equivalent
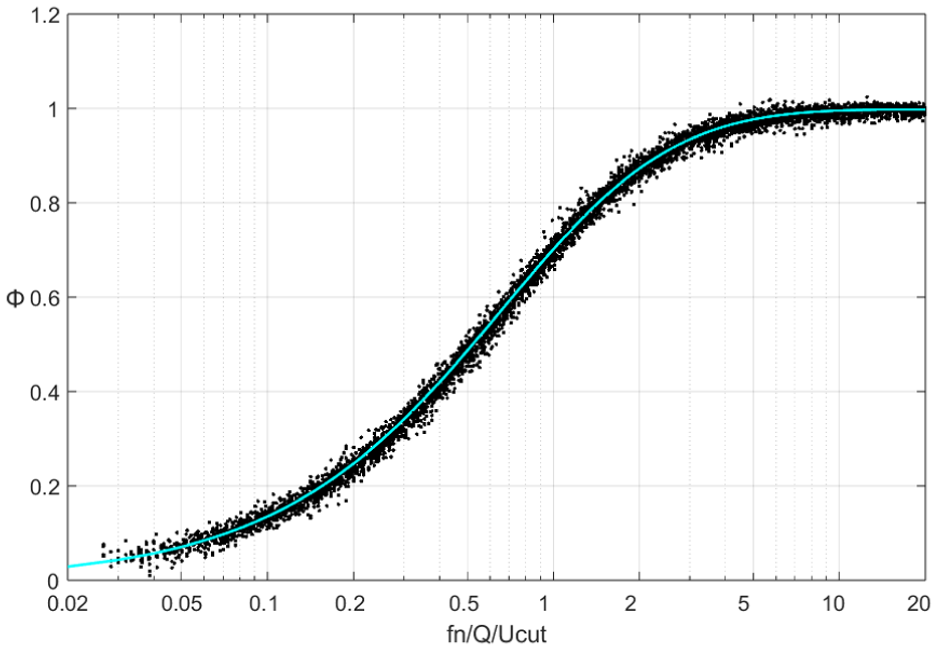
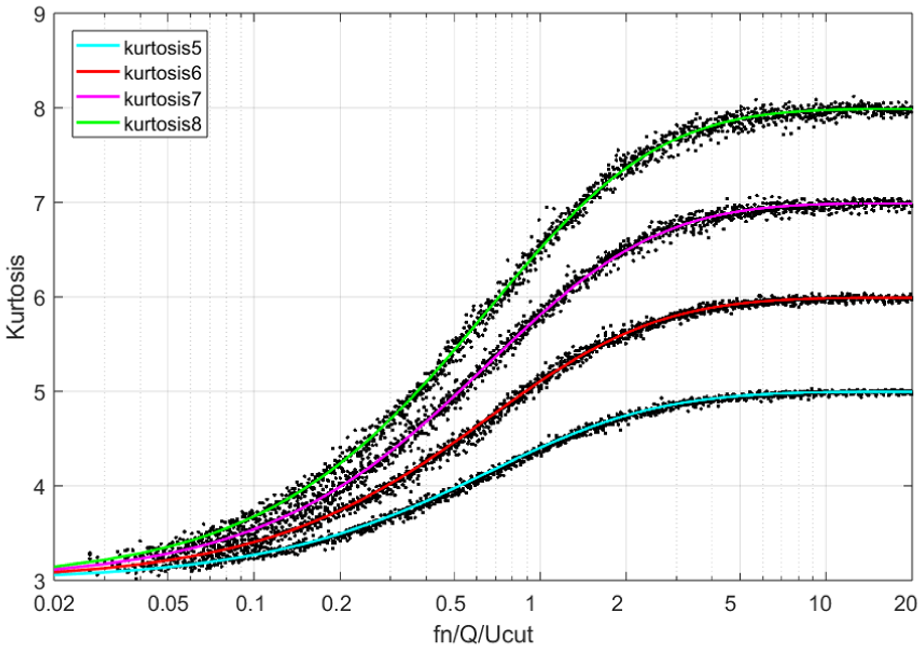
By setting the kurtosis of excitation signals to 6, 7 and 8, a total of 24 measurements were made. The results are shown in Figure 23.
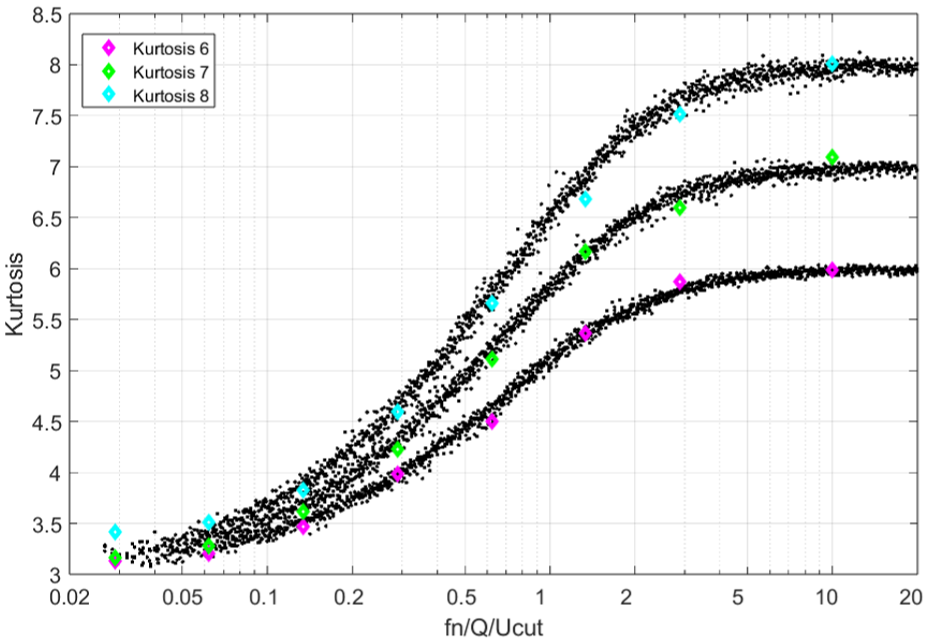
A comparison between kurtosis from many simulations and kurtosis from experiments.
Figure 23 demonstrates excellent agreement between simulations and experimental results, confirming the validity of the proposed new kurtosis transmission law.
To quantitatively evaluate the accuracy of the proposed kurtosis transfer model, the mean absolute error (MAE) and the root mean square error (RMSE) between the simulated kurtosis values and the experimental measurements was calculated:
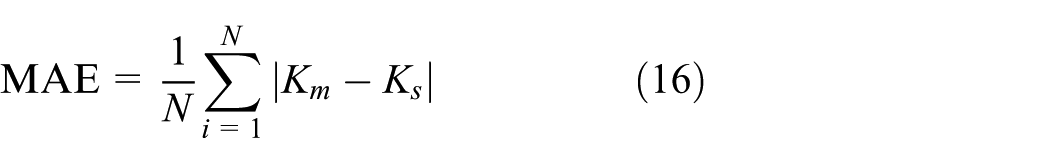

where
MAE and RMSE.

These small errors indicate a good match between the predicted and measured kurtosis, showing the high accuracy and reliability of the proposed kurtosis transfer model under non-Gaussian excitation.
It should be noted that the experimental results are obtained based on a single cantilever beam specimen. The validation of the proposed conclusions using multiple cantilever beams with different physical natural frequencies remains an important topic for future investigation.
Results and discussion
In this work, a specific non-Gaussian signal generation method is studied, where a Gaussian signal with defined PSD is multiplied with a slowly varying AMS. This AMS is created by raising the absolute value of a Gaussian signal to a power p. A new algebraic expression for calculation of AMS parameter from given kurtosis is then presented, which is capable of efficiently and accurately generating specified non-Gaussian signals, enabling precise and efficient kurtosis control of specified non-Gaussian signals.
Since non-stationary non-Gaussian signals induce bigger fatigue damage, accurate prediction of structural response kurtosis under non-Gaussian random excitation is particularly crucial for fatigue life calculation. Based on the response characteristics of SDOF systems, this study investigated the effects of the AMS cutoff frequency and Q-factor on kurtosis transmission, thereby establishing a new kurtosis transmission law that links the response kurtosis to both excitation and structural parameters. A novel kurtosis transmission model was proposed, which quantitatively relates the response kurtosis to the input kurtosis, AMS cutoff frequency and system Q-factor. Experimental verification on a cantilever beam confirmed the model’s effectiveness, showing that predicted response kurtosis agrees well with measured results.
In conclusion, the proposed approach provides a clear and practical framework for predicting structural response kurtosis under non-Gaussian excitation, which lays a foundation for vibration fatigue life evaluation under non-Gaussian random excitation.
Footnotes
Acknowledgements
This study was supported by The National Natural Science Foundation of China (Grant # 52102443).
Handling Editor: Aarthy Esakkiappan
Ethical considerations
Not applicable.
Author contributions
Writing—original draft: Fei Xu, Kjell Ahlin, Wenjia Wang, supervision, funding acquisition: Fei Xu, Methodology: Fei Xu, Kjell Ahlin, Simulation: Fei Xu, Wenjia Wang, Validation: Fei Xu, Kjell Ahlin, Writing—review and editing: Fei Xu, Kjell Ahlin, Wenjia Wang. All authors reviewed the results and approved the final version of the manuscript.
Funding
The authors disclosed receipt of the following financial support for the research, authorship, and/or publication of this article: This study was funded by The National Natural Science Foundation of China (Grant # 52102443).
Declaration of conflicting interests
The authors declared no potential conflicts of interest with respect to the research, authorship, and/or publication of this article.
Data availability statement
The data used to support the findings of this study are available from the corresponding author upon request.