
Abstract
It is challenging and important to establish reliability model for mechanical systems with multiple functional performances. This article develops a model of competing failure for mechanical systems under catastrophic failure due to external shocks and multi-functional failures. Shock model is used to analyze the catastrophic failure. Functional failures are demonstrated by functional indicators which are functions of specific variables including constant variables and degradation variables. Functional failure occurs if the functional indicators are beyond a limit δ. Brownian motion with non-linear drift is used to model the process of degradation variables. Besides, there are two kinds of dependence around these failure modes. The dependence of catastrophic failure and functional failure, due to shared external shock source, is illustrated by the instantaneous increments during degradation process; the dependence between multiple functional performances themselves is modeled by copula functions. Reliability of systems is calculated based on this model. A mechanical lock system is chosen as a case to verify the validity and practicability. This model can also be applied for other mechanical systems.
Keywords
Introduction
Mechanical products are under multiple failure modes including fracture, wear, corrosion, and so on. These failures are competing with each other, which means once one kind of failure occurs, the product is invalid and other failure modes have no change to happen anymore. Generally, they are defined as dependent competing failure processes (DCFPs). Precisely, failure processes are classified into catastrophic failures (also called hard failures) and degradation failure process (also called soft failures). Hard failures are usually modeled by random shock process while soft failures are modeled by degradation process model. In the literature, models for systems with catastrophic failures and degradation failures are called degradation-threshold-shock (DTS) models. In practice, many DCFPs are implemented by DTS models.
Motivation
Current DTS models are used for dispersive units of mechanism products or systems with DCFPs. Specifically, for one-unit systems subjected to external shocks and degradation process, the one unit is analyzed by DTS models and system state is obtained naturally. For multi-unit systems, each unit is analyzed by DTS model and system state is determined by unit states and system structure such as series system and parallel system. However, systems have their functional performance, which is an important property of specific products. If the functional performance cannot meet the requirements, products are also regarded as disabled. In other words, the failure of functional performance failure needs also to be considered while current DTS models ignored it. Some practice examples are listed here to demonstrate this viewpoint.
Example 1: gear transmission system
Gear pair is a typical mechanical system whose function is to transmit load and transfer rotation displacement. Unexpected vibration and external impact will bring about oversize load on gear teeth, leading to catastrophic failure of a gear. Besides, teeth surface wears during working process leading to degradation failure if wear exceeds pre-established threshold. Typical DTS models the catastrophic failure and degradation failure. It is easy to understand the catastrophic failure in DTS, but there are some doubts for the degradation failure. First, why the wearing of teeth surface need to be the focus although the teeth do not crack? Second, how to make sure the pre-established threshold? The answers of above doubts are about the functional performance of gears. Wearing of teeth surface may lead to inaccuracy rotation transfer as shown in Figure 1. The pre-established threshold is also to prevent inaccuracy rotation transfer (unqualified performance). Thus, the critical point is the functional performance instead of the degradation process (gear wearing out) itself. More exactly, gear pair is subjected to two failure modes, the catastrophic failure due to oversized load and the functional performance failure due to undesirable performance (such as inaccuracy rotation). These two failure modes are competing with each other, which means the occurrence of any failure mode will cause failure.
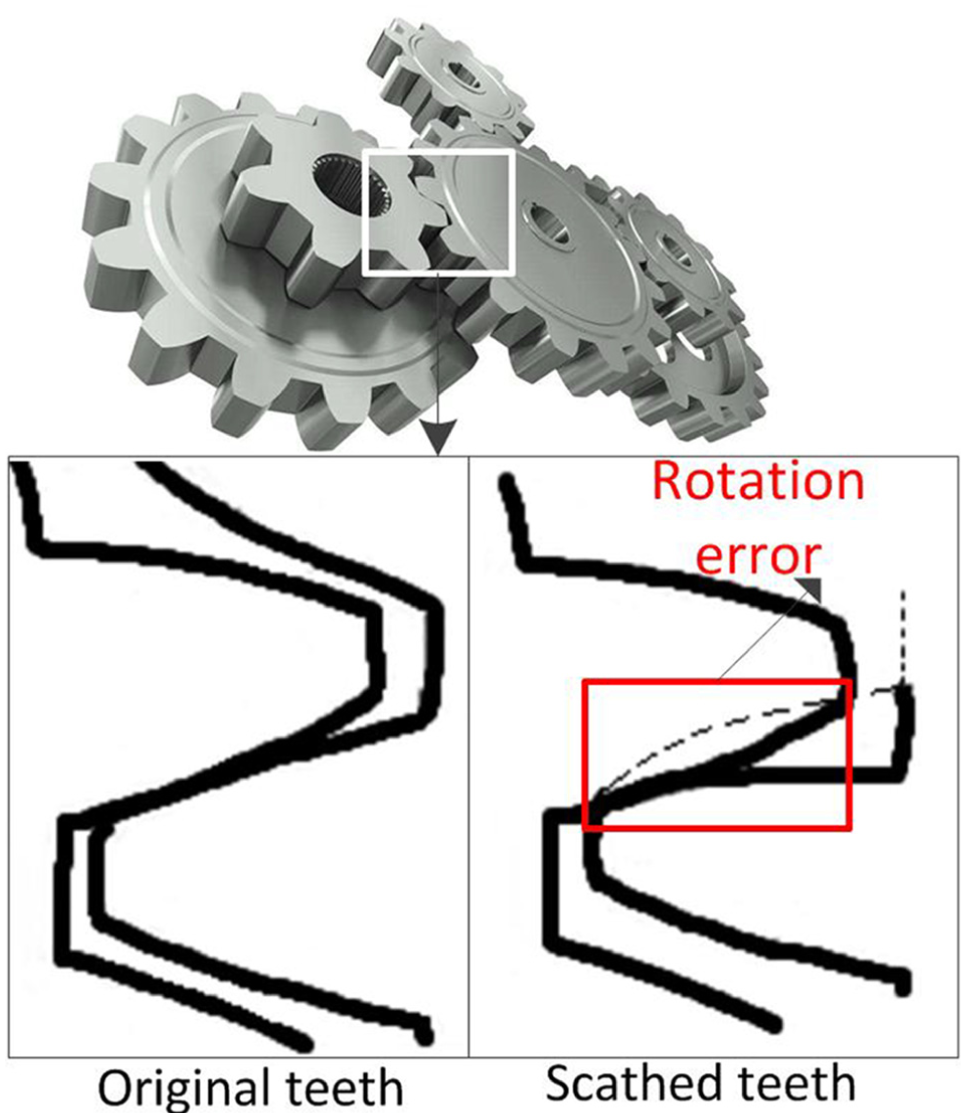
Functional failure of gear.
Example 2: crank train system
Crank train system is used in engines commonly whose function is transforming the reciprocation motion of piston into the rotation motion of crank. For the sake of simplicity and representation, the schematic diagram is in Figure 2. The components of crank train may crack due to external shocks. The wear of revolution will thin the pin and enlarger clearance, leading to inaccurate motion transformation, or rather functional performance failure. There are also two failure modes including catastrophic failure and functional performance failure for the mechanism system. Also, these two failure modes are competing dependent.

Functional failure of crank train system.
Summarily, functional performance failure needs to pay more attention instead of the individual degradation process of a component property. Some reasons are placed here to demonstrate the viewpoint. First, functional performance is the design objective of mechanism system. Second, the definition of degradation failure is also to ensure an appropriate performance. Third, it is hard to establish a threshold of degradation without considering functional performance. All in all, mechanical products are subjected to catastrophic failure due to external shocks and functional failure due to unqualified performance, which are also competing with each other. New expedient model need to be established.
Literature review
Literature related to shock models, degradation process, and multiple competing failure processes (MCFPs) is reviewed in this chapter.
Models of external shock focus on the magnitude and coming time of shocks. Finkelstein and Zarudnij 1 established two non-cumulative damage shock models. Systems would fail if the shock damage exceeds a threshold or the time interval between two successive is too short. Mallor et al. extended shock model based on models in Finkelstein and Zarudnij. 1 The cumulativeness of damage caused by shocks is taken into consideration. 2 Gut 3 considers the changing threshold of resisting external shock in his model. Accordingly, the failure rate to time would also be changed. Bai et al. 4 came up with a generalized framework for shock models based on cluster point process with cluster marks. A new class of copula function for shock model is created by Durante, 5 and system failure distributions are studied with dependence and asymmetric linkages considered. Cha and Finkelstein 6 established preventive maintenance for repairable systems subjected to random shocks modeled by Poisson process. Levitin and Finkelstein 7 obtained the survival probability for systems under Poisson shock with a new stress–strength model. In summary, there are five classic random shock models. (1) The cumulative shock model. Each shock leads to damage. In this model, hard failures will occur as soon as the cumulative damage exceeds the threshold. (2) The extreme shock model. Referring to this model, there will be failures once the size of one shock exceeds a specific threshold. (3) The m-shock model. This model indicates that failure occurs when m shock sizes are larger than a threshold. (4) The run shock model. System fails when a run of shock sizes exceeds threshold. (5) The δ shock model. Failure occurs when the time lag between two successive shocks is shorter than a threshold. Model (1) and (2) focus on the magnitude of shocks, while models (3) and (4) focus on numbers of shocks with an oversize size. Model (5) pays more attention to coming time of shocks.
Models for degradation process in the literature can be divided into two categories,8,9 the general path models and stochastic process models. Peng et al. 9 established a degradation model based on Inverse Gaussian (IG) process with time-varying rates considered. Bayesian framework is used to determine the parameters with sparse degradation observations. Robinson and Crowder 10 used degradation curve to model continuous degradation processes based on Bayesian method. Bae and Kuo 11 simulated the degradation process of material fatigue by degradation path. Zuo and Jiang 12 used a stochastic process to build reliability models for continuous state devices. Comparing with the general path model, the stochastic process model has advantages in calculation and analyzing. Kharoufeh 13 and Kharoufeh and Cox 14 applied Markov additive process to model the wear process and then the reliability of a single-unit system was analyzed. Hsieh et al. 15 used a non-homogeneous compound Poisson model to describe the degradation. Yang and Klutke 16 analyzed lifetime characters by the degradation process on the basis of inspected lifetime data. Huang and Dietrich 17 estimated the parameters in a new-presented degradation model based on degradation statistics. Si and Zhou 18 used the degradation path to model the degradation process and estimate reliability, in which a maximum likelihood (ML) parameter estimation method is provided. Xu et al. 19 modeled the degradation process by Brownian motion (BM) with drift based on statistics comes from an accelerated degradation test of accelerometers. Zhai and Ye 20 used an adaptive Wiener process to model the degradation based on which remaining useful life is predicted. Meanwhile, procedure of parameter estimation is introduced and a lithium-ion battery is selected as an application. The degradation models are widely applied to deal with degradation problems such as lifetime estimation and maintenance policy making. Ma and Yuan 21 estimated the reliability and storage life of fiber optic gyros (FOGs) by BM with drift. Ren et al. 22 predicted the degradation time of a civil aircraft engine by stochastic process (BM). Cai and Ren 23 studied the failure process of sliding rail due to wearing, and the degradation process is modeled by BM.
Existing DTS models consider hard failure (external shock), soft failures (degradation process), and their competing dependence. Coit et al. have made a plenty of research in competing failure models in which various factors are considered. Peng et al. 24 built the basic competing failure model. The hard failure (catastrophic failure) and soft failure (degradation failure) are considered. Hard failure occurs when the size of external shock exceeds its threshold. Degradation is composed by pure degradation and instantaneous increases caused by shocks. Soft failure happens if the degradation exceeds it threshold. The two failures are competing with each other based on which the system reliabilities are analyzed. Many extended papers are published by Coit based on the basic model in Peng et al. 24 Jiang et al. 25 introduced the shift failure thresholds to competing failure model. Soft thresholds may shift if the shock size is larger than a pre-fixed value. Similarly, Rafiee et al. 26 considered the changing degradation rates, which may be changed due to larger shock sizes. Besides, Jiang et al. 27 classified the shock into three zones, the safe zone, damage zone, and failure zone, according their sizes. Shocks in different zones have different influences on system reliability. Song et al.28,29 built the competing failure models for the multi-unit systems. In Rafiee et al., 30 Coit built the models with mixed factors and it makes the model complicated and challenging. There are also many other researchers who studied the competing failure models. Fan et al. 31 built a competing failure model in which the degradation process may influence the sizes and rate of external shocks. A sliding spool is chosen as an example to demonstrate the model. Liu et al. 32 took the self-healing into consideration to build the model. The degradation may have the ability to heal itself, which is the highlight in the model. An and Sun 33 built a model for systems under a shock failure and multi-degradation failure. All the failures are dependent and competing with each other. Copula functions are used to establish the dependence and then reliabilities are calculated.
Overview
Existing competing failure cannot be used for products or a system with functional performance failure. A new model is established to solve this imperfection. As we say in examples, mechanical products are subjected to catastrophic failure (hard failure) due to external shocks and functional failure due to undesirable performance. External shock models are used to model hard failure. For functional performance, an indicator is identified as the manifestation of functional failure. If indicators cannot meet requirements, the functional failure of system/product occurs. These kinds of indicators, such as motion accuracy and drag force, are computed by a function formula with several parameters including constant parameters and degradation ones. As example 1 shows, motion accuracy is the functional indicator, and it can be computed by a function formula including length of bars and clearance of joint in which the clearance is a degradation parameter due to wear and bar length are constant ones. Thus, the degradation process needs to be considered also during functional failure modeling when there are degenerative parameters. The frame of present model in this article is shown in Figure 3.

Flowchart.
The main contributions of this article are as follows:
Reliability models for mechanism systems with multi-functional failure considered are established;
Copula functions are used to demonstrate the dependence between several functional failures. Goodness checking is studied for different types of copula functions, based on which the most appropriate one can be chosen;
Functional performance is decided by a performance indicator, which is a function of several parameters including constant parameters and degradation ones. The processes for degradation parameters are models by BM with non-linear drift. The joint distribution for multi-performance indicators is obtained by the best-fit copula function;
An engineering case is analyzed by the present model to verify the validity.
Rest of this article is organized as following: section “Problem statement” is problem statement, including system description and basic assumption. Failure models are established in section “Modeling and inference.” Shock models are used for hard failure while BM with non-linear drift is used for the degenerate parameters based on which performance failure is modeled. Afterward, system reliability, the key point in this article, is analyzed with function failure considered. Section “Case study” is the cases study. A lock system is analyzed to demonstrate the valid of present model. Finally, conclusion and summary of this article is provided in section “Conclusion and summary.”
Problem statement
System description
Due to randomness and unexpected situation, mechanical systems are subjected to external shocks with uncertain magnitude and frequency, which may lead to catastrophic failure (hard failure). Besides, mechanical systems are designed for specific functional performances such as accurate motion transmission. Functional failure will occur when the functional indicator could not meet requirements. Mechanical systems mentioned in this article are subjected to two failure modes, the catastrophic failure (hard failure) caused by external shocks and functional failure caused by unsatisfactory functional performance. However, existing DTS models ignore the functional performance and functional failure, which is a crucial problem that solved in this article.
Failure modes definition
Catastrophic/hard failure occurs when external shock sizes Wi (usually the converted into stress) exceeds a threshold H (usually the strength of materials). Functional failure occurs if the functional indicator reaches a limit δ. Catastrophic/hard failure and functional failure are competing with each other, which means the occurring of any failure will cause the failure of system. Besides, the dependence of these two failure modes is shown in different aspects. The random shock may cause additional abrupt increase in degradation process of factors influencing functional performance. Hard failure and functional failure are dependent due to shared external shocks. For mechanical systems with multi-functions, there is also dependence between various functional performances due to shared components, loads, and so on.
Basic assumptions
Without loss of generality, some basic assumptions are made to establish model compactly and correctly:
Threshold H of hard failure is a constant value in terms of actual system. External shocks arrive according to a Poisson process with rate λ. The size of shocks is denoted by Wi which is independent identically distributed (i.i.d.) variables. Hard failure occurs as soon as Wi exceeds threshold H, in other words, extreme shock model used here.
The sizes of external shocks and the additional abrupt increase in degradation process are all greater than 0.
Functional indicator value is notated by FI. The limit for an indicator is δ, which is pre-established.
Modeling and inference
Catastrophic failure model
For the catastrophic failure of mechanism products, extreme shock model is suitable. Figure 4 shows the process of extreme shock model.
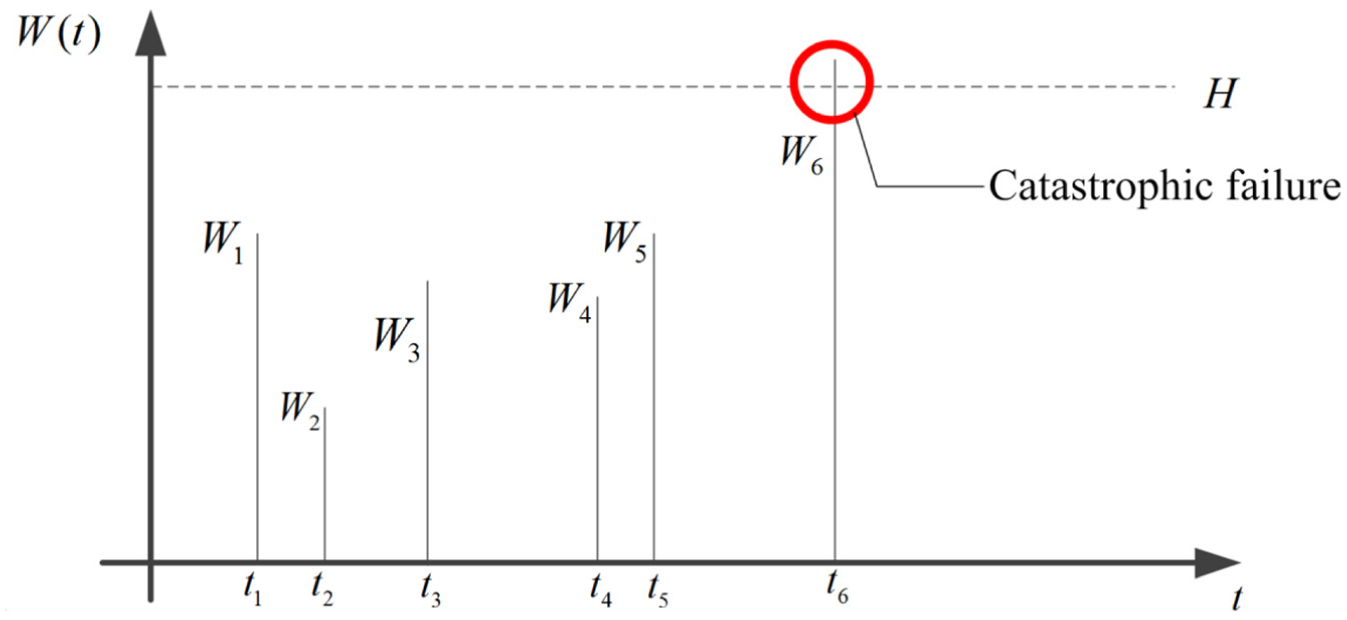
Extreme shock model.
Supposing the sizes of external shocks are indicated by Wi, catastrophic failure model occurs when Wi exceeds the pre-defined threshold H. The probability that catastrophic failure does not occur is expressed by

Due to the randomness of shock size, the Wi is an i.i.d. variable. Coming time of each external shock is also uncertain, which is described by Poisson process N(t) with rate λ. λ is determined by shock sources. Thus, the probability that catastrophic failure does not occur versus time is expressed by

Functional failure model
Functional failure is identified by a functional indicator. For instance, the rotation angle error of gear shown in example 1 is a functional indicator as shown in Figure 5. There is inevitable abrasion of gear teeth during operating, leading to defective teeth. The defect of tooth can cause inaccurate transmission, which can be reflected be rotation angle. The rotation angle error θ is the functional indicator in this example. If the rotation angle error exceeds a pre-established value, functional failure occurs.

Functional failure of gear pair.
Functional indicator definition
Functional indicators are influenced by several factors. The rotation angle error θ in example 1 is influenced by a defective tooth and some gear property such as gear size and tooth number; the defectiveness of a tooth is a degradation process. In other words, the functional indicator is a formula of these factors.
Functional indicators depend on specific mechanical systems. For instance, rotation angle error is a functional indicator for gear systems; displacement error is for link systems; and drag force is for drive systems.
Degradation process model
Degradation process is composed by two parts, the continual part caused by wear and usage and the instantaneous damages due to shocks. Define X(t) as the total degradation measurement, C(t) as the continual part, and S(t) the instantaneous damages. Then, there is an expression that X(t) = C(t) + S(t).
BM with non-linear drift is used to model continual part. Assume that C(t) follows a BM with linear drift, then it can be written as

where B(t) is a standard BM,
The classical BM model could not describe degradation processes that accelerate with time. To solve this problem, BM with time transformations is proposed in many papers to model degradation processes. Power time transformation

after power time transformation used. Then, the degradation parameters will follow a normal distribution with mean value
Another part of degradation is the instantaneous degradation increments
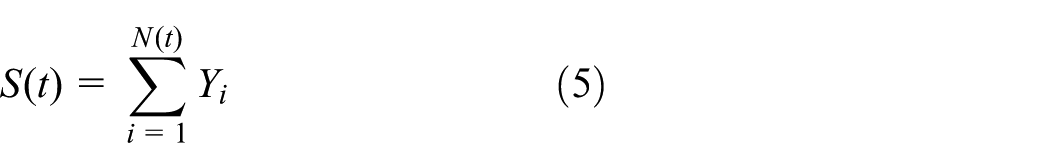
where N(t) is the total shock number that until time t. So, the total degradation is written as

If Yi is also normal distributed variable
Functional indicator formula
Functional performance is a function of several parameters. Namely, the function can be expressed by

in which FI is the functional indicator, f is the functional relationship between indicator and its influencing factors, xi is the constant factor, and yi is the factor that can degrade.
Functional failure occurs if the functional indicator reaches a limit δ. Thus, the probability that functional failure does not occur is expressed by
The probability that functional failure does not occur is
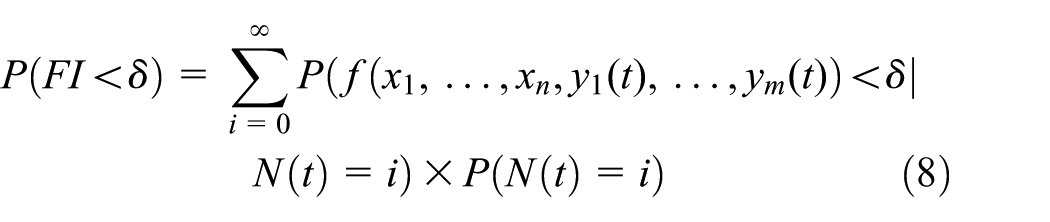
in which
System reliability
As we mentioned above, systems are under catastrophic failures and functional failures. None of these failures are permitted to occur as system would like to stay reliable. System reliability is determined by all of these failure modes.
Dependence modeling
The catastrophic failures and functional failures are dependent due to shared shocks. External shocks may cause catastrophic failure and instantaneous degradation increments of functional failure. This kind of dependence is reflected in the expression of degradation process, more exactly, the instantaneous total increment
There are also dependences between different performances themselves for mechanical systems with multi-functional performances. This viewpoint is reasonable because of shared components, loads, and so on.
Copula function is used to model this dependence. Copula function is a joint distribution function of standard uniform random variables which can be expressed by
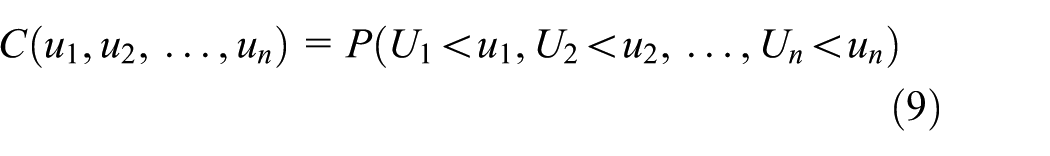
where Ui follows standard uniform distribution
C is the copula function. C is unique if margin distributions
Inference of system reliability
None of these failures is permitted to occur if system does not fail. Thus, all the shock sizes need to smaller than threshold H and all the functional indicators cannot reach limit δ. Assuming there are m functional performances for a system, the reliability of system is expressed as follows

Then, the probability density function (PDF) of the failure time is derived as

where
Commonly used copulas.

For a clear illustration, the system experiencing two functional failures is set as an example to explain the development of reliability calculation formula. Consider a system subjected to a catastrophic failure and two functional failures. The reliability of system is developed as
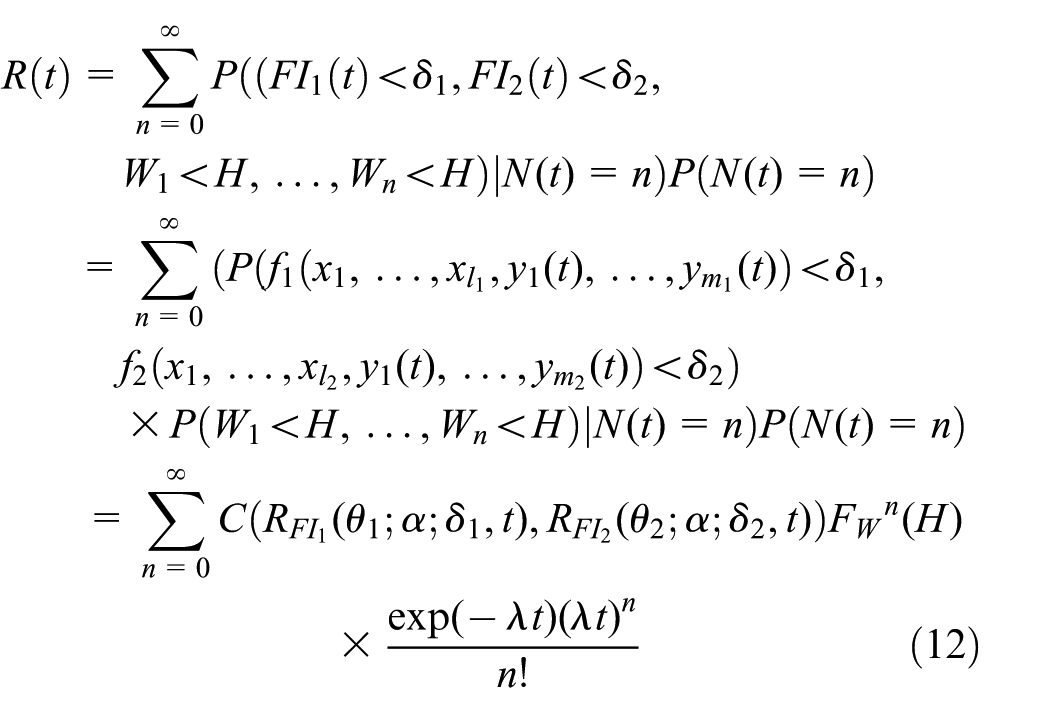
FI 1 and FI2 are the indicators of two functional failures; accordingly, δ1 and δ2 are the limit for two functional failures (Table 2).
Notation meaning of reliability equation.

The key point is to estimate the unknown parameters including parameters in margin distributions and copula function. For some special situations, the parameter of margin distribution of functional indicator is conducted directly without estimation. If the functional indicator formula is linear and the parameters are normal distributed, the margin distribution of indicator can be obtained precisely. Supposing the indicator formula is
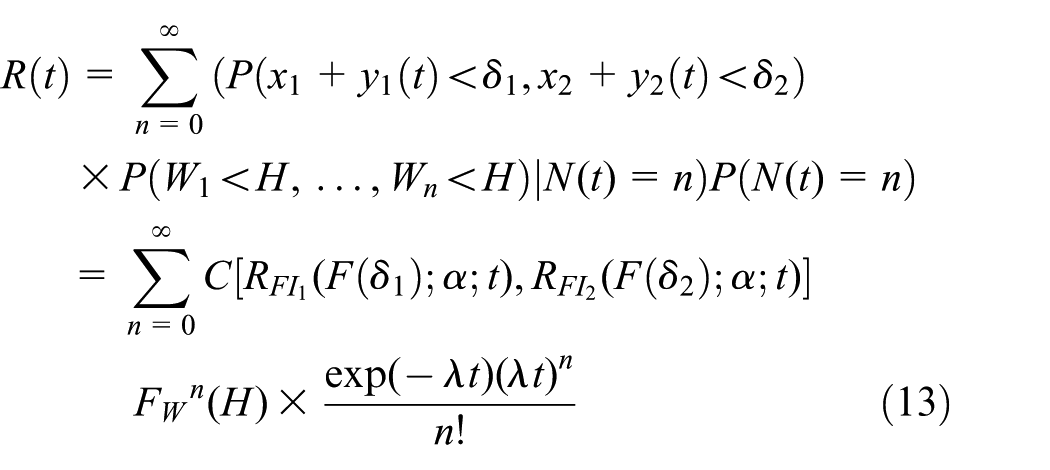
in which
Step 1. Generating n samples
Step 2. Deducing the joint PDF of FI1 and FI2 as equation (14)
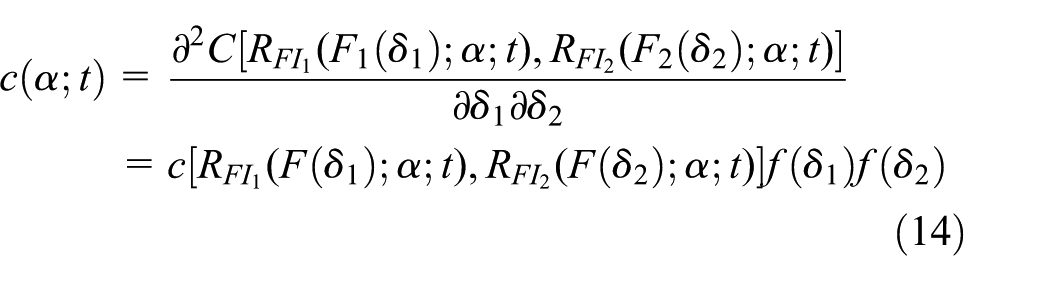
where
Step 3. Calculating the log-likelihood function value at each sample as equation (15)

Step 4. Estimated value
For indicator formula that cannot obtain the indicator distribution precisely, canonical maximum likelihood (CML) method is used to estimate the parameter in copula function. The steps of CML for copula function parameters are as follows:
Step 1. Generating n samples for each influencing parameters of functional indicator (functional indicator 1 is chosen as a demonstration) according to the distribution. The sampling set is shown by

Step 2. Calculating the functional indicator at each group of samples and get n values
Step 3. Get the empirical distribution functions
Step 4. Performing step 2 to step 4 in of ML method with PDFs replaced by empirical distribution functions

where
For a specific example, the goodness of different copula needs to be checked based on which a most appropriate copula is chosen for calculation. Typical checking methods include log-likelihood method, Akaike information criterion (AIC) method, and Bayesian information criterion (BIC) method. 34 A log-likelihood method is used in this article to find a suitable copula in case study section. The log-likelihood function of bivariate copula is as follows
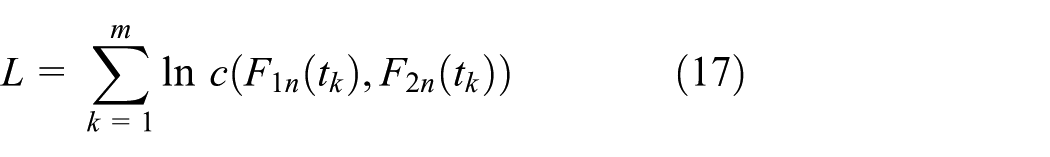
The larger the log-likelihood value is, the better the copula fitness.
Case study
An aircraft cabin door lock system is chosen as an example to verify this model. The structure of this lock is shown in Figure 6. It consists of eight parts including actuator cylinder, push rod, rocker, two connecting rods, tension spring, lock hook, and lock ring. For a better illustration, some accessories are ignored in this diagram such as the nozzles of cylinder and the cabin door on which lock ring is fixed. The actuator cylinder provides power to drive these components move as designed. This lock system has two functions, locking function and unlocking function. The detail processes of these two functions (Figure 7) are introduced below:
Unlock function. Unlock process makes the lock move from lock state to unlock state. The lock hook and lock ring are in contact tightly to keep cabin door locked. The actuator cylinder makes the push-rod move by hydraulic oil after unlocking signal is sent. By the actuation of push rod, other components move as designed laws. When the push rod arrives at its pre-established maximum movement, the lock is opened thoroughly and it is in lock state.
Lock function. Analogously, lock function makes lock move from unlock state to lock state. Oil is discharged by actuator cylinder after lock signal released and push rod moves toward the cylinder. Rocker rotates clockwise. The tension spring is stretched until the lock hook and lock ring contacts tightly, or rather, lock state achieved.

Structures of lock.

Functions of lock.
The force condition of lock state is shown in Figure 8. This force causes drag force, which needs to be overcame by cylinder if unlocking process and locking process need to be operated rightly. Due to the randomness, the actual drag force is an uncertain value. Stagnation occurs once drag force exceeds the maximum drive force that cylinder can offer. Due to transmission laws, the drag force of locking process and unlocking process is different.

Influencing factors of functions.
Thus, there are three failure modes for this lock system, catastrophic failure due to component crack caused by external shocks such as unexpected vibration, unlocking failure due to oversize drag force, and locking failure due to oversize drag force. The functional indicator for this lock is the drag force during locking and unlocking processes.
Reliability and PDF of the failure time are analyzed according to flowchart in Figure 3 and equations (12) and (13). Then, equations (18) and (19) are obtained


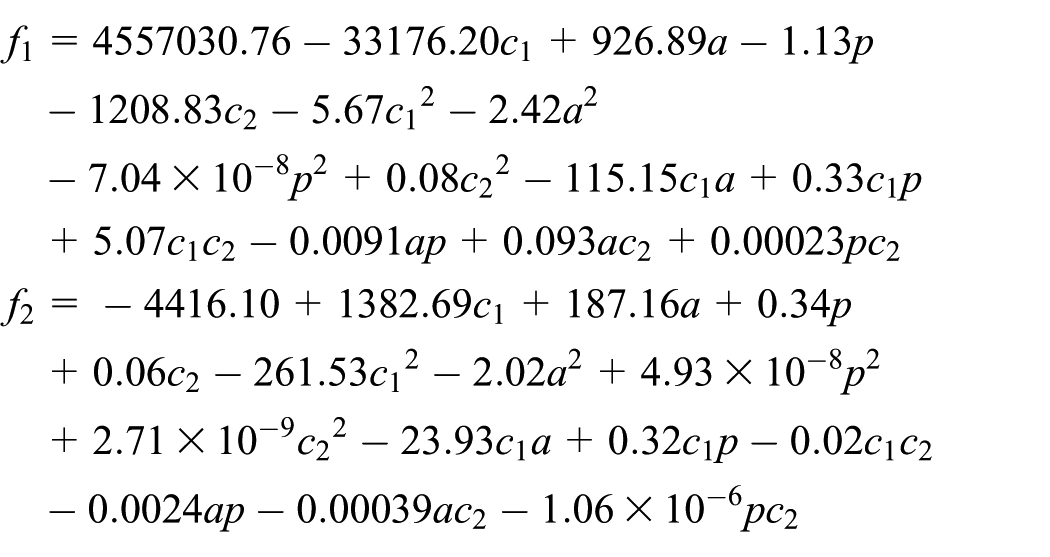
The meaning and value of parameters used in equations (18) and (19) are listed in Table 3. The expression of these two functional indicators are indicated by f1 and f2, which include four parameters: a, p, c1(t), and c2(t). The expressions f1 and f2 are established by response surface method, which is written as
Parameters for lock system.

a and p are parameters that cannot degrade, and c1(t) and c2(t) degrades according to equation (6).
System reliability and PDF of failure time of this lock are calculated by equations (18) and (19). Necessary parameters are shown in Table 3.
To check out the goodness of above five copula functions, the log-likelihood values for goodness checking are calculated according to equation (17). As shown in Table 4, the Gumbel copula has the largest value, which means Gumbel copula is best fit for this lock system. Thus, Gumbel copula is chosen for next analysis including some sensitivity analysis for some parameters.
Log-likelihood values of each copula.

Substituting the parameters given in Table 3 into equation (17), the reliabilities of this lock system can be obtained at different times. The curve of lock system reliability is shown in Figure 9, which indicates that the reliability decreases with time due to degradation factors. The decreasing rate is also different at different time intervals. The lifetime distribution of this lock system is also given in Figure 9, telling us that lifetime of this lock system lies on

System reliability and failure time distribution of lock.
Sensitivity analysis of some concerned parameters to acquire their influence on reliability. These interesting parameters include q, TH, friction coefficient, and spring coefficient.
q is a parameter in degradation process which indicates the acceleration of degradation. Figure 10 shows the sensitivity analysis of q. Figure 10 indicates that system reliabilities are sensitive to q and large q leads to a faster degradation speed. When time (working circulation) exceeds, the differences of each q are getting more obvious. The distribution curves of lifetime shift to left and become less scattered, which means a larger q (higher degradation rate) leads to shorter lifetime.
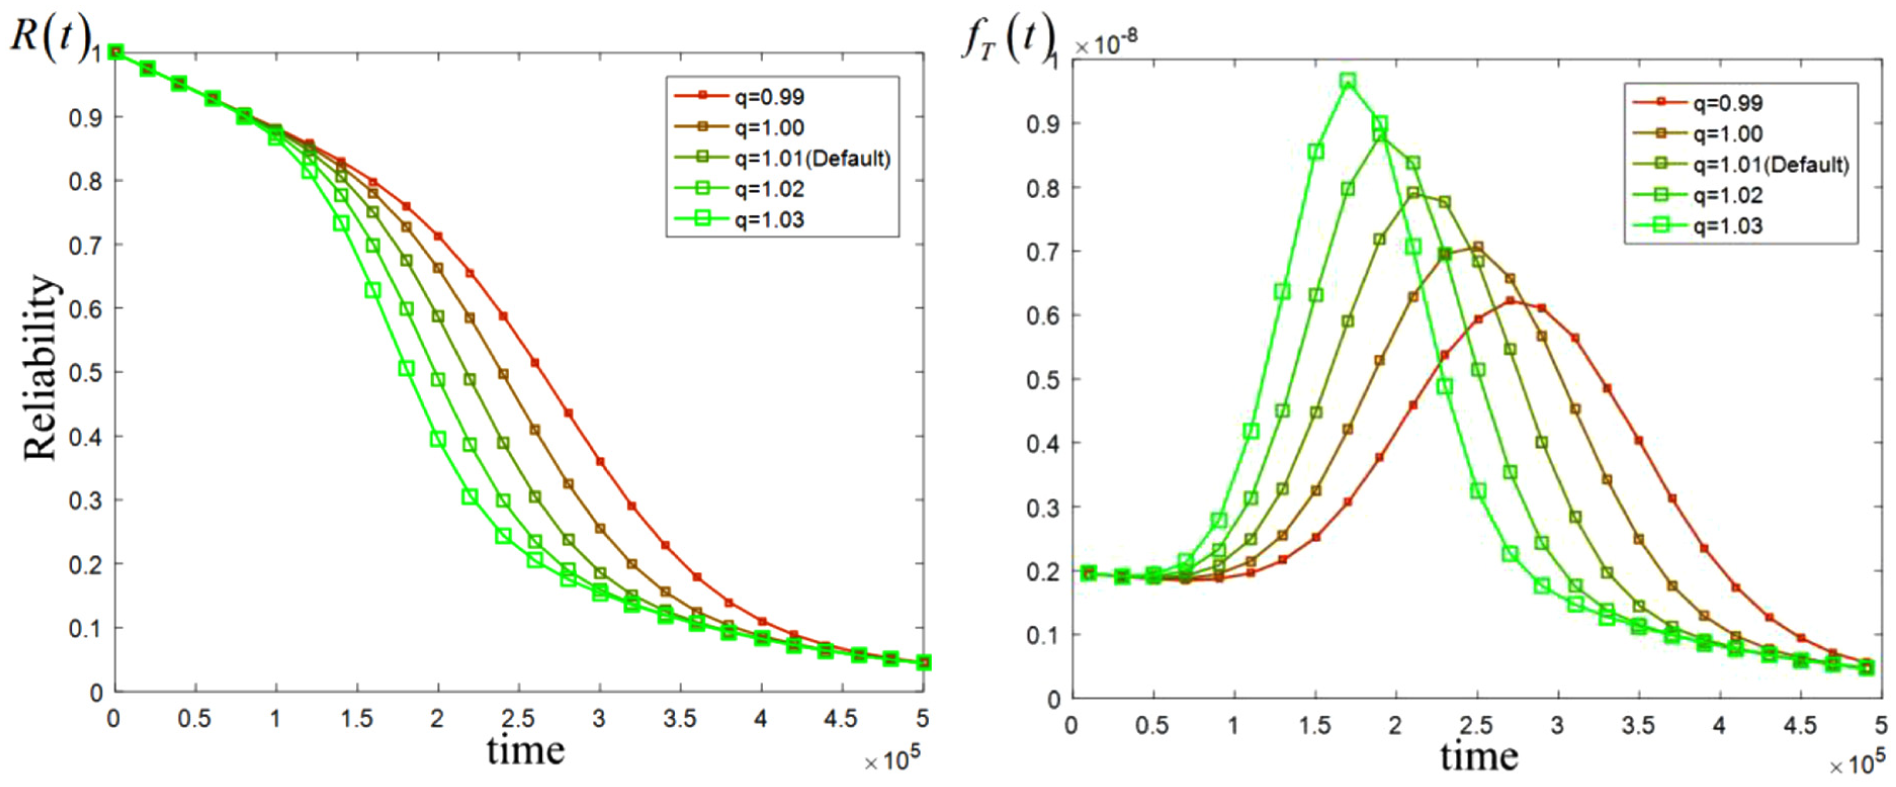
Sensitivity analysis of q.
TH means the available driven force that actuator cylinder could offer. Figure 11 indicates reliability is very sensitive to TH. There are significant differences between different values of TH from the start of working process. Besides, the curve shapes are different with different TH values, especially when TH equals to 2600, which indicates that reliability is sensitive to TH further. This conducts us to choose an appropriate actuator cylinder to ensure a higher reliability. Similarly, lifetime distribution curves shift to right as TH increases. A high-power driven will keep a longer lifetime.

Sensitivity analysis of TH.
The friction coefficient implies the degree of friction of revolution pairs. We know the reliability curve shifts to left when friction coefficient increases from Figure 12. It is easy to understand that larger friction coefficient leads to larger drag force and smaller reliability value. Naturally, a larger friction coefficient means a poor lubrication and a shorter lifetime. It also demonstrates that it is important to keep a small friction coefficient in engineering practice by some ways such as add lubricating oil.

Sensitivity analysis of friction coefficient.
Figure 13 shows the sensitivity analysis of elastic coefficient (also called spring stiffness) of tension spring. A robust tension spring is along with higher system reliabilities and longer lifetime.

Sensitivity analysis of elastic coefficient of tension spring.
λ signifies the frequency of external shocks, and more frequent shocks cause a lower system reliability just shown in Figure 14. This phenomenon means reliability deteriorates when this lock system works in a worse working environment. Meanwhile, a bad environment may lead to a short lifetime for mechanical system.

Sensitivity analysis of λ.
Conclusion and summary
A model of competing failure for mechanical systems under catastrophic and multiple functional failures is developed in this article. Shocks with magnitude above a threshold will cause catastrophic failure. Different from previous competing models, functional failures are taken into consideration. Functional failure is reflected by functional indicator with degradation process contained, and it is a function of several parameters including degradation ones. Functional failure occurs when functional indicator is unqualified. Besides, the dependence between multiple functional failures is modeled by copula functions. System reliability and failure time distribution are decided and calculated with above failure modes considered.
Comparing with previous DTS models, this model is exceedingly appropriate for systems with functional failure especially for mechanical products. In section “Case study,” a lock system is chosen as an example to demonstrate the validity of present model. Reliability and failure time distribution of lock system are obtained by this model with various copula functions, and a best-fit copula is picked out. What’s more, sensitive analyses on different parameters are studied with the best-fit copula function. The sensitive analyses are helpful for the designing and maintenance of this lock system.
In future research, we will extend this model by other external shock models considered such as run shock model, and parameters are not just under normal distribution. Besides, mechanical systems with more functional failures (over three) can be selected as cases.
Footnotes
Handling Editor: Shun-Peng Zhu
Declaration of conflicting interests
The author(s) declared no potential conflicts of interest with respect to the research, authorship, and/or publication of this article.
Funding
The author(s) disclosed receipt of the following financial support for the research, authorship, and/or publication of this article: This work was supported by the Fundamental Research Funds for the Central Universities under grant no. 3102015 BJ (II) JL01 and the National Natural Science Foundation of China under grant no. 51675428.