
Abstract
Objectives
Assessment of plaque stenosis severity allows better management of carotid source of stroke. Our objective is to create a deep learning (DL) model to segment carotid intima-media thickness and plaque and further automatically calculate plaque stenosis severity on common carotid artery (CCA) transverse section ultrasound images.
Methods
Three hundred and ninety images from 376 individuals were used to train (235/390, 60%), validate (39/390, 10%), and test (116/390, 30%) on a newly proposed CANet model. We also evaluated the model on an external test set of 115 individuals with 122 images acquired from another hospital. Comparative studies were conducted between our CANet model with four state-of-the-art DL models and two experienced sonographers to re-evaluate the present model’s performance.
Results
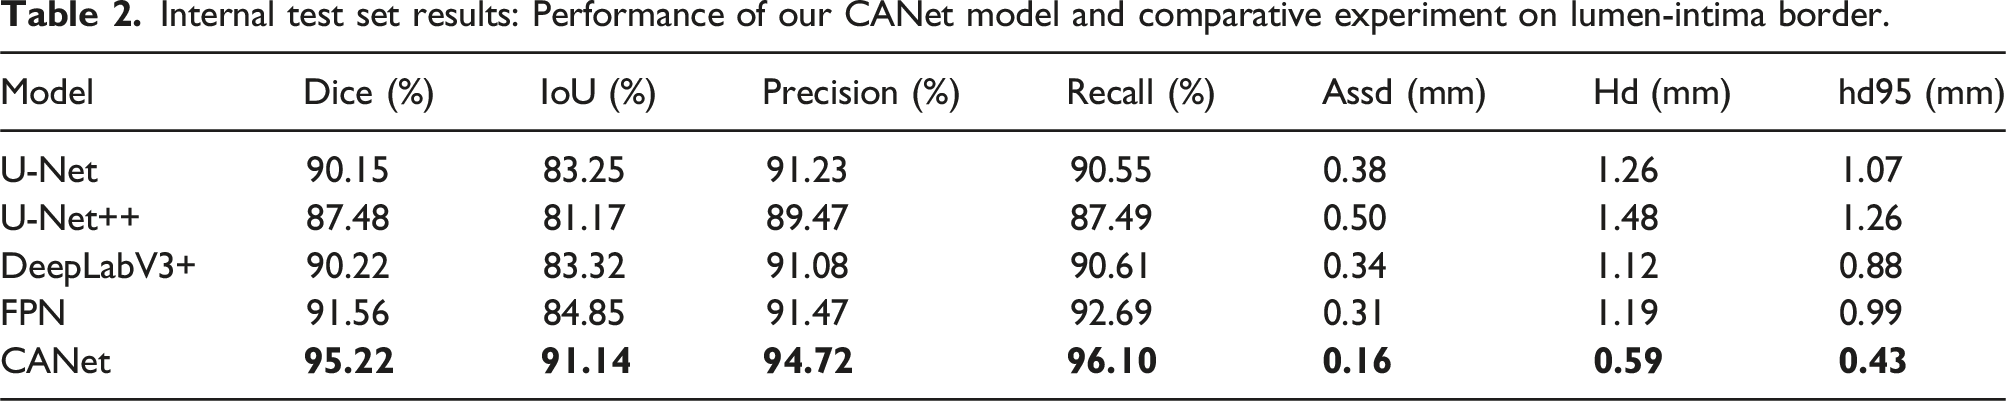
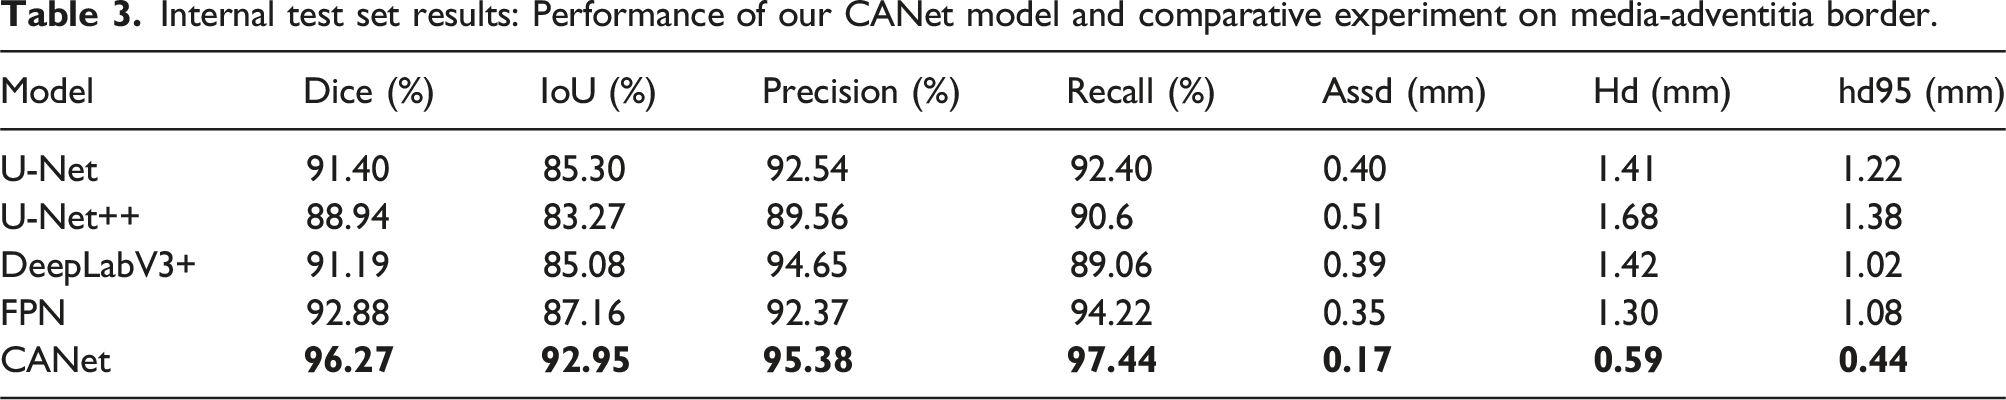
On the internal test set, our CANet model outperformed the four comparative models with Dice values of 95.22% versus 90.15%, 87.48%, 90.22%, and 91.56% on lumen-intima (LI) borders and 96.27% versus 91.40%, 88.94%, 91.19%, and 92.88% on media-adventitia (MA) borders. On the external test set, our model still produced excellent results with a Dice value of 92.41%. Good consistency of stenosis severity calculation was observed between CANet model and experienced sonographers, with Intraclass Correlation Coefficient (ICC) of 0.927 and 0.702, Pearson’s Correlation Coefficient of 0.928 and 0.704 on internal and external test set, respectively.
Conclusions
Our CANet model achieved excellent performance in the segmentation of carotid IMT and plaques as well as automated calculation of stenosis severity.
Introduction
Stroke is the third leading cause of death worldwide and one of the most significant contributors to long-term disability.1–4 Each year, more than 6 million strokes occur globally. 5 Approximately 20% of ischemic strokes are caused by extracranial carotid artery stenosis.6–8 Studies have demonstrated that appropriate carotid intervention, including carotid endarterectomy (CEA), carotid artery stenting (CAS), and best medical therapy (BMT), can reduce the 5-years risk of stroke or death in asymptomatic patients from 11% to 5%. 8 Therefore, it is essential to identify patients correctly and rapidly for adequate treatment with early cerebral revascularization, either with symptomatic or asymptomatic carotid artery stenosis.
Digital subtraction angiography (DSA) was regarded as the gold standard for assessing extracranial stenosis of carotid vessels. Given its invasive characteristics, DSA has now been replaced by other effective, non-invasive diagnostic methods, like computed tomography angiography (CTA) and magnetic resonance angiography (MRA). However, ultrasound (US) remains the first-line imaging modality for identifying carotid stenosis and characterizing the severity of the lesion, largely due to its wide availability, non-invasiveness, and cost-effectiveness. 9 The severity of extracranial carotid stenosis in the US can be clinically classified as mild (<50%), moderate (50% to 69%), severe (70% to 99%), and occlusion (100%), according to North American Symptomatic Carotid Endarterectomy Trial (NASCET). 10 For this method, precise carotid plaque identification is the premise for subsequent stenosis severity evaluation and treatment plan development. Manual quantitative stenosis assessment is time-consuming and labor-intensive, requiring trained sonographers to undergo the procedure. Additionally, images acquired by different levels of sonographers possibly lead to divergent results. Further, variations in anatomy or irregular stenoses can make this task more challenging even for experienced observers. As a result, automating the process to detect plaques and calculate stenosis severity would be helpful for more rapid decision-making during treatment procedures of potential stroke patients.
Artificial intelligence (AI), particularly the newly developed DL algorithms, has sparked interest in the automated segmentation of medical images. 11 Utilizing multilayer neural networks, deep learning techniques can simplify and expedite feature selection and segmentation. 12 Moreover, AI models can detect medical imaging subtleties that may escape the human eye. Deep learning has achieved remarkable success in carotid–related tasks, including the identification of intima-media thickness (IMT) and plaques.13–17 However, most existing models are primarily focused on carotid structure detection, with little information available on the automated calculation of carotid stenosis severity from the transverse US view.
The purpose of this study was to introduce a deep learning-based model, named Carotid Artery network (CANet), designed for the automated identification of IMT and plaques, as well as calculation of stenosis severity with US images of CCA transverse section. We compared the performance of our model with that of two experienced sonographers and several latest state-of-the-art segmentation models. We hypothesize the model selected can be applied to assist sonographers in precisely finding the most stenosed location and rapidly calculate severity in clinical practice.
Materials and methods
Participant cohorts and data preparation
There are 491 participants (245 females and 246 males) involving in this study. Between July 2021 and July 2022, our internal dataset comprised 376 participants from Shenzhen People’s Hospital. Additionally, our independent external dataset included 115 participants from Hangzhou Cancer Hospital, spanning from January 2022 to July 2022. We included consecutive cases that met our inclusion and exclusion criteria. The including criteria were as follows: (1) individuals with age between 18 and 80 years old; (2) with carotid plaques or with high-risk factors for atherosclerosis such as high blood glucose, hypertension, high cholesterol, or regular smoking; (3) stroke history. The excluding criteria were as follows: (1) carotid artery surgery history, such as carotid endarterectomy, and carotid artery stent; (2) 100% carotid stenosis (occlusion); (3) individuals with carotid tortuosity.
This retrospective investigation was authorized by the Ethics Committee of our hospital (Approval number: LL-KY-2021685).
Two sonographers with 15 years of expertise reviewed the images and manually performed the annotation process. LI and MA borders of CCA were traced with sequential points using Labelme software (version 5.3.1). 18 The internal data set were randomly divided into training, validation, and test sets at a 6:1:3 ratio for model construction. Given that the prevailing size of our dataset is 896 × 672 pixels, we standardized all images to this dimension to reduce the necessity for extensive image compression. Additionally, we performed min-max normalization on the pixel values.
CCA stenosis severity rate calculation
In this study, the CCA stenosis severity rate is defined as the proportion of the area of the vessel lumen occupied by the plaque. Following the completion of the segmentation task, which identifies the LI (denoted as
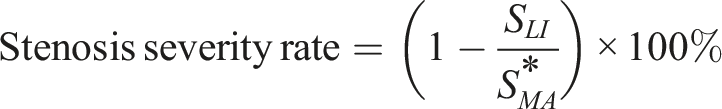
According to recommendations from the American Society of Echocardiography,
19
Model construction
The overarching architecture of CANet is inspired by the design of U-Net, 20 with a notable modification: the replacement of the U-Net encoder with EfficientNet. EfficientNet exhibits enhanced proficiency in extracting high-dimensional image features. The structure incorporates the concatenation of five resolution layers from EfficientNet with the corresponding layers of the decoder, facilitated by skip connections. This integration process harmonizes high-level semantic features from the decoder with low-level semantic feature maps from the encoder at the corresponding scale.
An end-to-end structure was designed for the whole model. The network weights were initialized by the model trained on ImageNet,
21
which helps the model leverage knowledge learned from a diverse dataset. Dice loss is utilized to calculate the loss. Dice loss assesses the agreement between the predicted segmentation mask and the ground truth mask, which is common in segmentation tasks. We used the Adaptive Moment Estimation (ADAM)
22
as an optimizer with a dynamic learning rate with an initial value of 0.001. ADAM is a popular optimization algorithm in deep learning due to its effectiveness in handling noisy gradients, adaptive learning rates, and overall robust performance across different types of neural network architectures. If the Dice value on the validation set does not increase for 10 consecutive epochs, the learning rate is reduced by a factor of 10.

Models are realized using PyTorch (version 1.9.1).
23
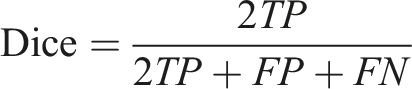
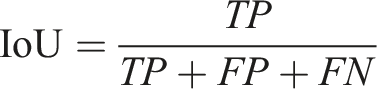
Throughout the training process, we implemented random data augmentation on images to enhance model generalization and mitigate overfitting. The data augmentation techniques encompassed horizontal flipping, the addition of Gaussian or median noise, and a range of intensity transformation methods, including gamma correction, log transformation, and contrast stretching. The schematic diagram of our research framework is shown in Figure 1. The schematic representation of our research study framework. (a) Original ultrasound images undergo segmentation annotations by human experts with 15 years of expertise. Following pre-processing (b), the images are fed into our proposed CANet model (c), which generates segmentation results for the media-adventitia border (MA border) and lumen-intima border (LI border). (d) Performance metrics for cross-model comparisons including the Dice coefficient, IoU(Intersection over Union); precision score, recall score, assd(Average Symmetric Surface Distance); hd(Hausdorff distance). The consistency between our model and human experts is assessed using the Intraclass Correlation Coefficient (ICC) and Pearson’s Correlation Coefficient.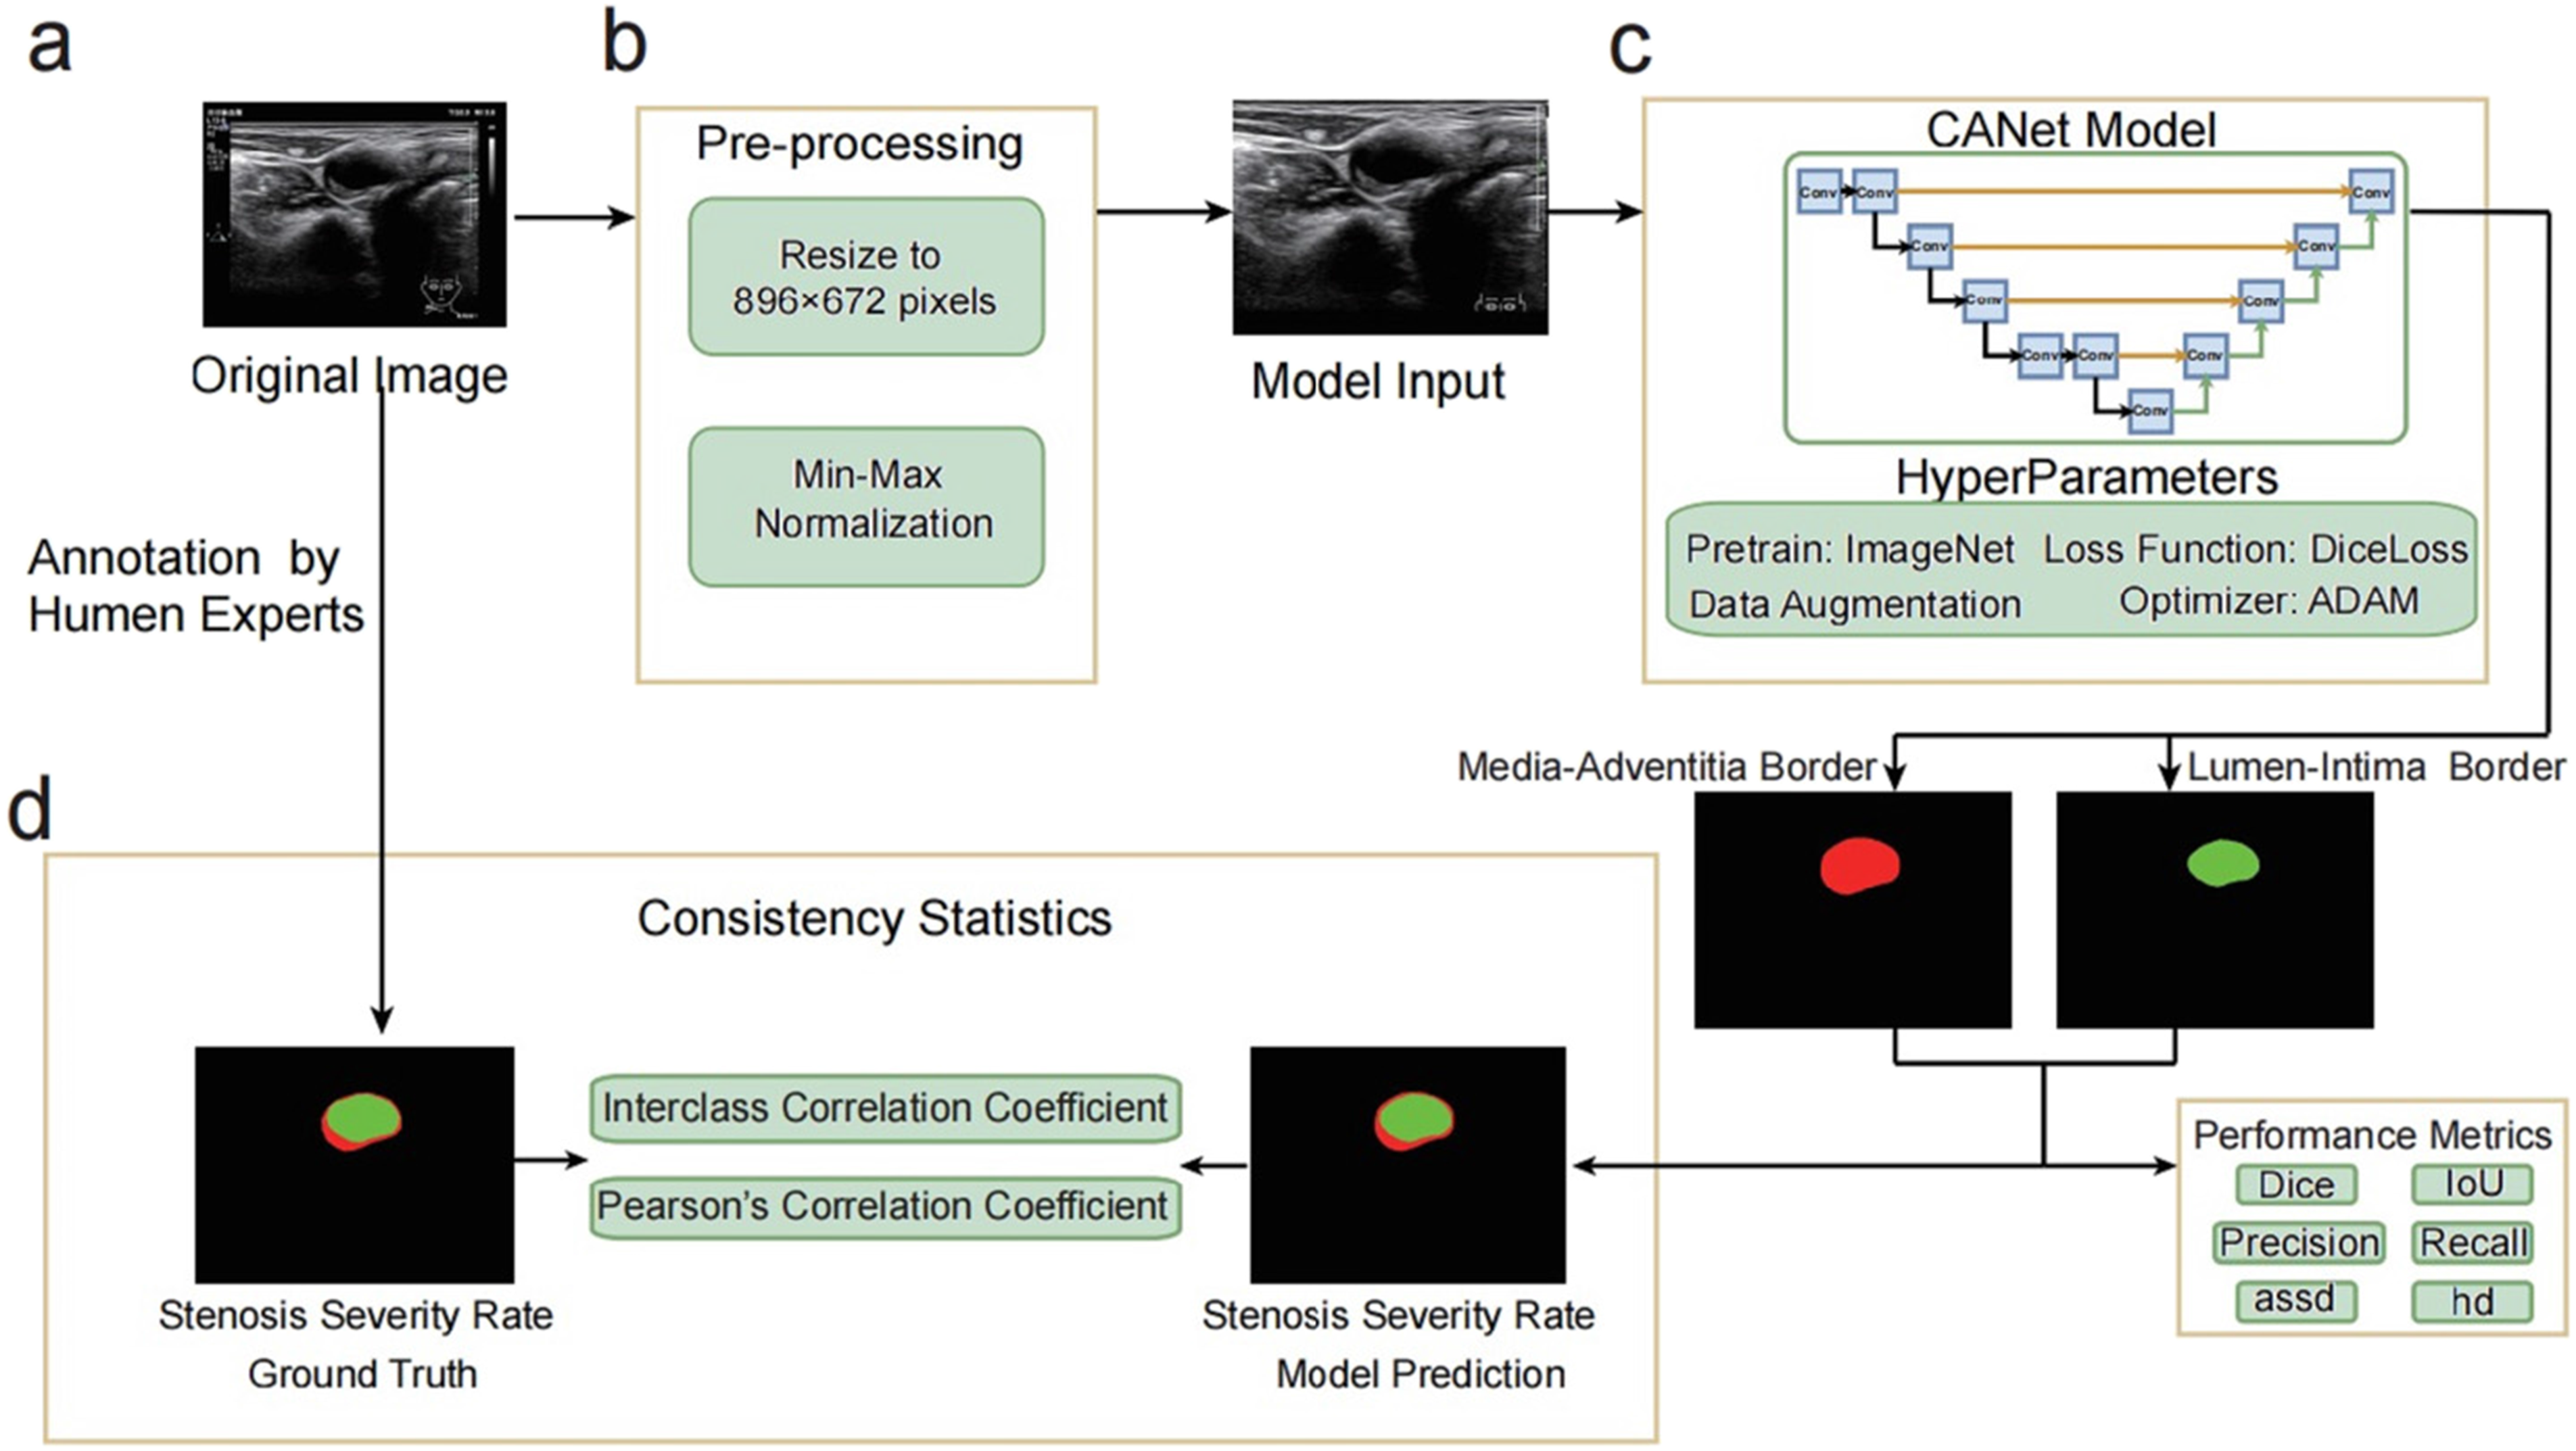
Comparative experiment
Additionally, we employed four contemporary segmentation network architectures—U-Net, 20 U-Net++, 24 DeepLabV3+, 25 and FPN 26 on the internal test set to assess their performance in comparison to our CANet model.
To gauge the calculation accuracy in CCA stenosis severity, a reader study was conducted. Two sonographers, each possessing 15 or more years of experience, underwent thorough training sessions to ensure a uniform understanding of the segmentation criteria. In cases where disagreements (segmentation Dice was lower than 0.85) emerged among sonographers, a senior sonographer, boasting 20 or more years of experience, took the lead in convening review and arbitration. The results of stenosis severity rate were then compared with the performance of our CANet model.
Statistical analysis
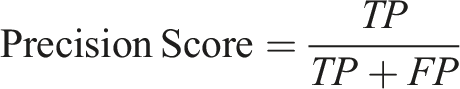
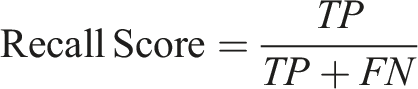
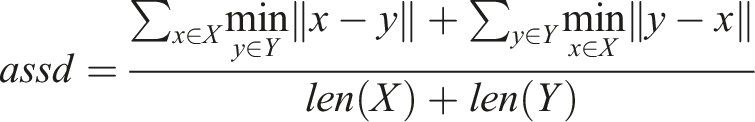
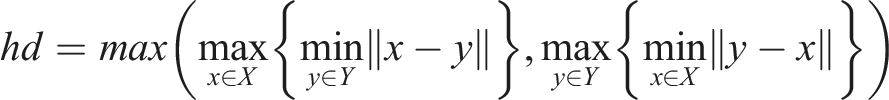
Dice coefficient, Intersection over union (IoU), Precision Score, Recall Score, Average Symmetric Surface Distance (assd), and Hausdorff distance (hd)
27
are selected as our metrics to evaluate the quality of segmentation, which are commonly used in segmentation tasks. These metrics are calculated in LI and MA borders, respectively, shown as the output mask of the network output in Figure 1. The calculation formulas are as follows
Additionally, one-way ICC was utilized to gauge the consistency of stenosis severity rate conducted by our model and human experts. Pearson’s correlation coefficient was calculated to measure the correlation. The uncertainty of the estimate is quantified at the 95% confidence interval. All these experiments and statistical analyses were conducted in Python (version 3.10) and R (version 4.3.1). The statistical analysis is significant when the p-value (P) < .05.
Results
Demographics and characteristics of the patients
Basic characteristics of participants and dataset.
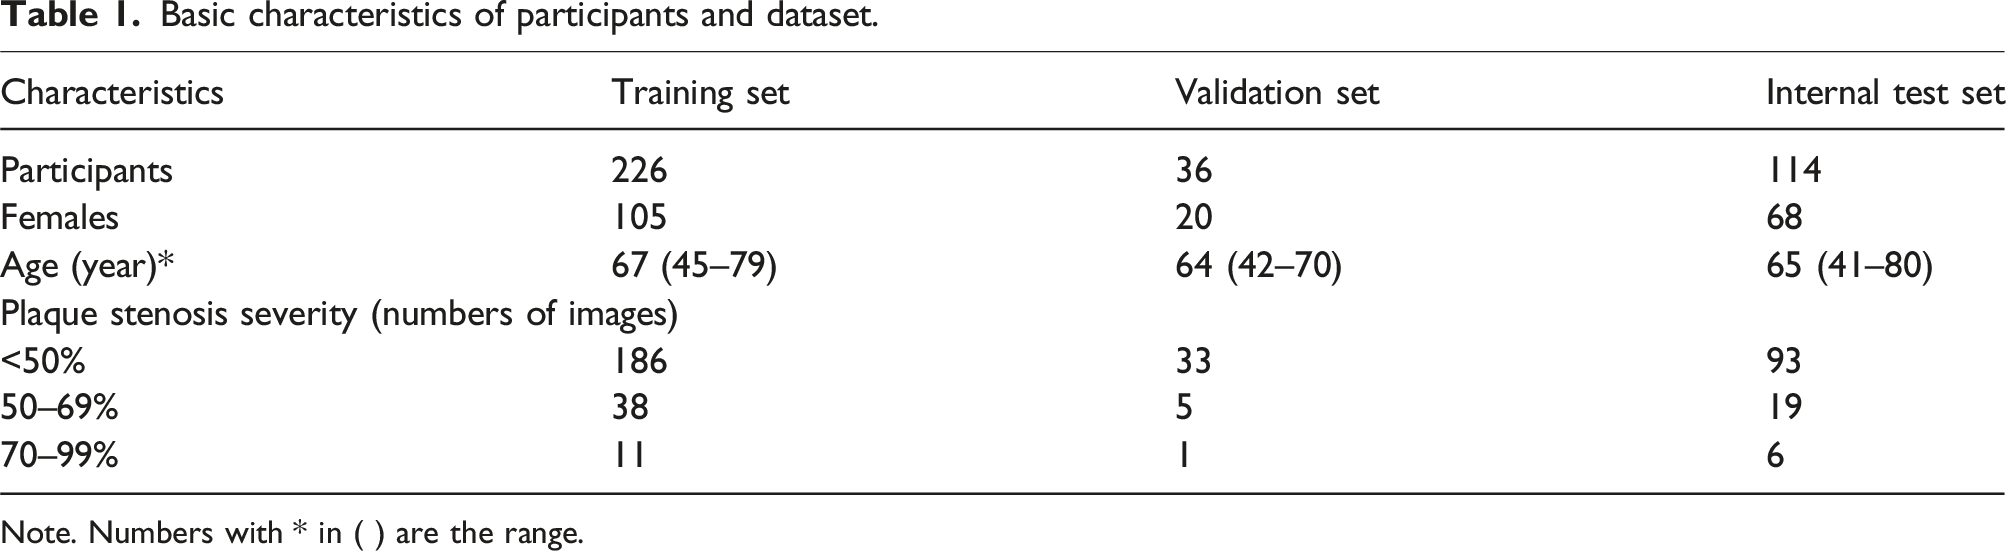
Note. Numbers with * in ( ) are the range.
The CANet model exhibits high segmentation performance in both the internal and external datasets
Internal test set results: Performance of our CANet model and comparative experiment on lumen-intima border.
Internal test set results: Performance of our CANet model and comparative experiment on media-adventitia border.
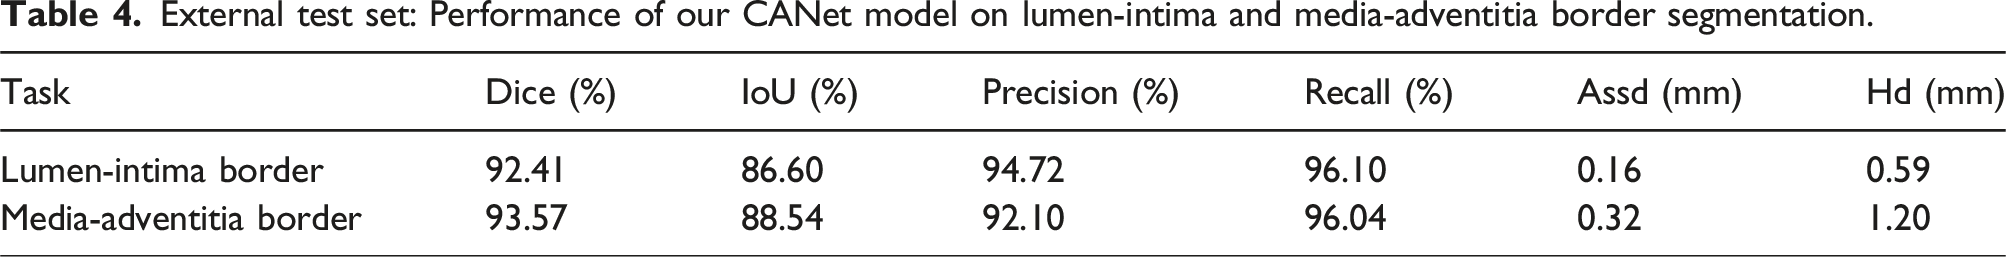
External test set: Performance of our CANet model on lumen-intima and media-adventitia border segmentation.
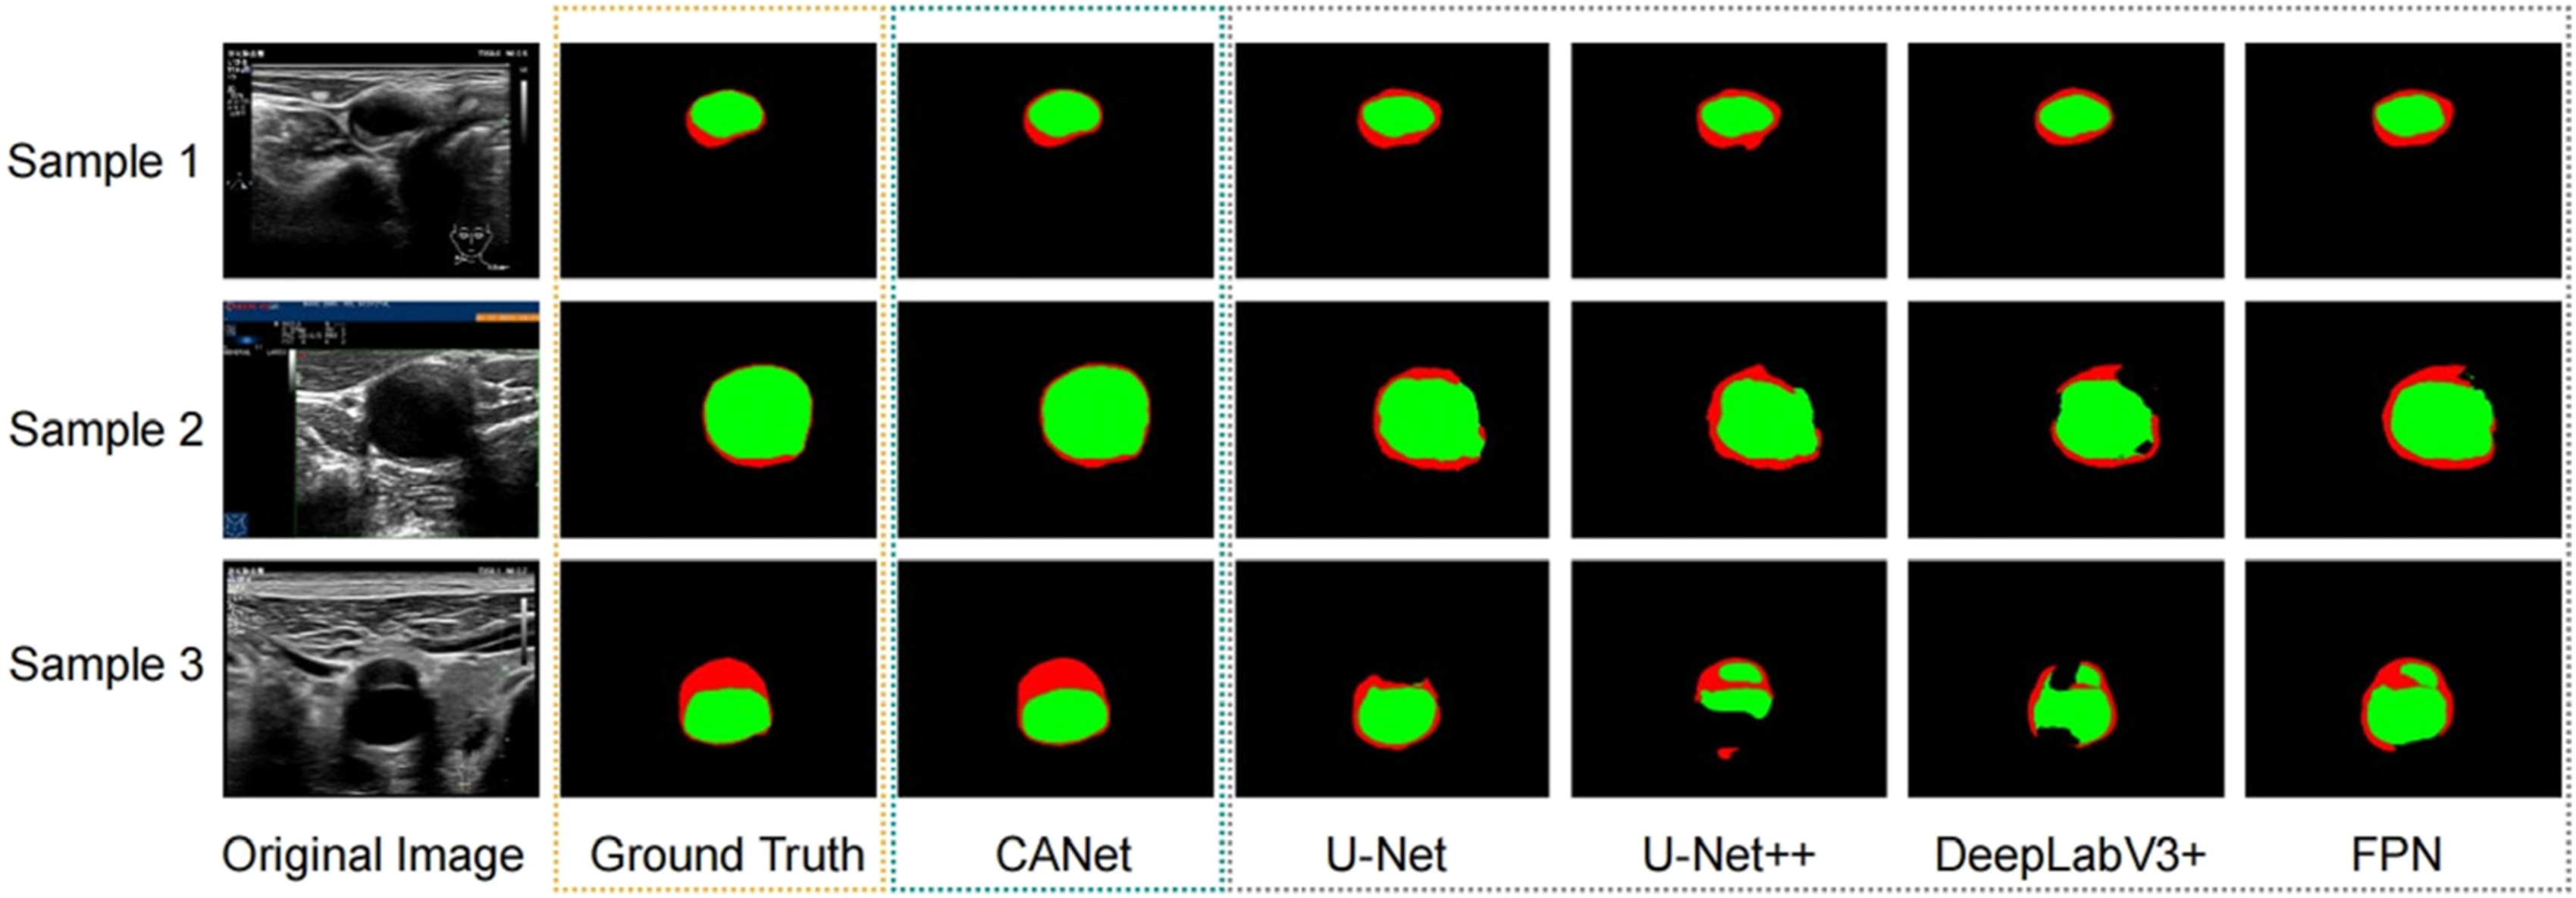
Visualization of comparative results among different models. Cross-model comparisons were conducted on three randomly selected samples, encompassing other widely used deep learning segmentation models such as U-Net, U-Net++, DeepLabV3+, and FPN.
To evaluate the robustness of our CANet model, we conducted an assessment of its performance on an external test set. The results indicate that our model consistently delivers excellent performance with Dice, IoU, precision, recall, assd, hd, and hd95 metrics. Specifically, on the LI border segmentation, our model achieved values of 92.41%, 86.60%, 94.72%, 96.10%, 0.16 mm, 0.59 mm, and 0.43 mm, respectively. On the MA border segmentation, our CANet model demonstrated Dice, IoU, precision, recall, assd, hd, and hd95 values of 93.57%, 88.54%, 92.10%, 96.04%, 0.32 mm, 1.20 mm, and 1.05 mm, respectively (Table 4).
CANet demonstrates high consistency with human experts in the evaluation of stenosis severity rates
To evaluate the consistency and relationship of the stenosis rates between the ground truth and our model predictions, we computed the ICC and Pearson’s Cor for both the internal (Figure 3(a)) and external (Figure 3(b)) test sets. The statistical outcomes demonstrate a significant level of consistency between the two sets of values. For the internal test set, we observed an ICC of 0.927 (95% confidence interval: 0.896 to 0.949) and a Pearson’s Correlation Coefficient of 0.928 (95% confidence interval: 0.897 to 0.949). Similarly, for the external test set, we obtained an ICC of 0.702 (95% confidence interval: 0.600 to 0.782) and a Pearson’s Correlation Coefficient of 0.704 (95% confidence interval: 0.601 to 0.784). These results highlight a robust relationship in our model’s prediction of stenosis rates. The scatter diagram shows the agreement between the ground truth and our model predictions. The scatter diagram and corresponding statistical analysis results for the internal test set are presented in (a), while those for the external test set are shown in (b). Each data point on the diagram represents an individual instance, with the x-axis denoting the ground truth values and the y-axis corresponding to the model predictions of the stenosis severity rate.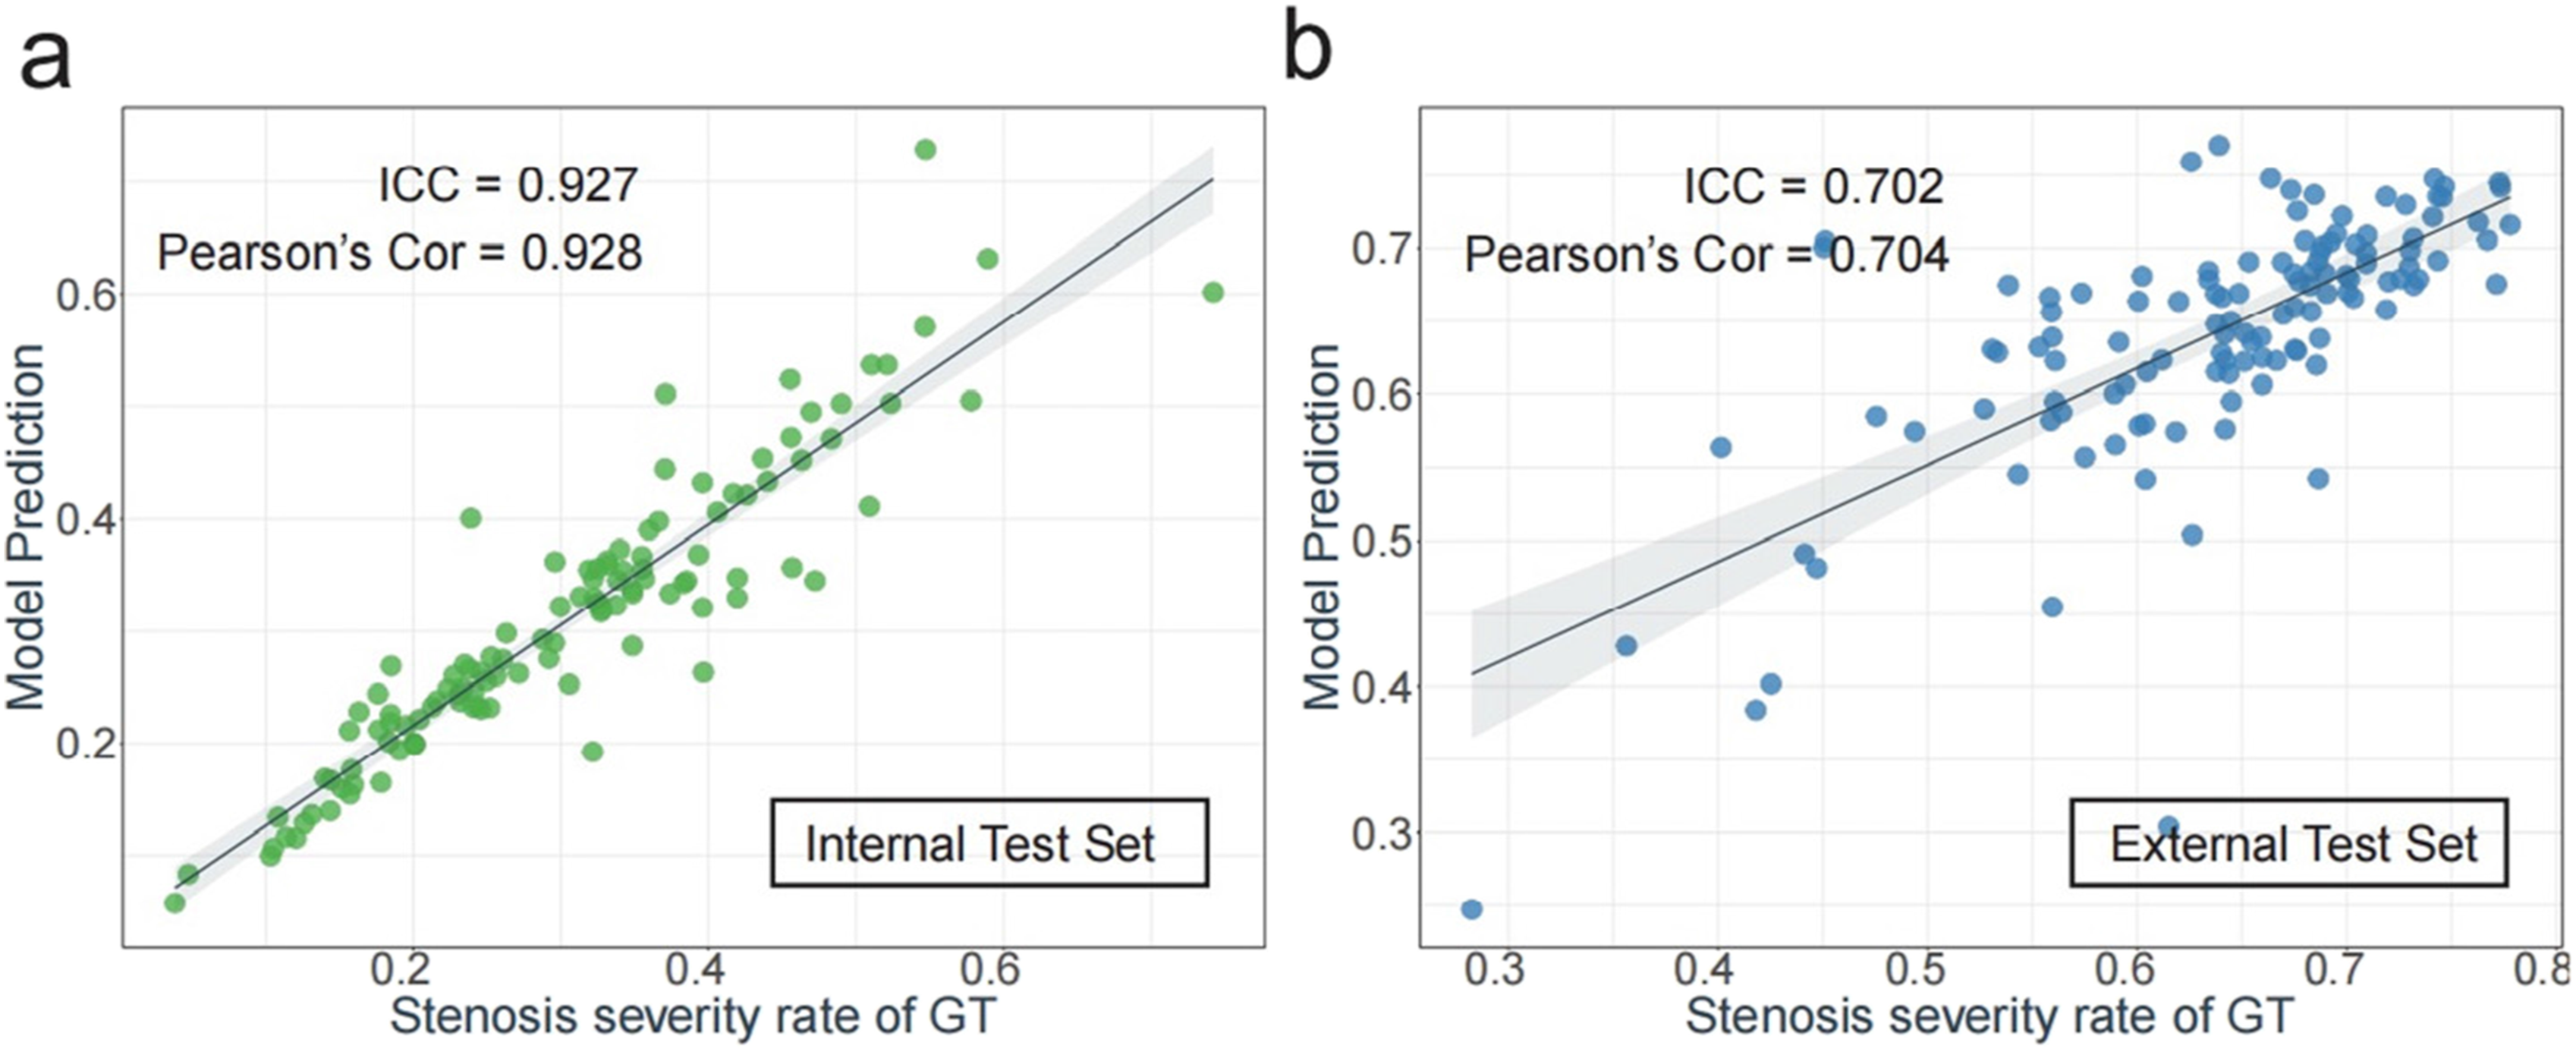
Discussion
In this retrospective study, we successfully developed a CANet model for automatically segmenting structures of CCA transverse section and calculating stenosis severity using deep learning neural works. Our results demonstrated that our model surpassed the four DL-based models included in the study, exhibiting higher Dice and IoU values in segmentation on the internal test set. To further validate the model, we obtained an external dataset, which still produced good performance. Furthermore, the reader study revealed that the stenosis calculation precision of our CANet model was comparable to that of the two experienced sonographers. To the best of our knowledge, this is the first study to construct an AI-ultrasound model to automatically calculate CCA stenosis severity based on transverse section US images.
Regarding the accurate estimation of stroke risk, the study of the morphology of plaque and measuring the stenosis of arterial walls are the two main propositions by using imaging techniques. However, accurately measuring stenosis requires precise delineation of LI and MA borders on CCA. Increasing numbers of studies have adopted AI-ultrasound models to segment structures of CA. Biswas et al. 14 constructed a deep-learning model to accurately measure cIMT in the Japanese diabetic cohort. Similarly, Sudha et al. 13 and Savaş et al. 15 both developed novel methods of using deep Convolutional Neural Network (CNN) for identification and measurement of IMT on the far wall of the artery. Nevertheless, those studies mainly focused on the segmentation of longitude CA images. Plaque segmentation methods which are based on deep convolutional neural networks have made significant improvements and are extensively used due to their fast speed and high accuracy.28–30 However, there are few papers concerning the simultaneous segmentation of plaques and blood vessels. The study by Saba et al. 31 proposed a DL-based methodology for accurate measurement of stenosis in CCA US scans using a class of AtheroEdge system from AtheroPoint, USA. They applied NASCET criteria for computing the stenosis severity index on the B-mode longitude section. However, in actual clinical practice, precise stenosis severity evaluation needs to be combined with peak systolic velocity (PSV) measurement of Pulse Wave Doppler on most stenosis locations. Stenosis severity index calculation only based on the B-mode longitude section could generate bias due to the non-most stenosis site. To avoid these shortcomings and optimize the model design, we performed an AI-US model using CCA transverse section images and simultaneously segmenting lumen and plaques, resulting in more reasonable interpretations.
Our results showed that despite the CCA structure with poor image quality and the existence of multiple plaques, DL was able to provide accurate segmentation and estimates of stenosis severity on transverse section images. Additionally, the segmentation performance of our CANet model was superior to the discussed four models, with high Dice coefficients of 95.22% on LI borders and 96.27% on MA borders on the internal test set. When testing the generalizability of our model on an external dataset from another hospital, we found that our model still generalized well, with a Dice coefficient of 92.41% on LI borders and 93.57% on MA borders. Furthermore, our results underscore a strong relationship in our model’s prediction of stenosis severity rates, as evidenced by an ICC of 0.927 and a Pearson’s Correlation Coefficient of 0.92 between the model predictions and ground truth in the internal test set.
There is an emergency need for standardization of stenosis measurement for patients as it determines the future course of stroke treatment. Schneider et al. 32 presented that carotid endarterectomy or stenting in addition to medical therapy is still the best way to treat mostly asymptomatic patients with 60% to 99% carotid stenosis. In this regard, the proposed method in this study provided a precise and reliable way to estimate carotid stenosis severity with low inter-observer variability.
Our study does exhibit several limitations. Firstly, our focus on 2-D US images was restricted to the common carotid artery (CCA), excluding images of the internal carotid artery (ICA), external carotid artery (ECA), or carotid bifurcation. Consequently, manual marking of these sites is necessary. Secondly, the proposed CANet is designed solely for segmenting static CCA images and was not trained for video inputs. Thirdly, our proposed CANet model, which substitutes the encoder with EfficientNet, exhibits enhanced effectiveness compared to U-Net. However, real-world clinical validation of this intricate model has not been conducted. Future research endeavors should include testing the model in genuine clinical settings to validate its utility and efficacy. Lastly, the development of our model relied on a dataset comprising 390 cases, with external testing conducted on an additional 122 cases. While this dataset facilitated initial model evaluation, its size remains limited. Further studies with a larger sample size are imperative to comprehensively assess the performance of our model.
Conclusion
We successfully proposed a CANet model with excellent performance in segmentation and automatically calculating CCA stenosis severity, which achieved comparable results to experienced sonographers and significantly outperformed currently used DL methods. The convincing stability of our model allows the generalization of images obtained by diverse levels of sonographers, which greatly decreases inter-observer variability in clinical practice.
Supplemental Material
Supplemental Material - A deep learning-based calculation system for plaque stenosis severity on common carotid artery of ultrasound images
Supplemental Material for A deep learning-based calculation system for plaque stenosis severity on common carotid artery of ultrasound images by Mengmeng Liu, Wenjing Gao, Di Song, Yinghui Dong, Shaofu Hong, Chen Cui, Siyuan Shi, Kai Wu, Jiayi Chen, Jinfeng Xu, and Fajin Dong in Vascular.
Footnotes
Author contributions
LMM and GWJ made substantial contributions to the study’s conception, performed image analysis and data curation, and wrote the manuscript. HSF and DYH performed ultrasound examinations, obtained informed consent, and analyzed the data. SD and DFJ performed image analysis and collected the data. SSY and CJY contributed to conceptualization and software. CC, SSY, and CJY contributed to manuscript reviewing and editing. DFJ and XJF contributed to project administration, funding acquisition, and supervision. WK contributed to revision process. All authors read and approved the final manuscript.
Declaration of conflicting interests
The author(s) declared no potential conflicts of interest with respect to the research, authorship, and/or publication of this article.
Funding
The author(s) disclosed receipt of the following financial support for the research, authorship, and/or publication of this article: This work was funded by The National Key Research and Development Program of China (2022YFC3602400) and Clinical Scientist Training Program of Shenzhen People’s Hospital (SYWGSCGZH202202).
Data availability statement
The data used in our research can be available from the corresponding authors if necessary.
Supplemental Material
Supplemental material for this article is available online.
References
Supplementary Material
Please find the following supplemental material available below.
For Open Access articles published under a Creative Commons License, all supplemental material carries the same license as the article it is associated with.
For non-Open Access articles published, all supplemental material carries a non-exclusive license, and permission requests for re-use of supplemental material or any part of supplemental material shall be sent directly to the copyright owner as specified in the copyright notice associated with the article.