
Abstract
Objective
Iliac limb branch occlusion after endovascular aneurysm repair (EVAR) creates risk for limb or pelvic ischemia. This study aims to explore the hemodynamic factors associated with eventual iliac branch occlusion after EVAR for abdominal aortic aneurysm.
Methods
Six patients with different causes of iliac branch occlusion were selected between January 2013 and December 2023, and computed tomography angiography (CTA) images were acquired at the time of preoperative and postoperative occlusion of EVAR. Specific CTA images were applied for modeling and computational fluid dynamics (CFD) analysis was implemented.
Results
Pressure, velocity, wall shear stress (WSS), time-averaged wall shear stress (TAWSS), oscillatory Shear Index (OSI), and relative residence time (RRT) were calculated. Velocity, WSS, and TAWSS were elevated at the stenosis, and pressure, OSI, and RRT were decreased at the stenosis. Streamlines were reduced at stenotic sites. Iliac branch locations that eventually occluded had more disturbed flow compared to non-occluded sites. Both pressure and flow velocity gradient variations are greater on the occluded side than on the non-occluded side.
Conclusions
Computational fluid hemodynamic analysis identified consistent flow disturbances associated with eventual iliac limb occlusion following EVAR. These findings suggest that CFD-based hemodynamic assessment may help stratify patients at risk of iliac branch occlusion before clinical manifestation.
Introduction
In 1991, Parodi et al. 1 firstly reported endovascular aneurysm repair (EVAR) for abdominal aortic aneurysm. EVAR isolates the aneurysm from circulation by placing a stent-graft within the abdominal aortic aneurysm through a femoral artery approach. 1 EVAR is now the first-line treatment for infrarenal abdominal aortic aneurysms with appropriate anatomical conditions for its low perioperative complications and mortality. 2 However, EVAR still has challenges, including endoleak, stent-graft displacement, stent-graft occlusion, and infection. 3 Stent-graft occlusion was mainly dominated by limb graft occlusion, and the incidence of postoperative limb graft occlusion was about 2.6–7.4%. 4 Conrad et al. 5 reported that limb graft occlusion accounted for 18% of the causes of re-intervention. Limb graft occlusion has been defined as occlusion of unilateral or bilateral iliac artery endografts after EVAR. 6
Computational fluid dynamics (CFD) can accurately simulate aortic conditions with high biological relevance by modeling the patient’s actual aortic parameters. 7 Tzirakis et al. 8 assessed the relationship between morphological features and hemodynamics of abdominal aortic aneurysms by CFD. Shek et al. 9 compared the hemodynamic differences between conventional and cross-limb EVAR using CFD.
Although there have been reports in the literature on the factors affecting limb graft occlusion after EVAR. Lin et al. 10 suggested that iliac artery tortuosity was the primary factor contributing to limb graft occlusion after EVAR in 56% of cases. Moulakakis KG et al. 6 showed that peripheral calcification of the iliac arteries greater than 50% was one of the factors associated with limb graft occlusion. However, there is limited literature focusing on the hemodynamic features leading to limb graft occlusion after EVAR. The aim of this study was to investigate the hemodynamic characteristics of limb graft occlusion after EVAR.
Materials and methods
Study population
Details of the 6 patients.
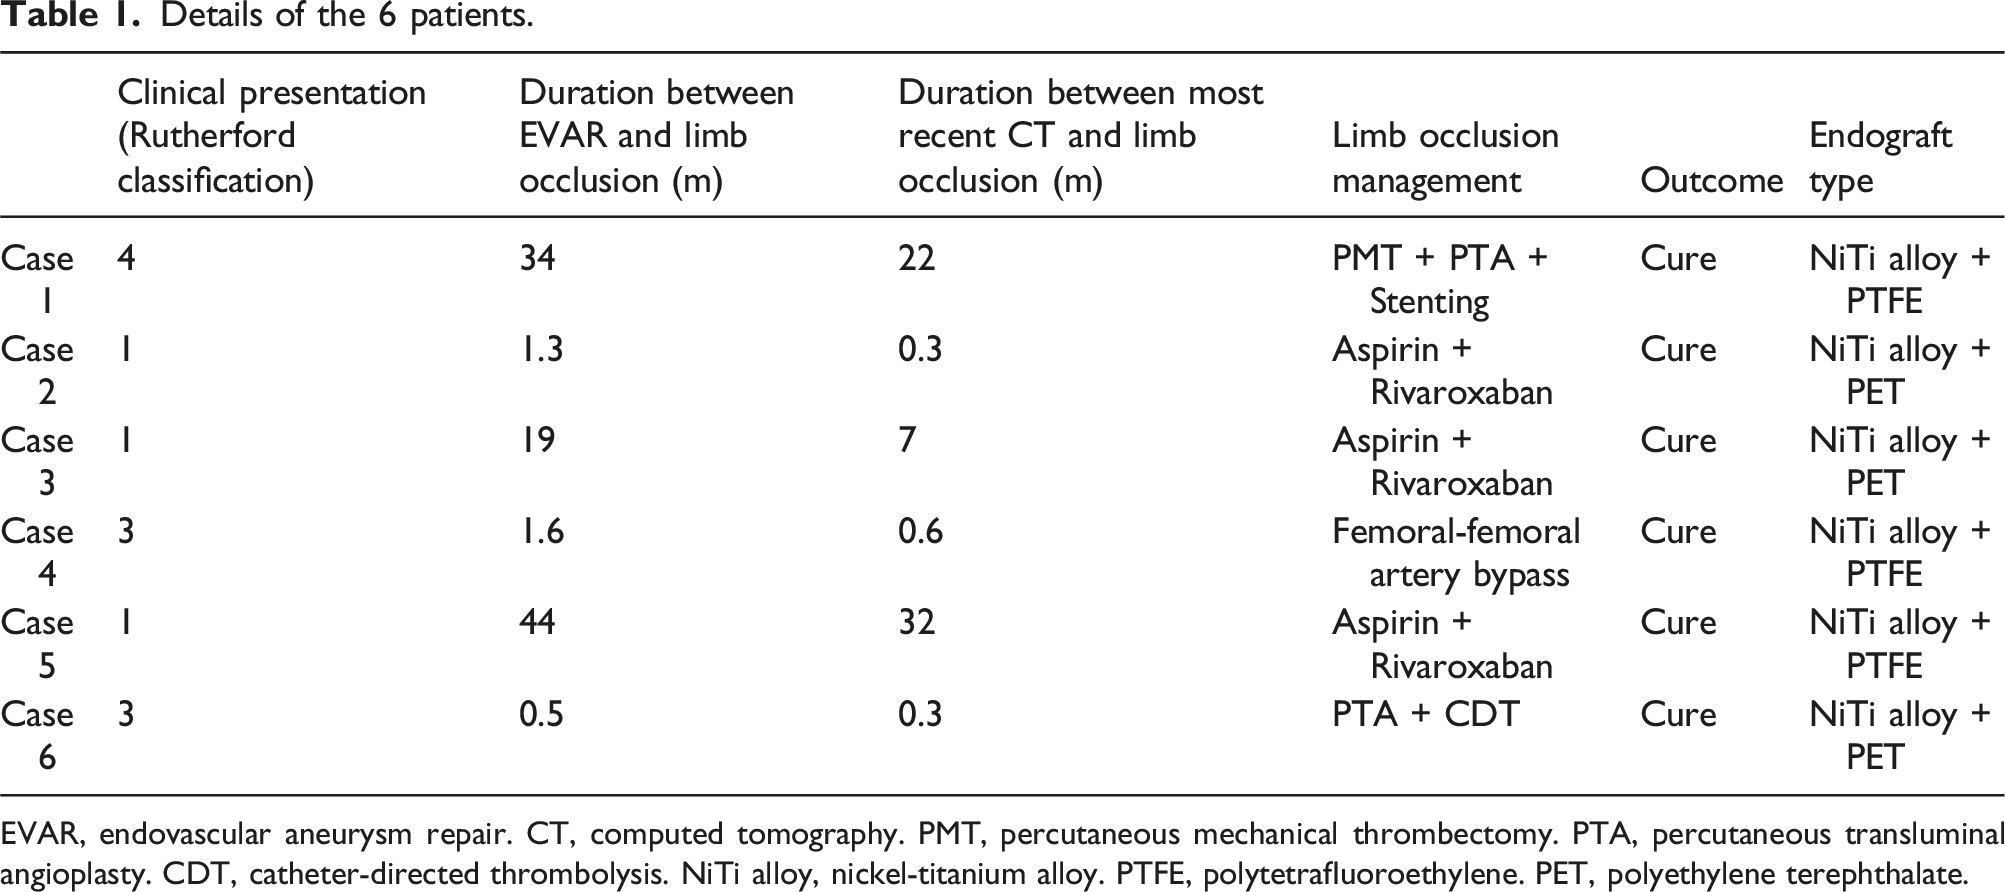
EVAR, endovascular aneurysm repair. CT, computed tomography. PMT, percutaneous mechanical thrombectomy. PTA, percutaneous transluminal angioplasty. CDT, catheter-directed thrombolysis. NiTi alloy, nickel-titanium alloy. PTFE, polytetrafluoroethylene. PET, polyethylene terephthalate.
3D modeling and simulation
CTA images of abdominal aortic aneurysm were acquired and stored in digital imaging and communications in medicine (DICOM) format. CTA images of a normal abdominal aorta from the corresponding period were also included as a control group. The CTA images of the study subjects were imported in the image processing software Mimics 21.0 (Materialise, version 21.0, RRID:SCR_012153) to build a 3D model. The generated 3D model of abdominal aorta was imported into Ansys software (Ansys, version 2021, RRID:SCR_022135) for further optimization and meshing was performed in Ansys Mesh module (Ansys, version 2021, RRID:SCR_022135).
The calculations were performed in the Solution module of Ansys software (Ansys, version 2021, RRID:SCR_022135). The state of blood flow was set to be turbulent. The blood was an incompressible Newtonian fluid. The blood flow density was 1050 and viscosity was 0.0035 Pa/s. A transient computational model was used. The inlet boundary condition was set to be a time-varying velocity-inlet, and the outlet was set to be a pressure outlet, and Figure 20 showed the inlet blood flow velocity change curve. The vessel wall was set to be rigid without slip. The cardiac cycle was set to 0.8 s, and the time step of the calculation process was 0.01 s, and the calculation results converged after two heart cycles. The blood flow in the vessel satisfies the Navier–Stokes equation. The calculation indexes include pressure, velocity, streamline, wall shear stress, time-averaged wall shear stress (TAWSS), oscillatory shear index (OSI), and relative residence time (RRT).
Results
Normal abdominal aorta
The hemodynamic distribution of the normal abdominal aorta is shown in Figure 1. In the normal artery, the streamlines are uniform and linear. High WSS and TAWSS are seen at the bifurcation. Pressure and RRT decreases from proximal to distal, and OSI is uniformly distributed in the model. Cross-sectional velocity and pressure distributions in the common iliac and external iliac arteries are shown in Supplemental Figure 1. Hemodynamics of normal abdominal aortic mode.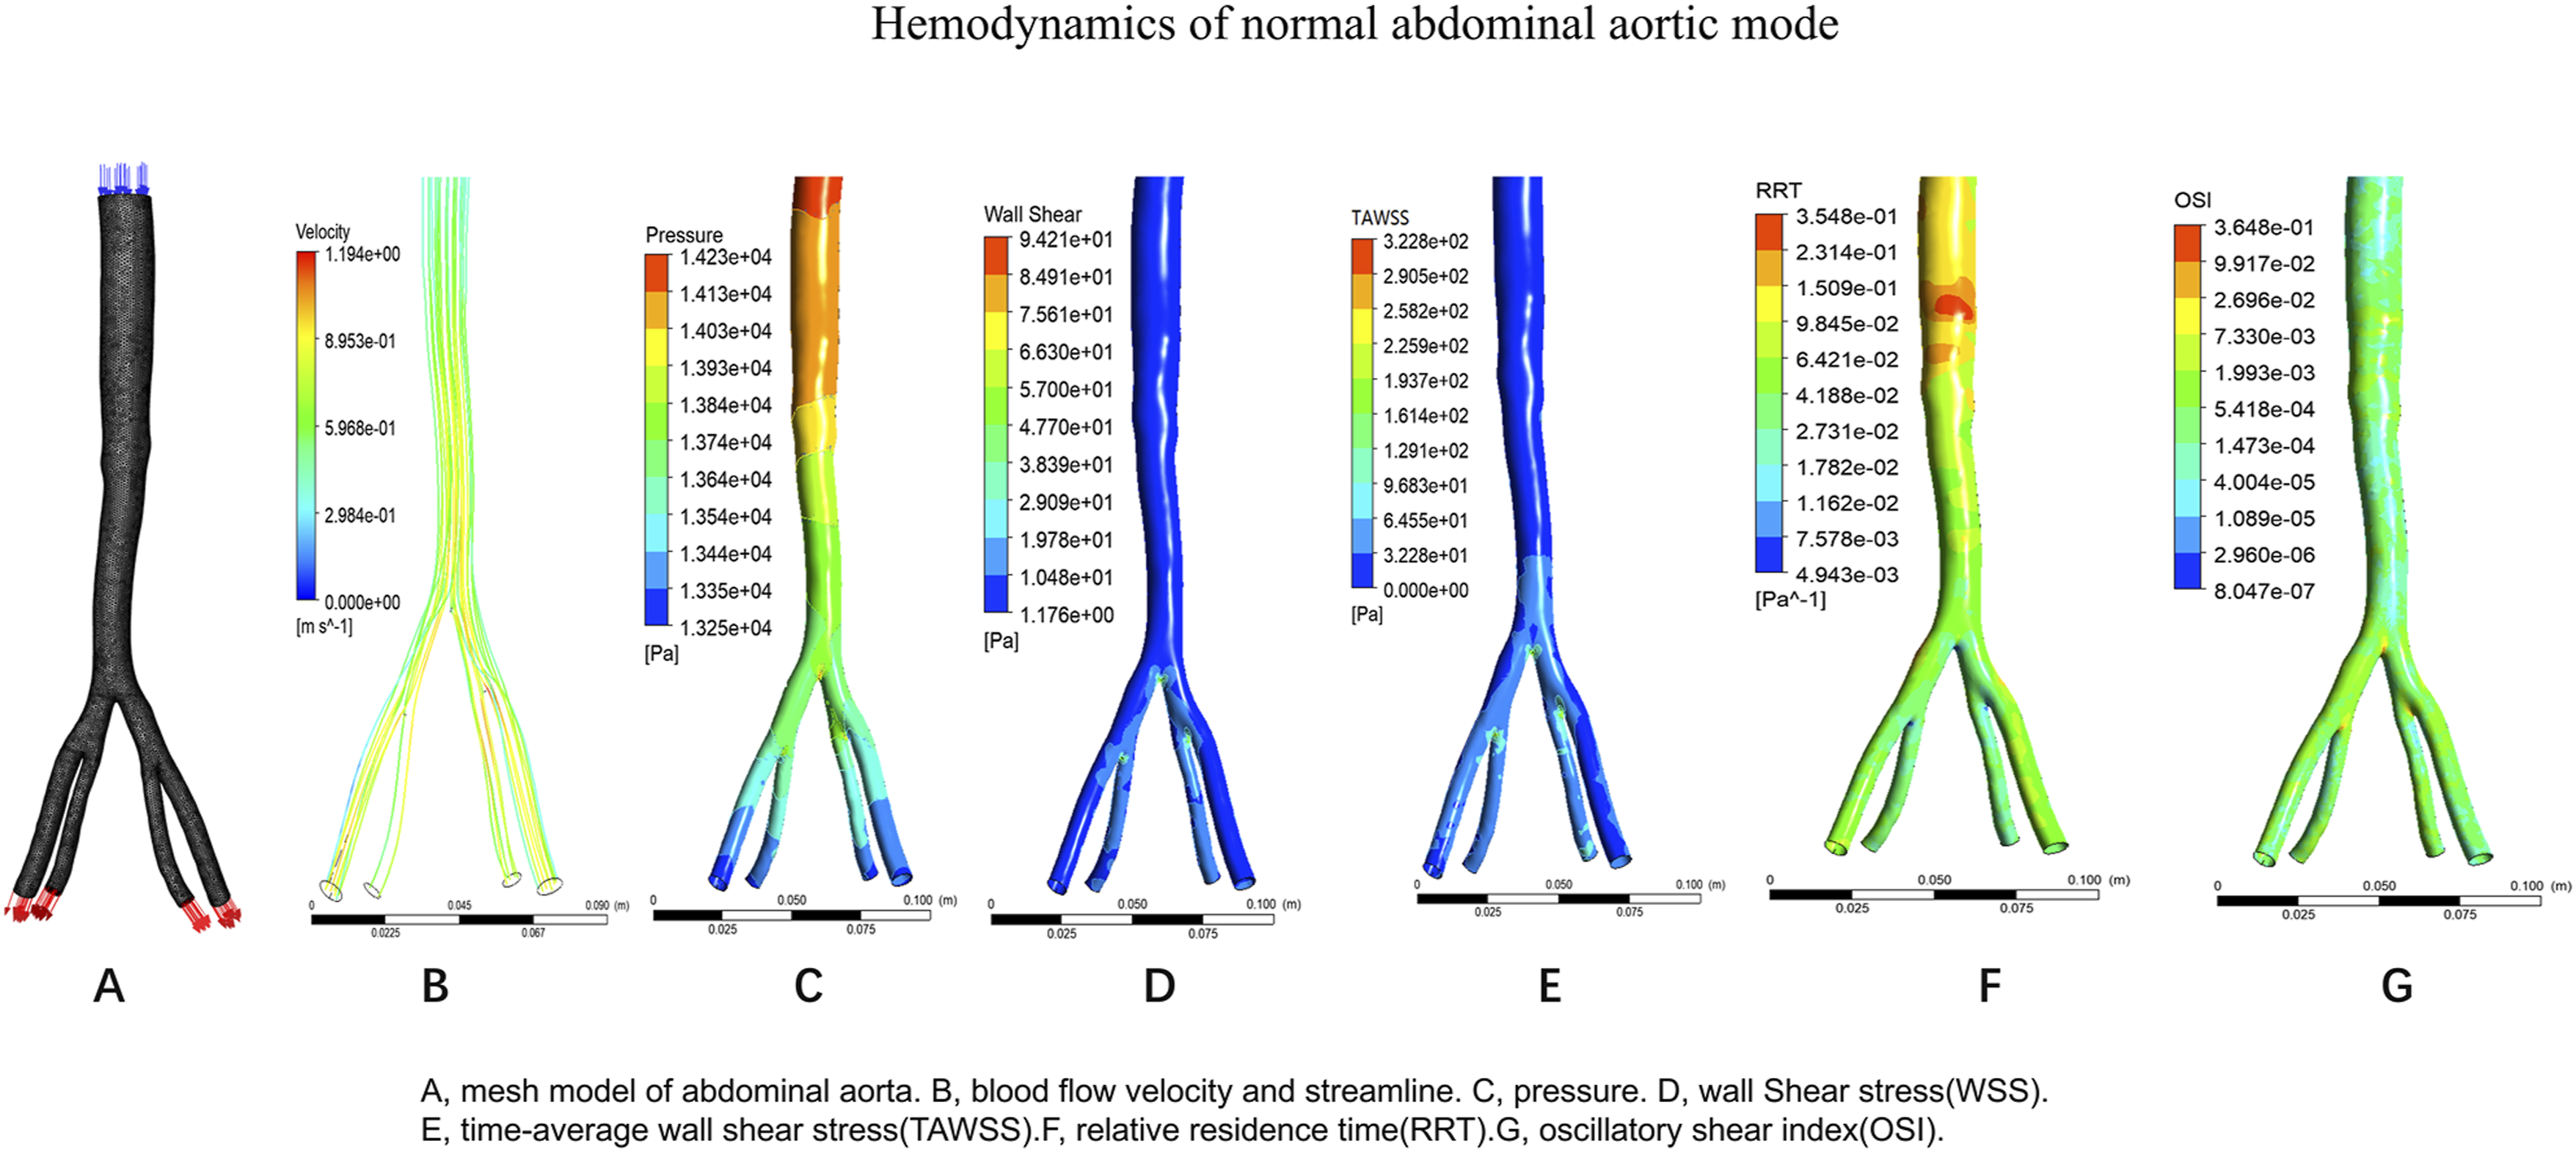
Case 1 postoperative abdominal aorta
The postoperative CTA of EVAR suggested that the stent was uncompressed, and it was hypothesized that the occlusion of the left iliac artery might be related to only the external iliac artery as an outflow tract with calcified stenosis. The postoperative hemodynamic distribution in Case 1 is shown in Figure 2. The postoperative model has 140468 nodes and the grid is divided into 502877 cells. Velocity, WSS, and TAWSS were elevated at the stenosis, and pressure, OSI, and RRT were decreased at the stenosis. The left external iliac artery streamline was less than that of the right side, suggesting less blood flow through the left iliac artery. Cross-sections were taken from the distal anchoring sites of bilateral iliac branch stents, and we found that the gradient of pressure and Velocity varied more in the left external iliac artery than in the right common iliac artery (Supplemental Figure 2). Hemodynamics of case 1 postoperative model.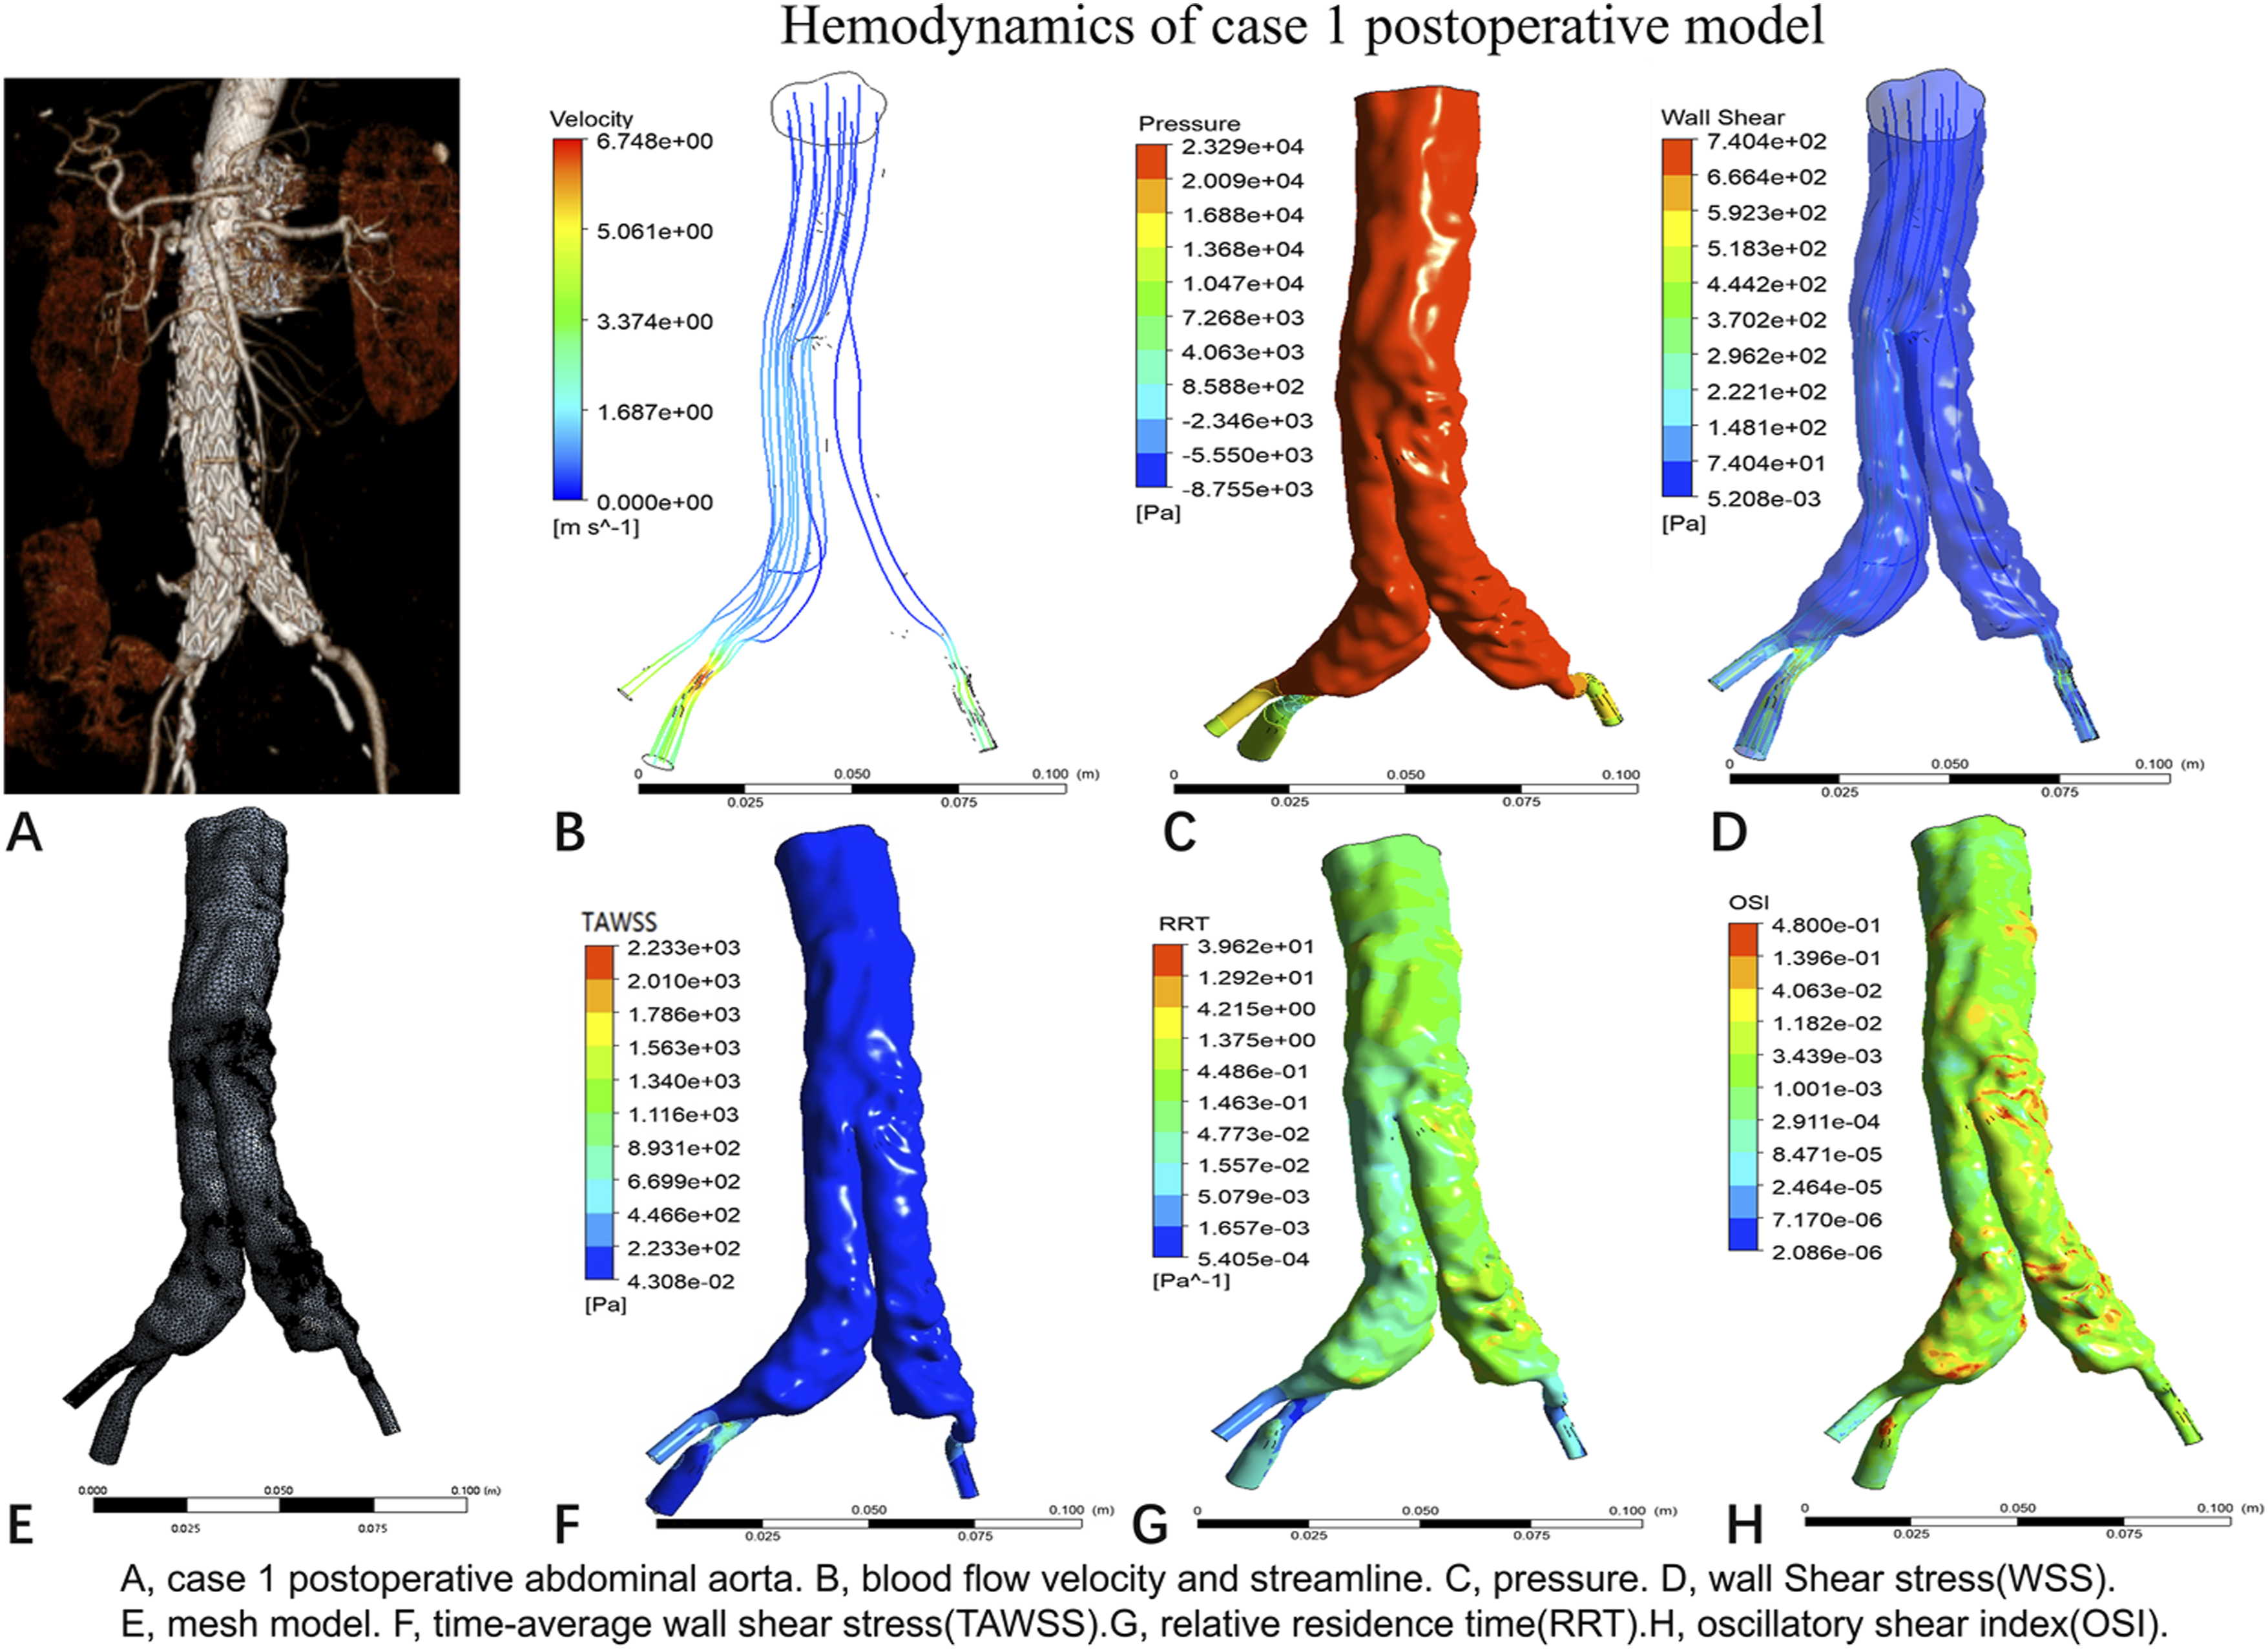
Case 1 preoperative abdominal aorta
Case 1 preoperative CTA suggested that the patient had calcified stenosis of the terminal abdominal aorta and bilateral common iliac arteries. The preoperative model had 65658 nodes and was meshed into 229733 units. WSS and TAWSS were elevated at the bifurcation and stenosis sites (Figure 3). The left external iliac artery streamline was less than the right (Figure 3(b)). The cross section suggests that the left external iliac artery is more pressurized than the right common iliac artery (Supplemental Figure 3). Hemodynamics of case 1 preoperative model.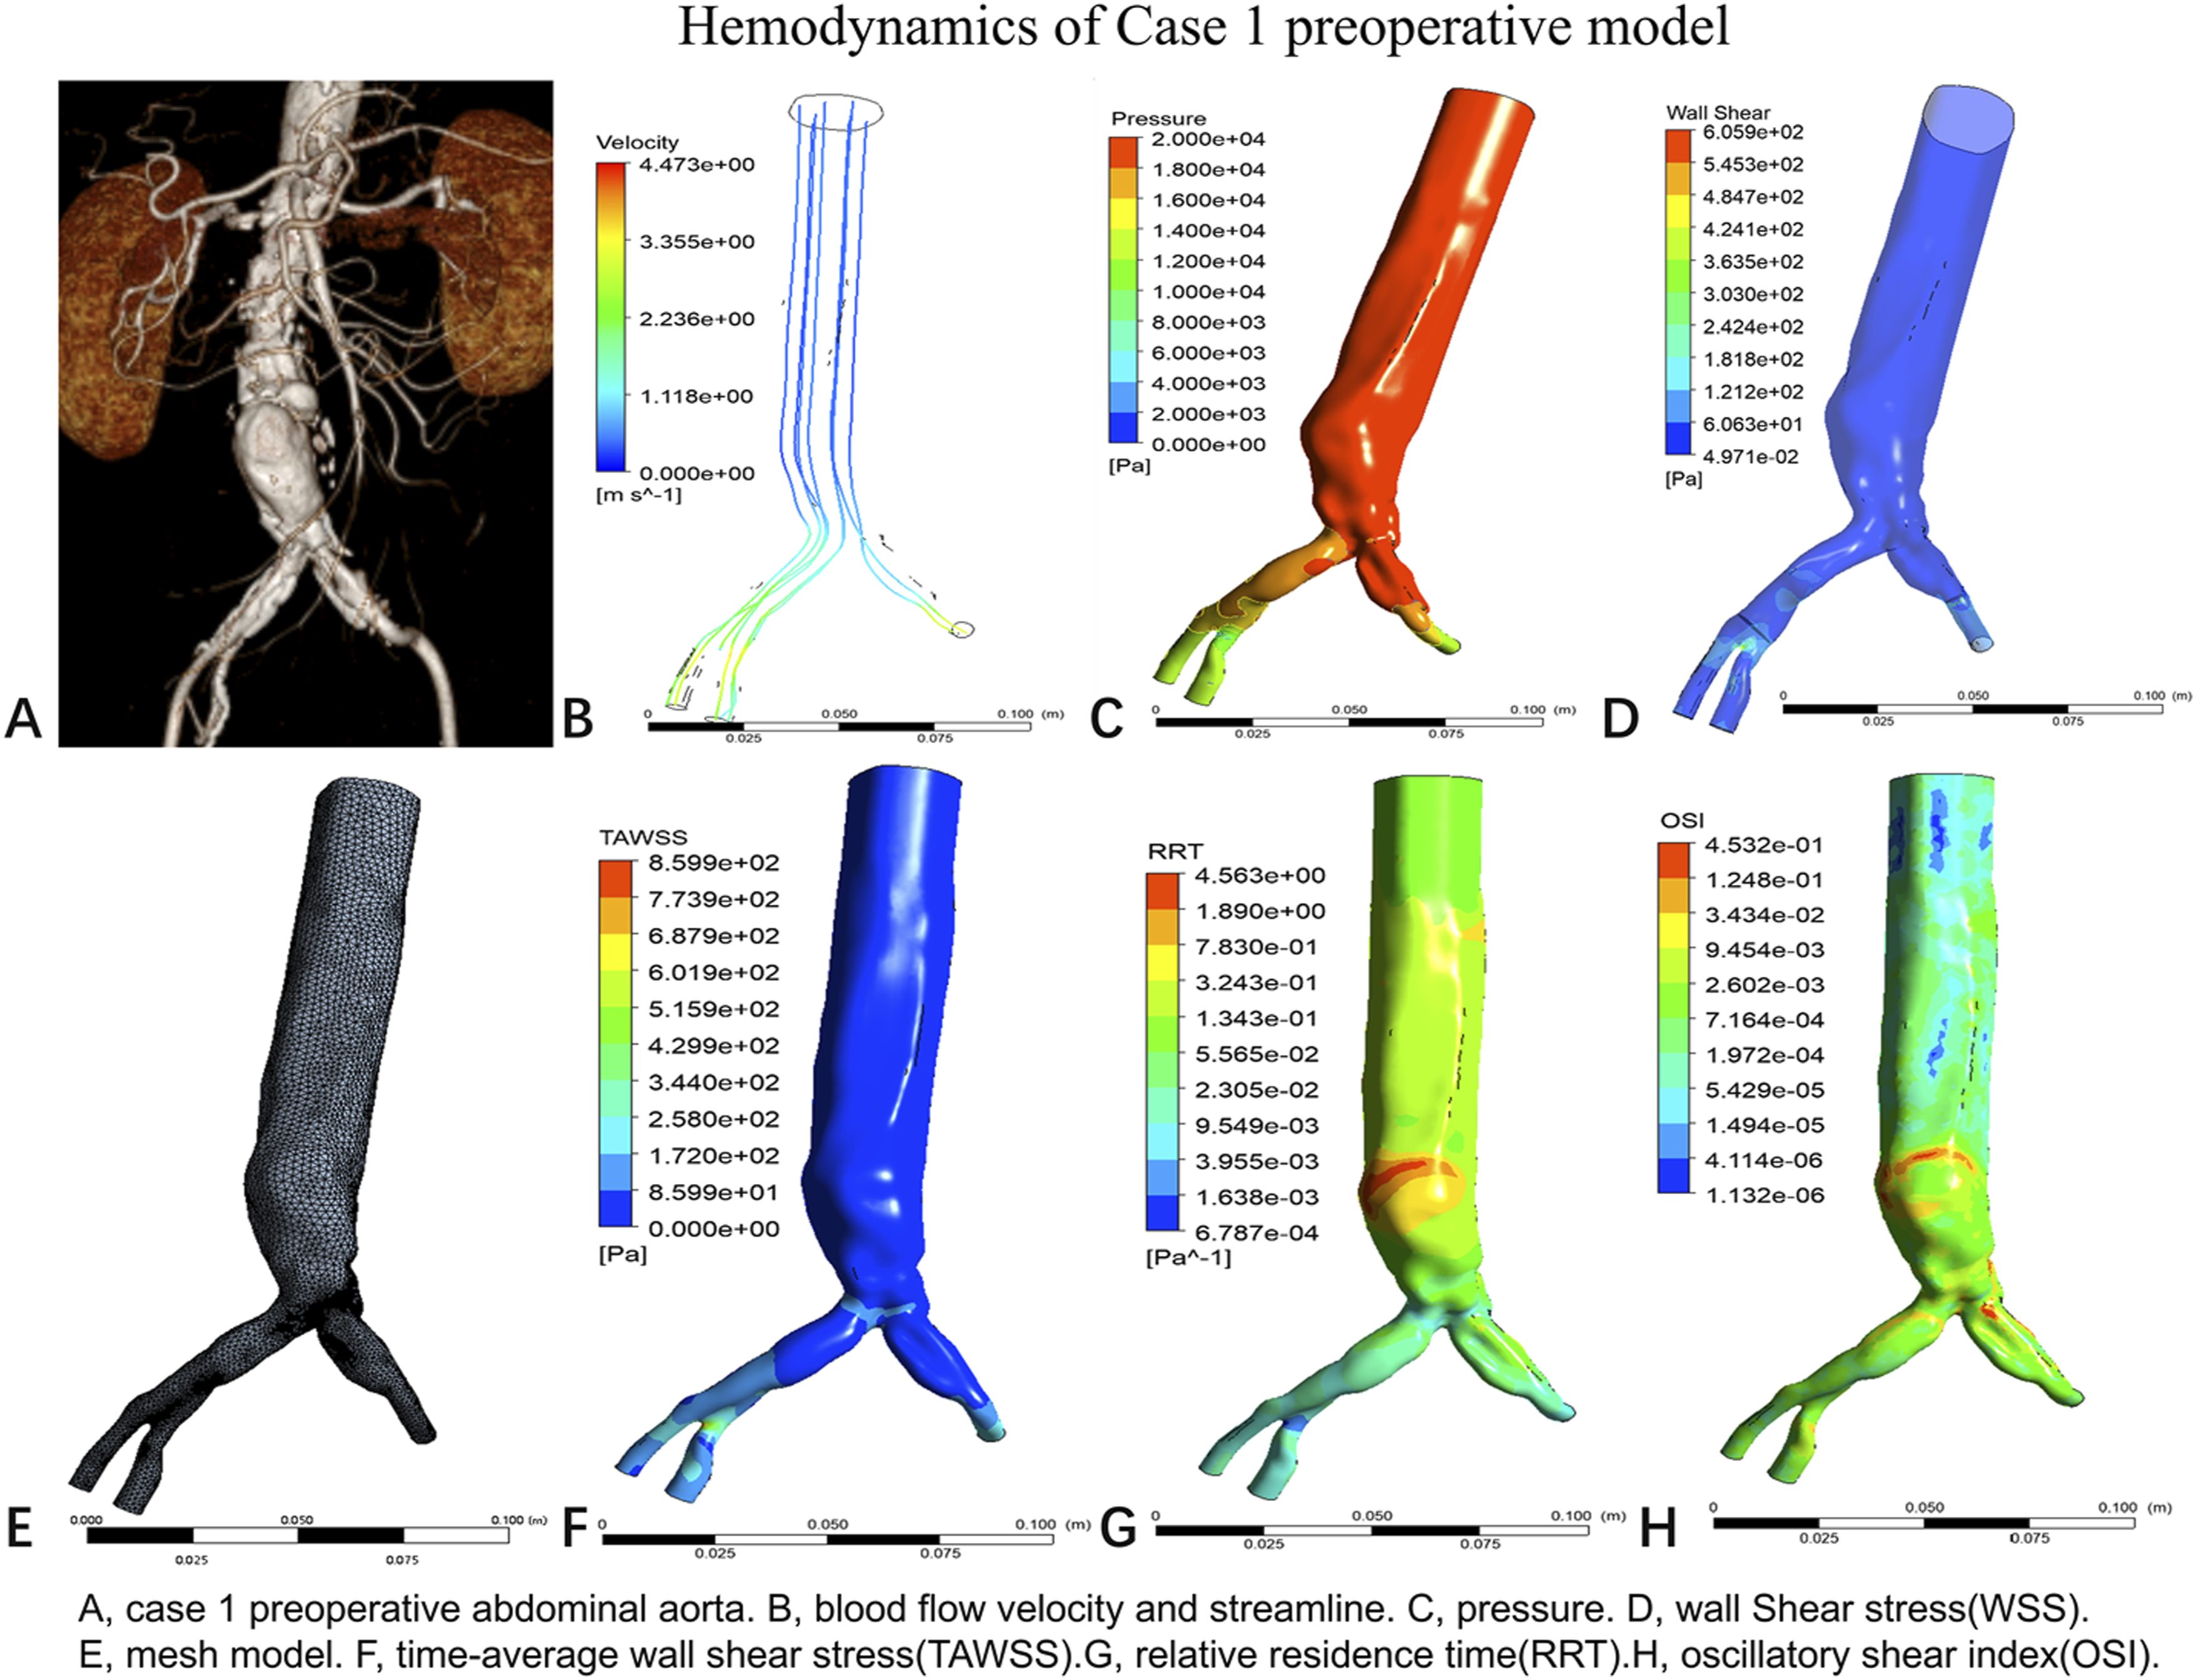
In Case 1, the origin of the left external iliac artery was selected as point P1 and the corresponding part of the right external iliac artery was selected as point P2, and the TAWSS change for one cardiac cycle was calculated. Comparison of the TAWSS with that of the normal aortic model is shown in Supplemental Figure 4, and we found that the TAWSS was higher at point P1 than at point P2. Postoperatively, the TAWSS was lower at P1 than preoperatively. Postoperative TAWSS was higher at P2 than preoperative.
Case 2 postoperative abdominal aorta
The postoperative hemodynamic distribution in Case 2 is shown in Figure 4. The postoperative model nodes for case 2 were 292280 and the grid was 1045739 units. Left common iliac artery pressure was lower than that of the right common iliac artery, and WSS and TAWSS were elevated at the stenosis location. OSI and RRT were elevated at the stenosis and tortuous sites. The postoperative right external iliac artery had less streamline and lower velocity than the left. Taking cross sections at the exit of the left common iliac artery stent and the right external iliac artery suggested that the variation in pressure and velocity were greater in the left common iliac artery than in the right external iliac artery (Supplemental Figure 5). Hemodynamics of case 2 postoperative model.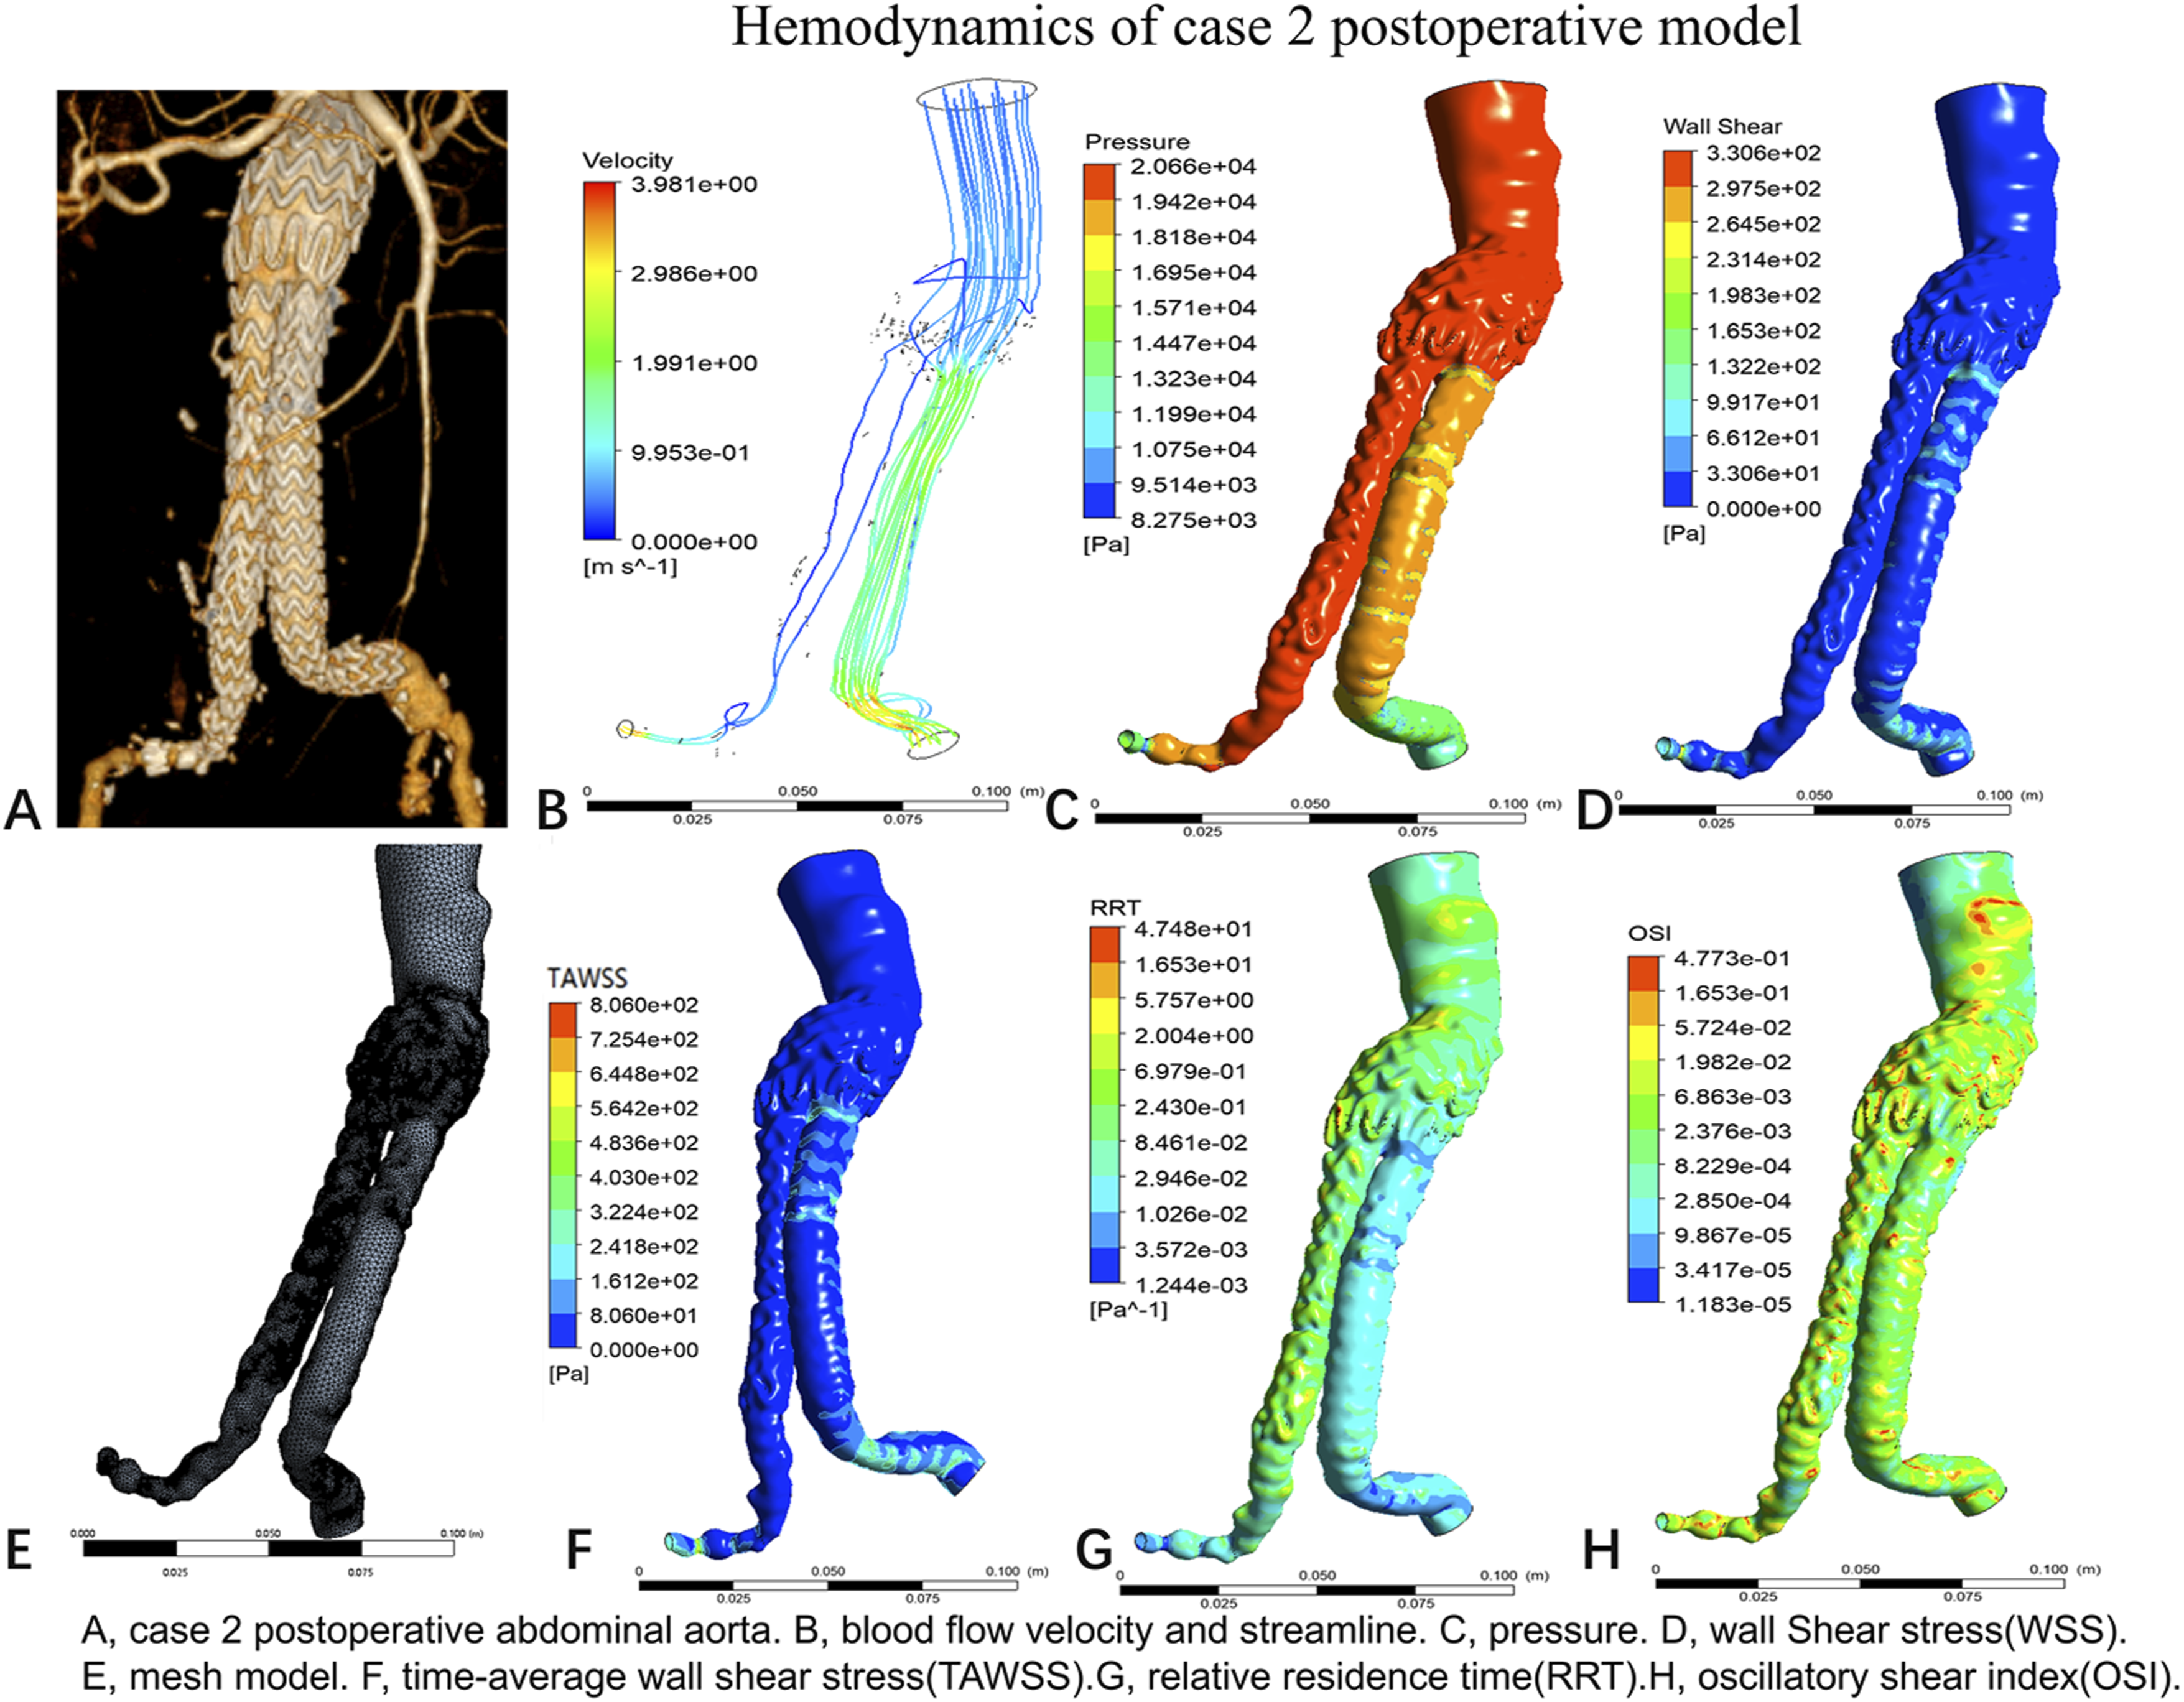
Case 2 preoperative abdominal aorta
The preoperative hemodynamic distribution in Case 2 is shown in Figure 5. Case 2 Preoperative CTA suggested twisting and stenosis of the right common iliac artery. The preoperative model nodes were 101239 and the grid was 358249 units. The results showed reduced outlet area and high pressure in the right common iliac artery. The right external iliac artery pressure was higher than the left external iliac artery. In the right external iliac artery, there was slower blood flow, less streamline, and more disturbed flow than in the left external iliac artery. Cross-sections taken preoperatively at the left common iliac artery and the right external iliac artery suggest a greater variation in velocity within the right external iliac artery than in the left external iliac artery (Supplemental Figure 6). Hemodynamics of case 2 preoperative model.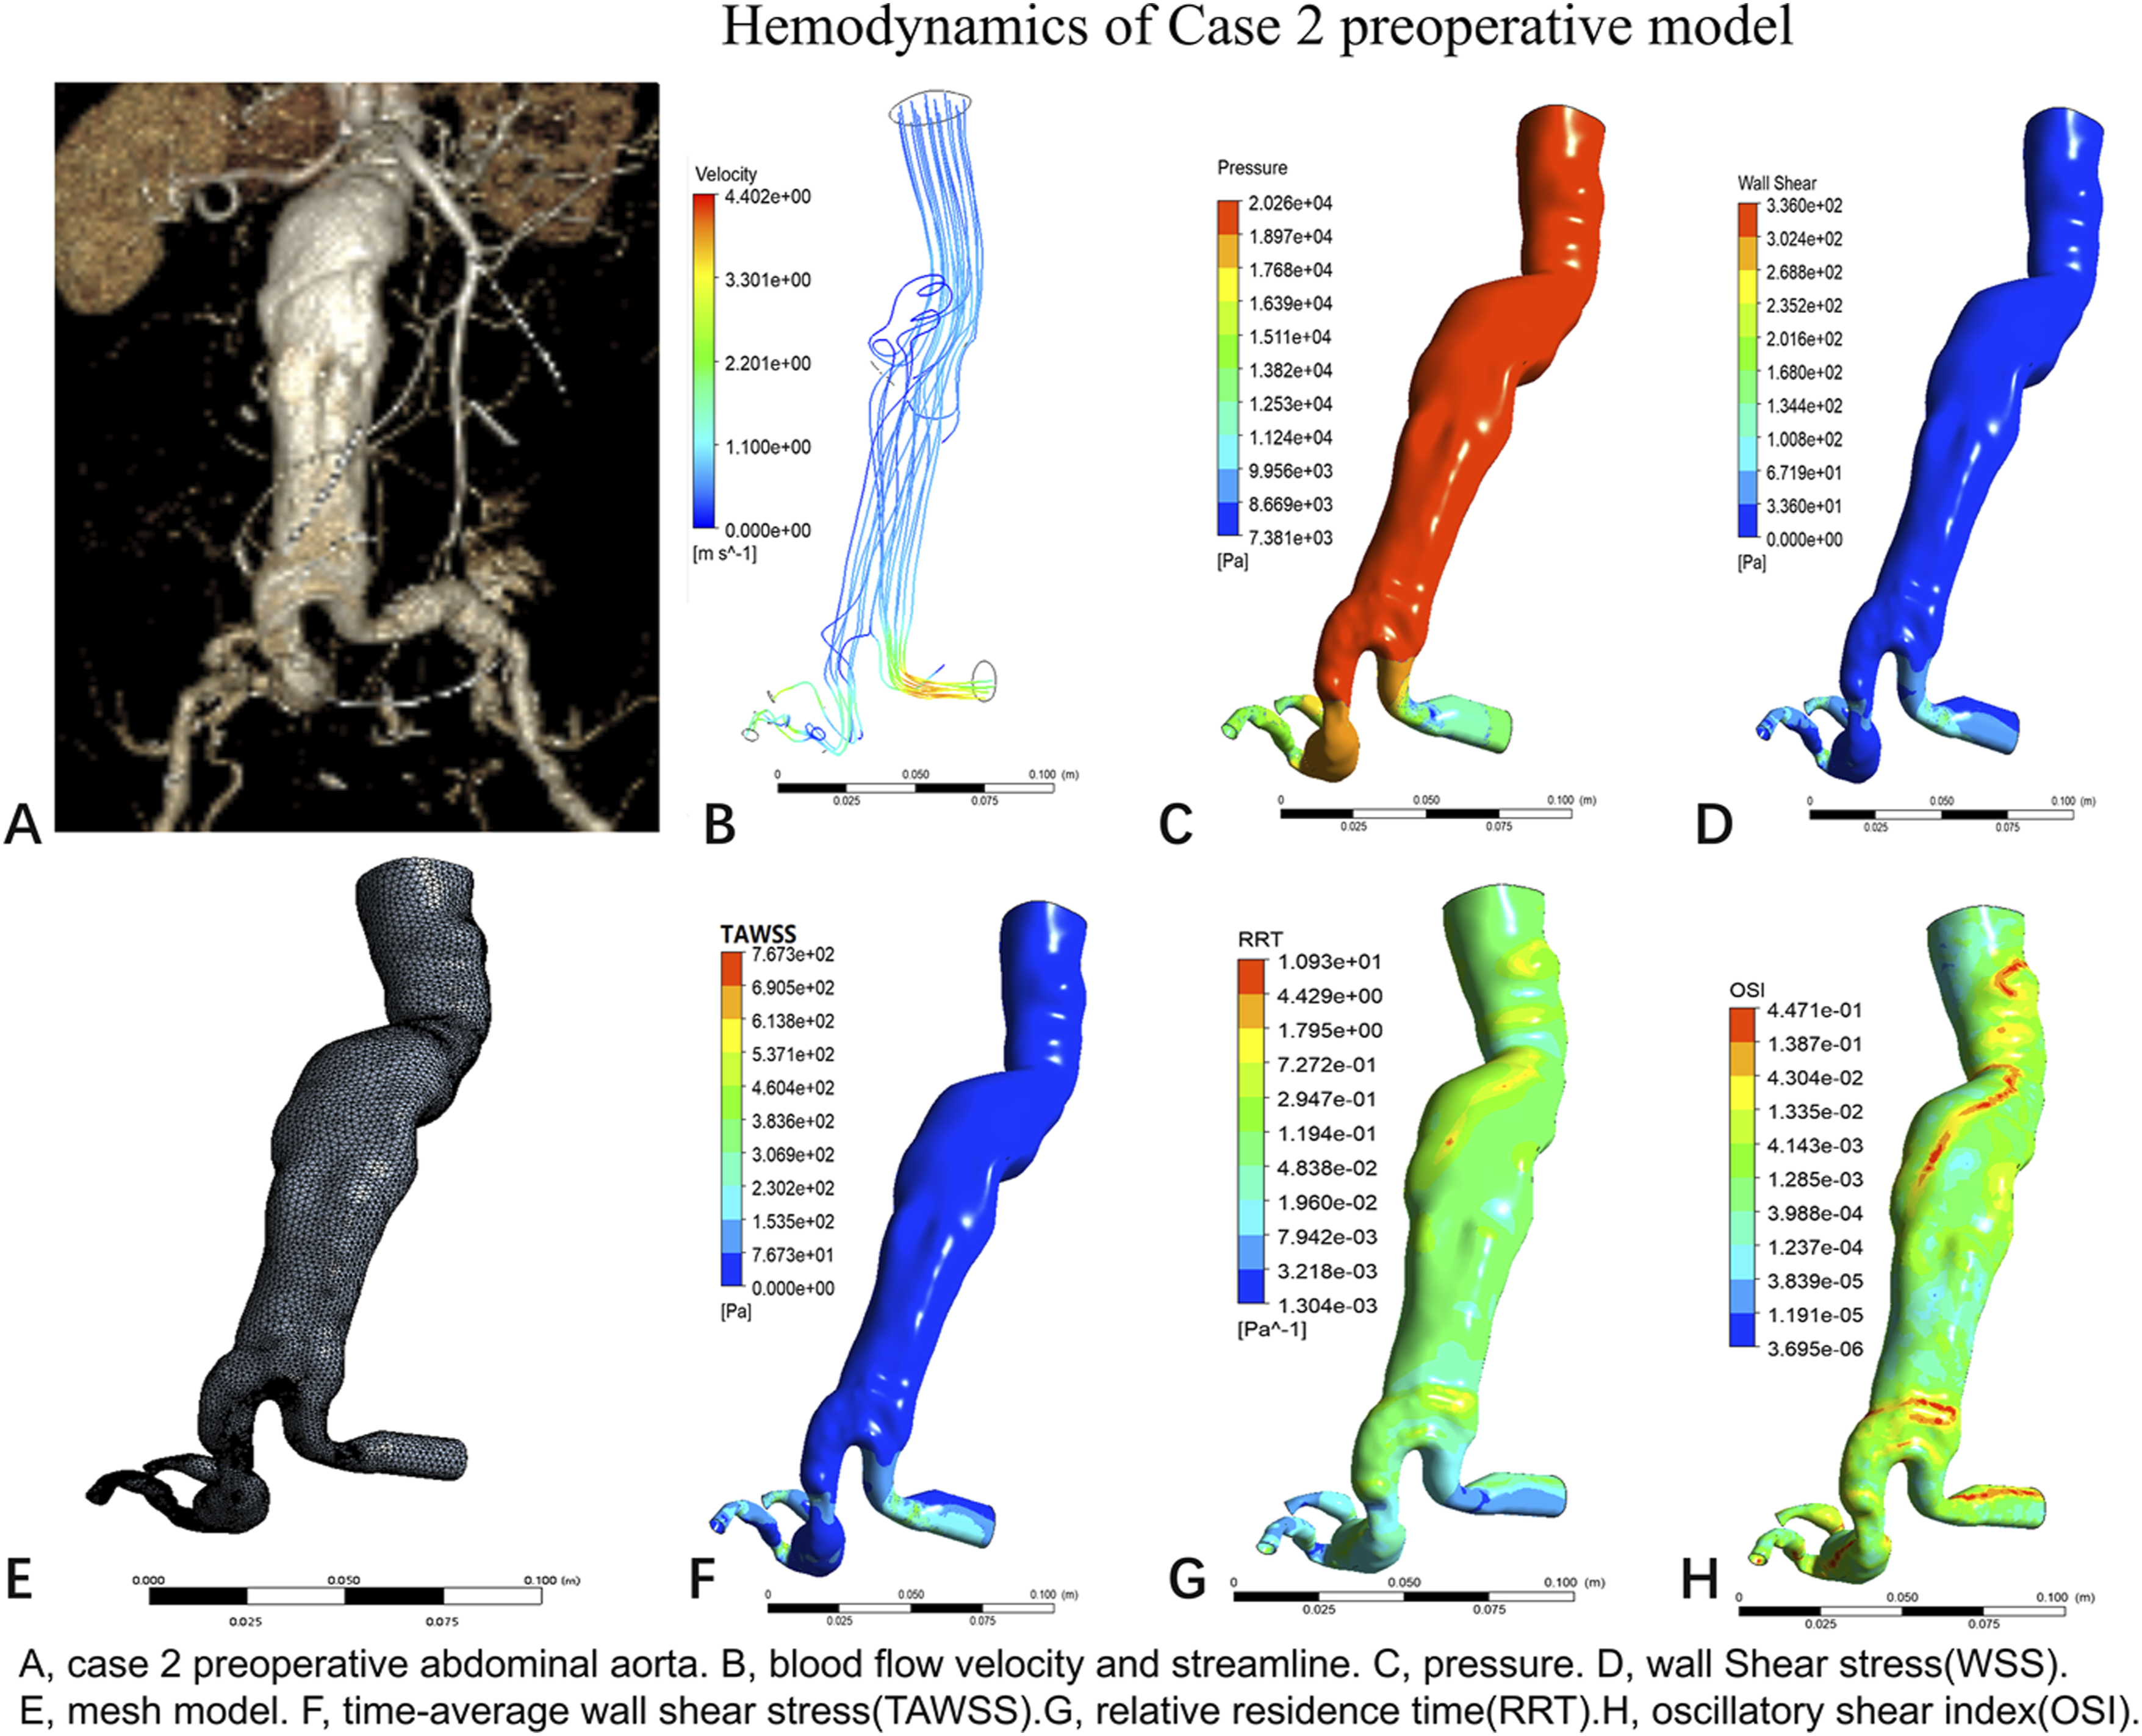
In Case 2, the beginning of the right external iliac artery was selected as point P1 and the beginning of the left common iliac artery was selected as point P2, and the change in TAWSS over a range of cardiac cycles was calculated. The results showed that TAWSS was higher at point P1 than at point P2. Postoperative TAWSS was lower at point P1 than preoperative TAWSS. The postoperative TAWSS was higher at P2 than the preoperative TAWSS (Supplemental Figure 7).
Case 3 postoperative abdominal aorta
The postoperative hemodynamic distribution in Case 3 is shown in Figure 6. The postoperative model for case 3 has 168584 nodes and a grid of 585666 units. The results show that the right external iliac artery has a reduced outlet area and higher pressure than the left external iliac artery. There was less streamline in the right external iliac artery than in the left. Supplemental Figure 8 demonstrates the changes in pressure and velocity in a cross-section at the origin of the common iliac and external iliac arteries bilaterally. Hemodynamics of case 3 postoperative model.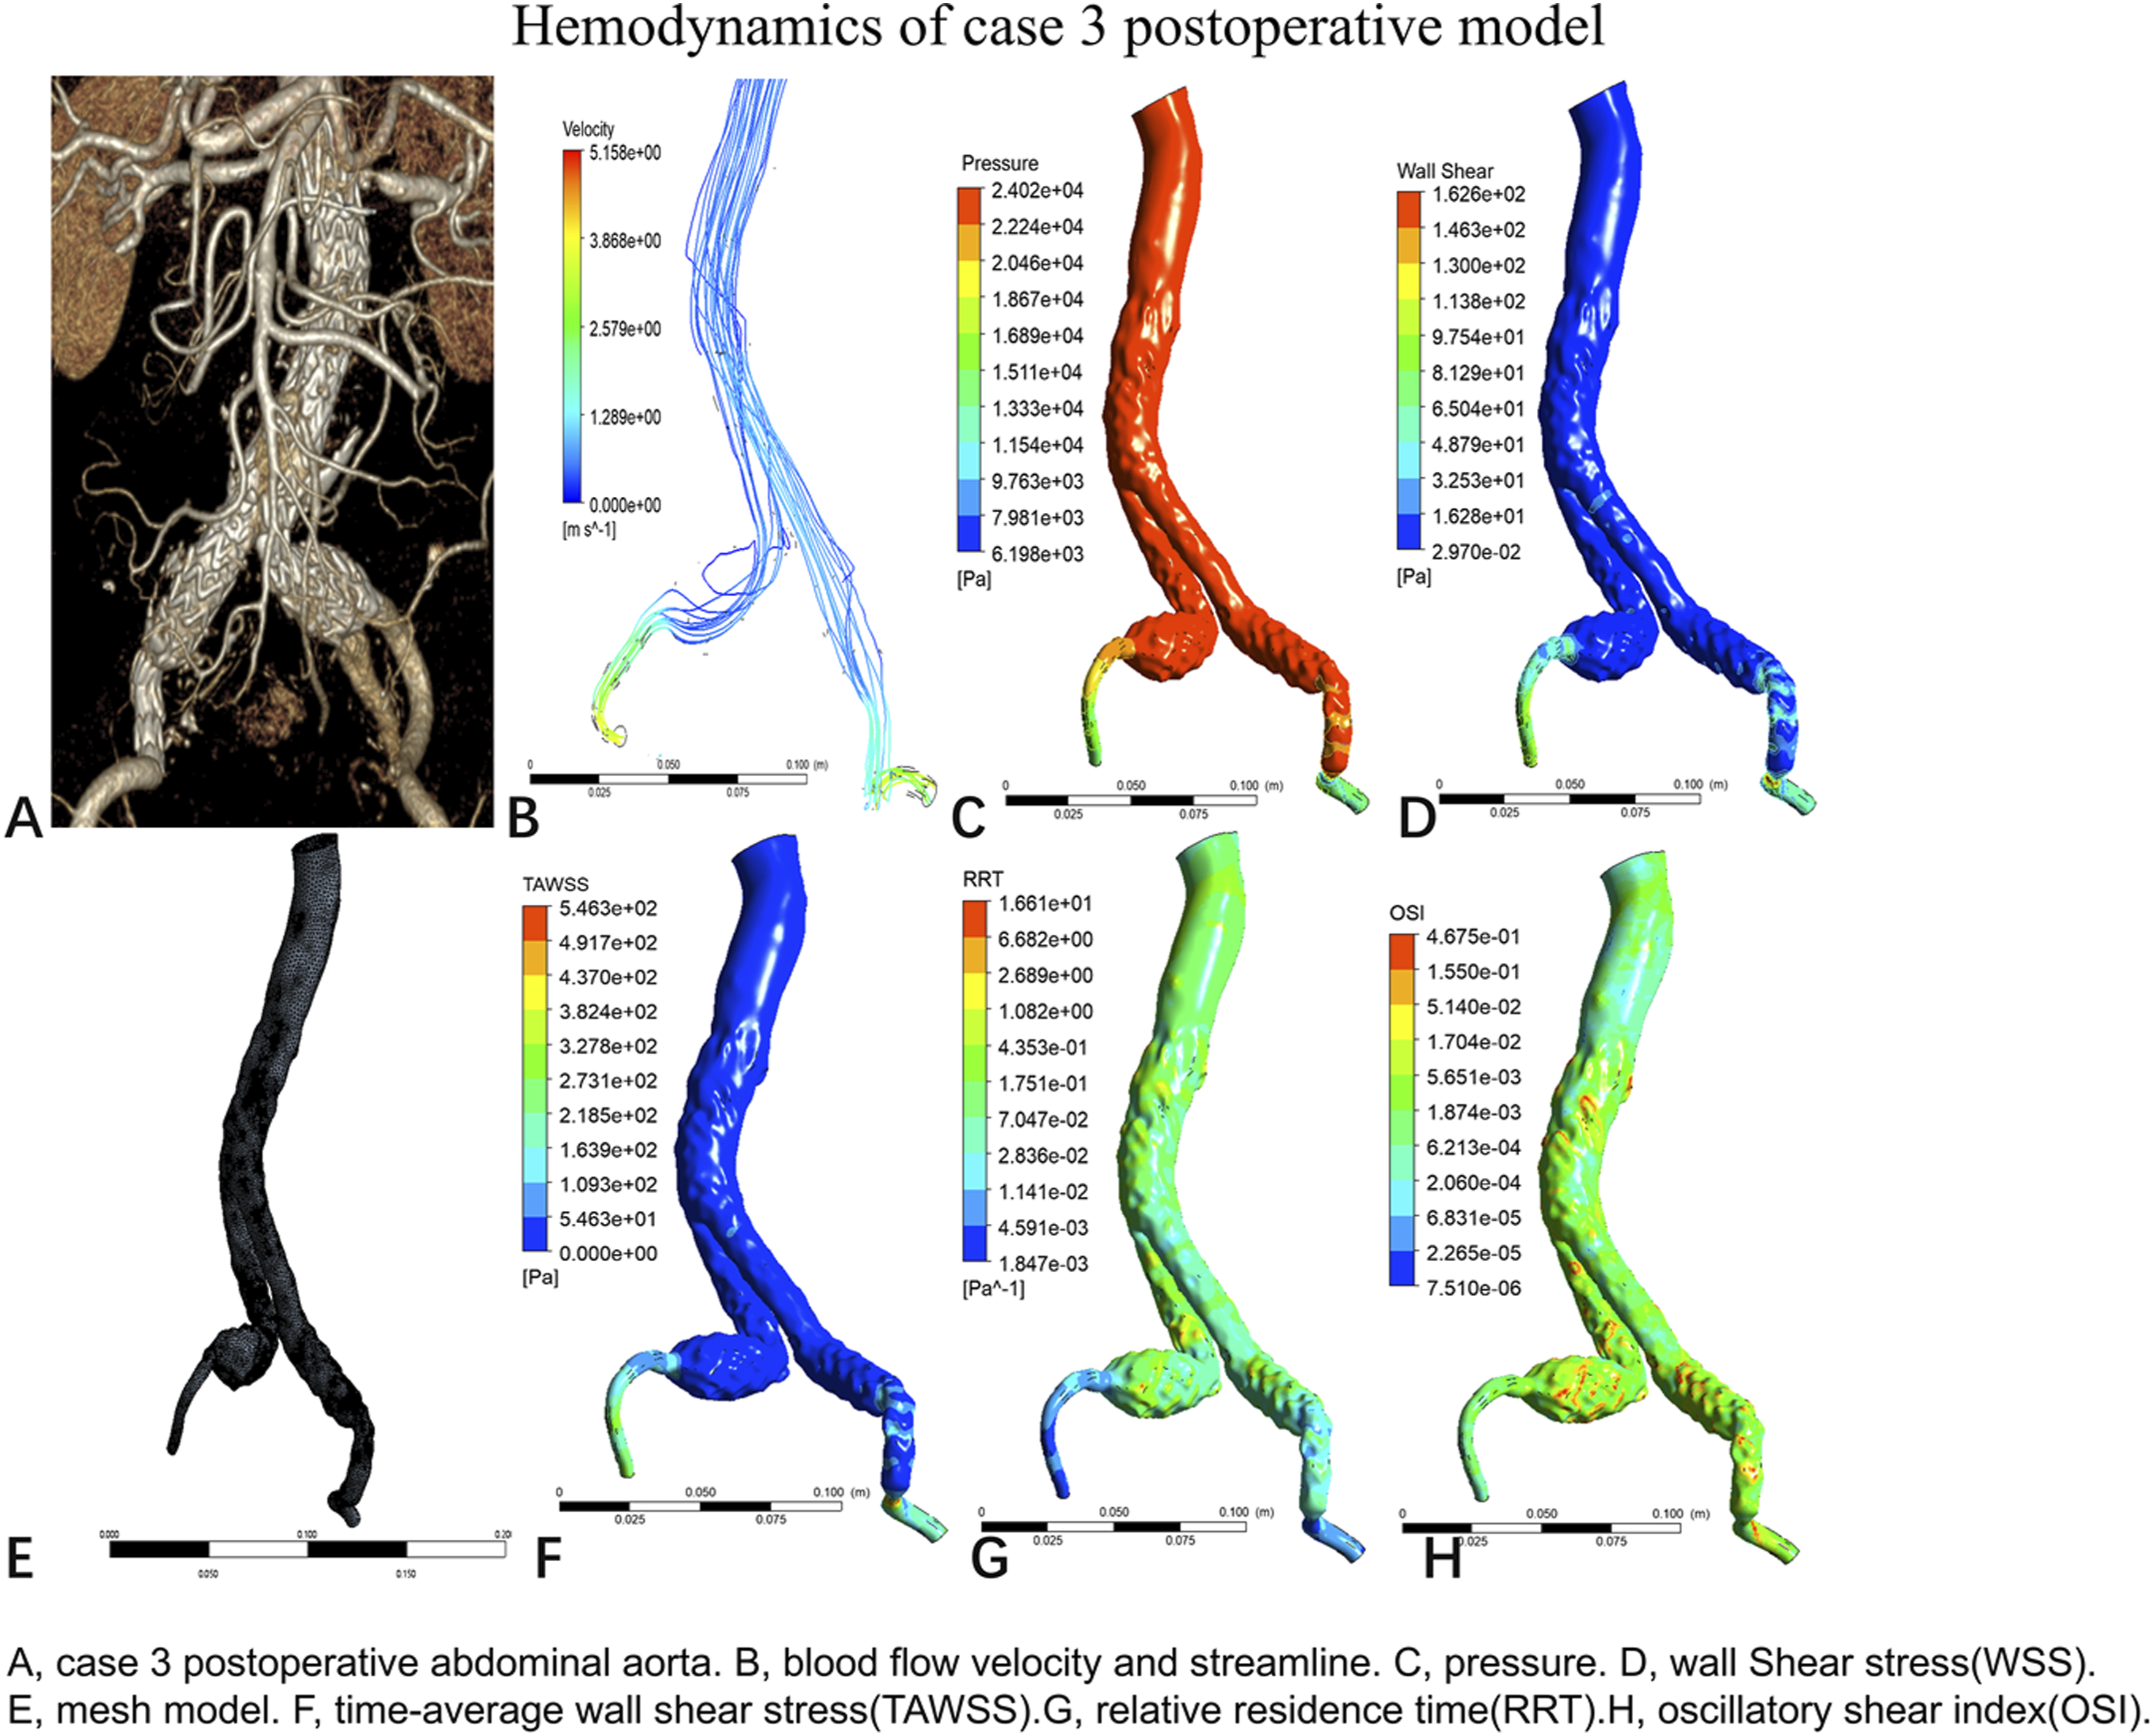
Case 3 preoperative abdominal aorta
The preoperative hemodynamic distribution in Case 3 is shown in Figure 7. Case 3 preoperative model has 71887 nodes and a grid of 259367 units. The results show a right common iliac artery aneurysm with disturbed flow. WSS and TAWSS were elevated at the stenosis. Taking the cross section at the origin of bilateral external iliac arteries and common iliac arteries, the results suggest that the gradient changes of pressure and velocity of the left common iliac artery are larger than those of the right common iliac artery, and the gradient changes of pressure and velocity of the right external iliac artery are larger than those of the left external iliac artery (Supplemental Figure 9). Hemodynamics of case 3 preoperative model.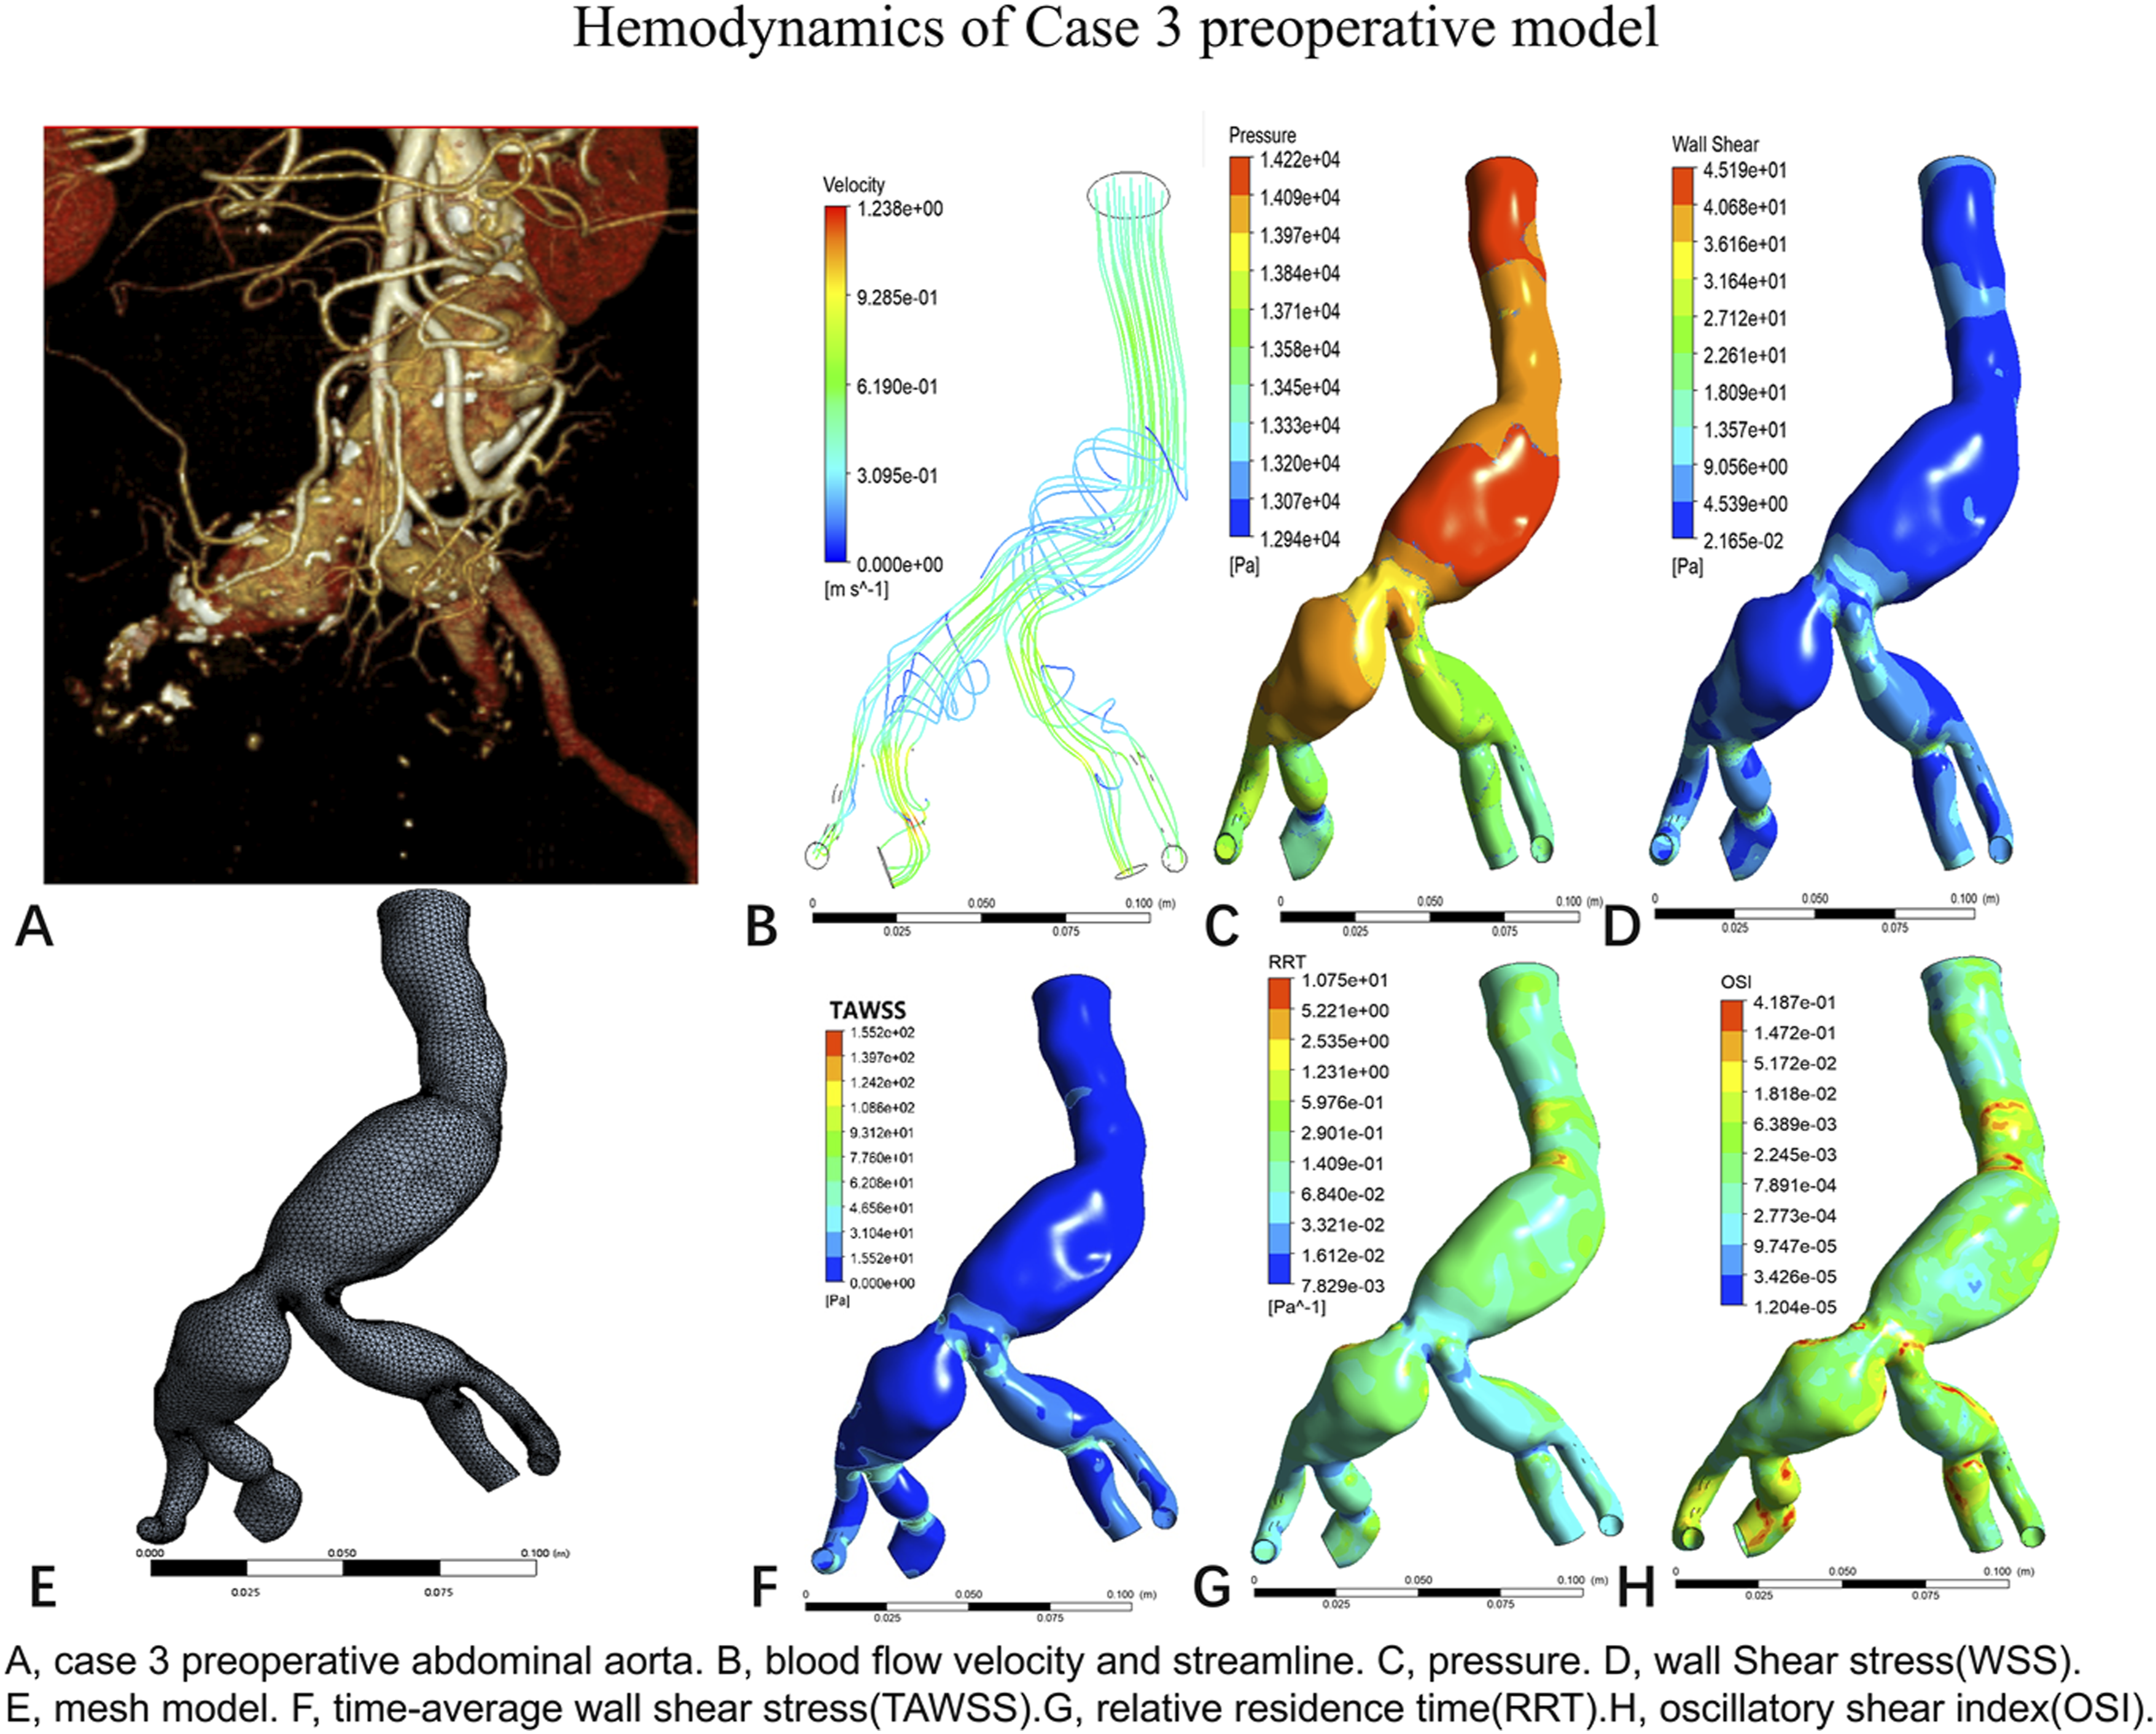
In Case 3, the beginning of the right external iliac artery was selected as point P1, and the corresponding part of the left external iliac artery was selected as point P2, and the change in TAWSS over a range of cardiac cycles was calculated. The results showed that the TAWSS at point P1 was higher than that at point P2, the postoperative TAWSS at P1 was lower than the preoperative TAWSS, and the postoperative TAWSS at P2 was higher than the preoperative TAWSS (Supplemental Figure 10).
Case 4 postoperative abdominal aorta
The postoperative hemodynamic distribution in Case 4 is shown in Figure 8. The results showed that compared with the left external iliac artery, the right external iliac artery had a thinner outflow tract with less streamline, and disturbed flow was seen at the bend of the neck of the aneurysm. Taking the cross section of the exit of both external iliac arteries and the bend of the abdominal aorta, the results suggest that the change of blood flow at the bend of the abdominal aorta is more obvious than that of the normal model. The right external iliac artery showed greater changes in pressure and smaller changes in velocity than the left external iliac artery (Supplemental Figure 11). Hemodynamics of case 4 postoperative model.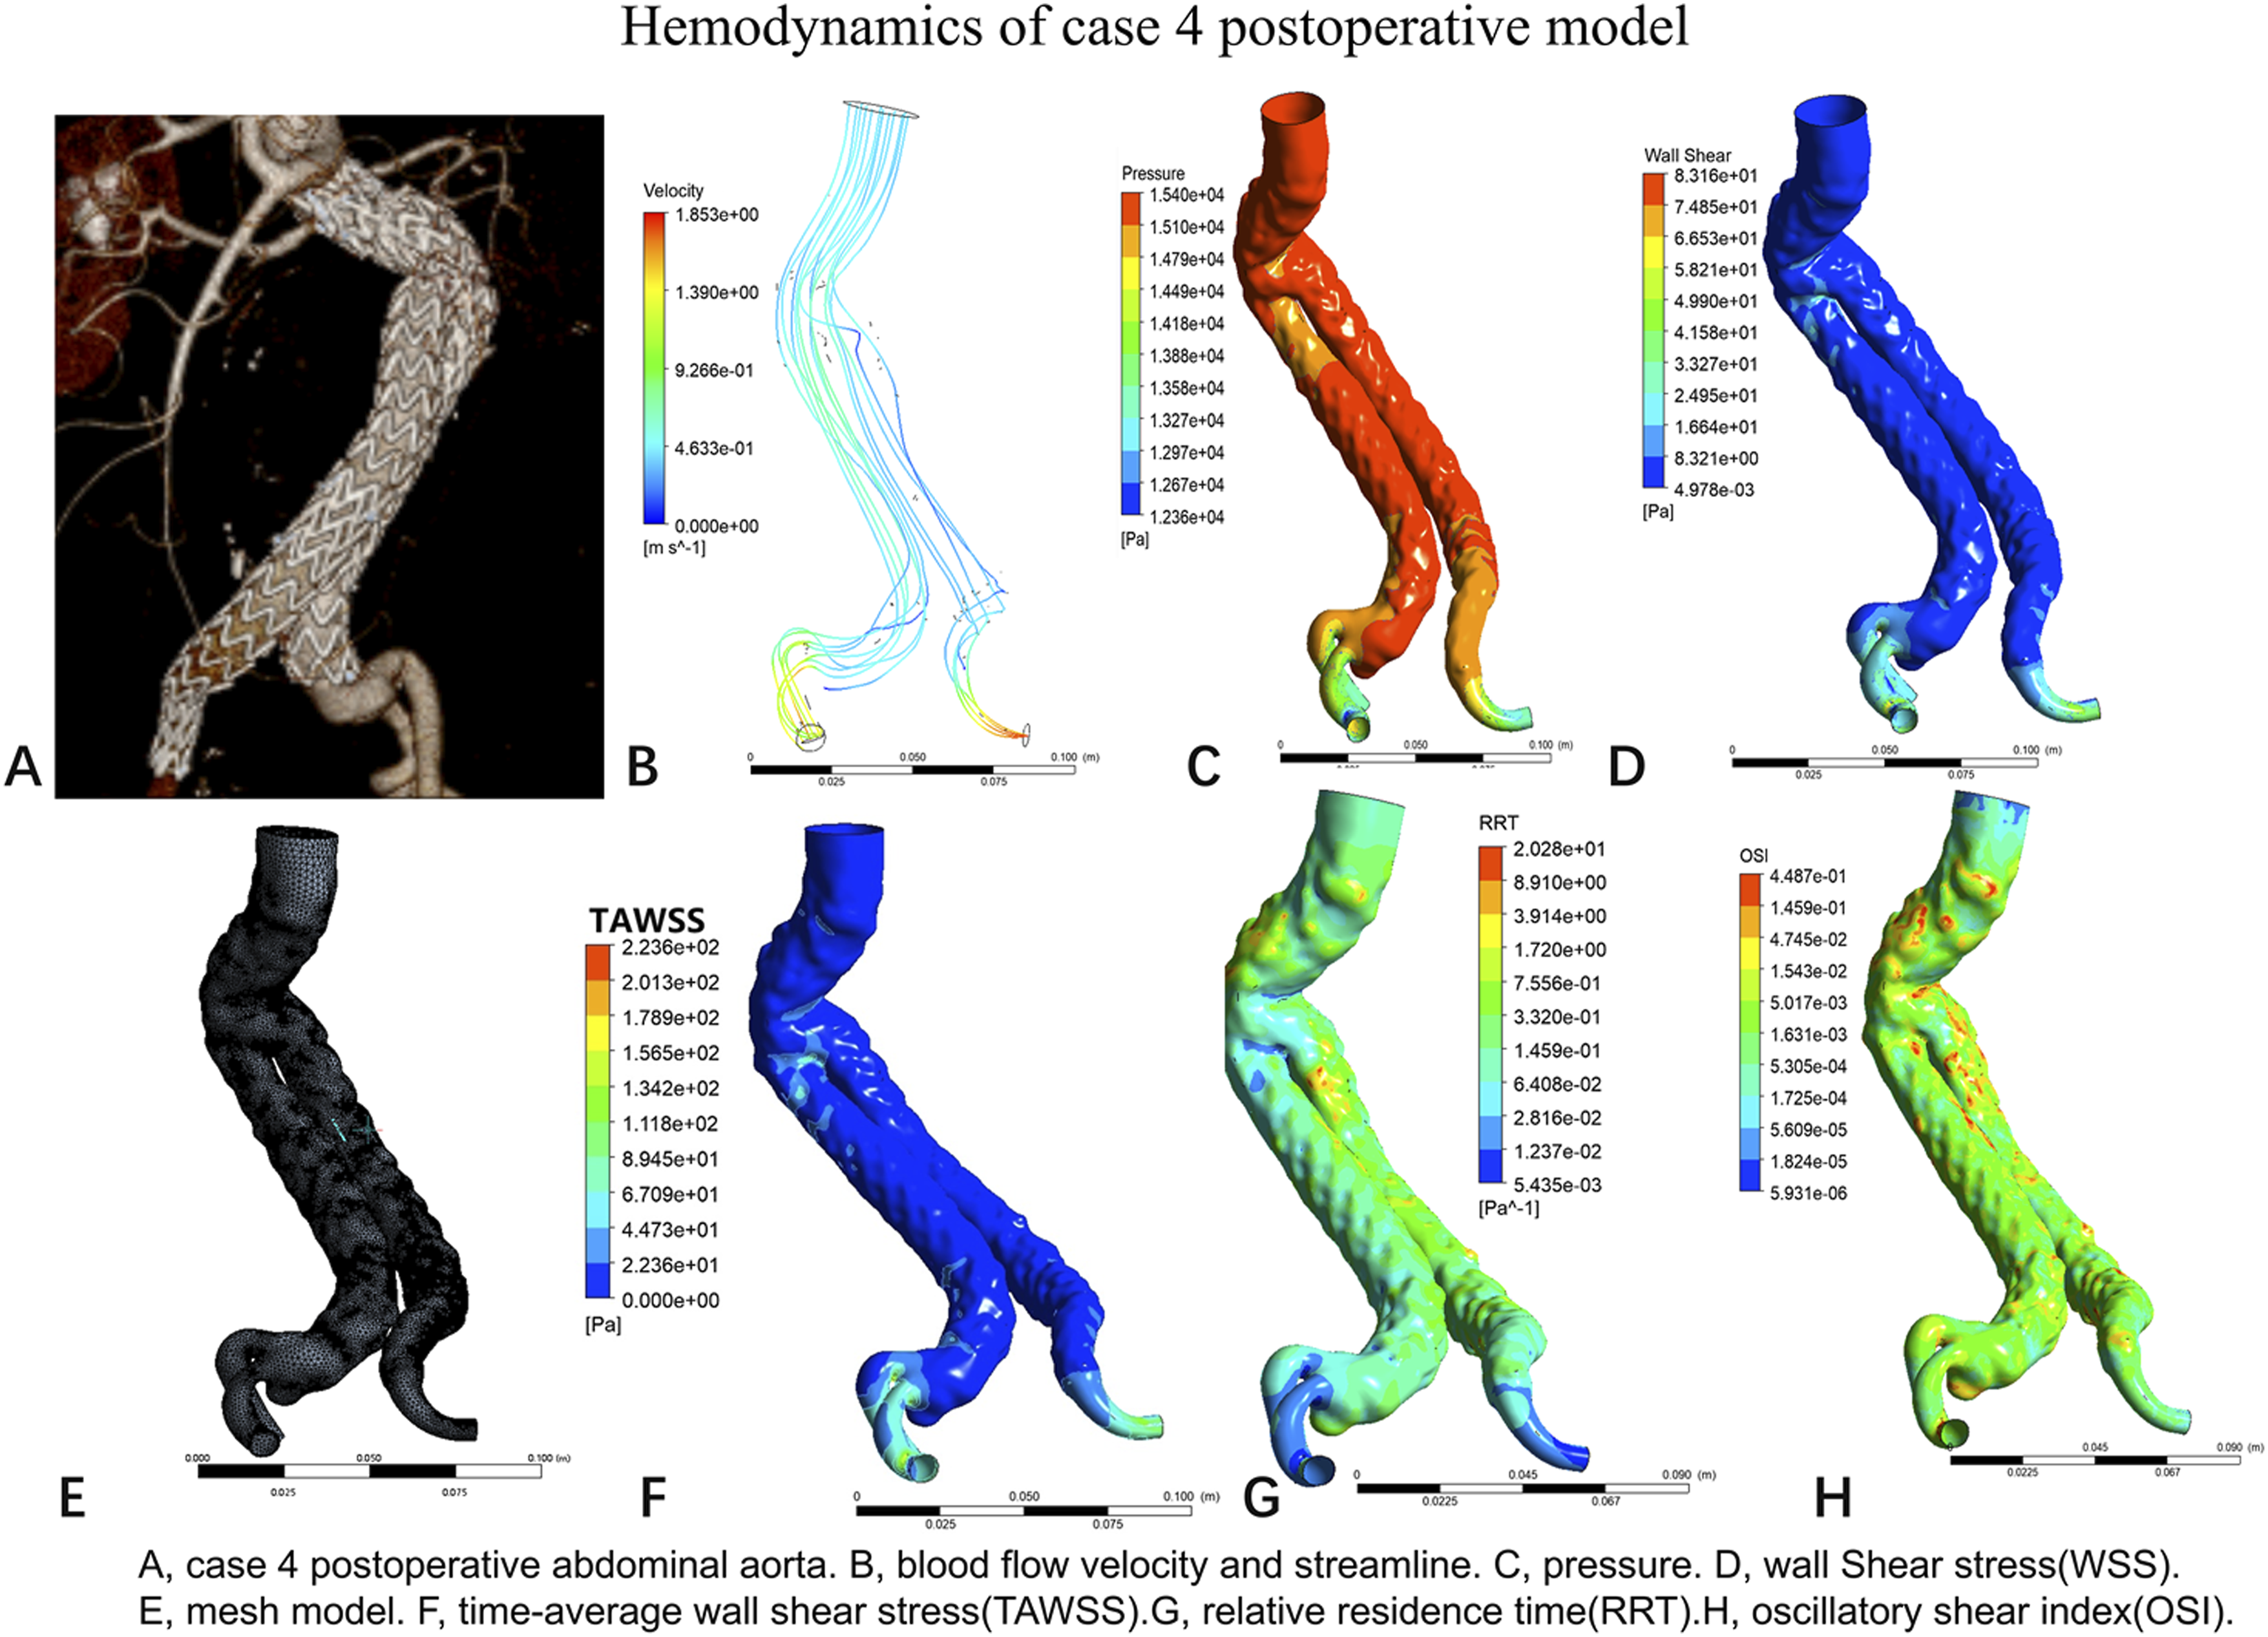
Case 4 preoperative abdominal aorta
The preoperative hemodynamic distribution in Case 4 is shown in Figure 9. In case 4, preoperative CTA revealed a leftward deviation of the aortic aneurysm neck, with a proximal neck of approximately 60° and a large angulation of the distal neck of the aneurysm (more than 120°). We hypothesized that the cause of the right iliac artery occlusion might be related to the compression and bending of the right iliac branch at the angular position of the distal neck of the aneurysm. The preoperative model nodes were 109463 and the grid was 419329 units. The results showed less streamline in the right external iliac artery than in the left. At the neck of the aneurysm, the blood flow was disturbed. According to the distal anchoring site of bilateral iliac branch stent, the interface between the origins of both external iliac arteries and the bends of the abdominal aorta before and after the surgery was taken, and the results suggested that the pressure and velocity changes in the left external iliac artery were greater than those in the right common iliac artery. The velocity distribution at the bend of the abdominal aorta was disorganized, which was associated with disturbed flow (Supplemental Figure 12). Hemodynamics of case 4 preoperative model.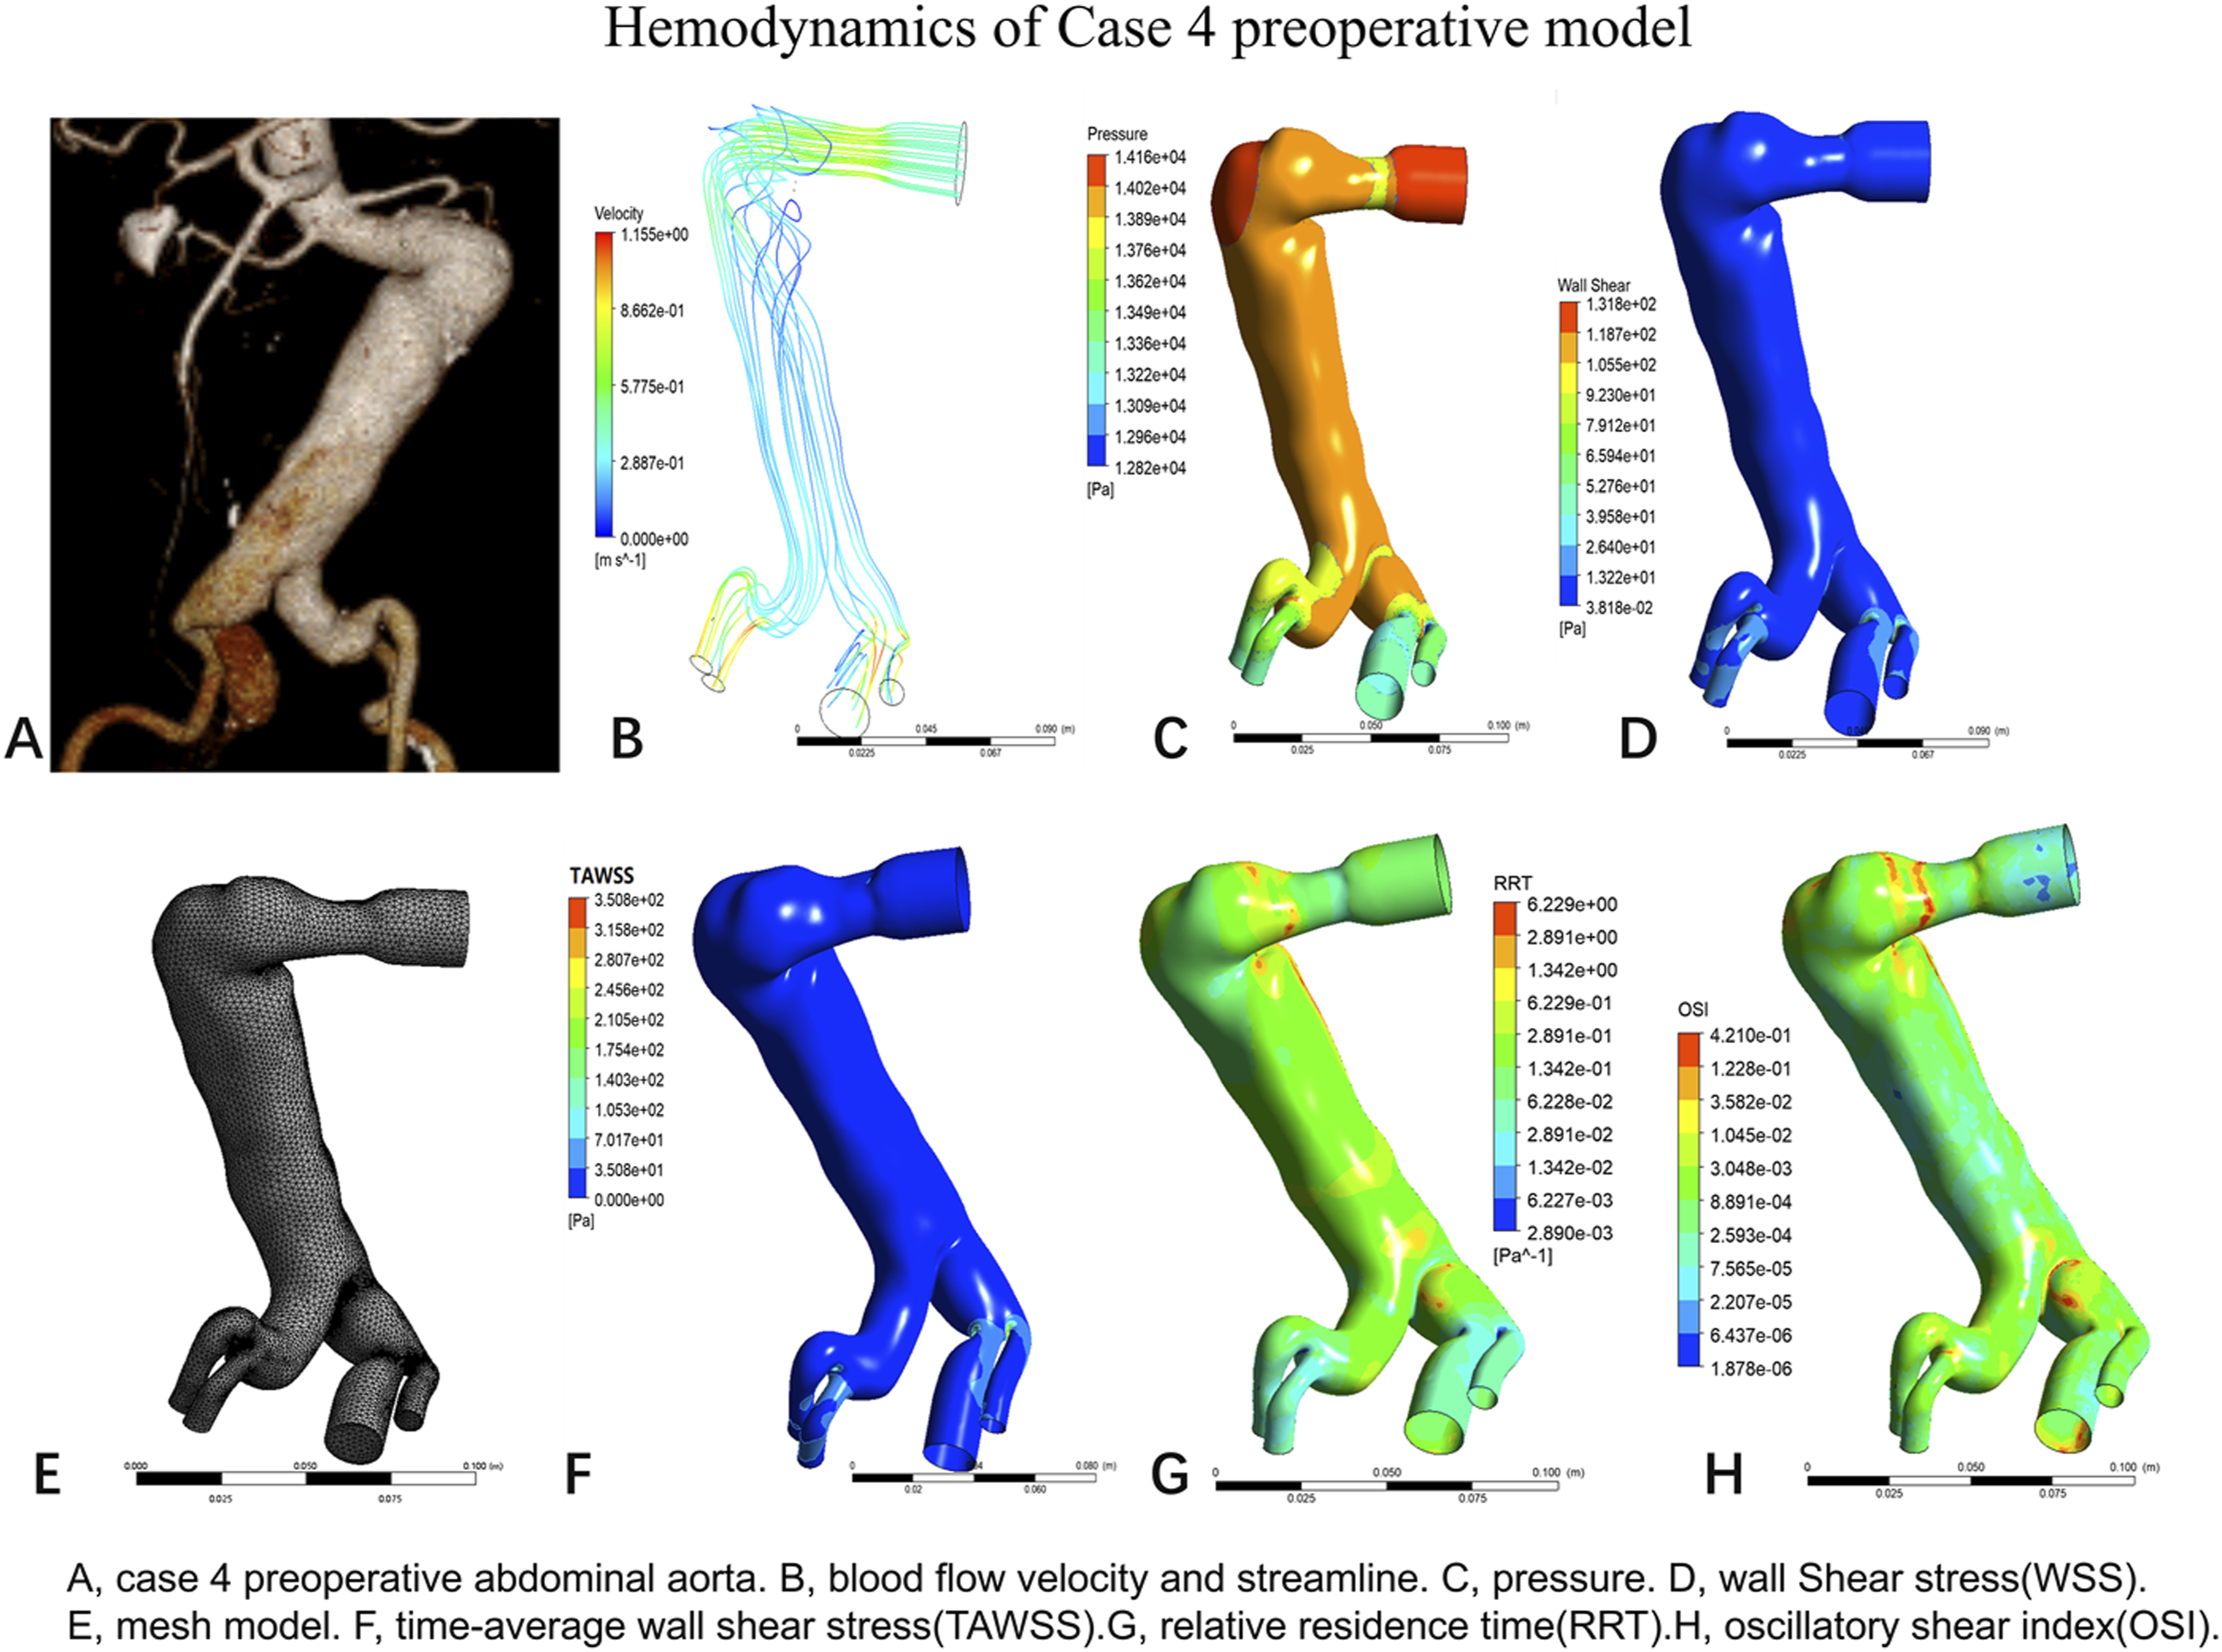
In Case 4, the right curvature of the abdominal aortic aneurysm neck was selected as point P1, and the corresponding site on the left side of the abdominal aorta was selected as point P2, and TAWSS was calculated for a range of cardiac cycles. The results showed that TAWSS was higher at point P1 than at point P2, decreased after P1 compared with preoperative TAWSS, and increased after P2 compared with preoperative TAWSS (Supplemental Figure 13).
Case 5 postoperative abdominal aorta
The postoperative hemodynamic distribution in Case 5 is shown in Figure 10. The postoperative model nodes are 188334 and the grid is 661037 units. The results showed that the right external iliac artery outflow tract was thinner and had less streamline than the left. According to the distal anchoring sites of bilateral iliac branch stents, cross-sections were taken at the beginning of bilateral external iliac arteries, at the bend of the right common iliac artery, and at the corresponding site of the left common iliac artery. The results suggested that the gradient of pressure and velocity varied more in the right common iliac artery than in the left common iliac artery (Supplemental Figure 14). Hemodynamics of case 5 postoperative model.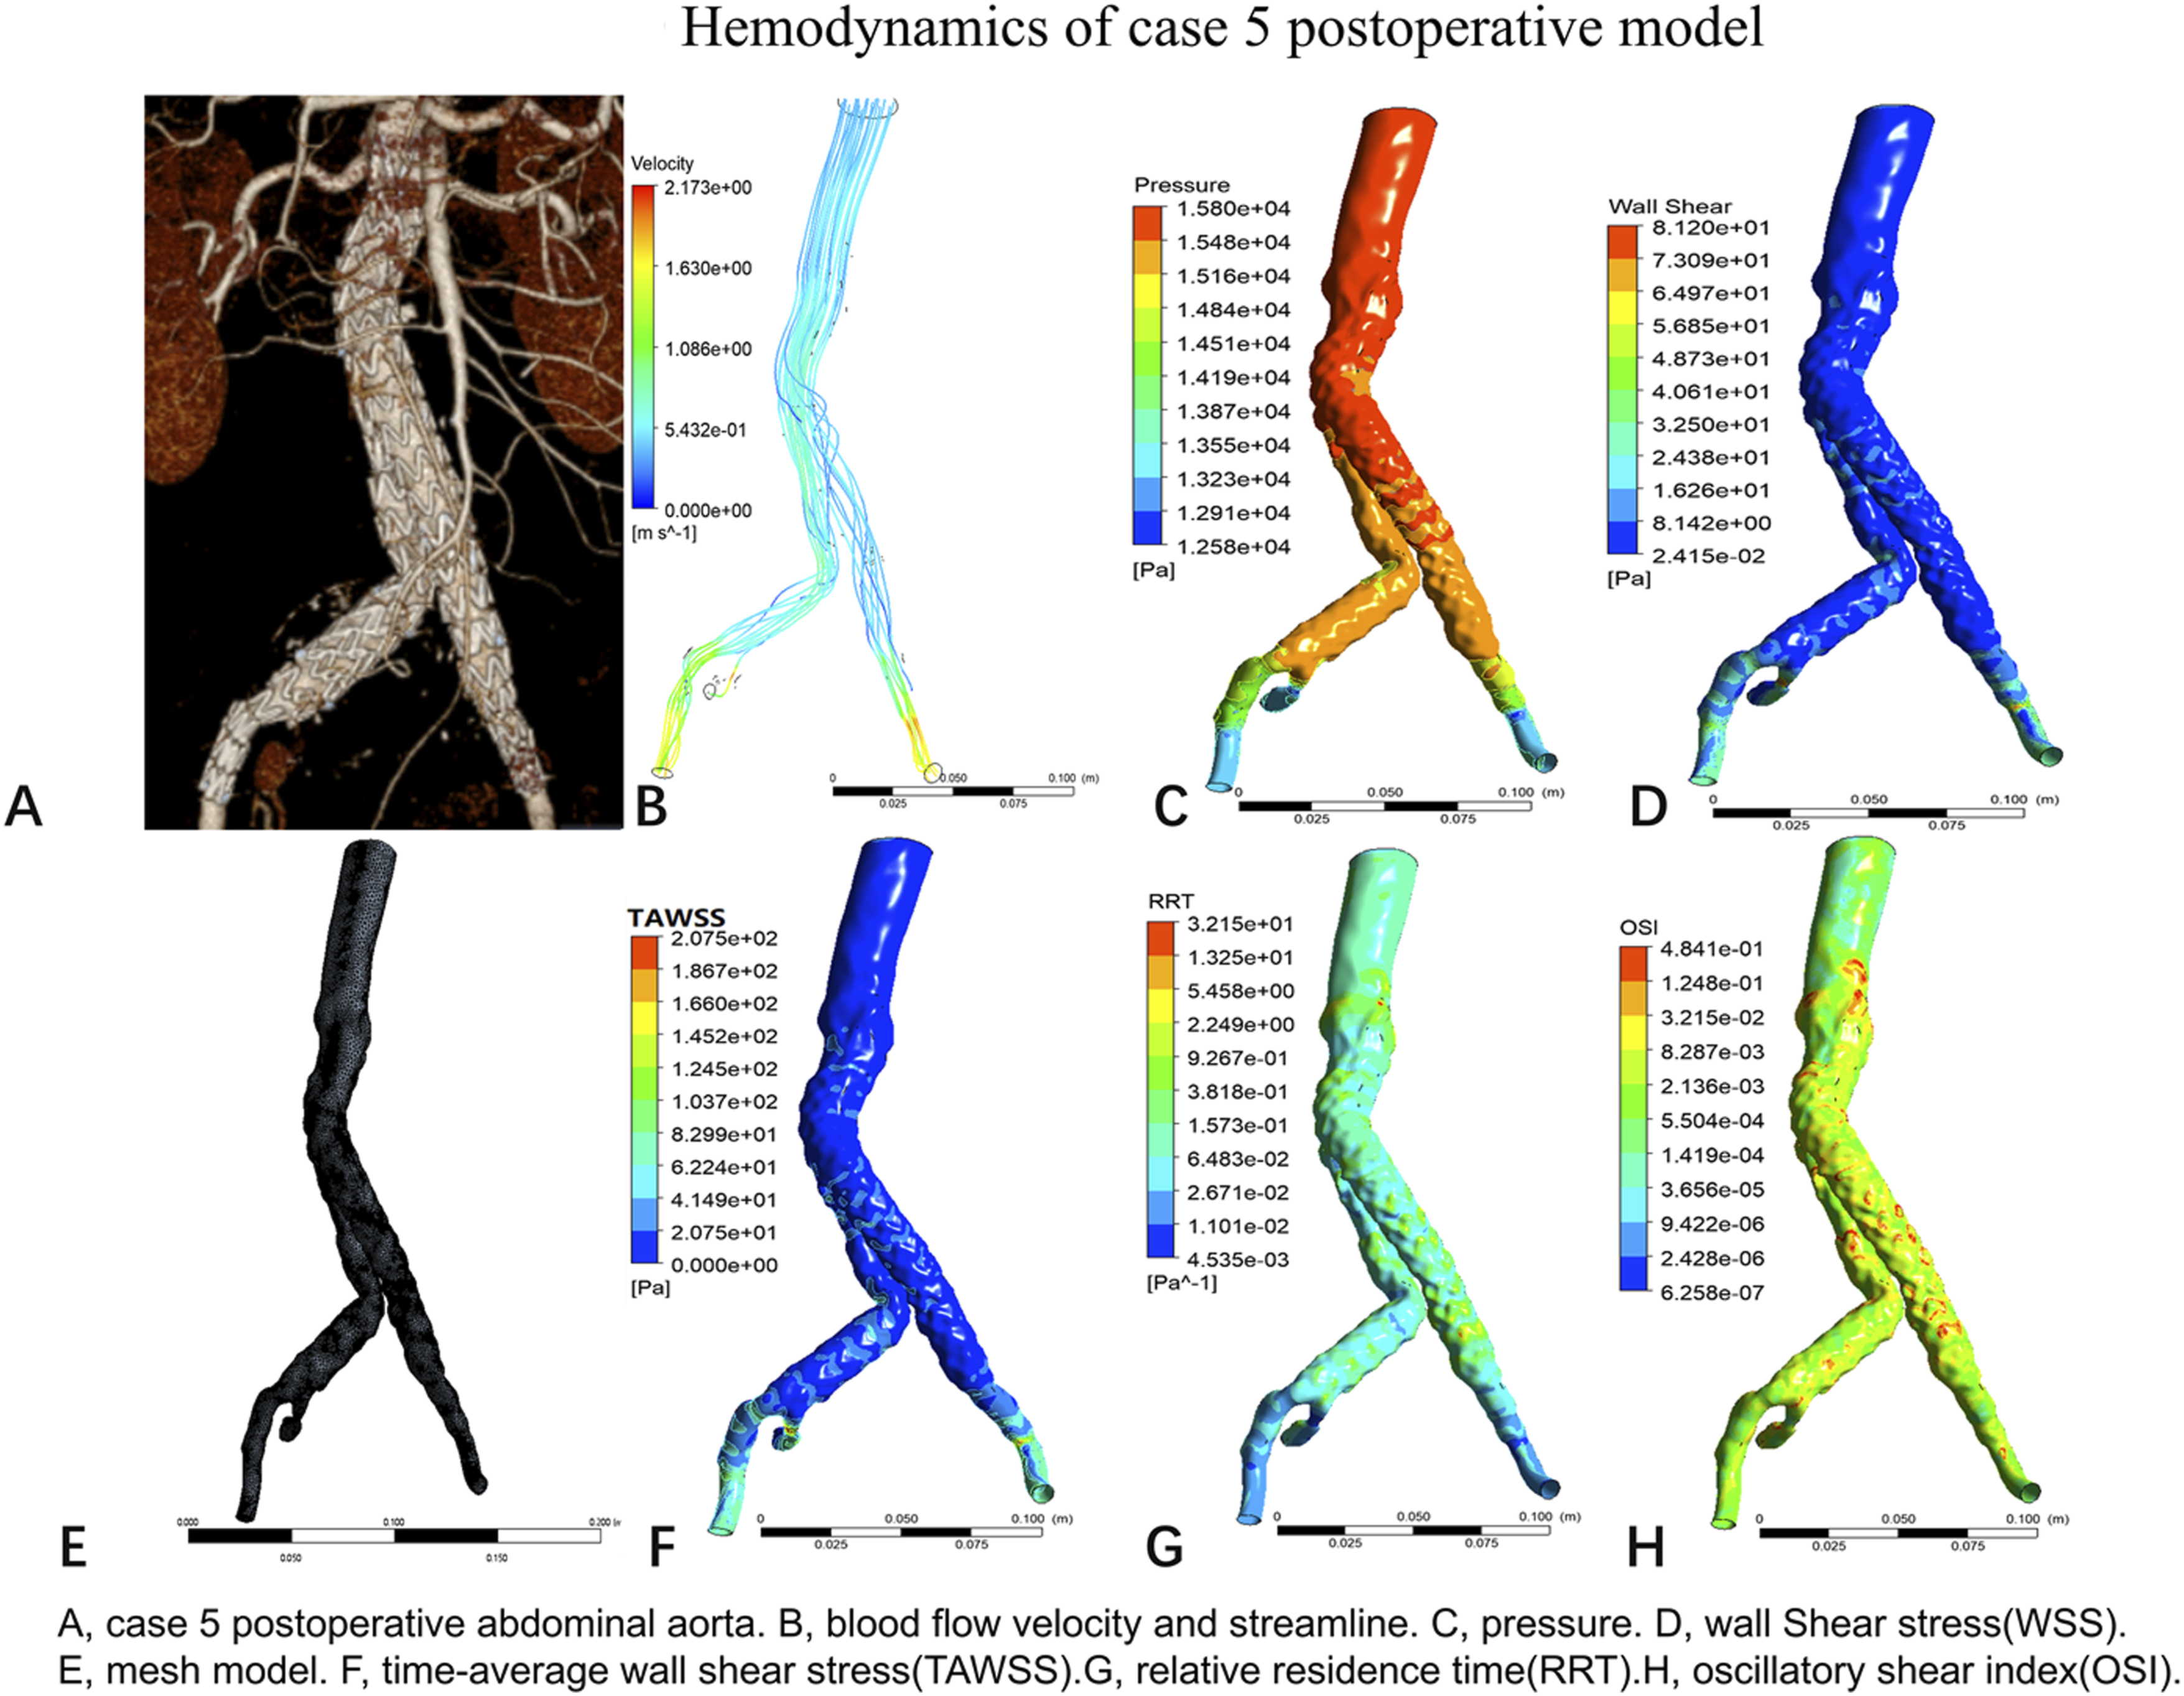
Case 5 preoperative abdominal aorta
The preoperative hemodynamic distribution in Case 5 is shown in Figure 11. Case 5 preoperative model node 69148 with a grid of 243455 units. Right common iliac artery pressure is higher than left. WSS and TAWSS were elevated at the location of the stenosis. Less streamline within the right external iliac artery than the left. Bilateral cross-sections of the common iliac and external iliac arteries at the beginning of the iliac arteries were taken, respectively, and the results suggested that the right external iliac and common iliac arteries had greater variations in pressure and flow velocity than the left side (Supplemental Figure 15). Hemodynamics of case 5 preoperative model.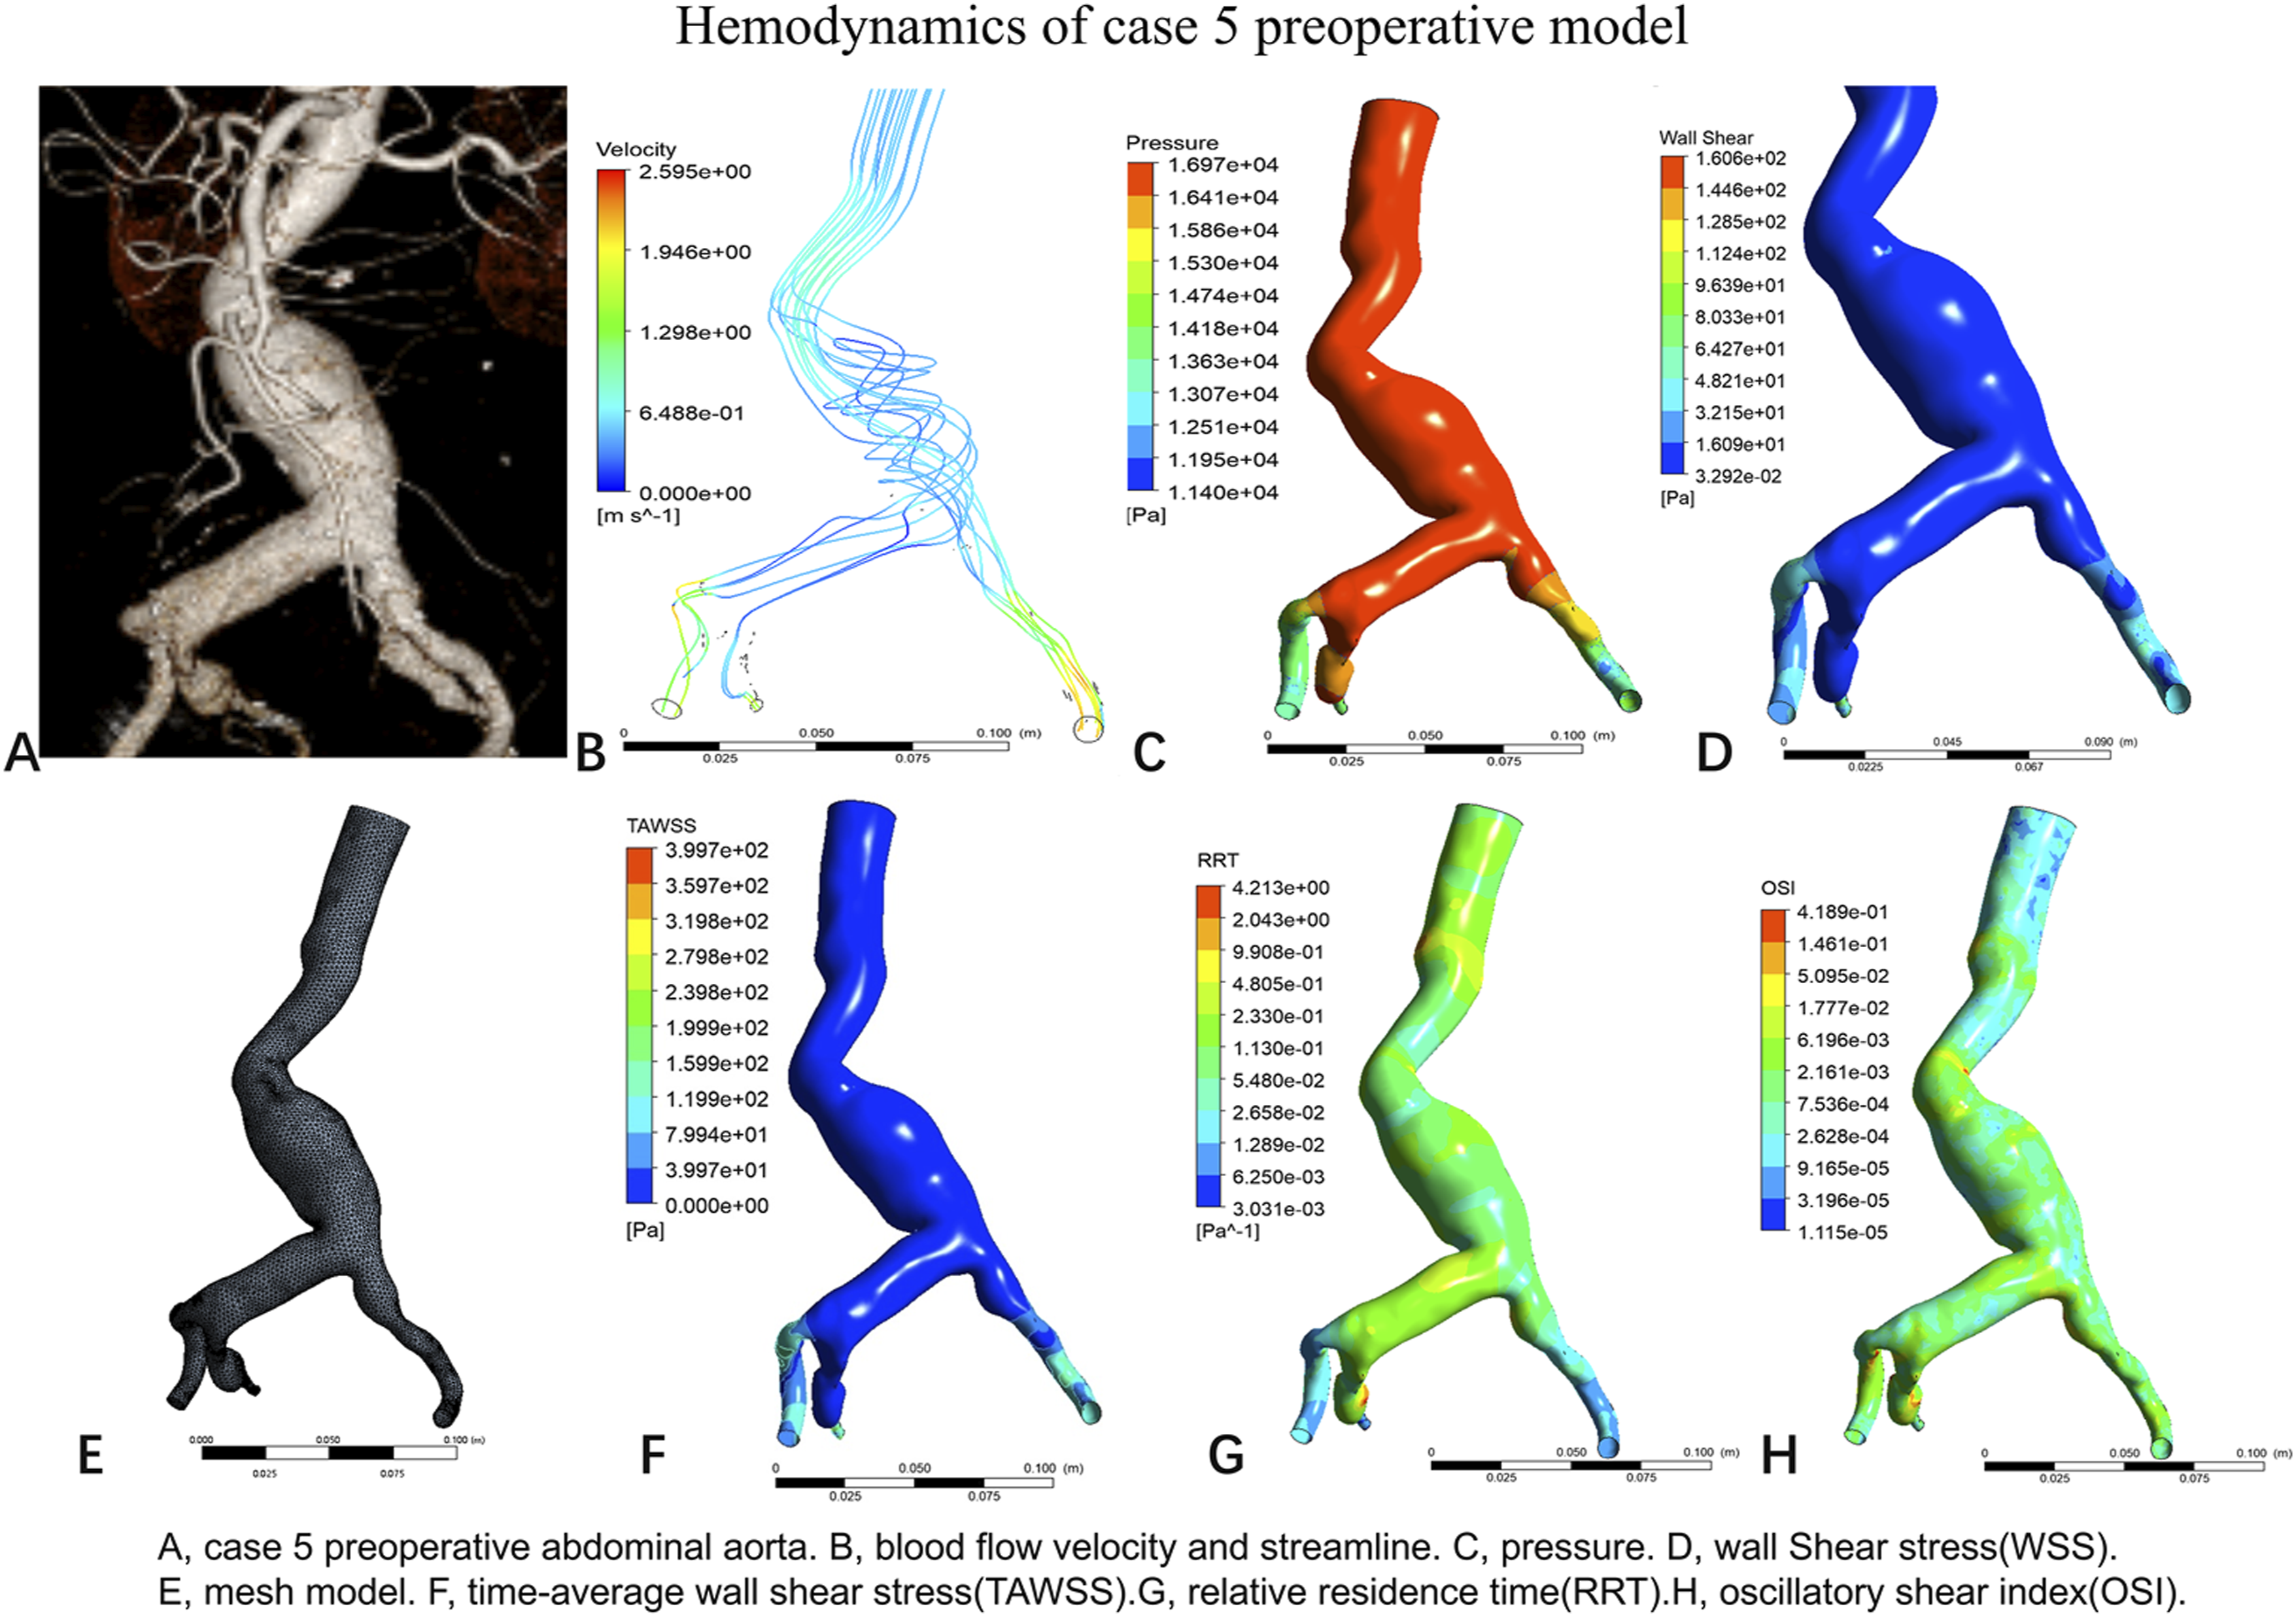
In Case 5, the angular bend at the junction of the abdominal aorta and the right common iliac artery was selected as point P1, and the corresponding site of the left common iliac artery was selected as point P2, and the change in TAWSS over the range of one cardiac cycle was calculated. The results showed that the TAWSS was higher at point P1 than at point P2, the TAWSS was elevated after P1 compared with preoperative TAWSS, and the TAWSS was lower after P2 compared with preoperative TAWSS (Supplemental Figure 16).
Case 6 postoperative abdominal aorta
The postoperative hemodynamic distribution in Case 6 is shown in Figure 12. The postoperative model node is 190749 and the grid is 670253 units. The results show less flow in the right external iliac artery than in the left. The pressure at the origin of the left common iliac artery was higher than that of the right. Taking the cross section of bilateral common iliac artery and external iliac artery outlet, the results suggest that the right common iliac artery is separated by the stent of internal iliac branch, and the blood flow is divided into two parts, one of which enters into the stent of internal iliac artery, and the other part enters into external iliac artery. The blood flow velocity of the right external iliac artery increased and the pressure decreased, and the distal pressure and velocity changes of the right external iliac artery were greater than those of the left common iliac artery (Supplemental Figure 17). Hemodynamics of case 6 postoperative model.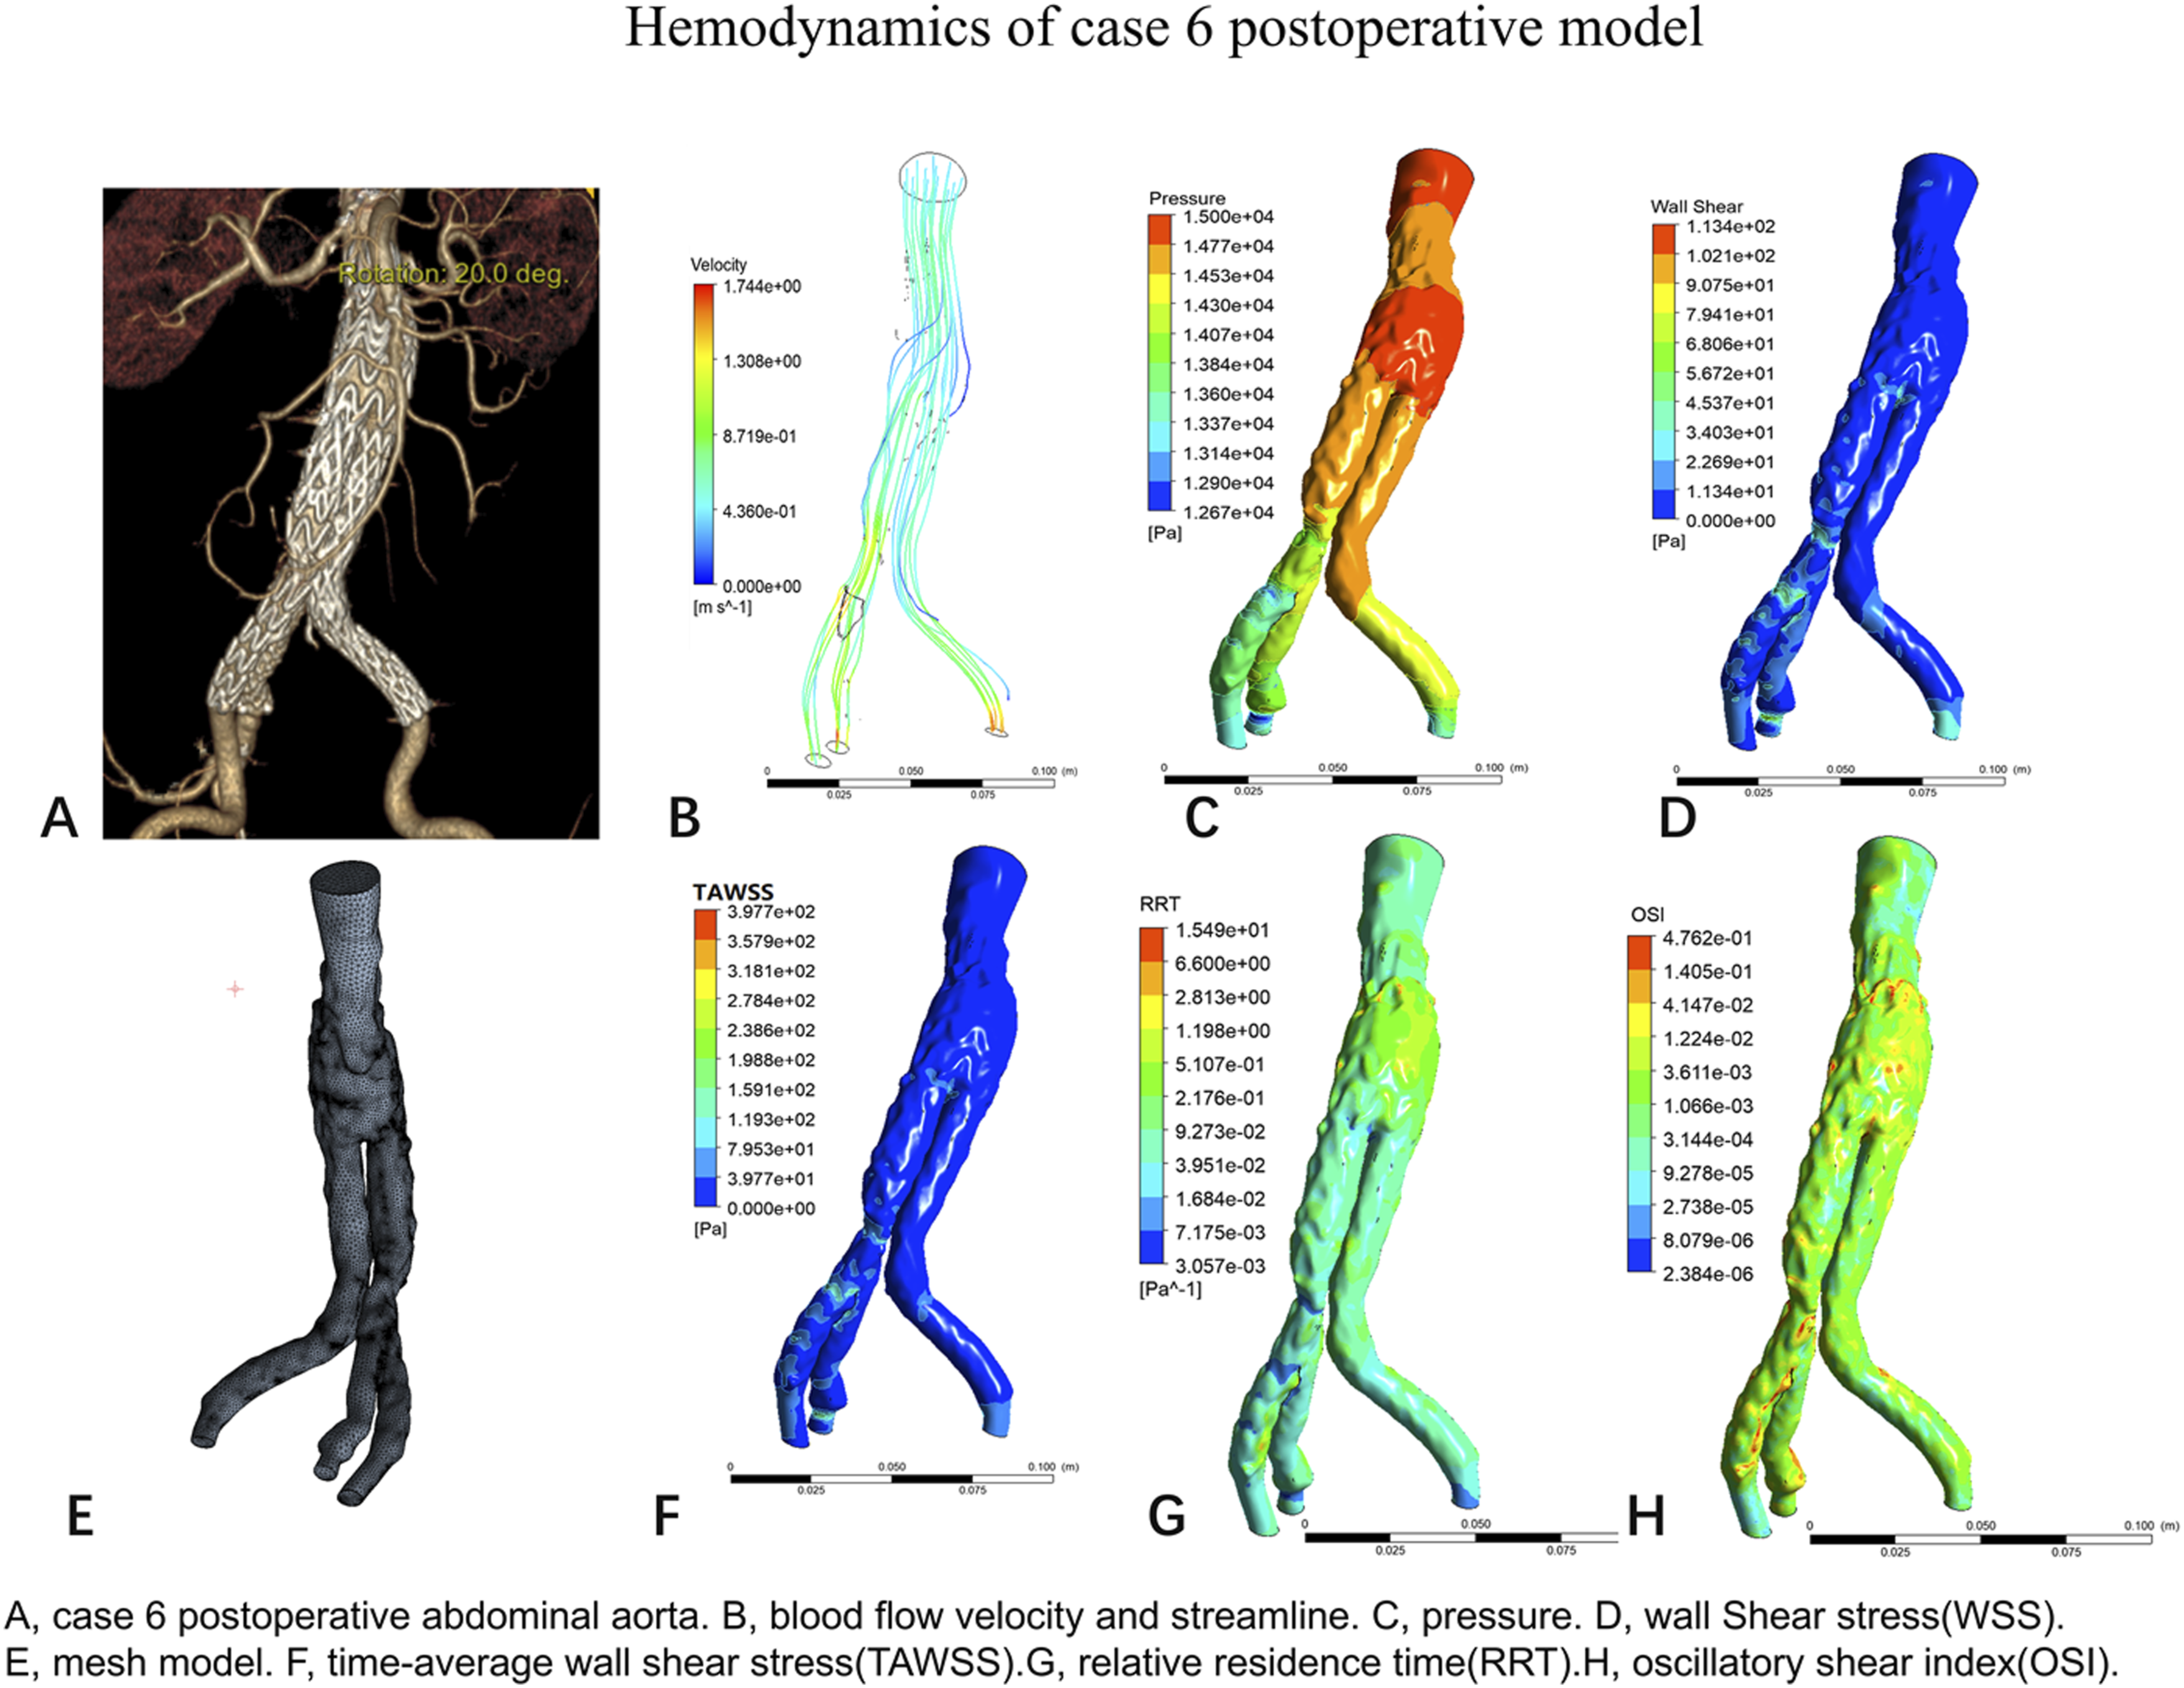
Case 6 preoperative abdominal aorta
The preoperative hemodynamic distribution in Case 6 is shown in Figure 13. The preoperative model nodes were 95276 and the grid was 346339 units. The results showed elevated WSS and TAWSS at the stenosis. The abdominal aortic streamline formed a disturbed flow with decreased velocity, and the velocity increased after passing through the stenosis at the lower end of the abdominal aorta. Cross sections of the lumen at the middle and lower portions of the external iliac arteries and common iliac arteries were taken bilaterally, and the results suggested that the pressure and flow velocity changes were similar in the bilateral iliac arteries (Supplemental Figure 18). Hemodynamics of case 6 preoperative model.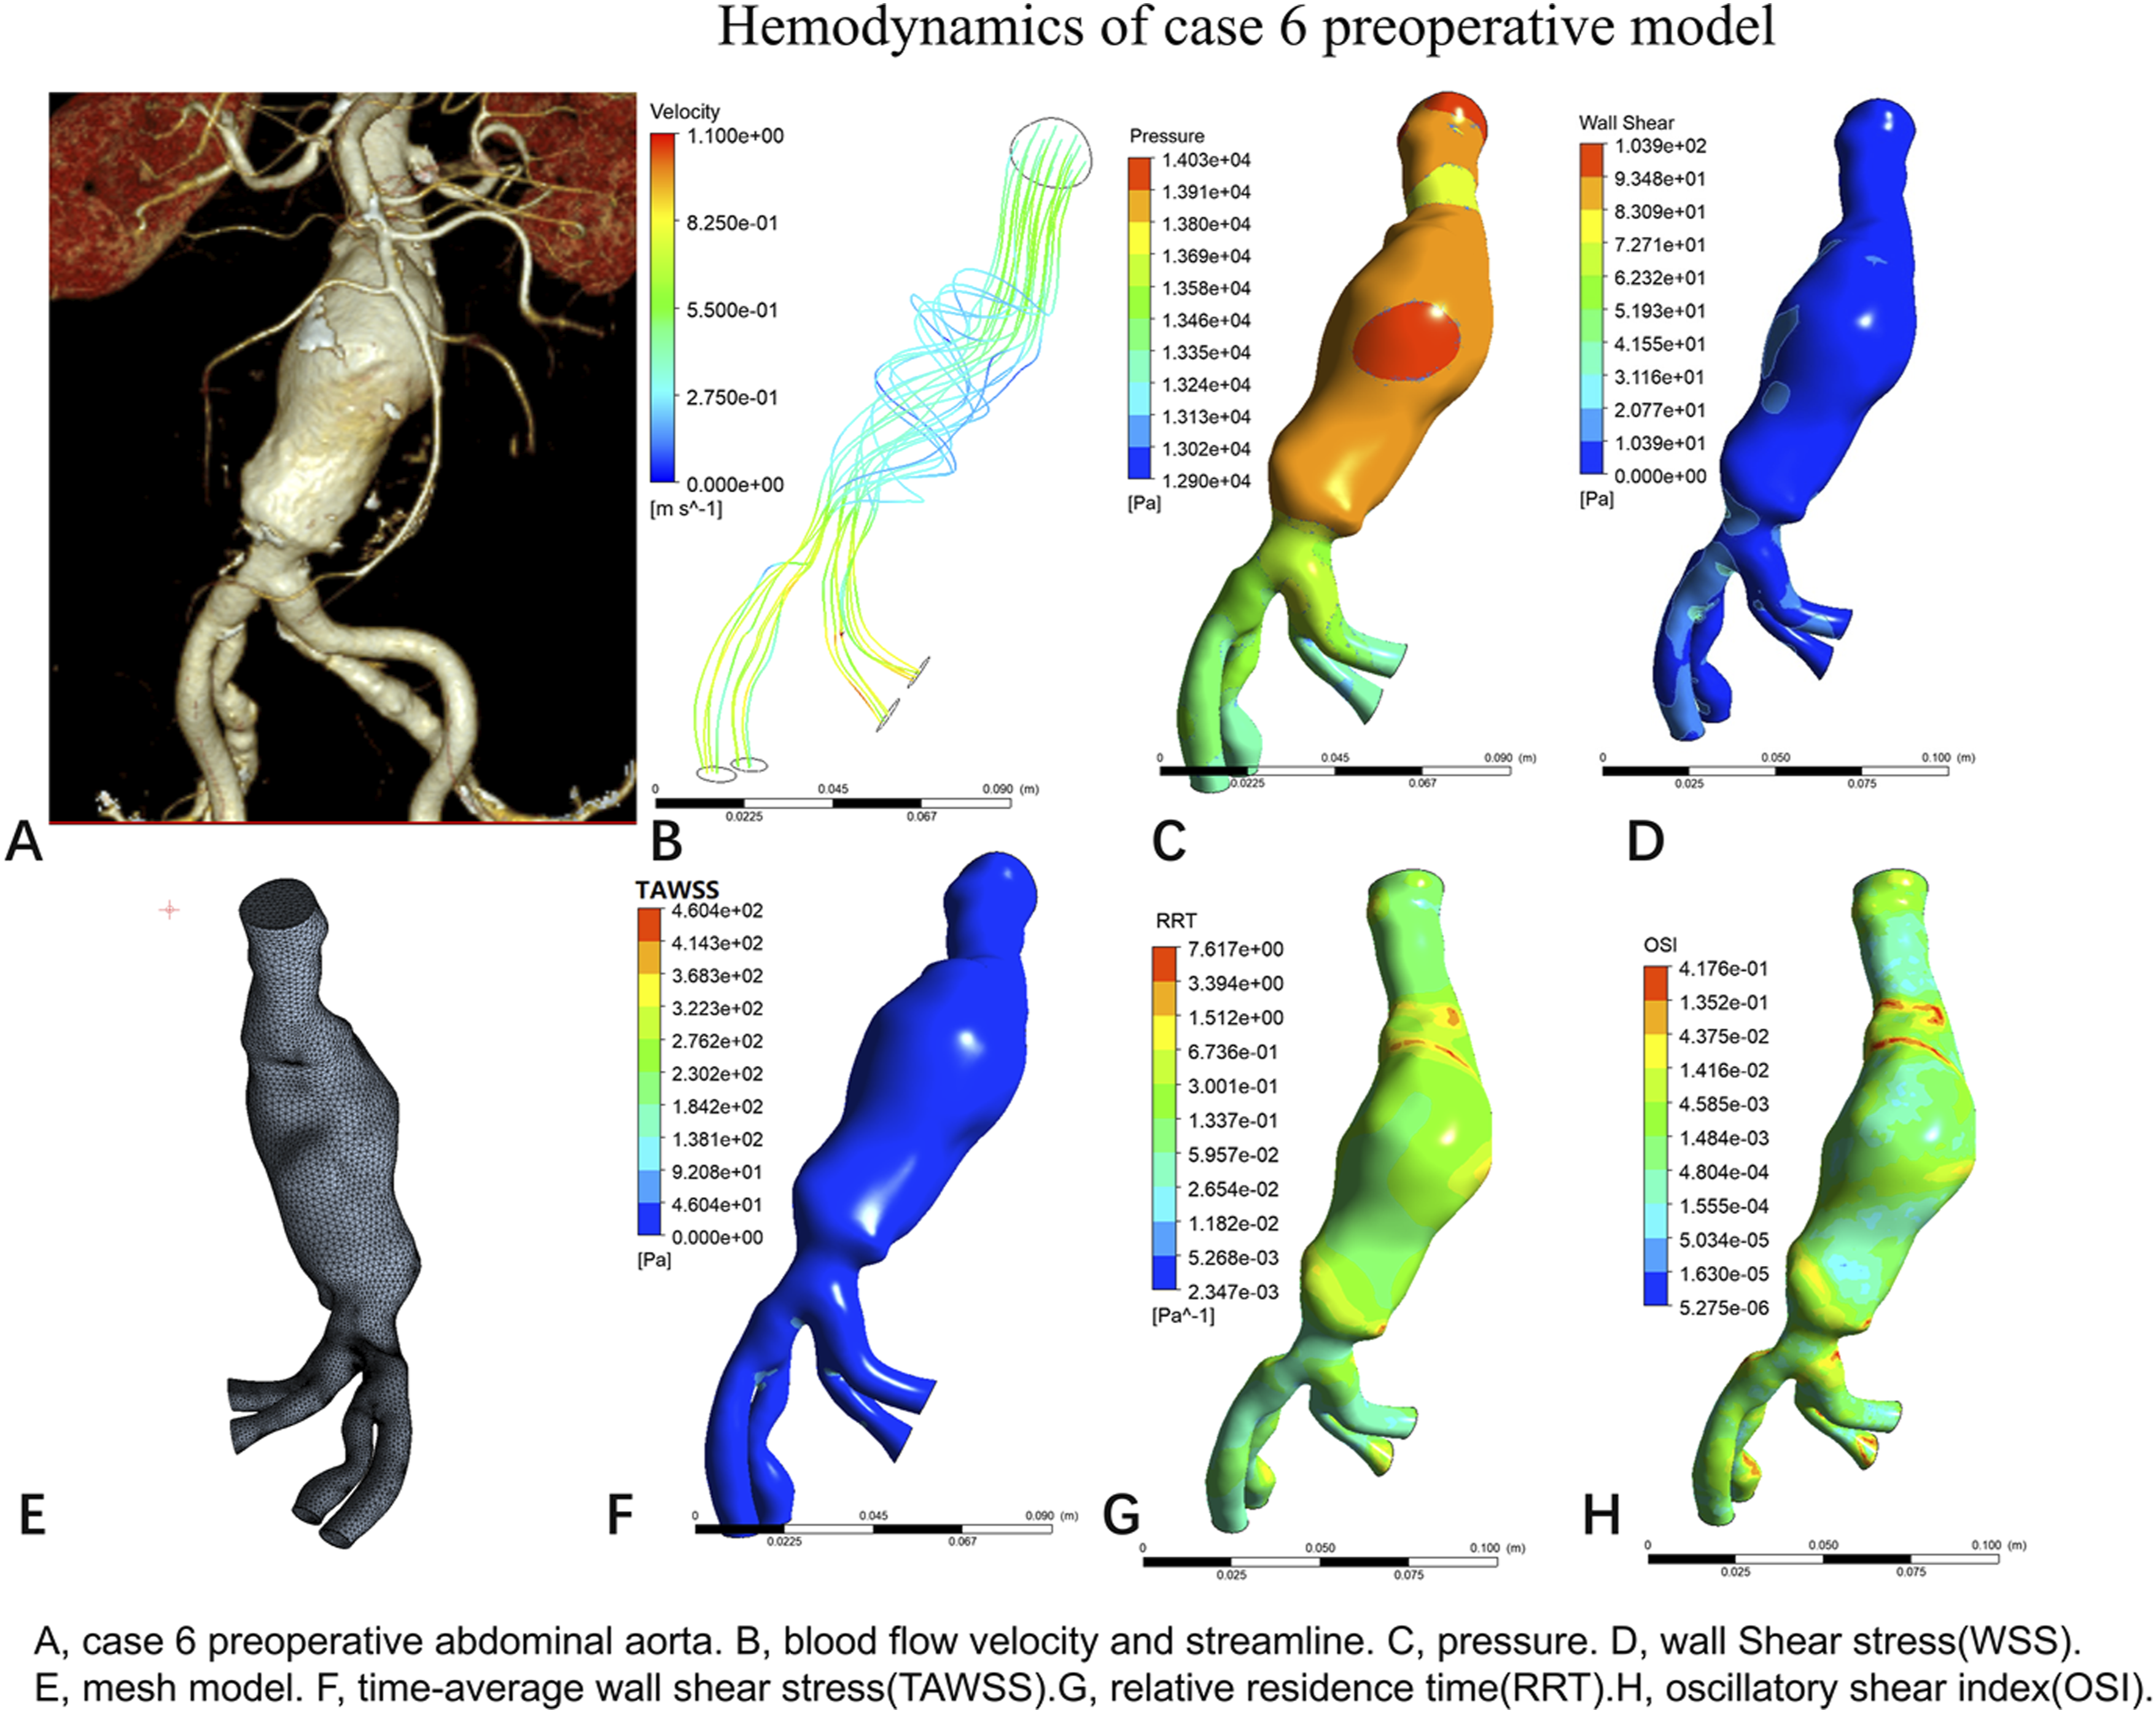
In Case 6, the bifurcation of the right common iliac artery was selected as point P1, and the corresponding site of the left common iliac artery was selected as point P2, and TAWSS was calculated for a range of cardiac cycles. The figure shows that the TAWSS was higher at point P1 than at point P2, decreased after P1 compared with preoperative TAWSS, and decreased after P2 compared with preoperative TAWSS (Supplemental Figure 19).
Discussion
The incidence of abdominal aortic aneurysms ranges from 3.0% to 12.5%,11,12 and EVAR has become the mainstream treatment for abdominal aortic aneurysms, while the complications associated with EVAR have gradually increased. Among them, iliac branch occlusion is the second most common complication after endoleak. The incidence of iliac limb occlusion after EVAR has been noted to be 5.6%. 13 In the past, studies on iliac branch occlusion have mainly focused on anatomical morphology, 14 and few studies have focused on the role of hemodynamics in iliac branch occlusion.
Six representative cases with different factors leading to iliac branch occlusion, including calcified iliac artery stenosis (case 1), iliac vessel tortuosity (case 2), iliac branch stent distal to the external iliac artery (case 3), angulation of the neck of the aneurysm (case 4), angulation of the abdominal aorta-iliac artery (case 5), and stent occupancy (case 6), were selected for hemodynamic simulation in this study. The morphology of the artery and stent can influence stent patency and hemodynamic parameters.15,16We found that before and after EVAR, the pressure and blood flow velocity gradients were greater at the occlusion sites than at the pairs of healthy control sites. The reason may be that velocity increases at the stenosis, and the pressure at the stenosis decreases rapidly. The increased velocity impinges on the endothelial cells of the vessel leading to endothelial damage and thrombus formation eventually causing occlusion.1 17
Blood flow in the occluded iliac branches was relatively reduced, and turbulent flow was seen proximal to the occlusion site. Laminar flow is a normal blood flow pattern, which is manifested by a faster blood flow velocity in the central region the closer to the arterial wall the slower the blood flow velocity, and the blood flow pattern is similar to the central region. 18 The occurrence of turbulence is related to velocity, vessel diameter and blood viscosity. Turbulent flow is the flow of blood in a rotating or gyrating form in the duct, which usually occurs at duct bends or bifurcations. In this study, the iliac branch occlusion blood flow pattern was dominated by turbulent flow. It has been found that thrombosis is facilitated under turbulent flow conditions. 19
In this study, WSS and TAWSS were lower at the occluded site than at the nonoccluded site in both the preoperative and postoperative periods. It has been suggested that endothelial cells are the only cell layer in direct contact with blood flow and that wall shear stress can activate endothelial cells to influence cell alignment. 20 Low WSS leads to endothelial cell disorders, and there is a correlation between WSS and atherosclerosis and arterial thrombosis. 21 WSS not only influence the development of atherosclerosis, but may also directly alter plaque composition and thus plaque vulnerability, and is also associated with thrombosis. 22 We found that the WSS is increased at the stenosis and is unevenly distributed in the same plane, and decreases sharply in the post-stenosis region.
In this study, we found that TAWSS was reduced at occluded sites but elevated at nonoccluded sites. Factors influencing TAWSS include stenting and abdominal aortic aneurysm morphology. 23 Studies have shown that a decrease in TAWSS is strongly associated with thrombosis. 24 Therefore, special attention should be paid to the possibility of iliac branch occlusion if TAWSS decreases after EVAR. Our results found that velocity, WSS, and TAWSS were elevated at the stenosis, and pressure, OSI, and RRT were decreased at the stenosis. Streamlines were reduced at stenotic sites. We hypothesize that performing hemodynamic analysis on patients after EVAR and discovering the above results is conducive to the early identification of patients with iliac branch occlusion.
Limitations
First, this study included a limited sample size and was a retrospective study. Second, the simulation analysis required a certain level of assumptions, which could potentially lead to biased results. Third, the study did not measure quantitative indicators.
Conclusion
Computational fluid hemodynamic analysis identified consistent flow disturbances associated with iliac limb occlusion following EVAR. The influential hemodynamic alterations included elevated velocity and WSS at stenotic sites, as well as increased OSI and RRT in the post-stenotic region. These findings suggest that CFD-based hemodynamic assessment may help stratify patients at risk of iliac branch occlusion before clinical manifestation.
Supplemental material
Supplemental material—Computational fluid hemodynamic based analyisis of the aorto iliac segment before the development of post EVAR iliac branch occlusion
Supplemental material for Computational fluid hemodynamic based analyisis of the aorto iliac segment before the development of post EVAR iliac branch occlusion by Han Yang, Qian-hui Tang, Ming Hu, Zhong Qin, Si-en Guo, Hai-lin Lu, Wen-hong Jiang, Zhan-man Zhang, and Xiao Qin in Vascular
Footnotes
Acknowledgments
This work was supported by the National Natural Science Foundation of China (NO. 82260099,81960091). Chinese Academy of Medical Sciences Medical and Health Science and Technology Innovation Project (NO. 2016-CXGC01-3).
Author contributions
Conception and design: H Yang, Q Xiao.
Administrative support: H Yang, Q Tang, Q Xiao.
Collection and assembly of data: H Yang, Q Tang, M Hu.
Data analysis and interpretation: H Yang, Q Tang, M Hu, Z Qin.
Manuscript writing: All authors.
Final approval of manuscript: All authors.
Declaration of conflicting interests
The authors declared no potential conflicts of interest with respect to the research, authorship, and/or publication of this article.
Funding
The authors disclosed receipt of the following financial support for the research, authorship, and/or publication of this article: This study was funded by the National Natural Science Foundation of China (NO. 82260099,81960091). Chinese Academy of Medical Sciences Medical and Health Science and Technology Innovation Project (NO. 2016-CXGC01-3).
Ethical considerations
The study was approved by the Ethics Committee of the First Affiliated Hospital of Guangxi Medical University (NO.2024-E250-01). This was a single-center retrospective study. Institutional review board approval was not required to conduct this study. Individual consent for this retrospective analysis was waived.
Data Availability Statements
The data will be shared upon reasonable request to the corresponding author.
Supplemental material
Supplemental material for this article is available online.