
Abstract
We present a study about the prediction of long-COVID sequelae through multi-label classification (MLC). Data on more than
Introduction
In the last years, the intelligent analysis of clinical data has become a cornerstone of modern biomedical research. An increasing number of projects focus on the definition of biomedical databanks, and their analysis through machine and deep learning techniques. Notably, databanks can be fed from different sources (e.g., electronic health records, clinical trial data, laboratory analysis results), which are usually updated over time. In such contexts, it is useful to provide practitioners with direct and easy access to sophisticated AI-driven data analysis.
In this paper, we move a step forward in such a direction, by studying how machine learning techniques can be adopted in order to work with a real-world databank. This work is part of the TECNOMED-HUB research project (Tecnomed-hub, 2023), which aims at building a research platform supporting the collection and intelligent analysis of long-COVID data, but with the long-term goal of being applicable to a wide range of other diseases. In particular, the goal of this study is to define a framework for predicting long-COVID sequelae, based on patients’ clinical data collected during the acute phase of COVID infection.
Following the characterization in Nalbandian (2021), post(long)-COVID-19 syndrome consists of signs and symptoms (sequelae) consistent with COVID-19 that are present beyond 12 weeks of the onset of acute COVID-19 infection, and not ascribable to alternative causes (i.e., other diseases). From the machine learning point of view, considering the syndrome to be defined as the persistence of at least one of such symptoms, the characterization of the problem can be viewed as a Multi-Label Classification problem (see Section “Multi-label Classification”), where instances are the patients’ data collected at hospitalization, and the labels are the long-COVID symptoms persisting at follow-up.
Notably, such a kind of task characterizes a wide range of applications in the field of individualized predictive modelling where the onset of comorbidities is analyzed in a precise context; examples are reported for diabetes (Zhou et al., 2021), heart failure (Huang et al., 2023) and dyspnea (Baarts et al., 2021). Notice that differently from these works, our study focuses on the prediction of specific symptoms, rather than on the risk of comorbidities, making the clinical context slightly different, since the physician suspecting the insurgence of a given symptom can directly take this into account (for instance with specific therapies avoiding undesirable effects of such symptoms).
Coping with individualized predictive modelling in real-world settings implies working in a low-data regime and unbalanced labels. As a consequence, two different solutions could be adopted: upsampling techniques and feature reduction. However, they both have some shortcomings. Upsampling may conflict with the evidence-based nature of the medical research field, where synthetic data may be carefully considered. On the other hand, even if feature reduction may potentially partially alleviate the curse of dimensionality problem (and then to mitigate the fact that the learned model is prone to high variance in the presence of a limited training set), there is no guarantee that only relevant features are maintained; in particular, by exploiting a supervised approach, the limited number of cases may incorrectly estimate the actual correlation among the features and target attributes, while an unsupervised approach can only rely on a limited set of examples in order to characterize most important features (for instance in terms of data variance).
To this end, one of the goals of our work is to evaluate which upsampling and feature reduction techniques can be considered a valid trade-off between the need for a more balanced and stable dataset and keeping the synthetic data close to the real-world ones.
The results of the work described in this paper are twofold:
from the medical point of view, we investigated the correlation between long-COVID syndrome and the patients’ data, providing a framework to predict long-COVID sequelae; from the technological perspective, we defined a framework for the multi-label classification of symptoms working in a low-data regimen, that can be easily adapted for different tasks in the field of individualized predictive modelling.
The paper is organized as follows: Section “Multi-label Classification” summarizes the MLC framework and the adopted algorithms and evaluation criteria; Section “The Case Study: Long-COVID Syndrome” presents the case study with the characterization of the collected data; Section “Experimental Framework” describes the experimental part whose results are reported in Section “Results”; Section “Interpretability Analysis” presents an interpretability analysis of the obtained predictions, both in terms of clinical implications as well as of the impact of data augmentation techniques; final conclusions are then reported in Section “Conclusions”.
Multi-label Classification
Multi-Label Classification (MLC) can be defined as follows (Bogatinovski et al., 2022; Madjarov et al., 2012). Let us consider an instance space
MLC Methods
MLC can be approached in two different ways: problem transformation and algorithm transformation (Bogatinovski et al., 2022). Methods in the former category transform the multi-label dataset into one or more datasets that are then targeted using traditional single-label classification algorithms; they finally build one or multiple single-label models. Methods in the second category adapt traditional single-label algorithms to the multi-label setting such as decision trees, functional models (SVM or NN), instance-based models and probabilistic models.
In the present study we concentrate on the problem transformation approaches, which is the most widely adopted in MLC; in fact, most of the algorithm transformation methods actually rely on an internal problem transformation in order to solve the MLC task. Moreover, this allows in principle to experiment with a larger number of base classifiers.
Concerning problem transformation methods, they can further be divided into binary, multi-class or ensemble methods (Bogatinovski et al., 2022). In binary methods, each pair of labels is considered to produce a set of single-target binary datasets following a one-vs-all strategy; the results is the construction of
MLC: Characterization and Evaluation Measures
MLC dataset characterization is a very important aspect, especially in terms of label distribution and balancing. Different measures can be used to characterize a dataset for MLC (Tarekegn et al., 2021) starting from basic measures such as number of instances, number of attributes, number of labels, number of distinct label-sets. Another characterization can be given in terms of label distribution through measures such as label cardinality (average number of labels in the examples) and label density (the cardinality divided by the number of labels), as reported in equation (1):

Finally, the
Concerning evaluation measures for MLC, several metrics have been proposed with very different aims. They can be categorized as bipartition-based and ranking-based (Gibaja & Ventura, 2015). In our setting, bipartition-based are more significant, since the emphasis is on predicting the right set of long-COVID symptoms, rather than a correct ranking. In the present study, we then consider some of the most popular and natural bipartition-based metrics. Let
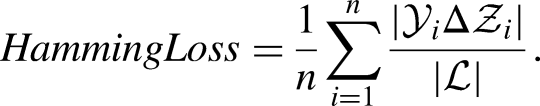
HammingScore=1-HammingLoss where HammingLoss evaluates how many times, on average, an example-label pair is misclassified:
We will finally consider the AUC (Area Under Roc Curve) in the macro-averaged version (the metric is computed independently for each label and then averaged). Since in our case all labels have the same importance (they should be treated equally as one of the symptoms of long-COVID), macro-average is preferred to micro-averaging (where the specific measures of each class are combined together).
The Case Study: Long-COVID Syndrome
Problem Characterization
The focus of the present paper refers to a long-COVID study realized at Ospedale Maggiore of Novara in Italy, where data about
Concerning patient characterization, baseline data indicate features of demographic and medical history of the patient, while hospitalization data refer to the patient’s symptoms at hospitalization (acute COVID-19 onset). Baseline data are not directly related to COVID-19 infection but are important factors to take into account in order to make an accurate diagnosis or prediction. Features in the baseline data can be grouped in terms of demographic characteristics (sex, age, smoking attitude,
Hospitalization data include the patient’s symptoms at COVID-19 onset (fever, cough, dyspnea, arthralgia,
The classification problem can then be described as follows: predict the presence of specific long-COVID sequelae at follow-up, using baseline and hospitalization information.
Dataset Analysis
The dataset produced in our long-COVID study (named orig in the following) resulted in
Some distributions concerning label and instances are reported in Figure 1, while the first row of Table 1 shows the main characterization measures of the original dataset we have obtained. Subsequent rows refer to augmented datasets described in the following (Section “Increasing the Sample Size”).
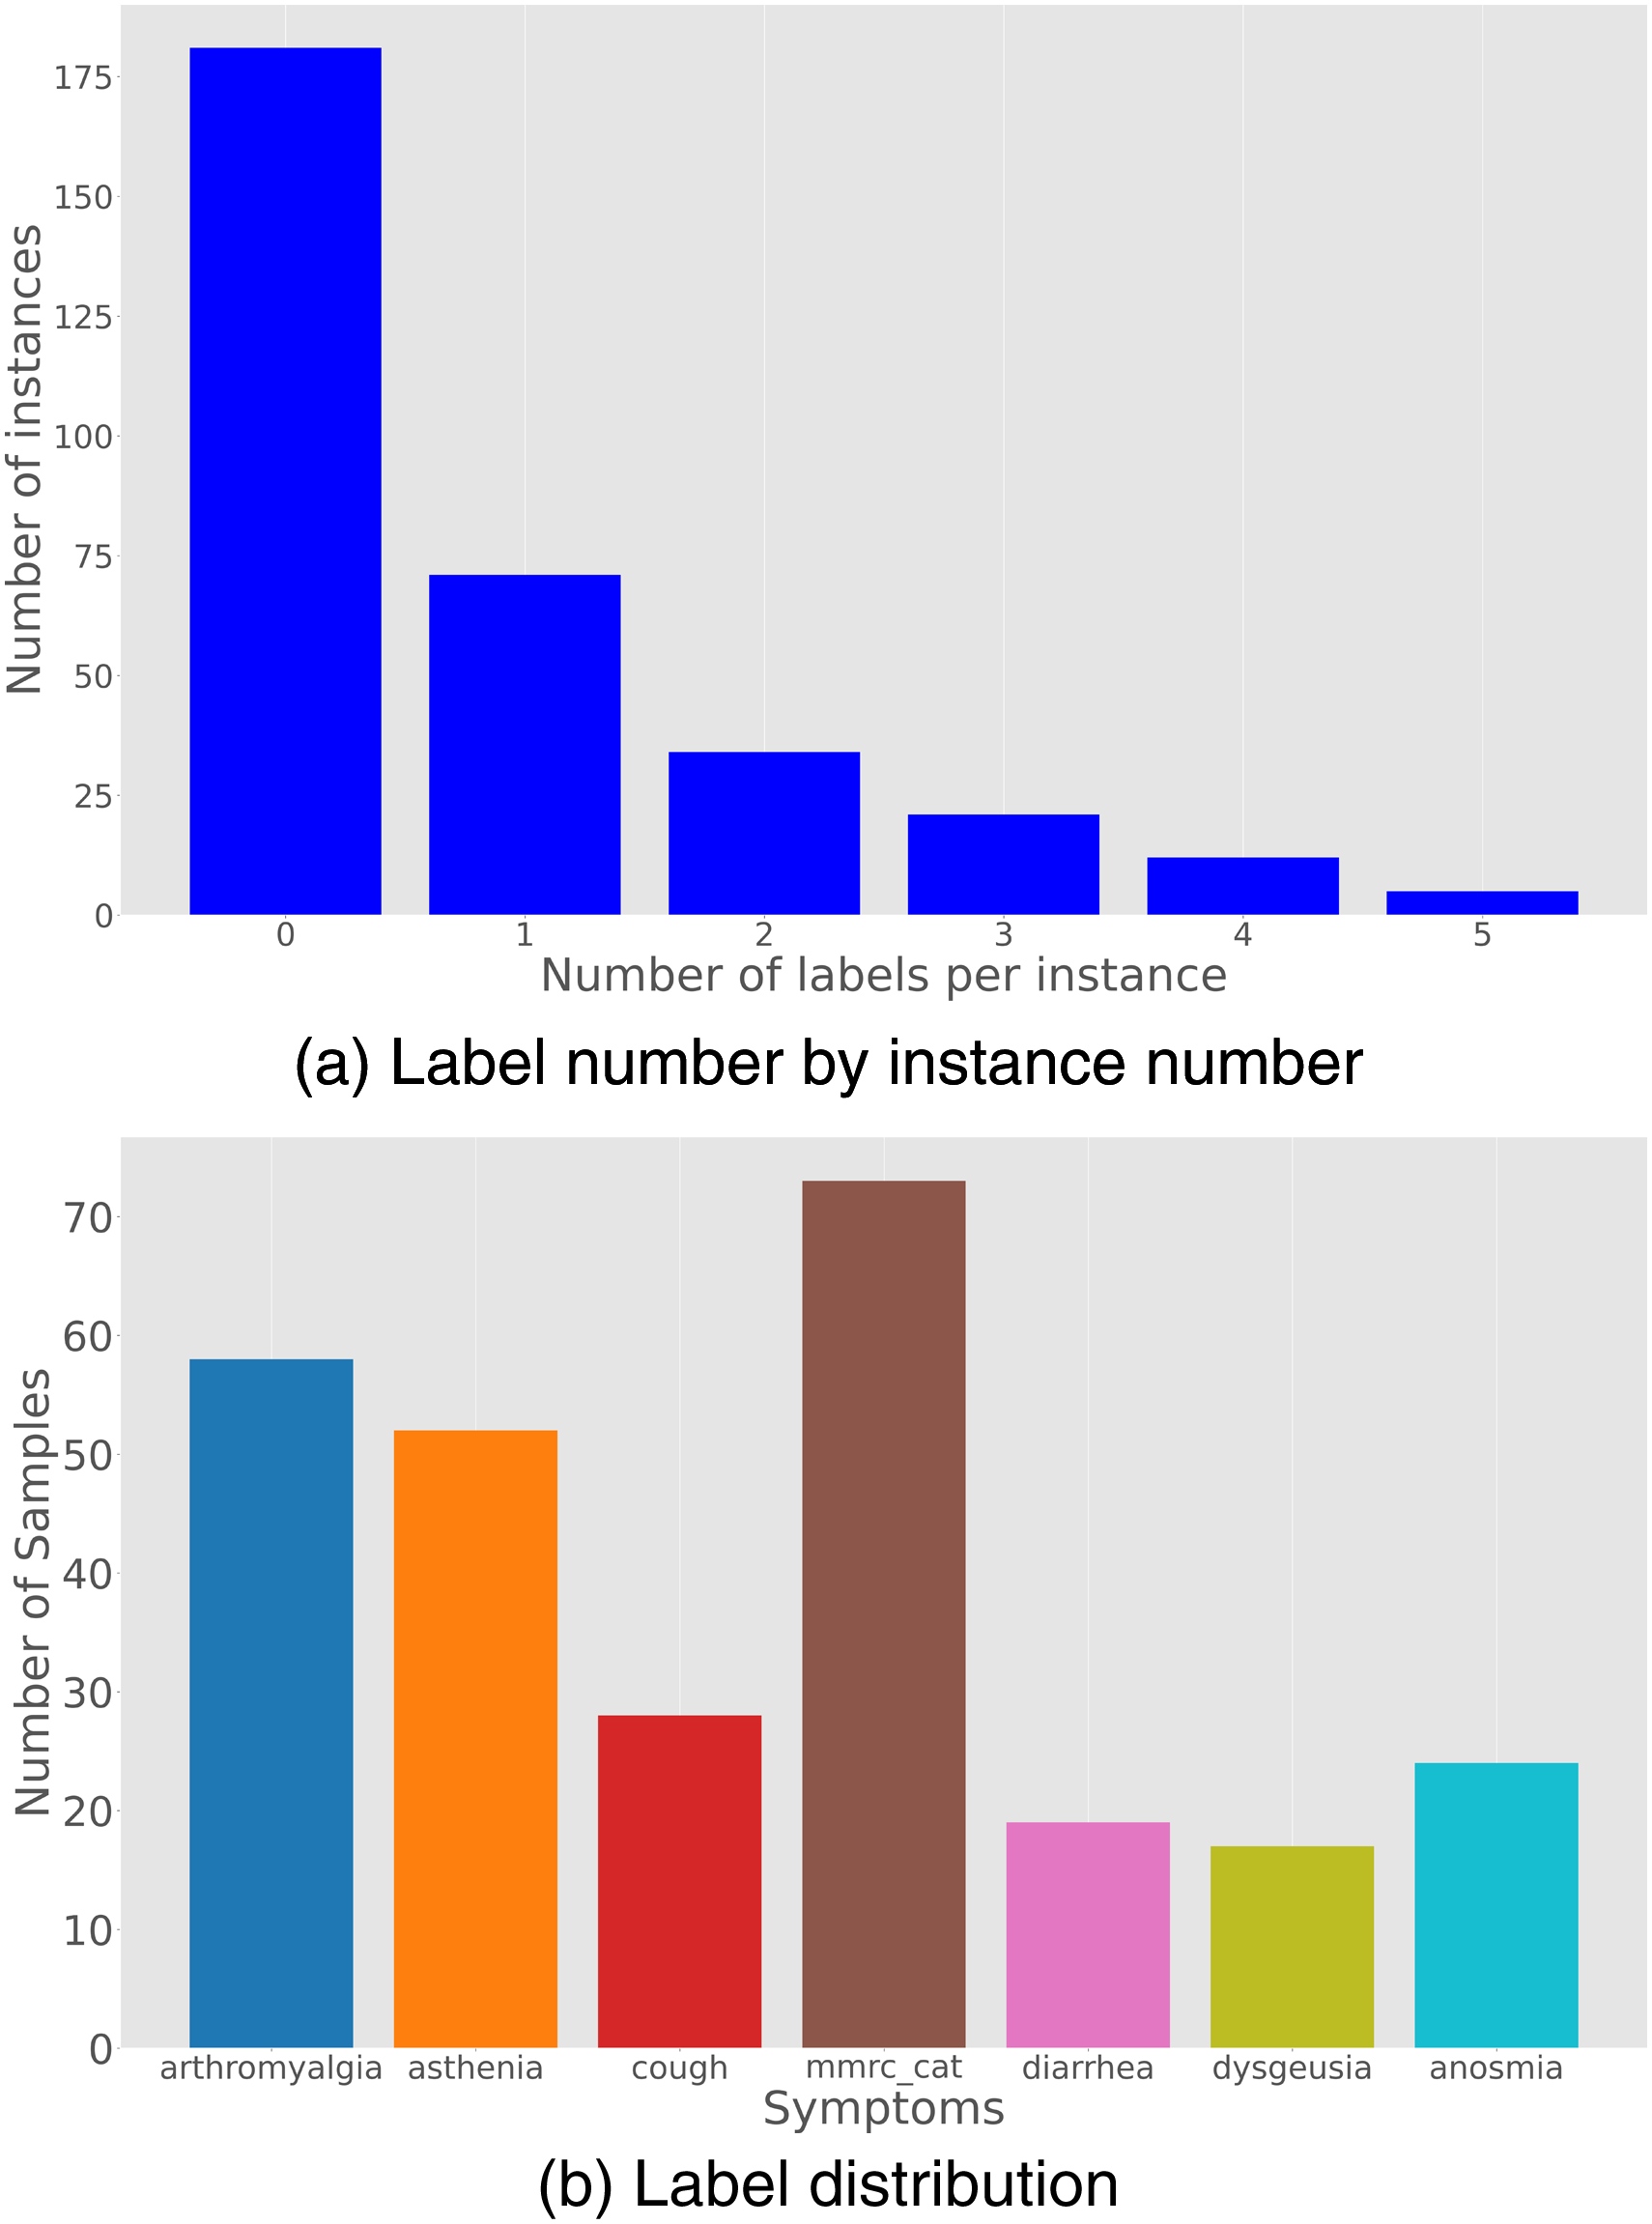
Original dataset. (a) Label number by instance number; (b) Label distribution.
Main Features of Considered Datasets;
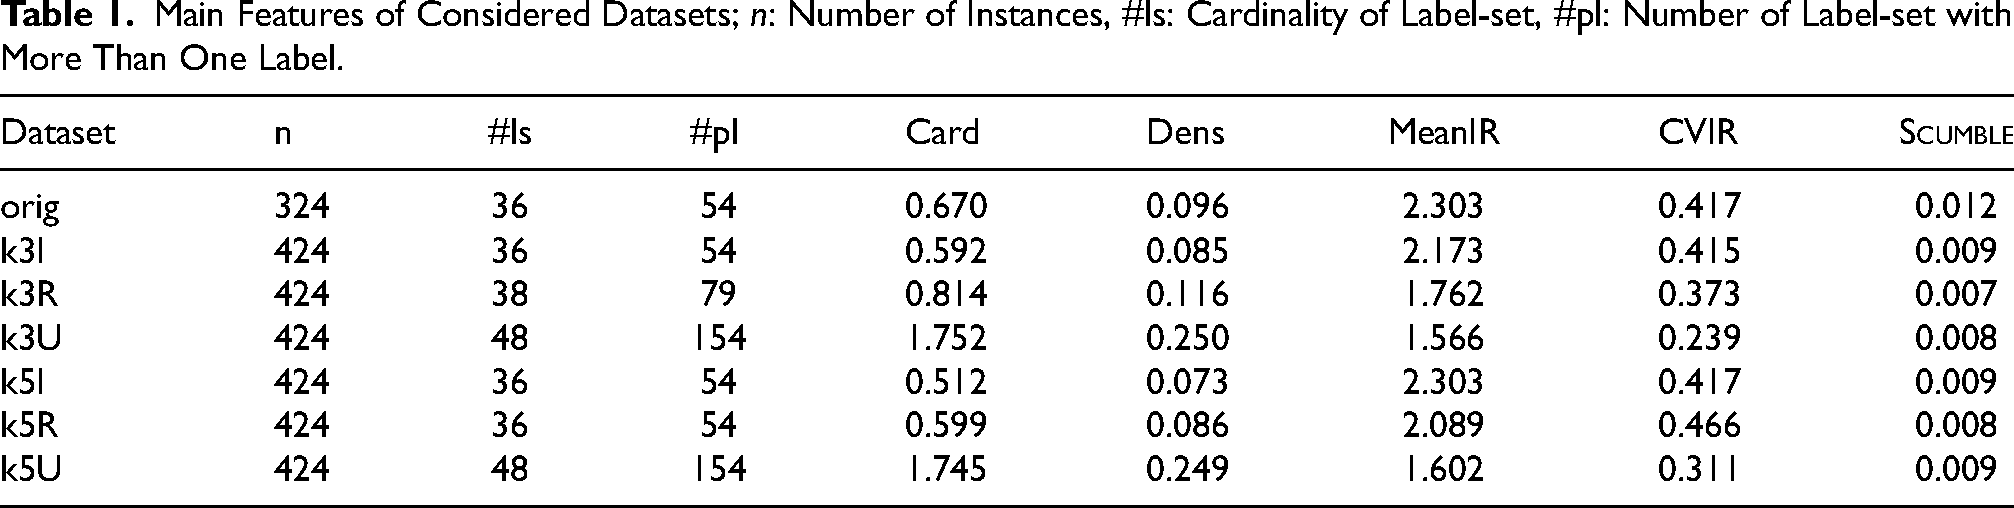
We can notice that the imbalance level (as measured by MeanIR) is significant, even if a low
An alternative to upsampling to handle the “high dimensionality vs low sample size” problem is to reduce the number of features through some feature reduction methods. 2 In the following we will discuss both alternatives starting from the upsampling approach.
Increasing the Sample Size
The first approach we have tested in order to get more significant analysis of the available data has been to resort to MLSmote (Charte et al., 2015), an upsampling technique suited to multi-label framework, producing new synthetic data by first identifying minority labels (using
We started from the original dataset (orig) and generated
We can notice that the more aggressive the augmentation (U more aggressive than R more aggressive than I), the larger the number of label-sets and the presence of label-sets with several labels, as reflected by cardinality and density as well. This allows also to reduce the label imbalance, by also keeping the
To give an intuition of how MLSmote influences the resulting labelsets, Figure 2 reports the concurrence plots among the labels for datasets orig and K3U respectively. 3
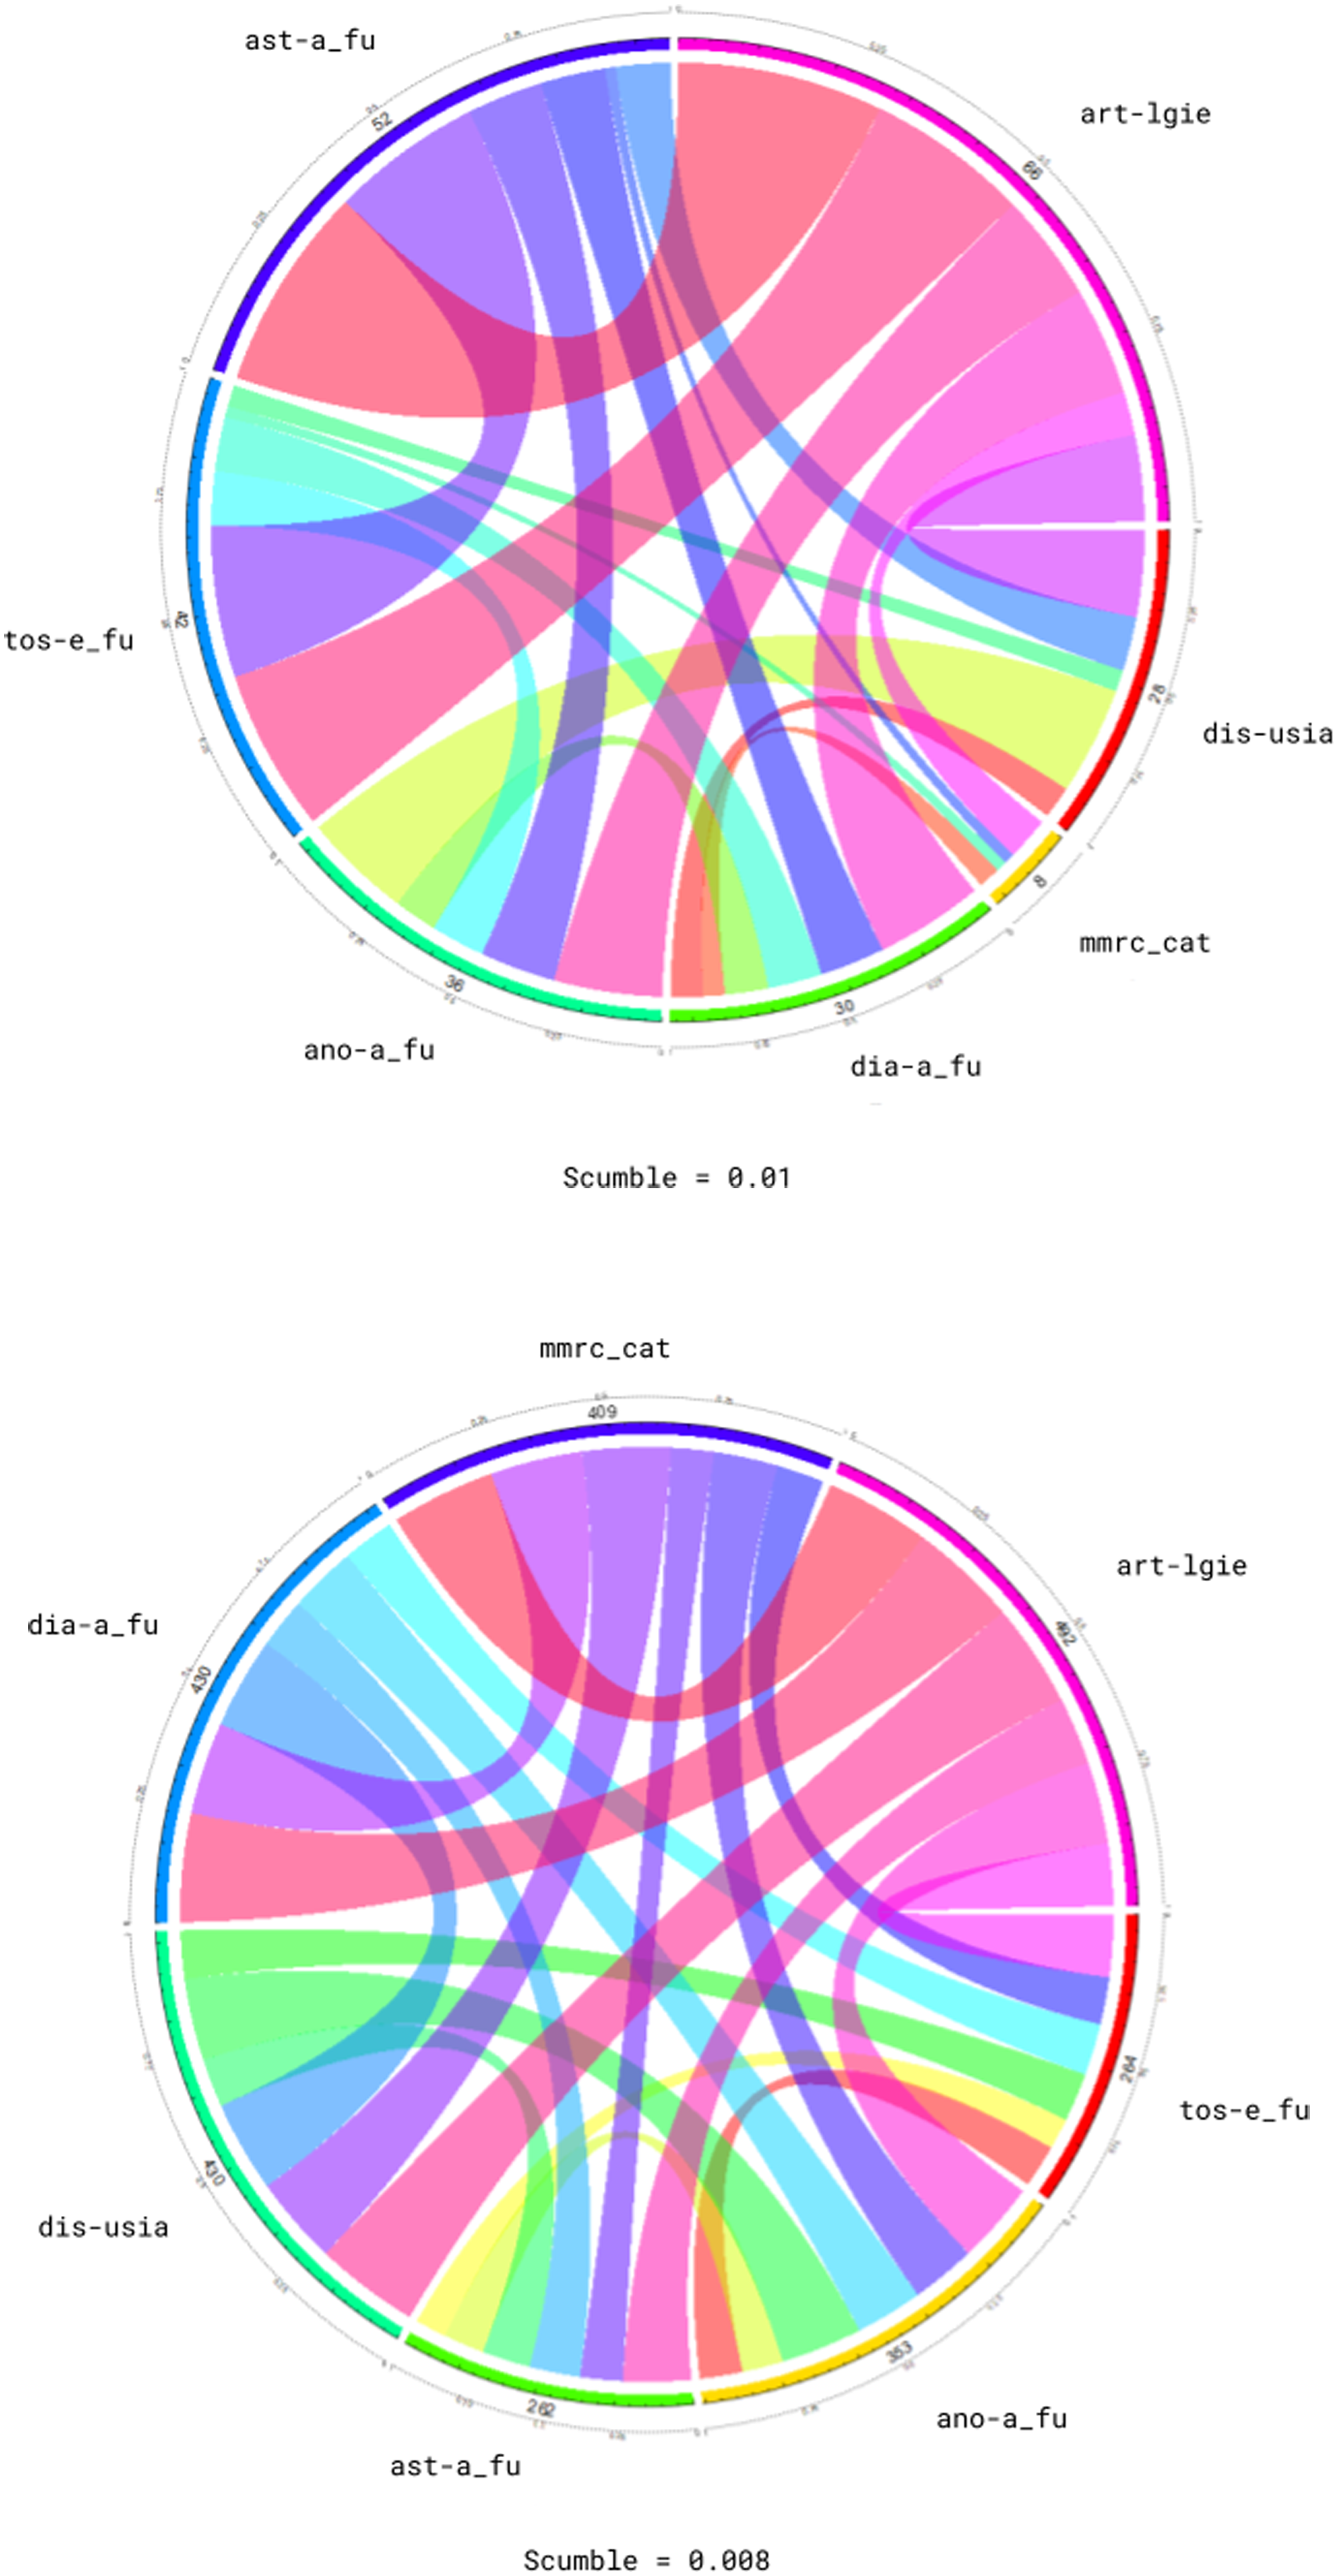
Concurrence plots: orig (upper) and k3U (lower).
Concurrence plots report interactions among labels. This plot is circular, with the circumference partitioned into arcs representing the labels. Each arc has length proportional to the number of instances having that particular label. Bands join two arcs, showing the relation between the corresponding labels. The width of each band is proportional to the number of instances in which both labels appear simultaneously. Plot concerning k3U (lower part of Figure 2) shows more uniform bands than plot concerning orig (upper part of Figure 2), meaning that the balance of the label-sets is more noticeable in the former than in the latter.
Dimensionality Reduction
In order to mitigate the problem of a reduced sample size with respect to the dimensionality of the problem, the second approach has been to consider some methods of feature reduction. We know that by taking under control the number of attributes (by avoiding noisy ones or those bringing along a low amount of significant information) may be a way of dealing with a reduced number of examples when evaluating predictive results (Portinale & Saitta, 2002). To this end, we have considered two different methods based on feature ranking: a supervised approach called
Since the method relies on a single label class, in order to apply it in the multi-label setting, we considered a single class label obtained from the possible label-sets occurring in the dataset (as in the
Concerning the unsupervised feature reduction, we removed the attributes related to the sequelae to be predicted and performed (again using
Experimental Framework
The experimental analysis has been performed using BR (Binary Relevance): a set of CC (Classifier Chain): labels are processed in a random order by a set of binary classifiers; each classifier predicts the presence of the corresponding label, by considering the classification produced by the previous ones, i.e., classifier BCC (Bayesian Classifier Chain): as the CC method, but the order in which labels are processed is not random; we tested two possible versions of BCC corresponding to different label ordering: BCC(I), where the label order is induced by the mutual information among labels, and BCC(C) where label ordering is determined by label co-occurrence counts. LC (Label Combination): the problem features are augmented with a class attribute taking discrete values in the range PS (Pruned Set): first it prunes all examples having label-sets that occur less than CDN (Conditional Dependency Network): it builds a fully-connected network where nodes are the labels, then it builds a set of binary classifiers ( RAkEL (RAndom k-labEL Pruned Sets): it randomly draws
The tested MLC methods are
It is worth to remark that multi-class methods rely on the label-sets which are actually present in the data. A suitable data augmentation strategy could be really important to consider potential label-sets which are not occurring in the original dataset.
Results
This section presents the comparative results obtained by the MLC algorithms described in Section “Experimental Framework”, on the considered datasets. We tested all the methods using
Accuracy (Jaccard Index).
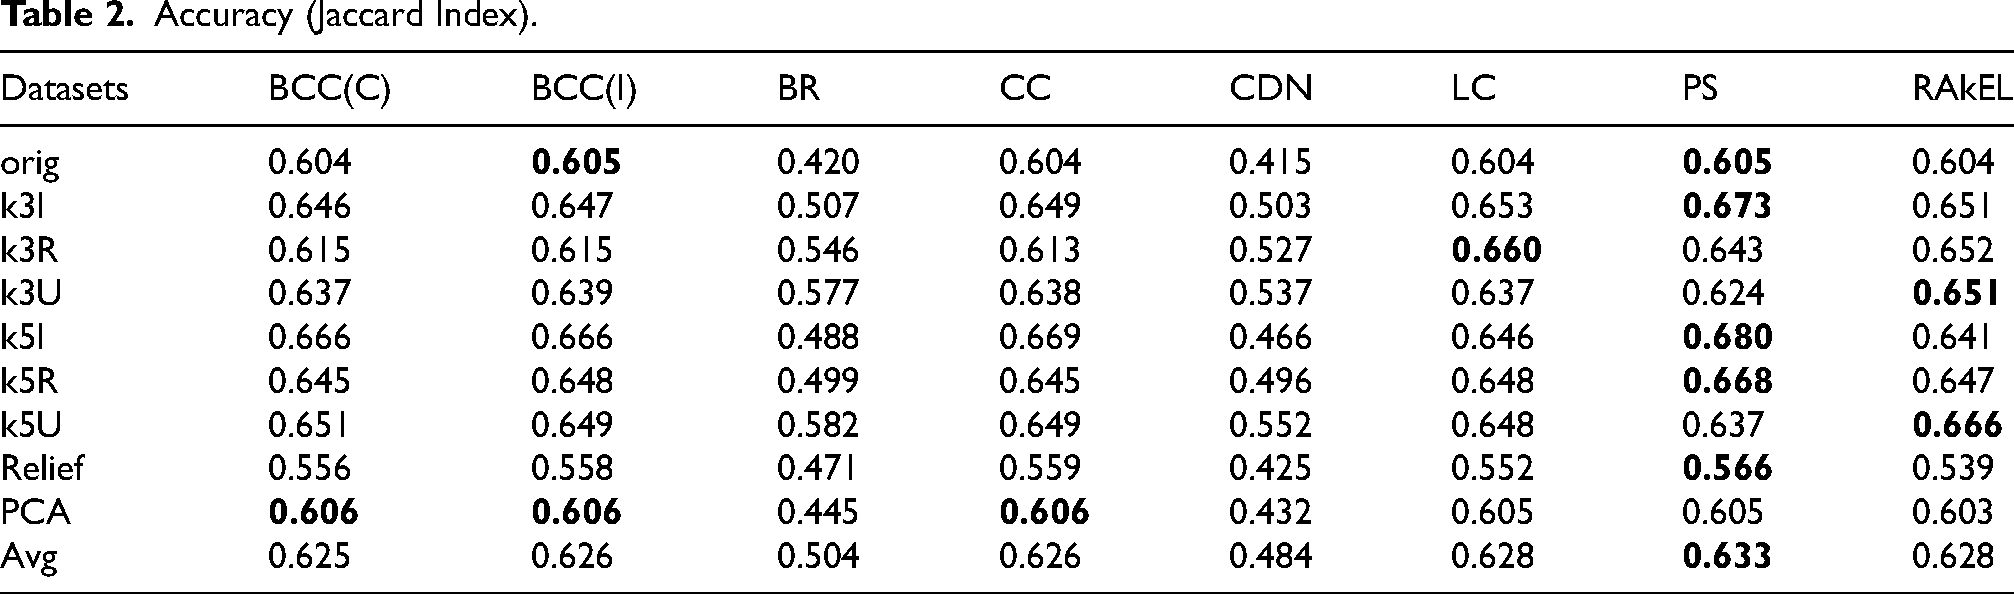
We can notice that multi-class methods have better performance, with chain classifiers showing very close results (independently from label ordering). The use of an ensemble (RAkEL) does not actually improve the basic PS version. As also outlined in Section “MLC: Characterization and Evaluation Measures”, reported scores can be regarded as quite satisfactory results. However, by looking at the scores obtained on each specific datasets, we can notice that the feature reduction obtained through
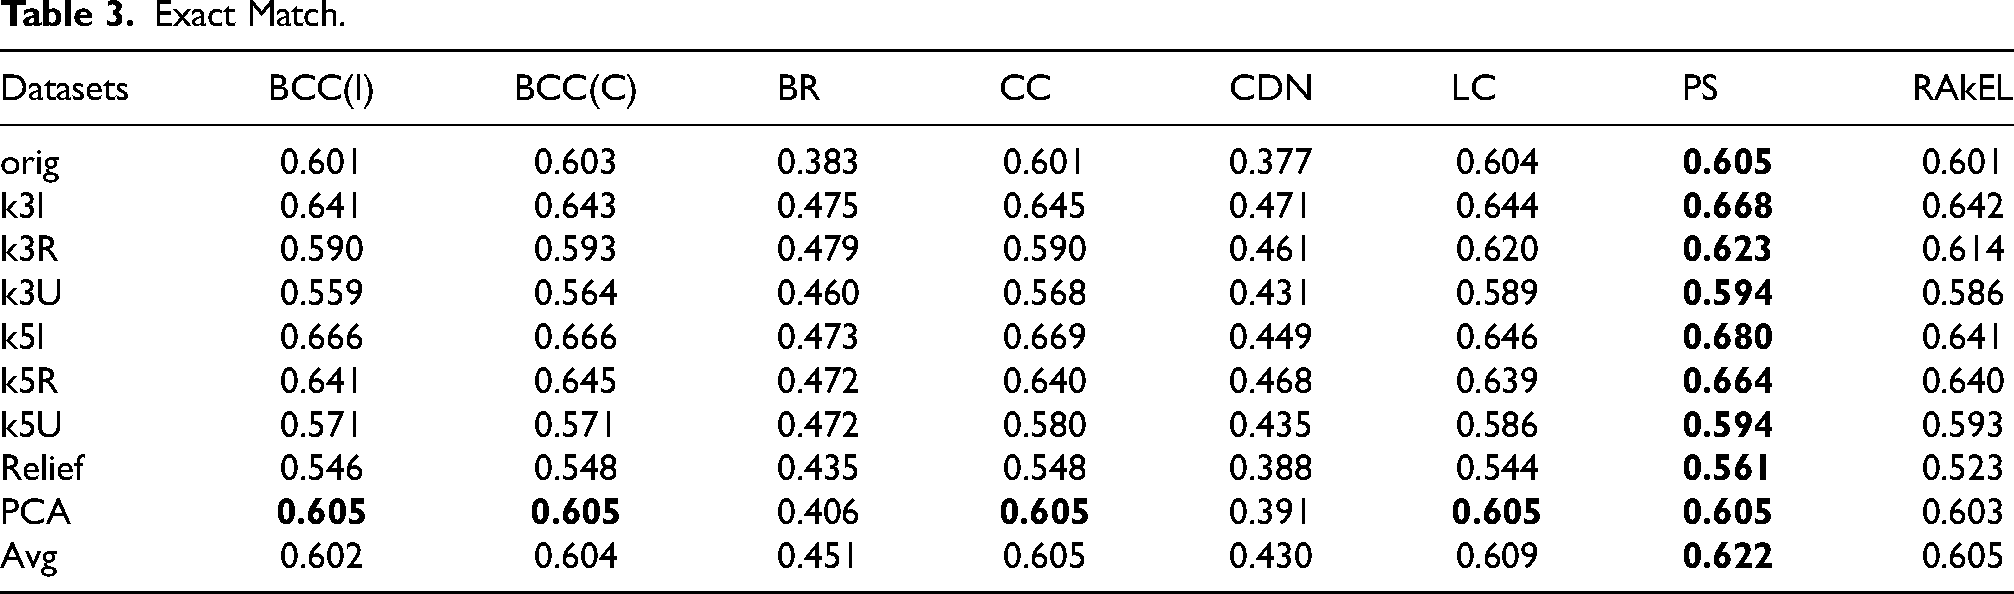
Exact Match.
The last bipartition-based metric we have considered is the Hamming score and results are shown in Table 4. The obtained scores are in general very good, again with comparable performances of multi-class methods and classifier chains. As before, for feature reduction approaches we notice that PCA is usually providing the same results as the use of every available feature, while the reduction proposed by
Hamming Score.
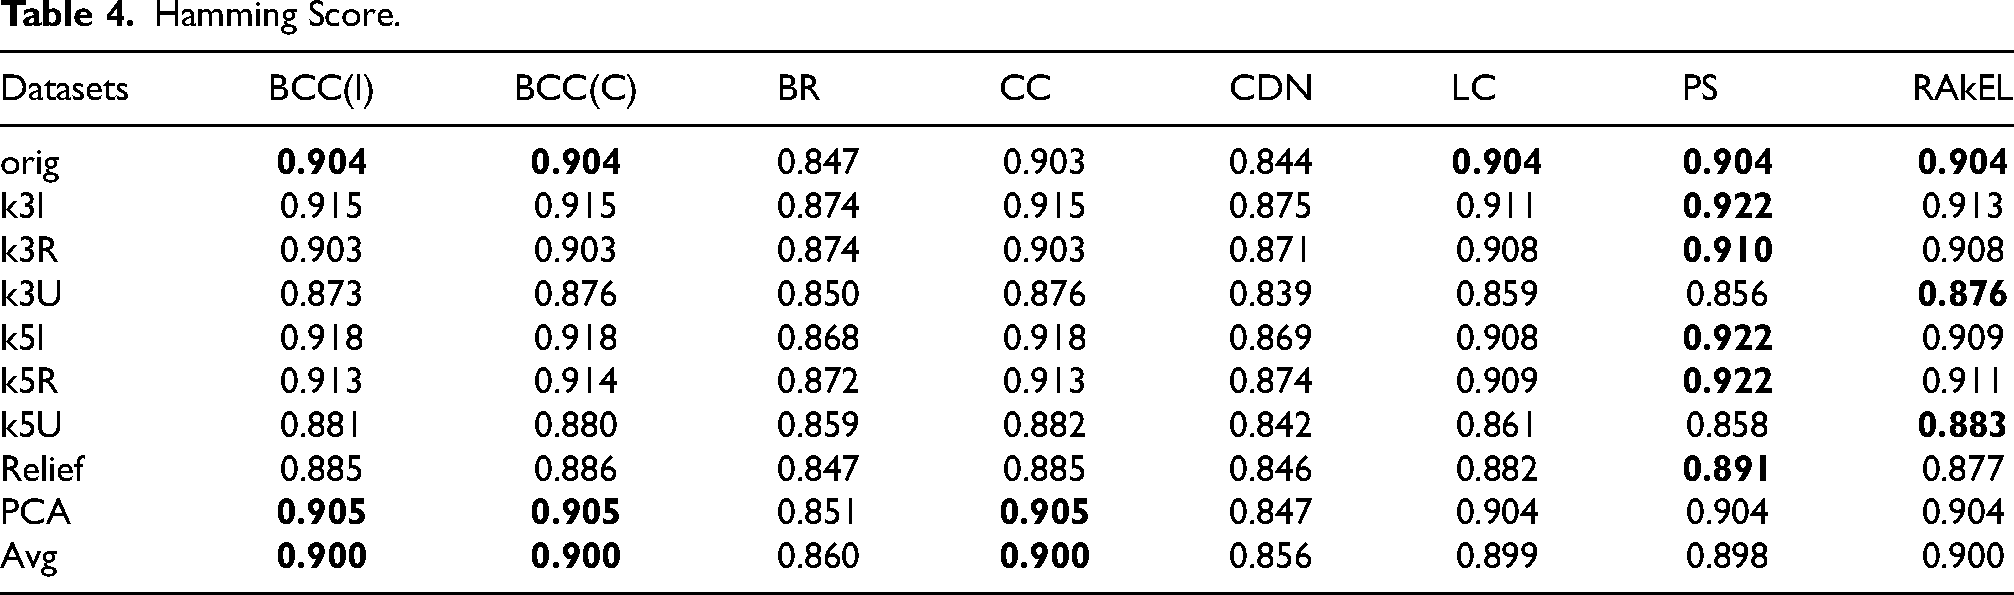
We can also notice that, in general, differently from the use of other datasets, the one obtained through PCA shows a more stable behavior (in terms of the considered evaluation measures) across all the tested methods. While for other datasets there are significant differences in the metrics depending on the adopted multi-label classification algorithm, in case of PCA this difference is not so evident.
Finally, we computed the macro-averaged AUC as shown in Table 5. In this case, the results of all methods are comparable over all datasets; a slightly better performance can be noticed for basic BR method and for the ensemble algorithm CDN. This can be explained by the fact that in these approaches the contribution of labels more represented dominates on the aggregated ROC, disregarding the contribution of some minority labels (that is usually better captured by multi-class methods). We also notice here that, in terms of AUC, the use of datasets obtained vie feature reduction does not allow the tested multi-label classification algorithms to reach performances close to the ones obtained on some upsampled datasets (in particular those using the union method of MLSmote).
Area Under ROC (Macro-averaged).
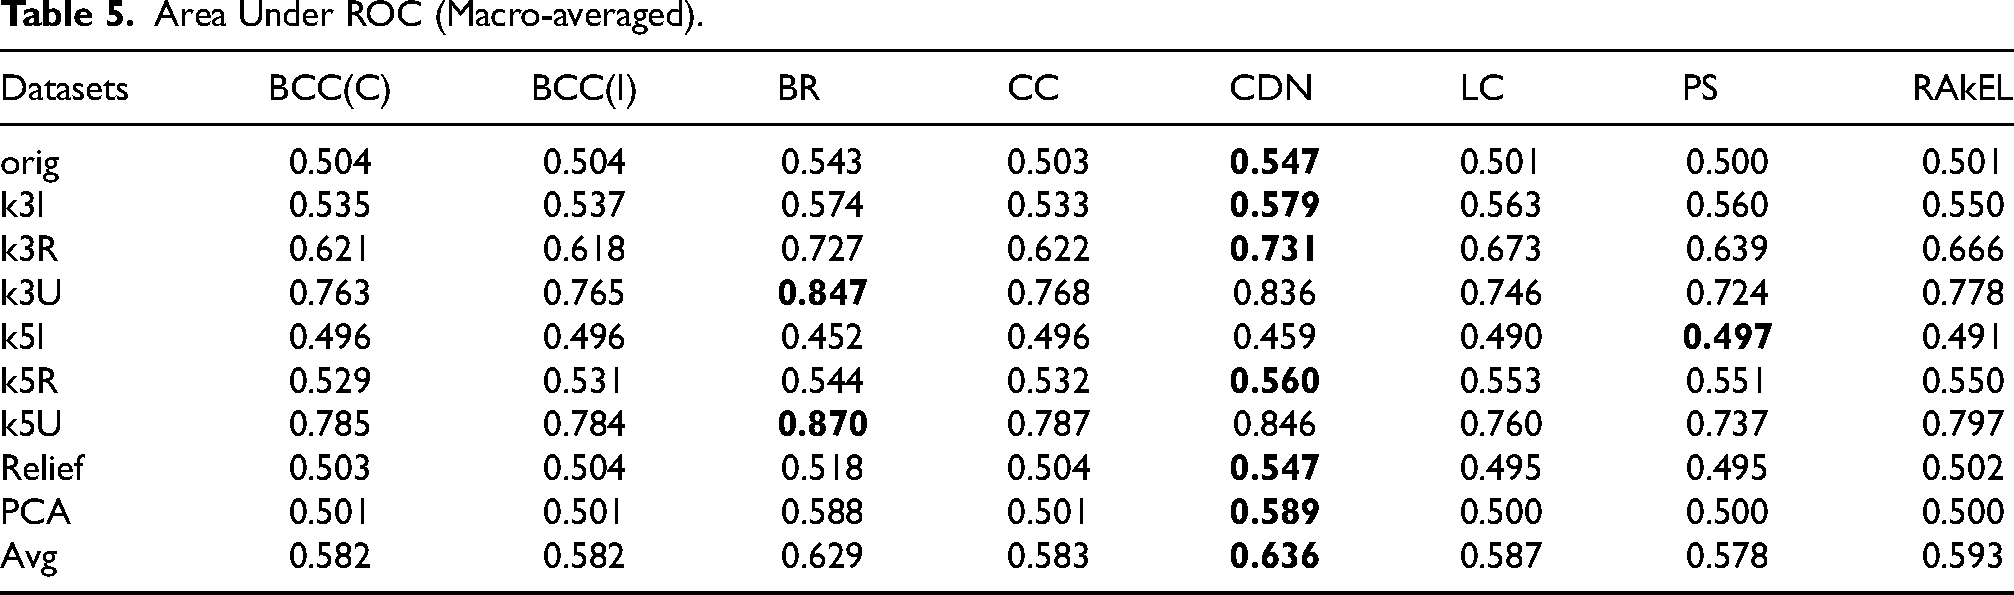
In conclusion, the performances of MLC methods highlight the capability of a multi-label classifier to obtain interesting predictions concerning long-COVID syndrome on the collected data (baseline and hospitalization). Such results can be improved with a suitable data augmentation, taking into careful consideration the main characteristics of the original data. On the other hand, feature reduction techniques (both supervised and unsupervised) do not appear to have any particular improvement over the use of the original data with the original dimensionality; aggressive dimensionality reduction (such as in the
Interpretability Analysis
To make our approach truly usable in the medical domain, an essential aspect is to provide physicians with techniques for the interpretability of the model’s predictions. To this purpose, we approached the problem by using the Shapley Additive Explanations (SHAP) framework (Lundberg & Lee, 2017). In short, for a given model prediction, SHAP assigns an importance value to each feature of the dataset. A SHAP value mathematically represents the contribution of each feature to a model’s prediction by distributing the difference between the specific prediction and the average prediction across all features. This distribution is based on cooperative game theory; more specifically, the Shapley value ensures that each feature’s impact is fairly calculated by considering all possible combinations of features and their marginal contributions to the prediction. These values can then be aggregated to provide a broader interpretation of which features, and their corresponding values, are most significant in predicting a particular label. Notably, in the context of multilabel classification, we can analyze the contribution of each label to the SHAP values. It is worth stressing that frameworks like SHAP are particularly useful for black-box models (such as Random Forest), where direct interpretation of the predictions is not straightforward.
The analysis has been divided into two parts. The first aspect we considered was providing domain experts (specifically, physicians) with direct interpretations of our models, in order to highlight aspects that are not visible through other means. To validate our interpretative findings, we sought evaluations from physicians to ensure consistency with existing medical knowledge on long-COVID syndrome, as reported in the literature.
A second key aspect of our experiments involved data augmentation using the MLSmote technique. We investigated how the upsampling method affects the interpretability of the model’s predictions by comparing the SHAP values of the features from the original dataset with those from the upsampled dataset.
All the experiments related to the interpretability have been conducted using the Random Forest model and using the PS approach to MLC (one of the best performing on average in our experimental analysis) and the best hyperparameters found through grid-search (see Section “Experimental Framework” for details).
Domain Experts Analysis
The first objective of this analysis was to develop tools, such as plots or indices, that could be provided to physicians for inspection. These tools enable domain experts to assess why the model has performed specific predictions, by revealing the key factors influencing the model’s decisions. We describe the SHAP plots used in this project and the conclusions drawn in collaboration with medical experts. To validate our approach, we reference relevant clinical literature that supports our findings wherever possible. It is worth noting that the fact that some of these findings are already established in the literature is an indications of the strength of our approach, ensuring that the method is robust and applicable, in a semi-automatic manner, especially for future analyses in the context of the TECNOMED-HUB research project.
The first type of representation we used is shown in Figure 3. This bar plot presents a broader level of aggregation by summing the SHAP values across all the samples in the dataset. The SHAP method assigns a value to each feature for every sample; we aggregated these values by calculating the sum of their absolute values across all samples. This approach allows us to assess the overall contribution of each feature to the model’s output. More specifically, each bar represents the contribution of a specific feature to the final prediction. The bar is divided into segments, with each segment (proportional to the SHAP value) reflecting the feature’s contribution to a particular label (different labels identified with different colors) within the model’s output.
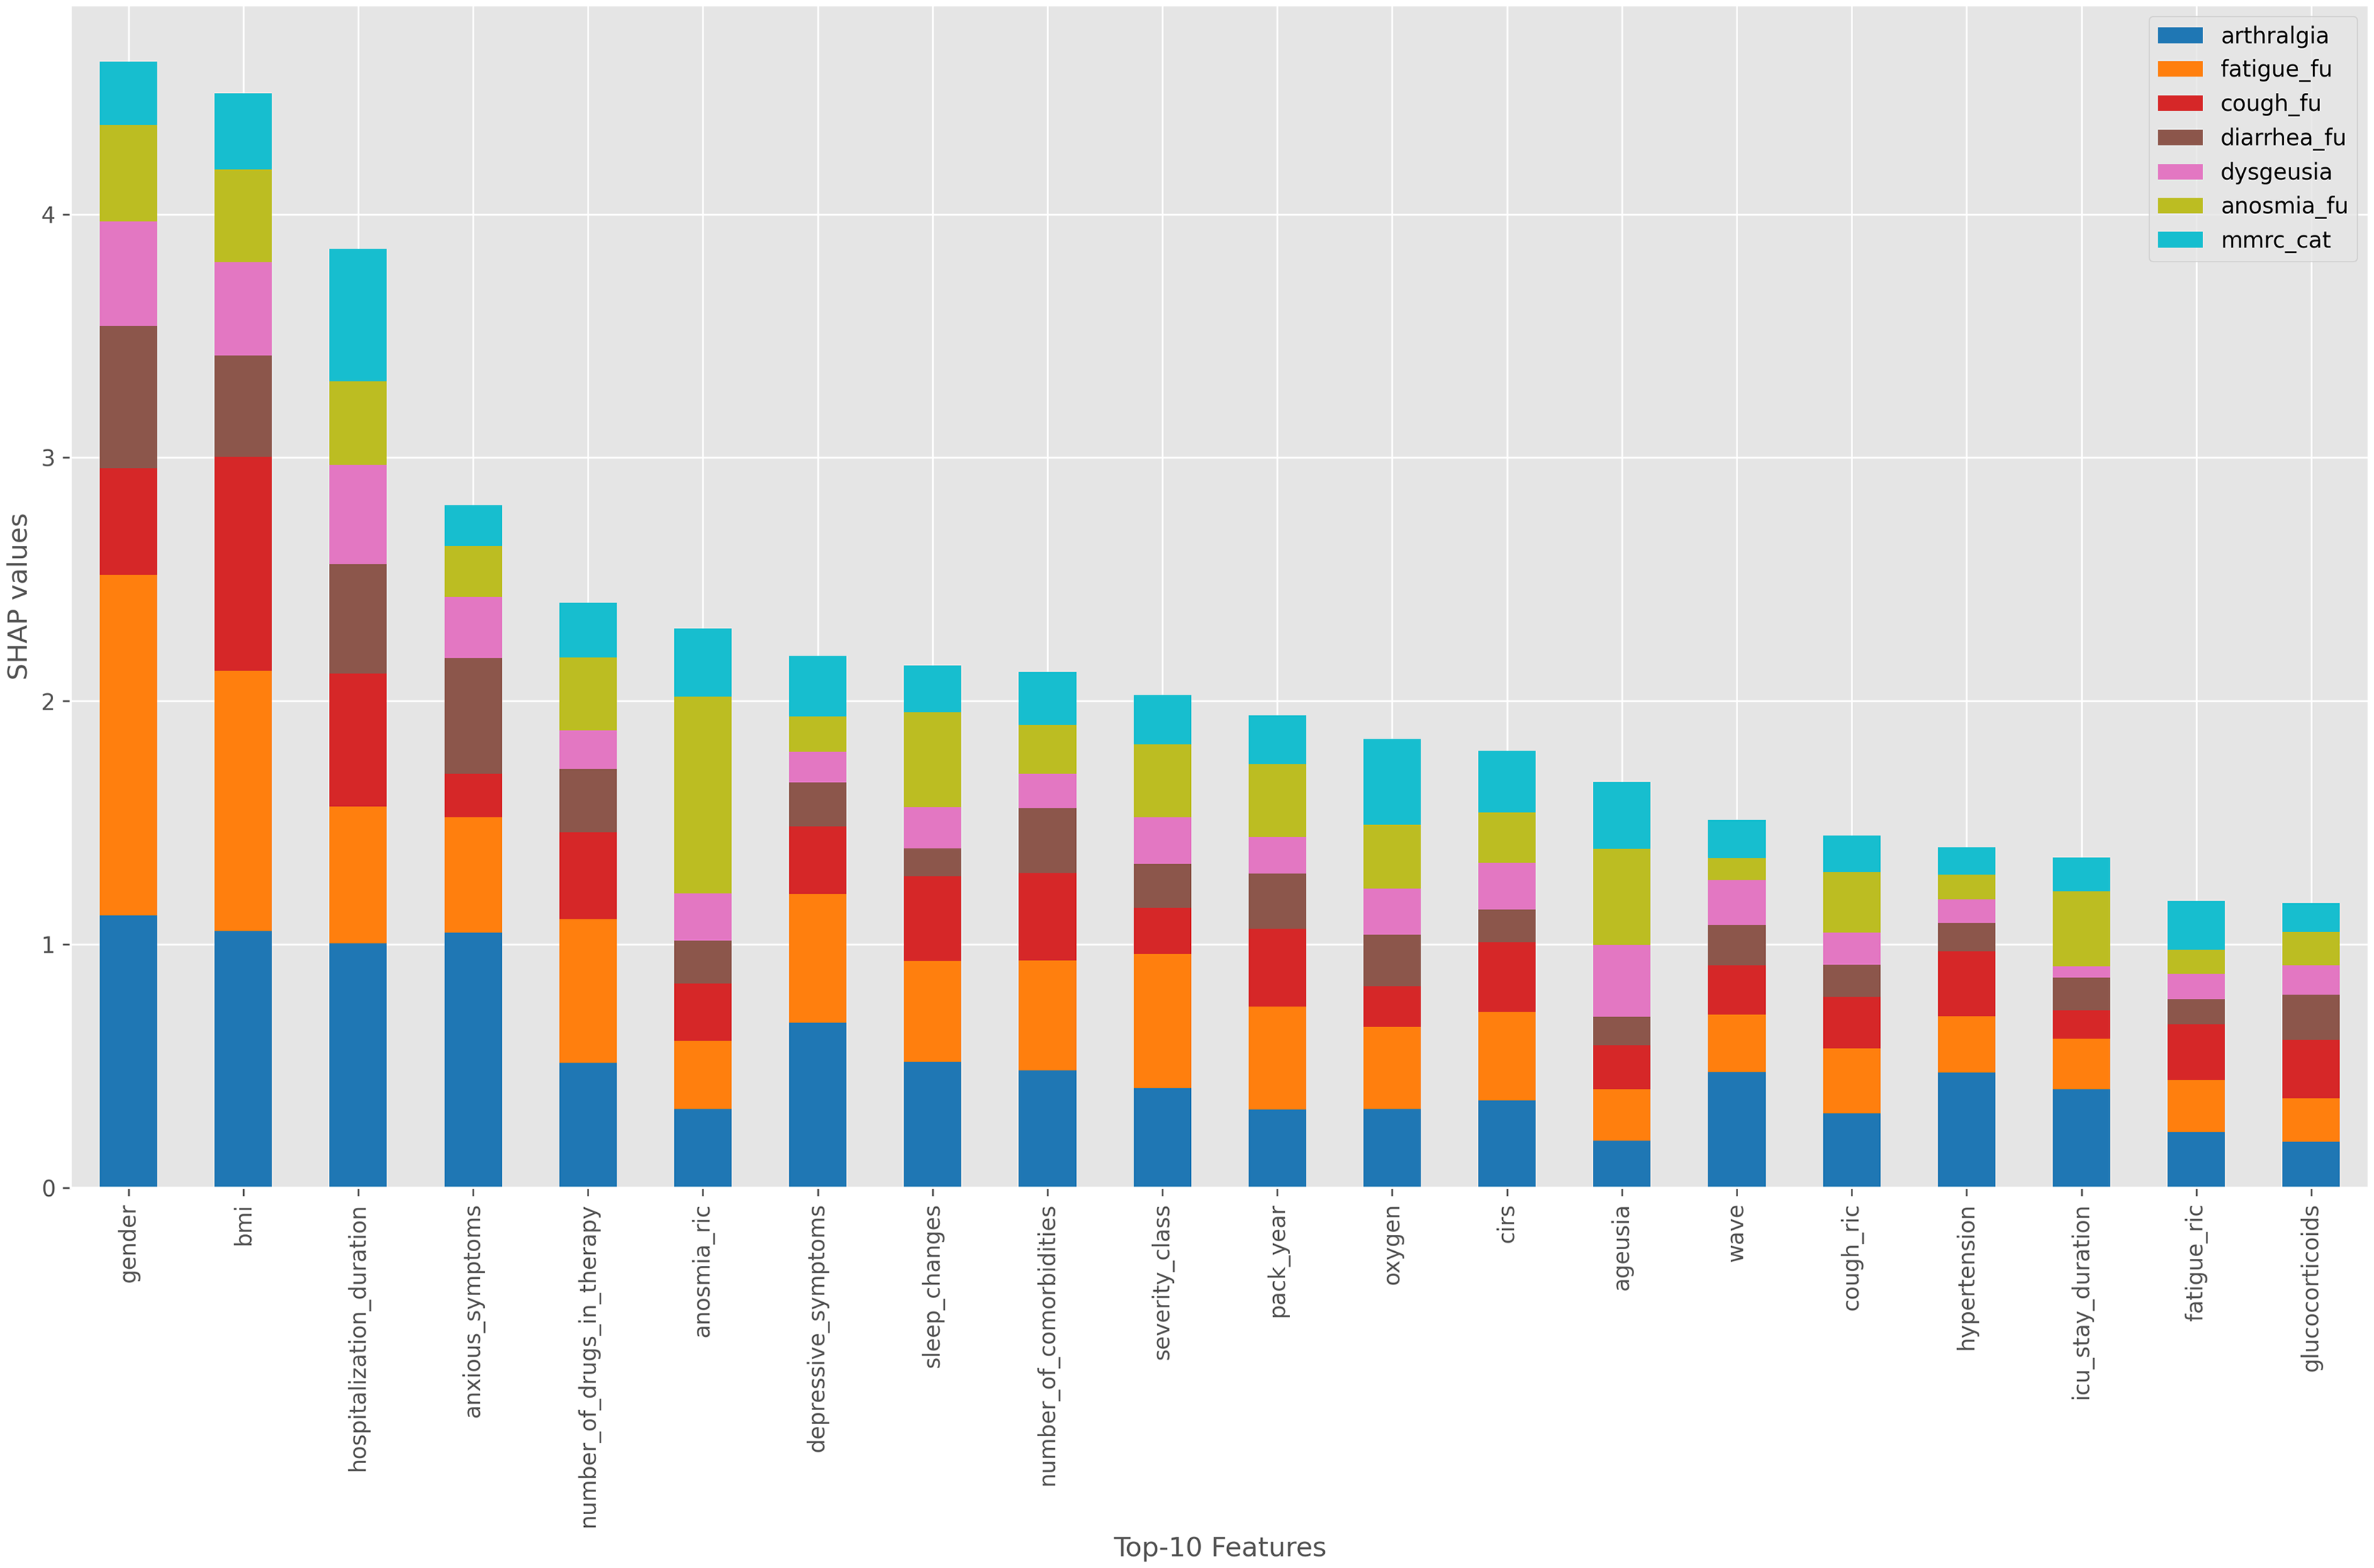
SHAP values for the original dataset using a Random Forest model.
For a more detailed analysis instead, we considered beeswarm plots, as shown in Figures 4 and 5. These plots provide insight at the level of individual samples, showing how SHAP values vary based on the specific value of each feature and a particular class. This allows us to determine how the values of a particular feature influence the final output. In a beeswarm plot each row is a scatterplot showing the distribution of SHAP values across all samples in the dataset, with the color of the points indicating the corresponding feature values (towards blue for small values and towards red for large values of the corresponding feature).
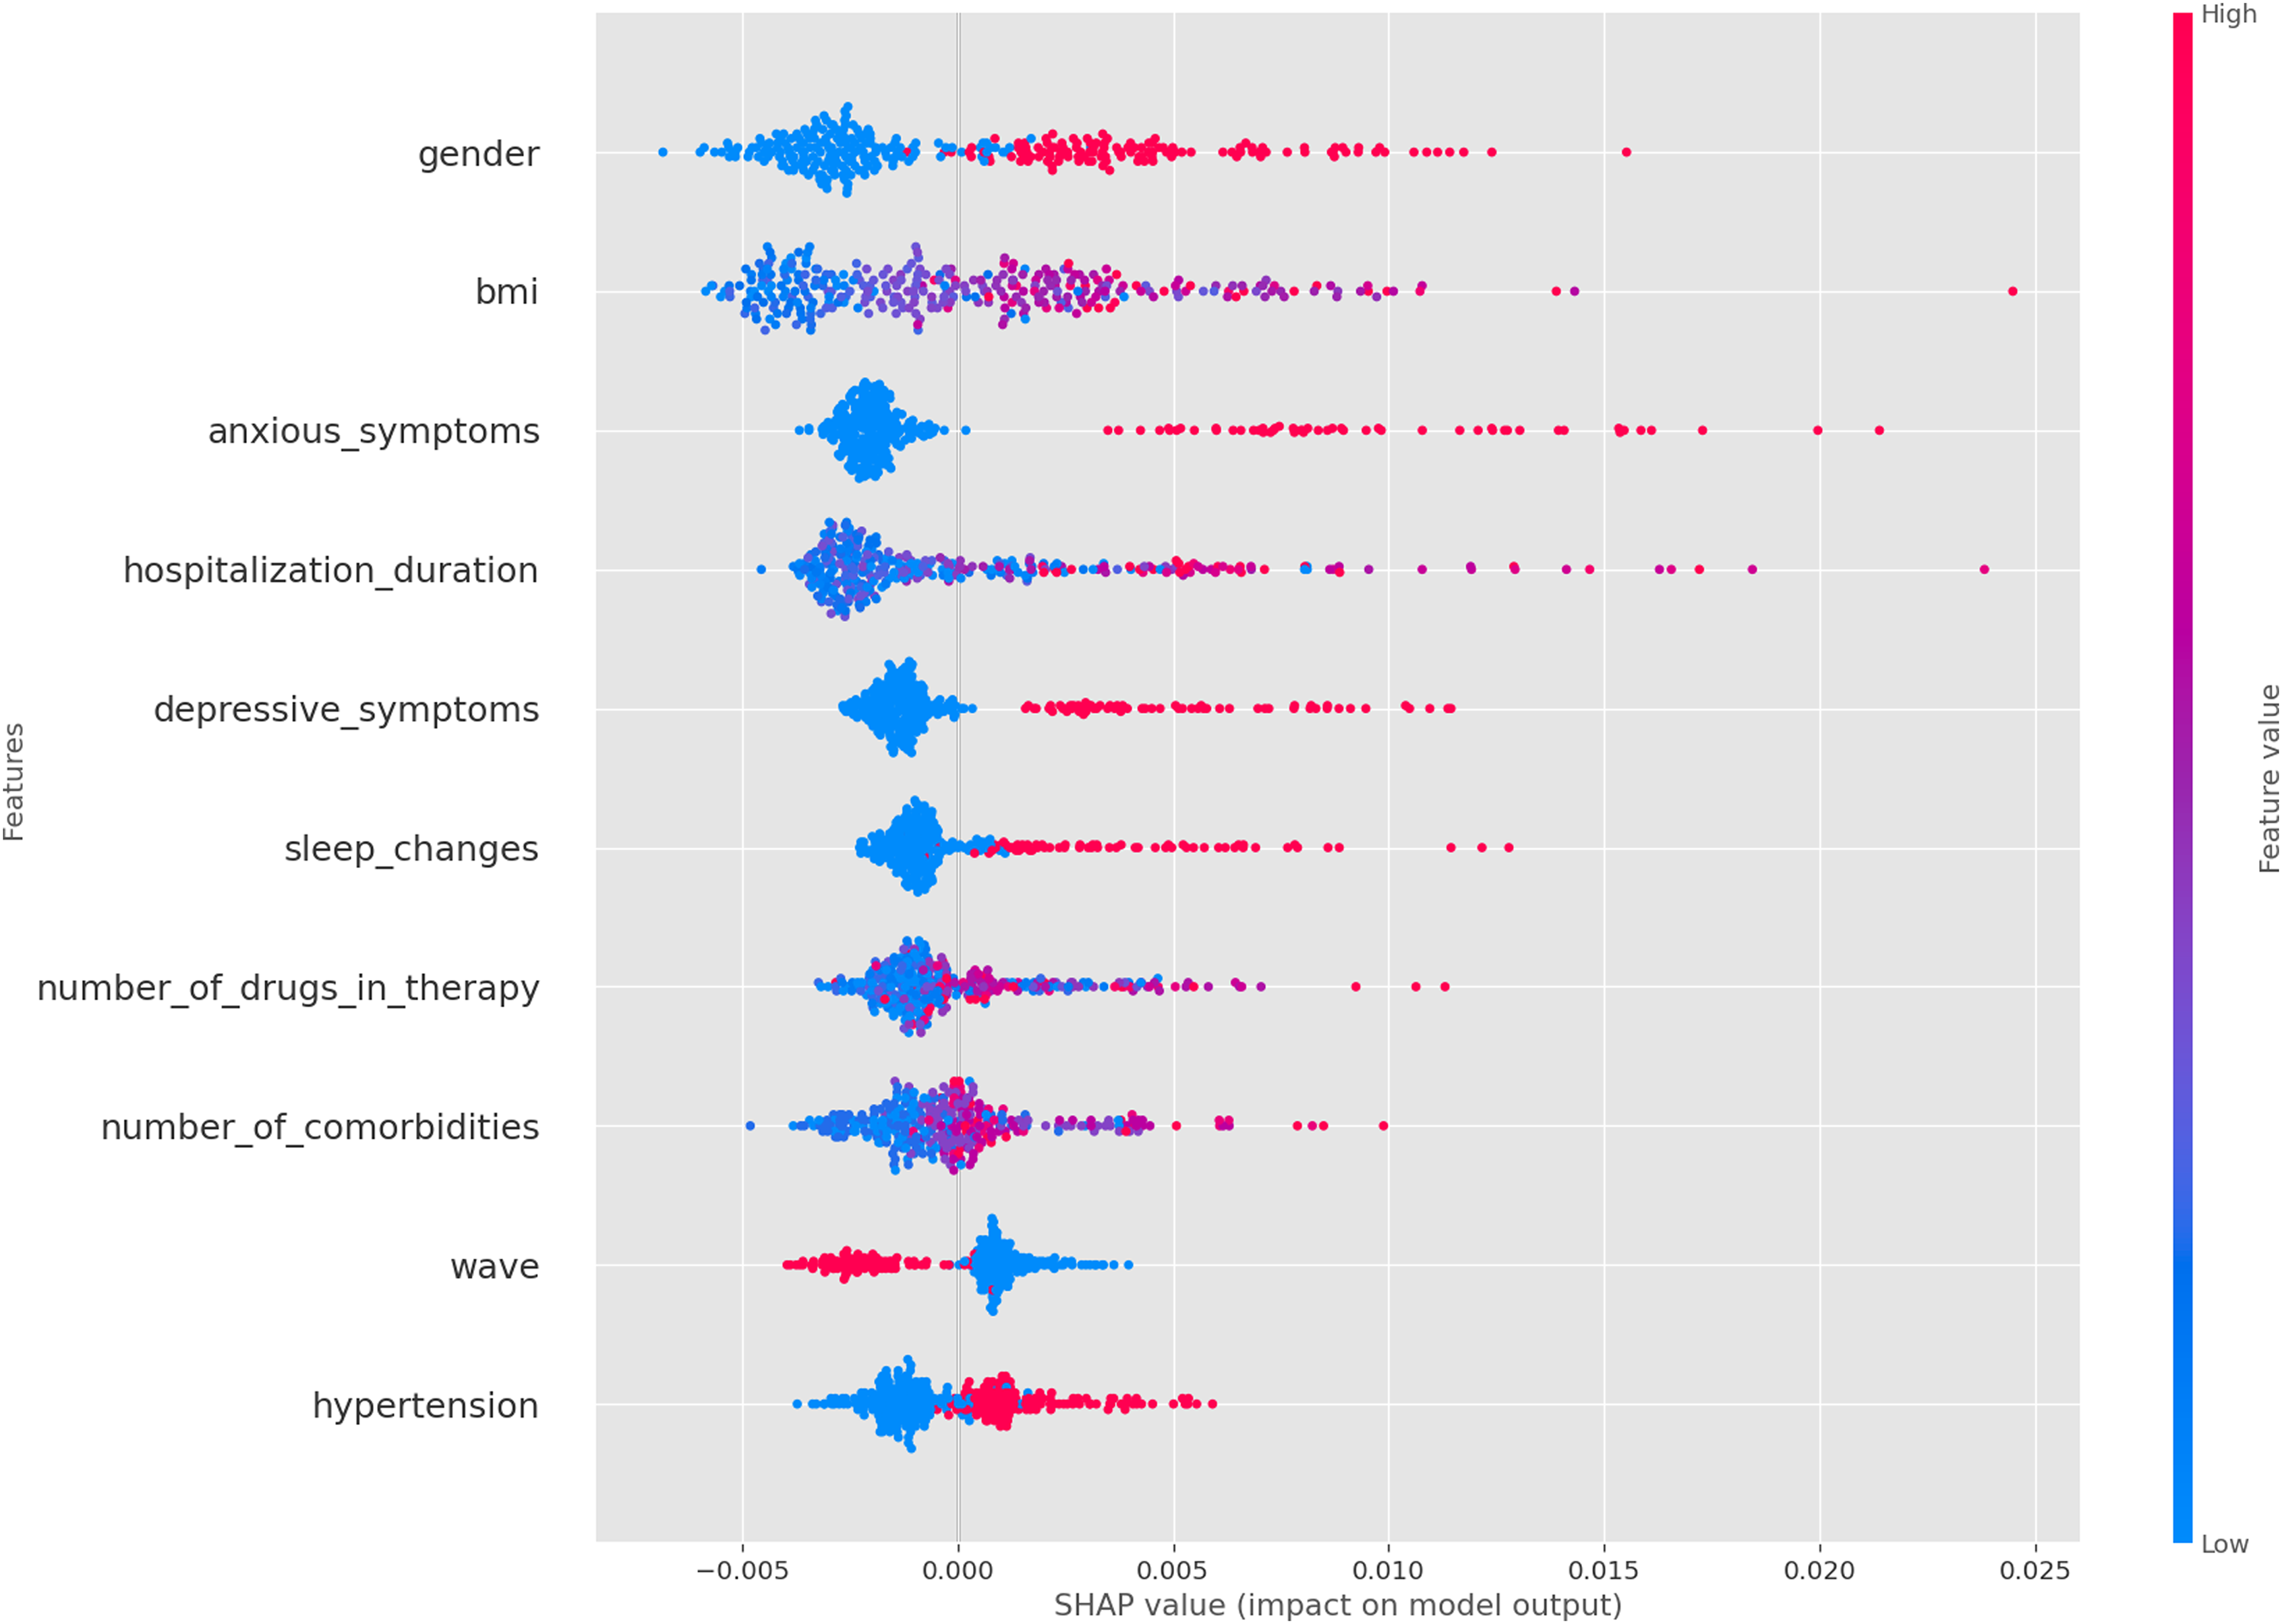
SHAP values for arthalgia at follow-up.
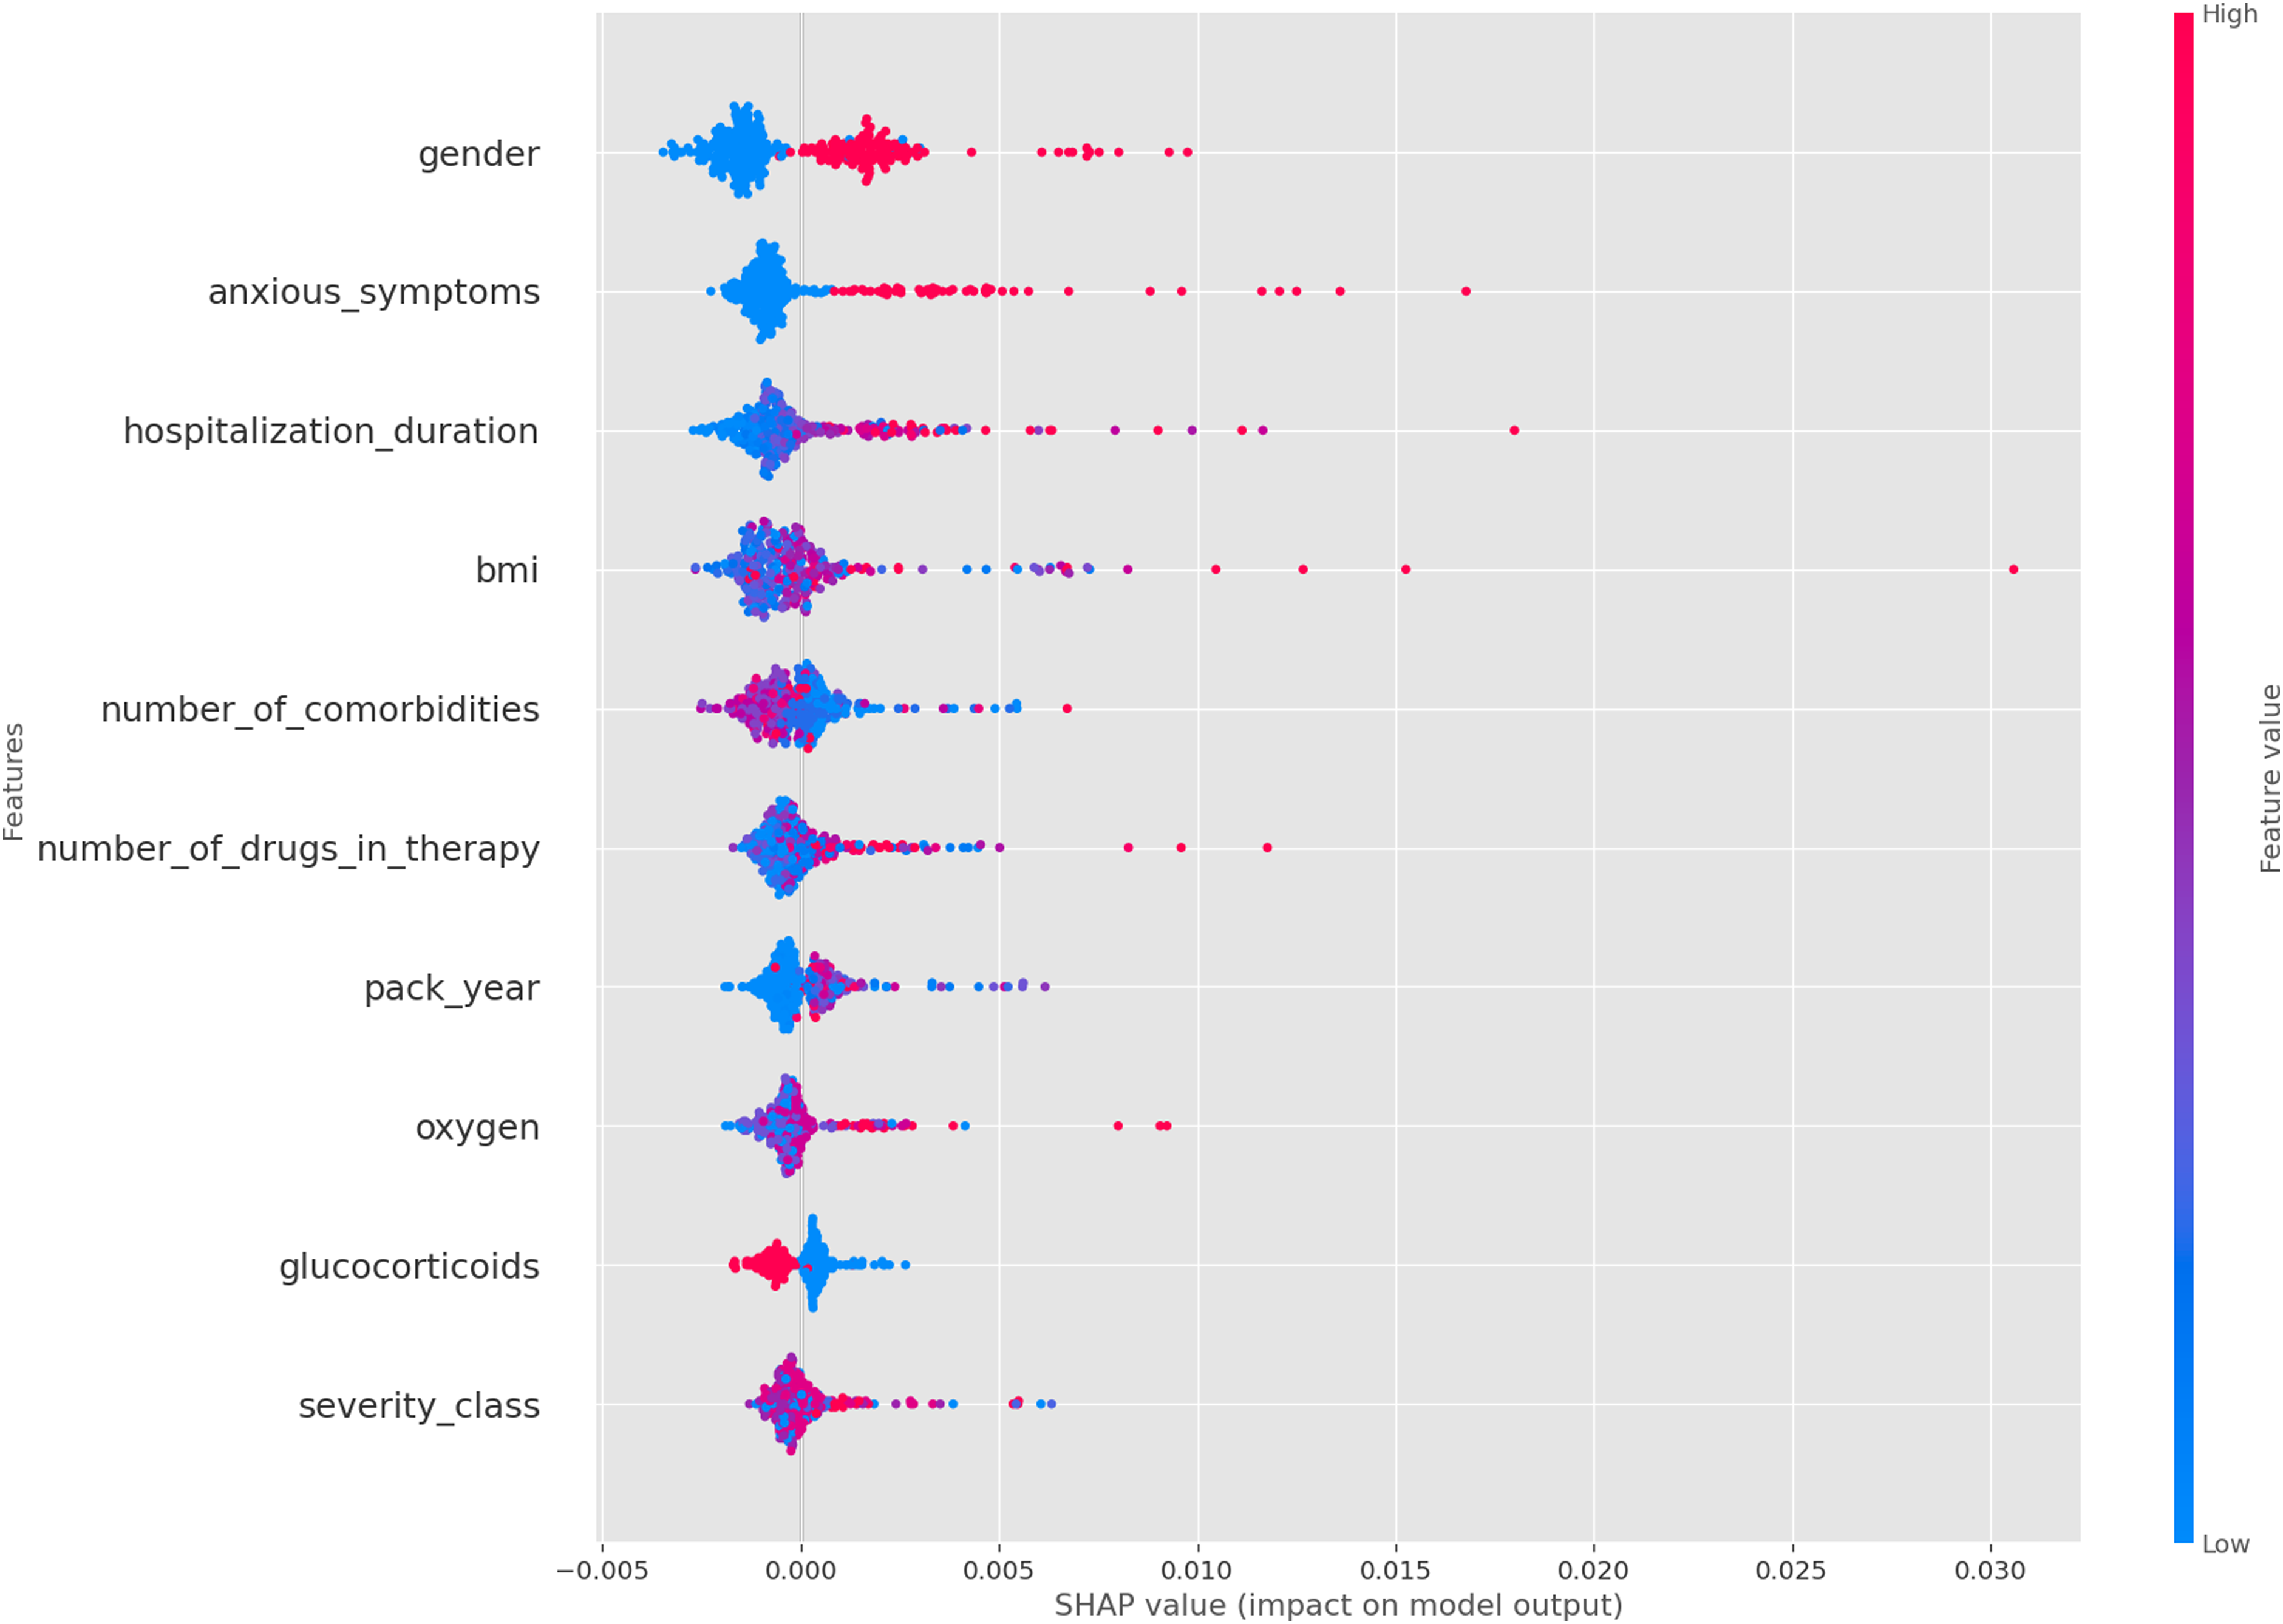
SHAP values for diarrhea at follow-up.
In the following we report the most significant analyses we have performed; additional analyses have been conducted but not reported due to space constraints. From the SHAP analysis and the physicians’ evaluations, we identified several findings. The most significant features influencing the model are sex, BMI, and hospitalization duration (see Figure 3), consistent with those reported in some previous studies on long-COVID (Mateu et al., 2023; Silva et al., 2024; Vimercati et al., 2021). In addition, we can notice that these features, along with anxious symptoms, depression, and lack of sleep, are particularly important predictors of arthromyalgia as previously reported in Phu et al. (2023) (see Figure 4). These features appear to be common predictors across all follow-up symptoms, with the exception of glucocorticoids administration at the onset of COVID-19, which is associated with the absence of diarrhea at follow-up (see Figure 5). Another important observation is that the number of comorbidities and the severity of the initial case seem to be linked to long COVID symptoms (Mateu et al., 2023). Finally, we also observe that the anosmia at time of hospitalization is a strong predictor of anosmia at follow-up, a pattern which is not observed for other symptoms.
Comparison with Upsampled Datasets
The second part of the interprertability analysis focuses on evaluating the impact of upsampling methods on the model’s predictions interpretability. Given the scarcity of data, these augmentations are necessary to enhance the robustness of the model. Our goal is to validate the hypothesis that the augmentations maintain consistency in terms of interpretability. To achieve this, we compared the SHAP values of features from the original dataset with those from various upsampled datasets. Specifically, we normalized the SHAP values of each dataset independently between
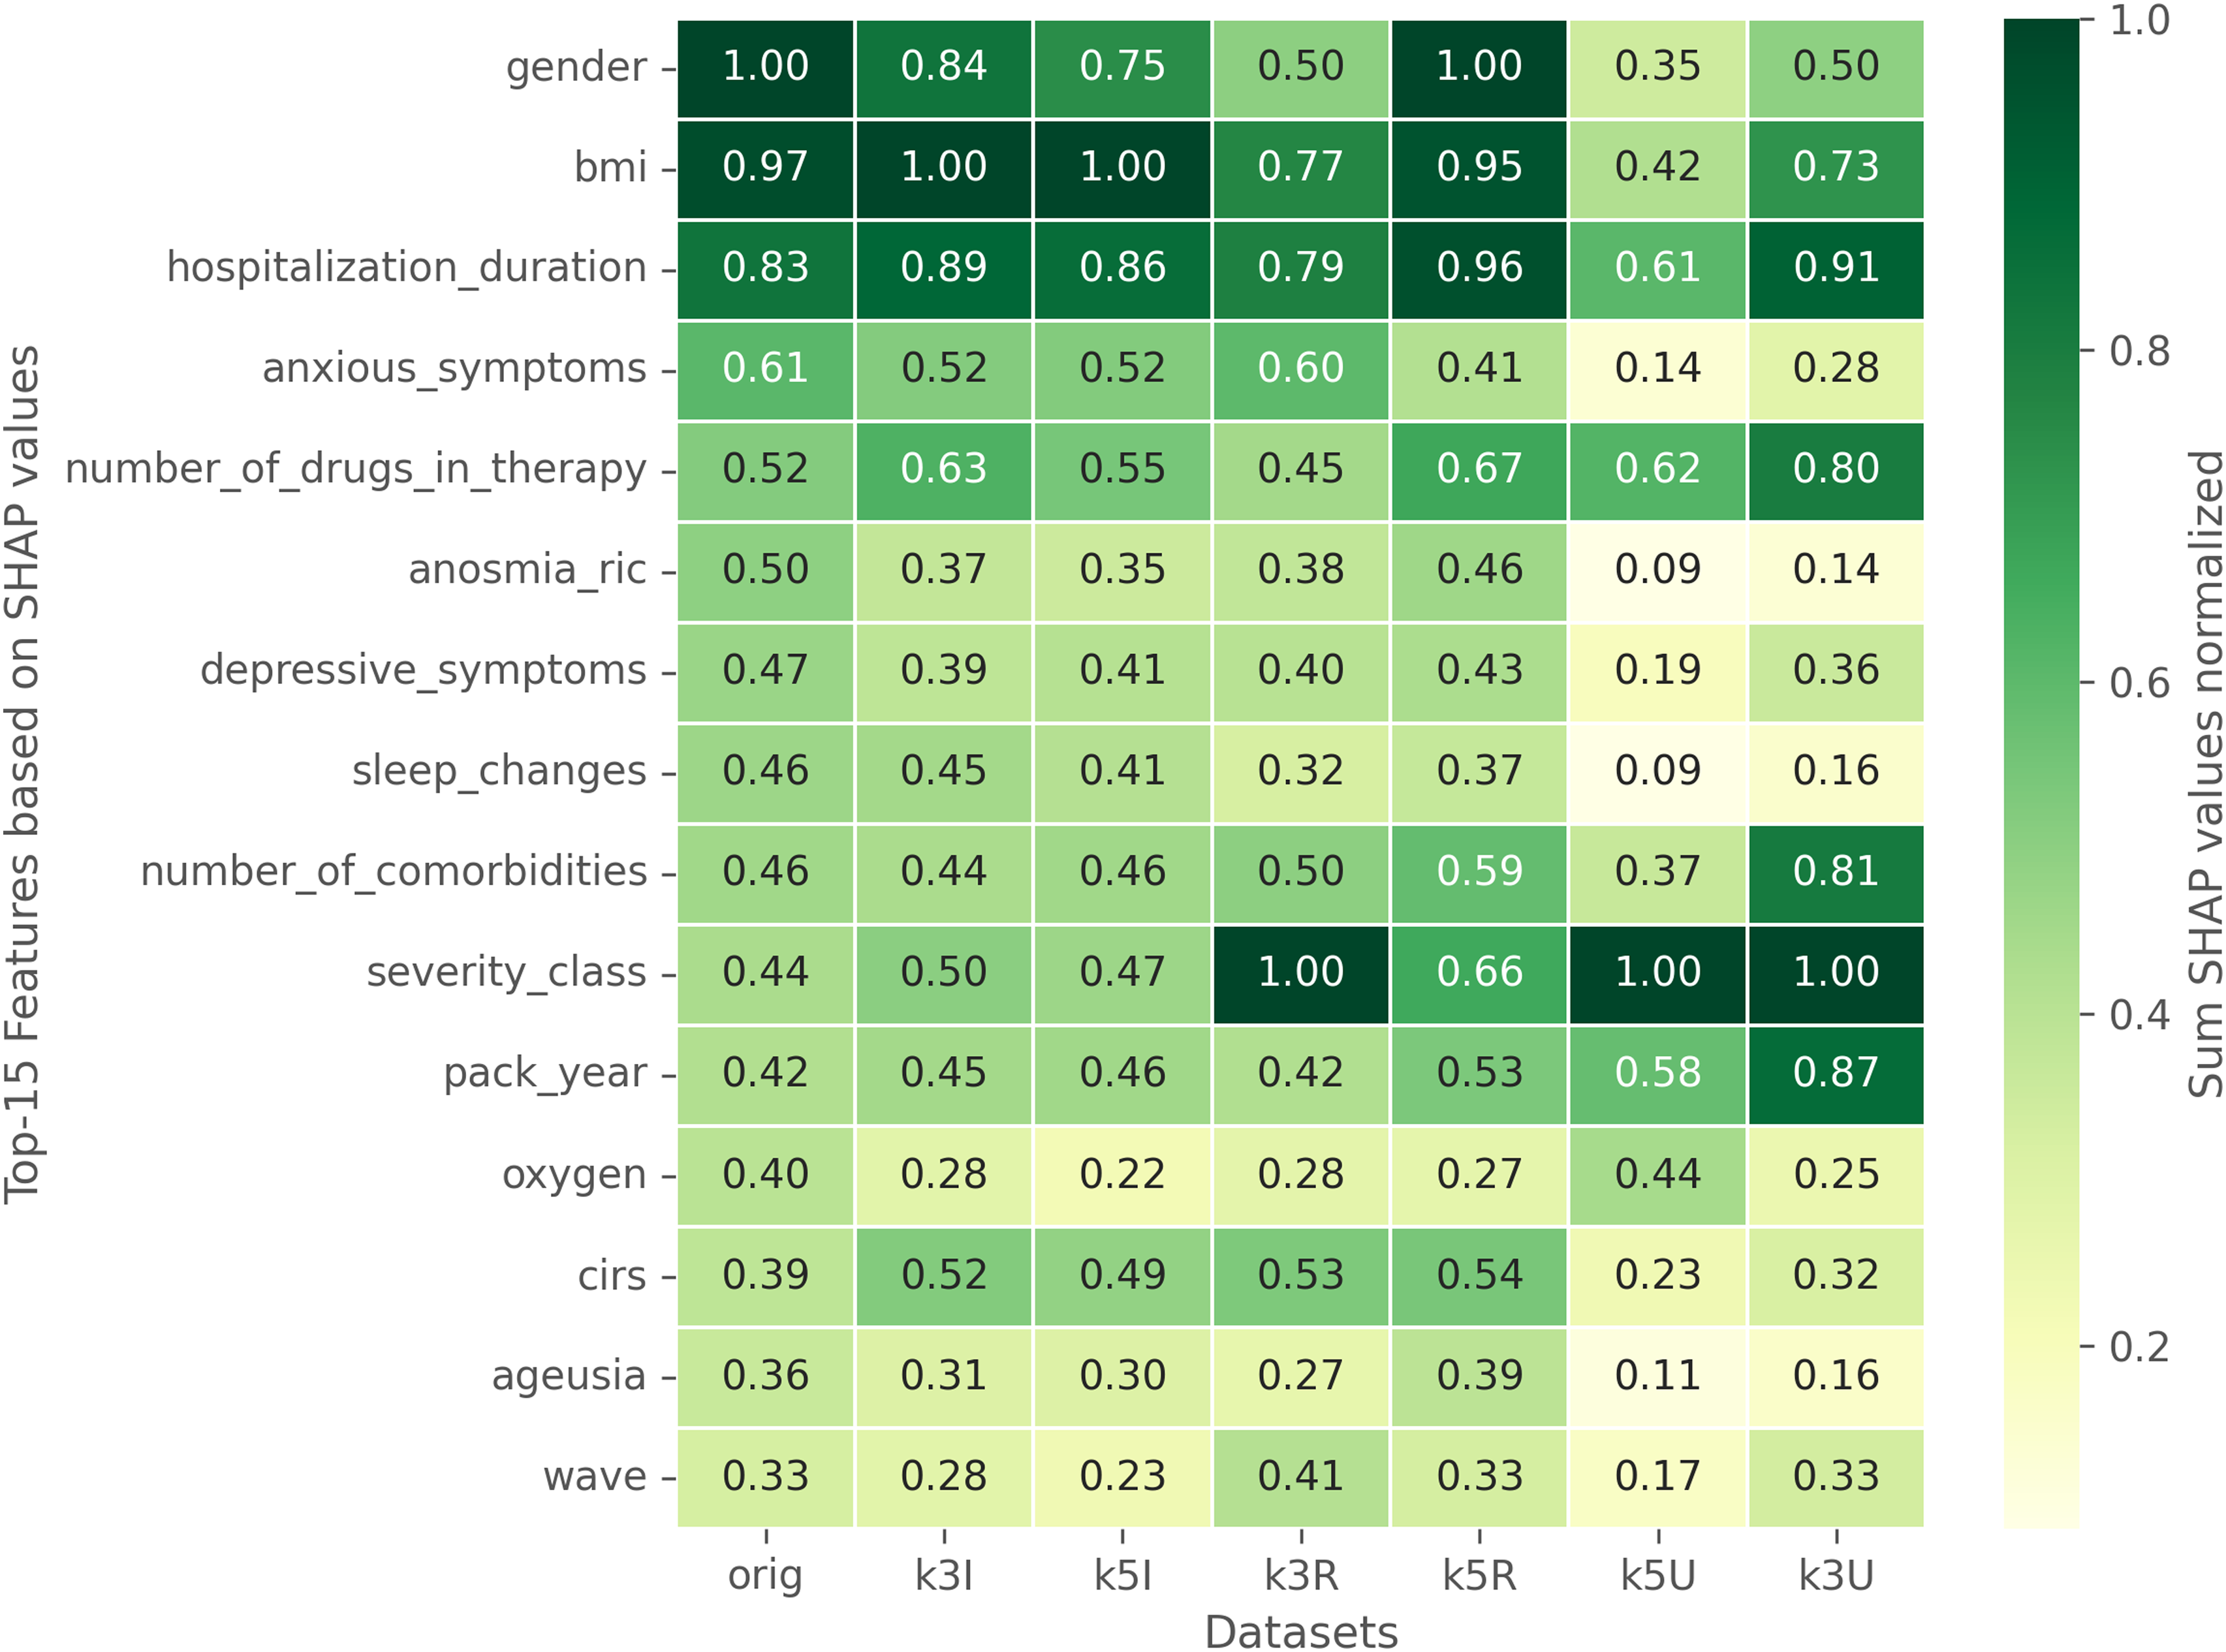
Comparison of SHAP values between the original dataset and different augmentations. The SHAP values of each dataset have been normalized independently.
Conclusions
We have presented a study about the prediction of long-COVID sequelae through multi-label classification (MLC). We have initially considered data about more than
A representative set of MLC approaches have been finally tested on all the available datasets. Results have been evaluated in terms of Accuracy, Exact match, Hamming Score and macro-averaged AUC. They showed that MLC methods can actually be useful for the prediction of specific (label-based) long-COVID sequelae, under the different conditions represented by the different considered datasets. Multi-class MLC methods appear to be very promising, and binary approaches based on chains could be a valid alternative in order to take into account label correlation.
Results have been also considered in terms of interpretability, by adopting the SHAP method in the context of multi-label classification. The analysis shows that useful clinical information can be obtained by considering the influence of specific features on the predicted labels. Moreover, the use of data augumentation (that is justified in the presented context) seems to leave unchanged the qualitative results obtained on the original dataset. Currently, we are integrating our approach with the TECNOMED-HUB databank.
As future works, on the side of the long-COVID syndrome study, we aim at integrating additional clinical information such as the level of several cytokines, which are indicators of specific inflammatory processes supposed to be involved in the long-COVID syndrome. Moreover, on the side of the applicability of our approach to a general databank, we aim to test it with different diseases and to complement it with explanation techniques for MLC (see, e.g., Panigutti et al., 2020; Tabia, 2019), to make our approach usable in practice by physicians.
Footnotes
ORCID iDs
Funding
The author(s) received no financial support for the research, authorship and/or publication of this article.
Declaration of Conflicting Interests
The author(s) declared no potential conflicts of interest with respect to the research, authorship, and/or publication of this article.
Data Availability
Due to privacy concerns, the dataset on which the experiments were carried out is not publicy available; enquiries regarding the data can be sent to the authors.