
Abstract
Background/aims
Factorial analyses of 2 × 2 trial designs are known to be problematic unless one can be sure that there is no interaction between the treatments (A and B). Instead, we consider non-factorial analyses of a factorial trial design that addresses clinically relevant questions of interest without any assumptions on the interaction. Primary questions of interest are as follows: (1) is A better than the control treatment C, (2) is B better than C, (3) is the combination of A and B (AB) better than C, and (4) is AB better than A, B, and C.
Methods
A simple three-step procedure that tests the first three primary questions of interest using a Bonferroni adjustment at the first step is proposed. A Hochberg procedure on the four primary questions is also considered. The two procedures are evaluated and compared in limited simulations. Published results from three completed trials with factorial designs are re-evaluated using the two procedures.
Results
Both suggested procedures (that answer multiple questions) require a 50%–60% increase in per arm sample size over a two-arm design asking a single question. The simulations suggest a slight advantage to the three-step procedure in terms of power (for the primary and secondary questions). The proposed procedures would have formally addressed the questions arising in the highlighted published trials arguably more simply than the pre-specified factorial analyses used.
Conclusion
Factorial trial designs are an efficient way to evaluate two treatments, alone and in combination. In situations where a statistical interaction between the treatment effects cannot be assumed to be 0, simple non-factorial analyses are possible that directly assess the questions of interest without the zero interaction assumption.
Keywords
Introduction
In a two-by-two factorial trial design, patients are randomly assigned one of four treatments: a control treatment (C), treatment A, treatment B, or a combination treatment of A and B (AB). A factorial analysis of a factorial design estimates the effect of each individual treatment by pooling the results over the other treatment (with a stratified analysis). This allows the ability to answer two questions (Does A work? Does B work?) with a sample size that is one-half to what would be required for doing two separate trials (A vs C and B vs C). Unfortunately, as is well known,1,2 if there is any statistical interaction between the treatments on the outcome, the analysis can be misleading. For example, if there is a negative interaction so that A works better than C by a much larger amount than AB works as compared to B, then the factorial analyses may suggest A does not work sufficiently well to be recommended. 3 There is the possibility of using an estimate of the interaction to decide whether to abandon the factorial analysis with a completed trial,4,5 and this strategy is not uncommonly used in practice (formally or informally). However, the statistical properties of this type of approach are poor—the statistical power to detect interactions of a size that would complicate the interpretation of a factorial analysis is not good.2,6,7 Finally, it should be noted that the notion of statistical interaction depends on the (somewhat arbitrary) scale on which the outcome is measured.2,4 Therefore, unless one is hypothesizing that one or both the treatments are likely to be totally ineffective (as might be reasonable to assume in a treatment screening trial of disease prevention that is screening multiple treatments 3 ), it can be difficult to argue before seeing any data that one knows scientifically that an interaction should be close to 0.
In this article, we consider situations where one is unable to assume a lack of interaction between the treatments and so a factorial analysis is not being considered. Instead of only asking whether A or B works, we are also interested in how well AB works in comparison to A, B, and C. One possibility is to perform a pairwise analysis of all six pairs of treatment comparisons. However, as noted by Chen and Simon, 8 there is natural preference in treatment choices: with approximately equal efficacy outcomes between A (or B) and C, one would choose to treat with C; and with equal efficacy between AB and A (or B), one would choose to treat with A (or B). Chen and Simon 8 develop procedures for selecting the best treatment that uses these preferences. We use the natural preference in treatment choices, but rather than focusing on identifying the best treatment, our approach is structured to assess the individual contributions of the two treatments, by themselves and in combination. As described in the next section, we divide the questions into primary and secondary based on where we want to focus the ability to reject null hypotheses.
In the next section, we describe two analysis strategies, along with type 1 and type 2 errors which we desire to control. This is followed by some limited simulations that investigate the power of the proposed strategies. The sample sizes required for the different approaches are considered next, followed by a re-analysis of three published trials that used factorial trial designs. We end with a discussion including some alternative approaches to the problem.
Proposed analysis strategies
Letting
Step 1 (testing A, B, and AB vs C): Test Ho1:
Step 2 (testing AB vs max(C, A, B)): Test Ho4:
Step 3a (testing A vs B): If H01 is rejected, then test Ho5:
Step 3b (testing A vs B): If H01 is rejected, then test Ho5:
Null and alternative hypotheses for addressing primary and secondary questions of interest.
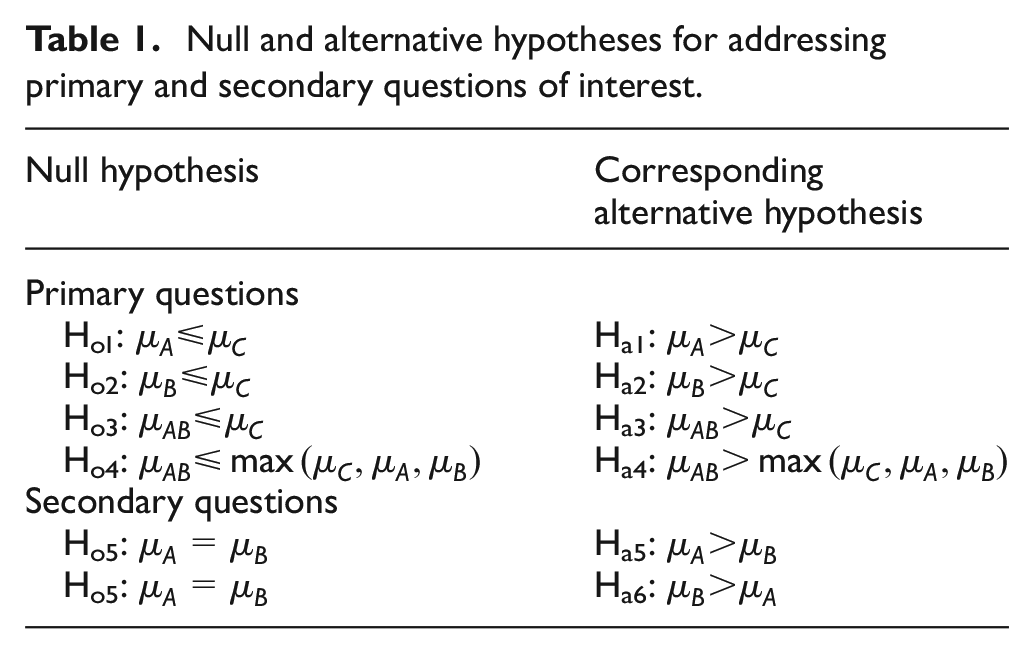
A factorial analysis would not formally address a comparison of A versus B (Ho5), and one could consider not including this comparison in our non-factorial analyses here. However, we include this comparison because it does not affect the other comparisons with this analysis strategy.
Another strategy is to use the Hochberg
10
step-up procedure on the four primary hypotheses: let
We are interested in controlling the familywise type 1 error at the
The power of a testing strategy can be represented in terms of the minimally clinically interesting difference
P1: P(A > C|µA ⩾ µC + Δ and µAB < max(µC,µA, µB) + Δ) ⩾ 1 − β
P(B > C|µö ⩾ µC + Δ and µAB < max(µC,µA,µB) + Δ) ⩾ 1 − β1
P2: P(AB > C|[µB < µC + Δ and µA < µC + Δ] and µAB ⩾ µC + Δ) ⩾ 1 − β2
P3: P(AB > max(C, A, B)|[µB ⩾ µC + Δ or µA ⩾ µC + Δ] and µAB ⩾ max(µC,µA,µB) + Δ) ⩾ 1 − β3
P4: P(A > B|µA ⩾ µB + Δ and µA ⩾ µC + Δ and µAB⩽ µA + Δ) ⩾ 1 − β4
P(B > A|µB ⩾ µA + Δ and µB ⩾ µC + Δ and µAB⩽ µB + Δ) ⩾ 1 − β4
The different type 2 errors listed (β’s) reflect that we could desire more power for different hypotheses. For example, as noted above, β4 could be very large as testing A = B is of low priority in this setting.
We show in Appendix 1 that the three-step procedure has type 1 error less than
Adjusted p values for the individual hypothesis tests can be calculated by finding the smallest
Simulations
Table 2 displays the results of simulations of the rejection probabilities (type 1 errors and powers) of the two proposed procedures with α = 0.025 under various scenarios. The numbers in bold correspond to the powers of special interest noted above (P1 − P4). The simulation was conducted using normally distributed data with known standard deviation, with the alternative
Simulated rejection probabilities for the proposed three-step analysis and Hochberg procedure with normally distributed data (standard deviations known) with α = 0.025 (107 simulations).
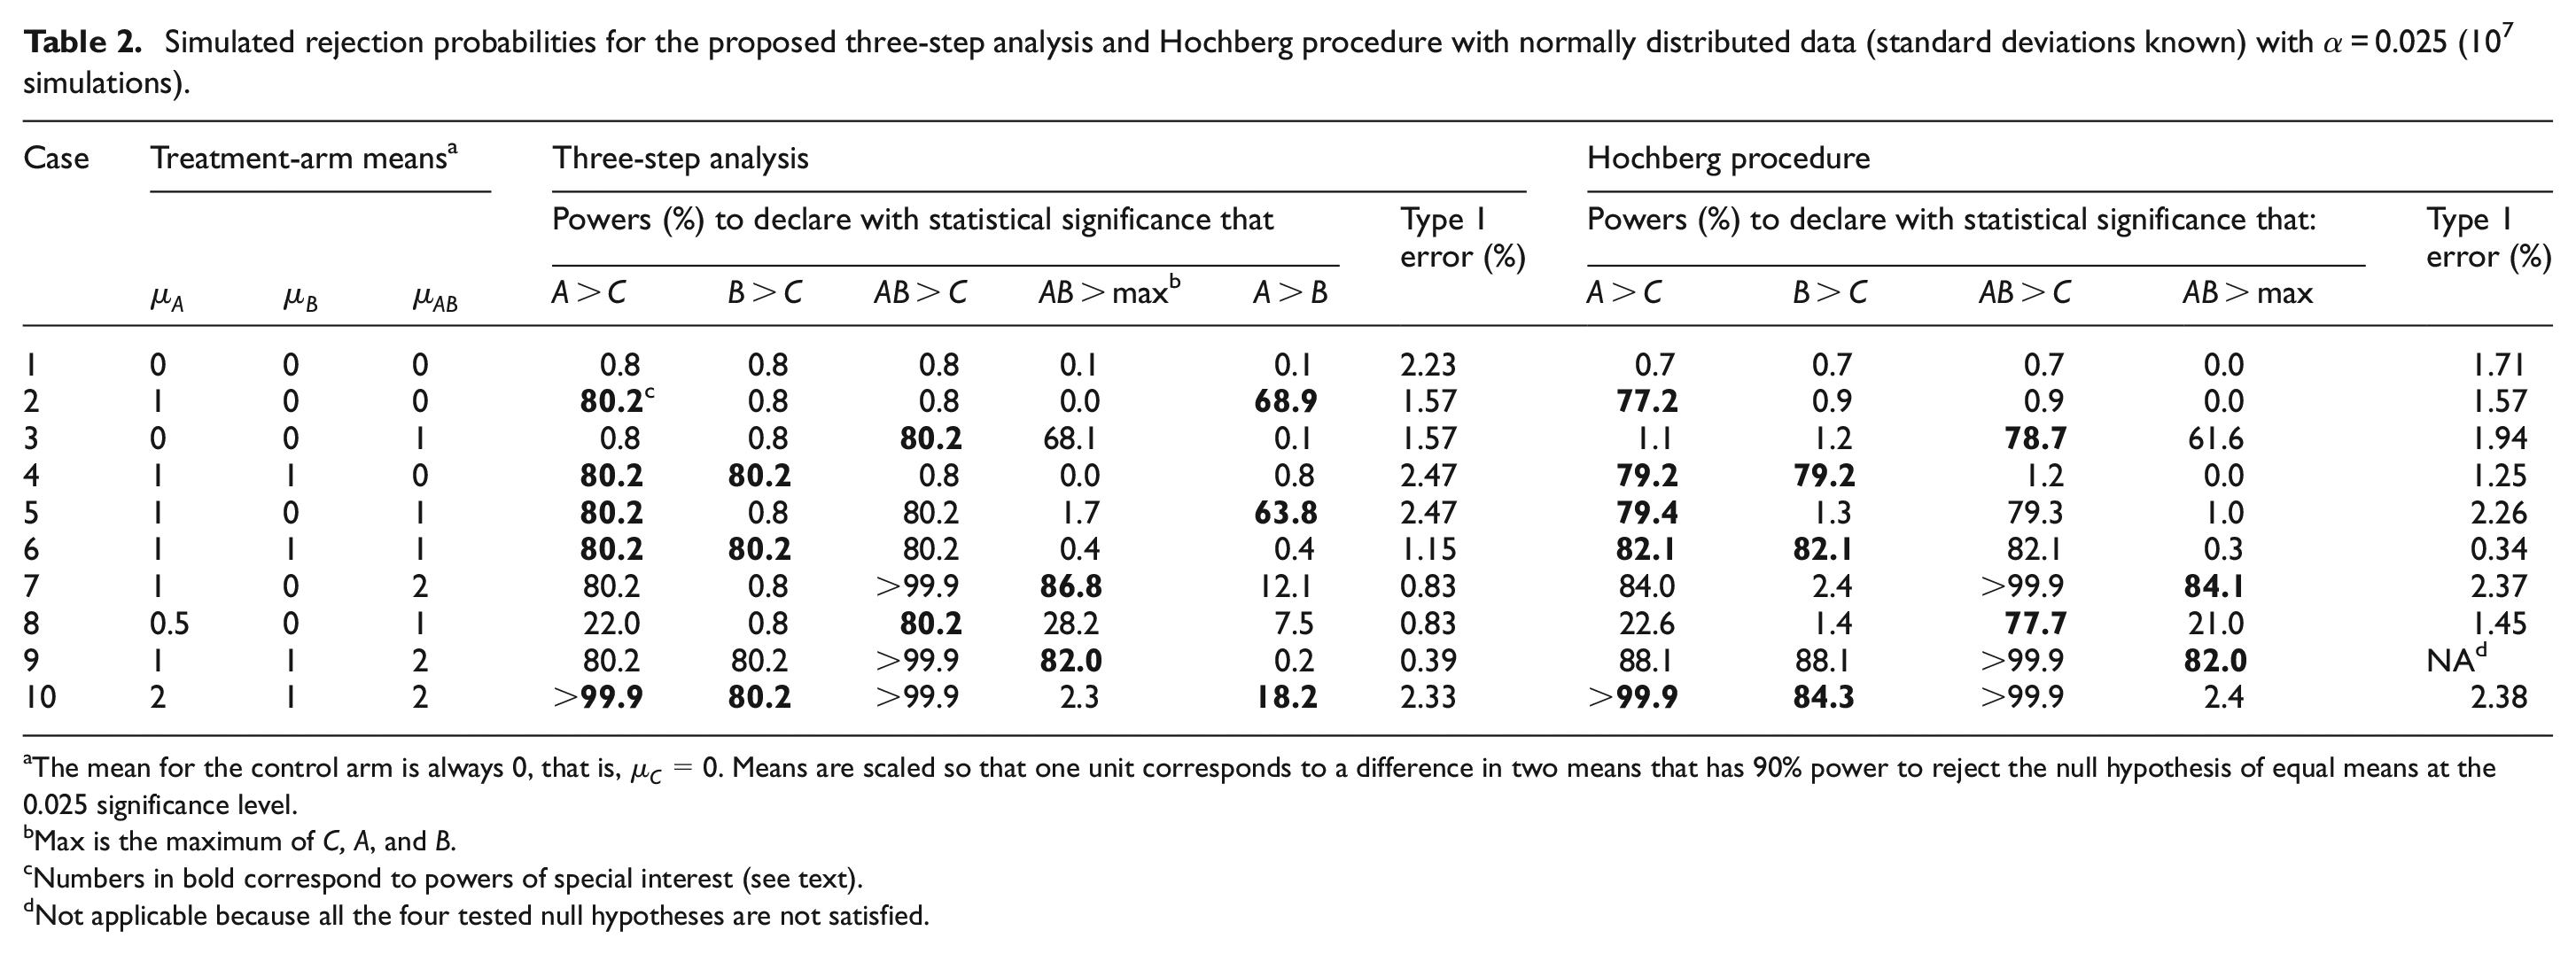
The mean for the control arm is always 0, that is,
Max is the maximum of C, A, and B.
Numbers in bold correspond to powers of special interest (see text).
Not applicable because all the four tested null hypotheses are not satisfied.
For the Hochberg procedure, the powers of interest are generally lower than with the three-step procedure (cases 1–3, 7, and 8) except when all the treatments are effective where the Hochberg procedure has higher power (cases 6 and 10). Note that as utilized for the primary questions, the Hochberg procedure does not formally address the two secondary questions. One could apply Hochberg’s procedure to all six hypothesis tests in Table 1, but this would reduce the power to address the primary questions. For example, the power to reject the null hypothesis Ho1:
Sample size considerations
If one knew that there was no interaction and used a factorial analysis (without control for the two multiple comparisons), then one would be able to answer two questions for the price of one. However, because of the possibilities of interactions, advocacy of this position is considered “tantamount to selling snake oil” by some. 15 We are not interested here in trying to increase the efficiency of asking a question about treatments A or B given alone, but about how well A, B, and AB work in comparison with C and each other. Therefore, we consider the increase in sample size per arm required for a non-factorial analysis of a factorial trial design as compared to a two-group comparison with one-sided α = 0.025, which we take as the reference sample size per arm. The proposed three-step strategy uses a nominal type 1 error of 0.0083 (α/3), which would result in an increase in sample size per arm of 49% if one was focusing on the first three primary hypotheses; a larger sample size would be required for ensuring power to test AB being better than max(A, B, C). For example, if 100 patients per arm were required to have 90% power to detect a specified treatment effect in a two-armed trial of A versus C (with one-sided α = 0.025), then approximately 150 patients per arm would be required in the proposed analysis of factorial design with C, A, B, and AB to be able detect with 90% power the same treatment effect comparing A versus C, B versus C, and AB versus C. The power to detect AB being better than the max(C, A, B) will be less than 90% and depend on the configuration of the true means.
Using the Hochberg procedure with four null hypotheses, one would size the trial using a nominal type 1 error of 0.0063 (α/4) to protect against the situation when only one null hypothesis was false; this would result in an increase in sample size per arm of 62%. (Using a Bayesian analysis, Simon and Freedman 16 suggest increasing the sample size by 30% per arm to account for a possible nonzero interaction. Using a factorial analysis, a formal test of the interaction parameter (of the same size as the main effects we have been considering) would require a sample size per arm 200% larger than in a single two-arm trial, leading to an overall trial size that is 400% larger than a two-armed trial. 17 )
Examples
We present three examples of completed trials that used a factorial trial design. These examples are not meant to suggest that the trial investigators used inappropriate analyses, but solely to demonstrate how our proposed strategy would work on some real trial data.
Example 1: E1199 for the adjuvant treatment of breast cancer conducted by the Eastern Cooperative Oncology Group
E1199 used a factorial trial design that compared the disease-free survival of docetaxel versus paclitaxel and a weekly schedule versus a every 3 weeks schedule; the control arm was the paclitaxel given every 3 weeks (treatment C). 18 In addition to C, the treatment arms were weekly paclitaxel (treatment A), docetaxel every 3 weeks (treatment B), and weekly docetaxel (treatment AB). The design specified a factorial analysis, using a 0.05 two-sided significance level for each of the two primary factorial comparisons. If either of the primary comparisons was statistically significant, the design also specified a comparison of each of the three experimental arms with the control arm using a 0.017 two-sided significance level. The 5-year disease-free survival rates for the four treatment groups were 76.9% (C), 81.5% (A), 81.2% (B), and 77.6% (AB). Neither of the primary factorial comparisons were statistically significant. Despite this, the investigators (correctly, in our view) proceeded to compare the individual arms and concluded that weekly paclitaxel improves disease-free survival in this setting.
The results of the three-step approach and Hochberg’s procedure applied to this trial data are given in Table 3. Using the three-step approach (with α = 0.025), one can conclude that weekly paclitaxel (A) is superior to paclitaxel every 3 weeks (C), and go to Step 3 where we cannot reject A = B in favor of A being better than B. Using the Hochberg procedure, one can also conclude that weekly paclitaxel is superior to paclitaxel every 3 weeks. A follow-up of this trial confirmed this result. 19 The proposed procedures allow one to formally address a primary clinical question concerning weekly paclitaxel whereas the factorial analysis can only address this question in an informal ad hoc manner.
Disease-free survival versus with the control arm C (paclitaxel every 3 weeks) in the E1199 trial.
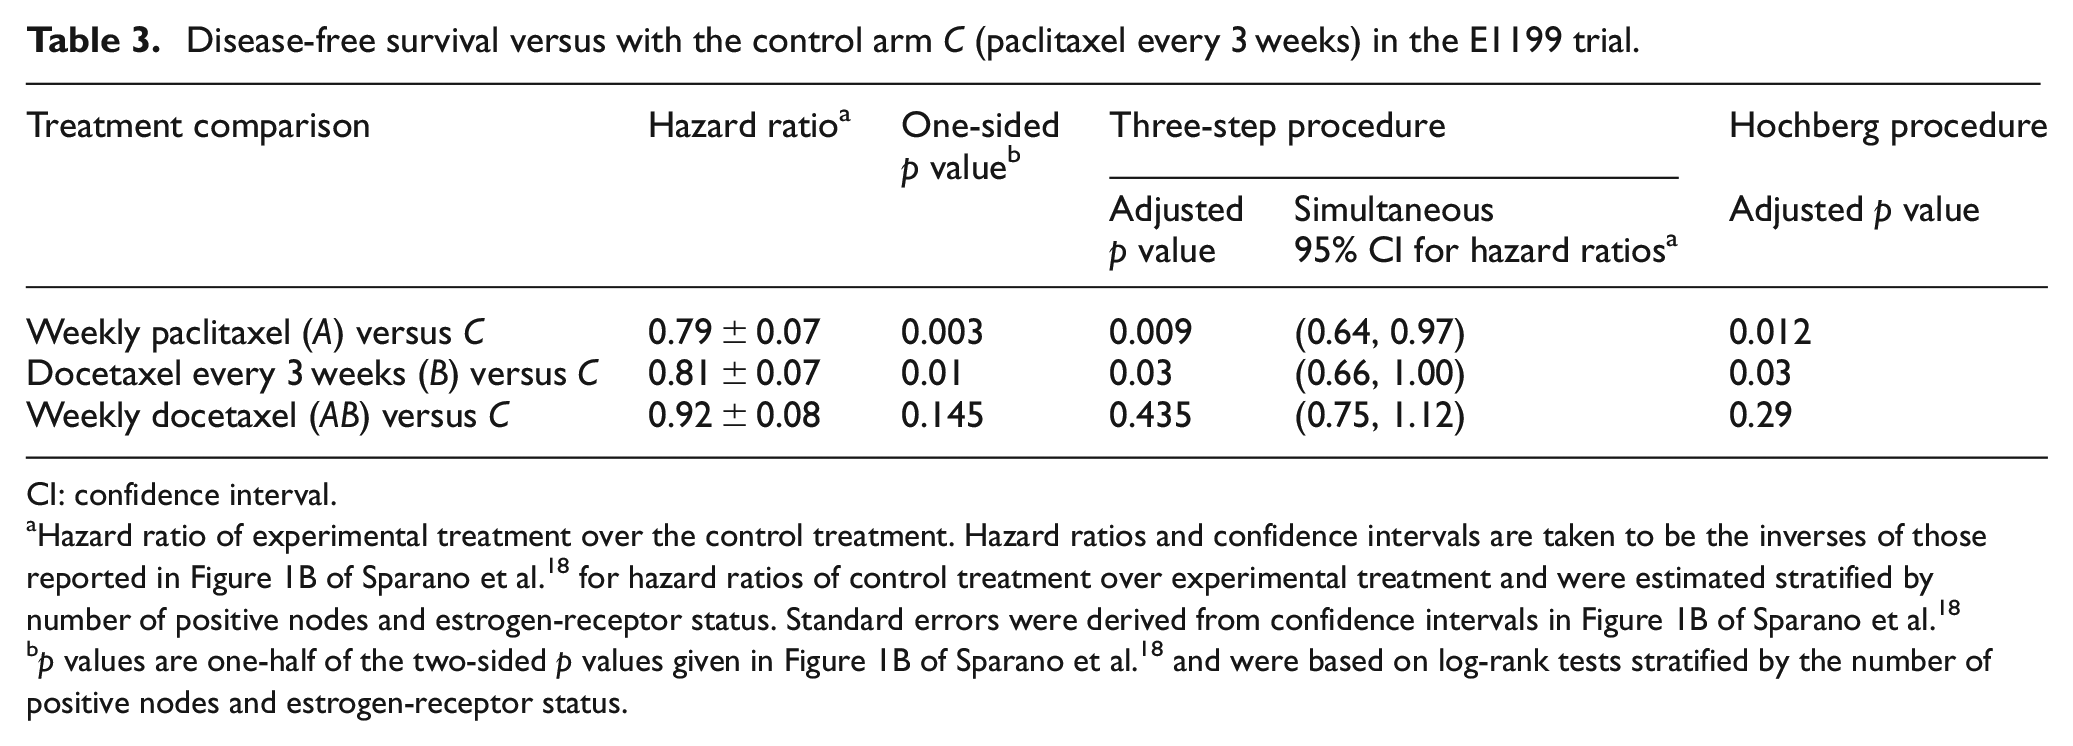
CI: confidence interval.
Hazard ratio of experimental treatment over the control treatment. Hazard ratios and confidence intervals are taken to be the inverses of those reported in Figure 1B of Sparano et al. 18 for hazard ratios of control treatment over experimental treatment and were estimated stratified by number of positive nodes and estrogen-receptor status. Standard errors were derived from confidence intervals in Figure 1B of Sparano et al. 18
p values are one-half of the two-sided p values given in Figure 1B of Sparano et al. 18 and were based on log-rank tests stratified by the number of positive nodes and estrogen-receptor status.
Example 2: Trial to Assess Chelation Therapy
In this trial, a factorial design was used to test chelation therapy and a multivitamin supplement compared to placebos (treatment C) on the primary endpoint (a composite of death, myocardial infarction, stroke, coronary revascularization, or hospitalization for angina) for post-myocardial infarction patients; a factorial analysis was specified. 20 In addition to C, the treatment arms were chelation therapy (treatment A), a multivitamin supplement (treatment B), and the combination therapy (treatment AB). The 5-year event rates (±standard error (SE)) for the four treatment groups were 31.8% ± 2.2% (C), 27.3% ± 2.2% (A), 28.2% ± 2.2% (B), and 25.7% ± 2.1% (AB); 21 using the factorial analysis, the chelation therapy was found to be useful with (two-sided) p = 0.035, 22 but the multivitamins were not; 23 no adjustments for interim monitoring are made for the results presented here.
The results of the three-step approach and Hochberg’s procedure applied to this trial data are given in Table 4. With α = 0.025, using the three-step approach one can conclude that the combination treatment (AB) is superior to placebos; in Step 2, one cannot conclude that the combination therapy is better than the single-treatment arms. Using the Hochberg procedure, no null hypothesis is rejected at the α = 0.025 level. The three-step procedure formally identifies the combination therapy as better than the placebos whereas the Hochberg procedure slightly misses statistical significance for this comparison.
Time-to-event comparisons with the control arm C (placebos) in the Trial to Assess Chelation Therapy trial.
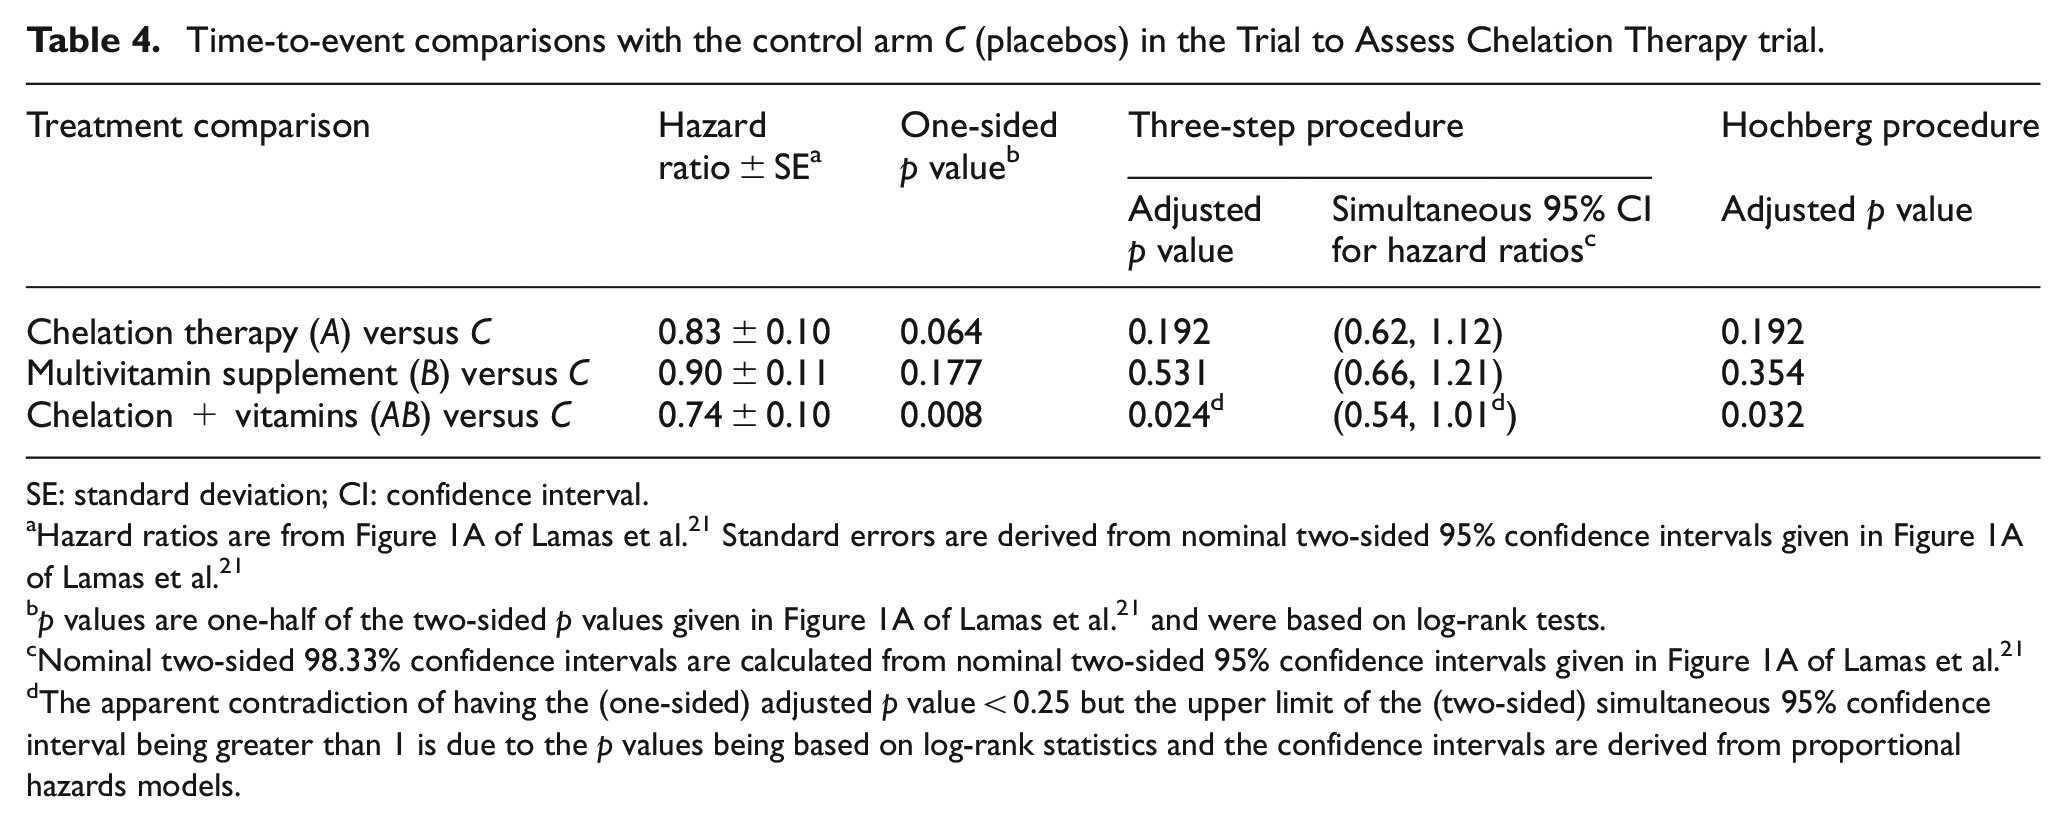
SE: standard deviation; CI: confidence interval.
Hazard ratios are from Figure 1A of Lamas et al. 21 Standard errors are derived from nominal two-sided 95% confidence intervals given in Figure 1A of Lamas et al. 21
p values are one-half of the two-sided p values given in Figure 1A of Lamas et al. 21 and were based on log-rank tests.
Nominal two-sided 98.33% confidence intervals are calculated from nominal two-sided 95% confidence intervals given in Figure 1A of Lamas et al. 21
The apparent contradiction of having the (one-sided) adjusted p value < 0.25 but the upper limit of the (two-sided) simultaneous 95% confidence interval being greater than 1 is due to the p values being based on log-rank statistics and the confidence intervals are derived from proportional hazards models.
Example 3: Two decontamination regimens for the prevention of acquired infections
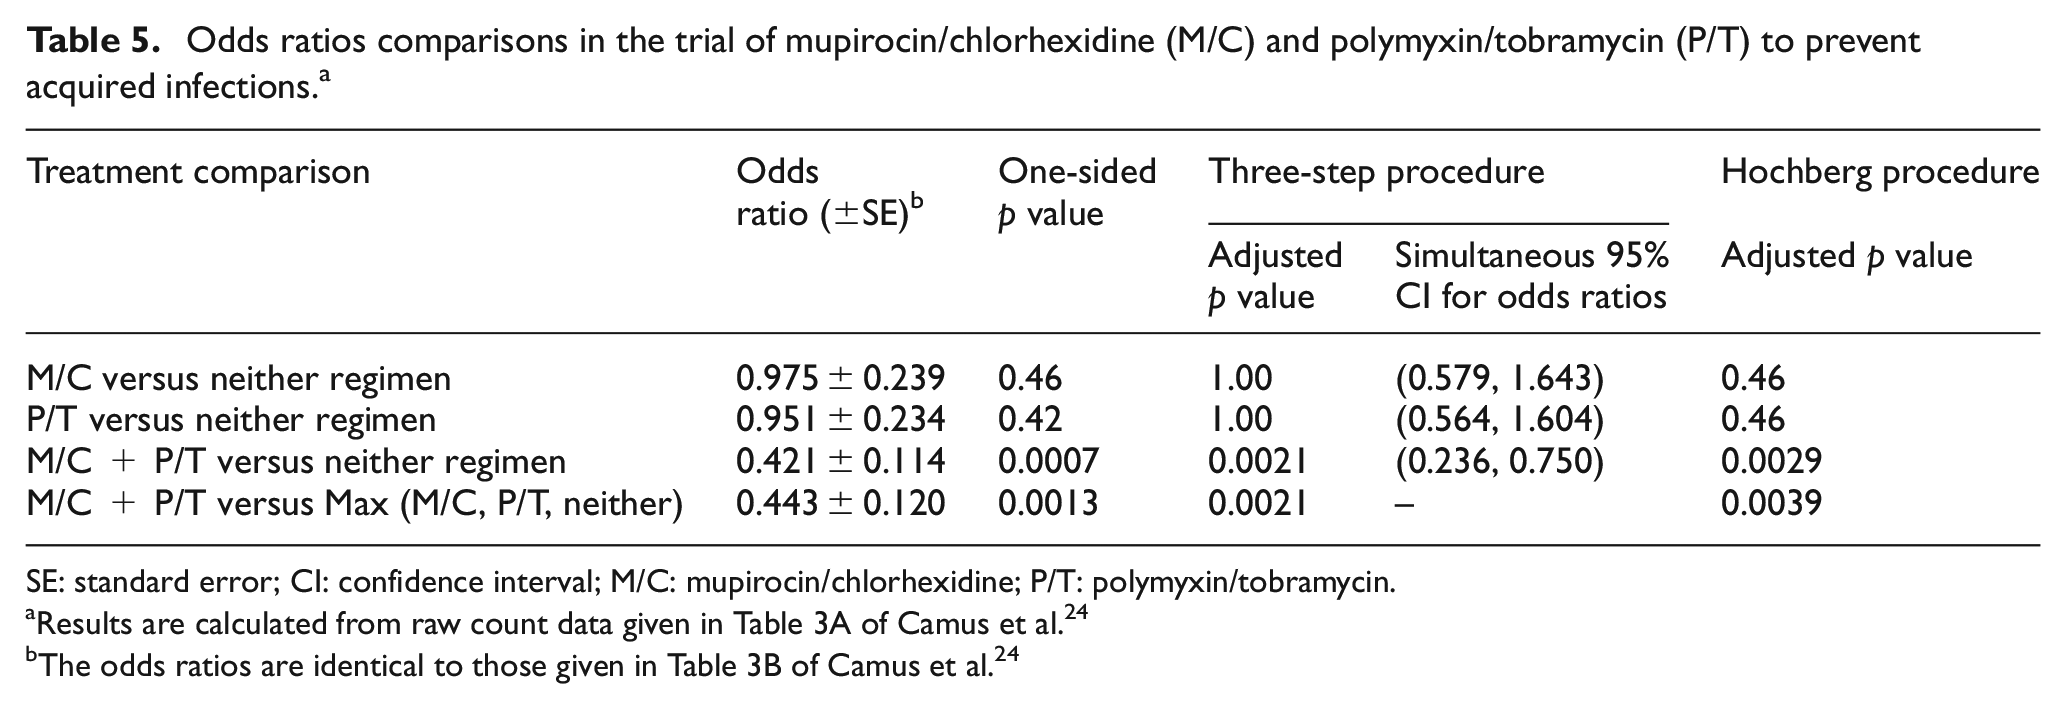
In this factorial trial design, polymyxin/tobramycin (P/T) and mupirocin/chlorhexidine (M/C) were used to see if they could prevent acquired infections in intubated patients in intensive care units. 24 In addition to the placebo treatments arm, the other arms were M/C, P/T, or the combination M/C + P/T. The primary endpoint was the number of acquired infections grouped into three categories (0, 1, or ⩾2) and was analyzed using a proportional odds cumulative logit model. The primary analysis specified depending on whether there was a statistically significant interaction in the factorial analysis: if there was not a statistically significant interaction, M/C + P/T would be compared with M/C, P/T, and placebo (three comparisons with a Bonferroni adjustment). If there was a statistically significant interaction, additionally M/C and P/T would be compared to placebo (five comparisons with a Bonferroni adjustment). The results showed that the proportions of acquired infections for the combination M/C + P/T were 77% (zero infections), 20% (one infection), and 8% (two or more infections) and that for the other three arms the treatments were less effective and almost identical: 58% (zero infections), 26% (one infection), and 20% (two or more infections). 24 There was a statistically significant interaction, and the investigators’ analysis demonstrated that the combination was better than either regimen alone and neither regimen.
The results of the three-step approach and Hochberg’s procedure applied to this trial data are given in Table 5. With α = 0.025, using the three-step approach one can conclude that the combination treatment (M/C + P/T) is superior to placebo and then in Step 3 conclude that the combination therapy is better than the single-treatment arms. Using the Hochberg procedure, the same conclusions can be made, which were also the conclusions made by the investigators.
Odds ratios comparisons in the trial of mupirocin/chlorhexidine (M/C) and polymyxin/tobramycin (P/T) to prevent acquired infections. a
SE: standard error; CI: confidence interval; M/C: mupirocin/chlorhexidine; P/T: polymyxin/tobramycin.
Discussion
Factorial trial designs, like other multi-arm trial designs, are efficient because they share a common control arm and allow the ability to answer multiple questions in one trial. 25 A valid factorial analysis, however, requires assumptions that may typically be too strong to be satisfied. Comparing pairwise all four treatment arms is a possibility, but as this approach does not use the natural preference ordering of the treatment arms in factorial design, it will have reduced power for the primary questions for which we are interested (see Online Supplementary Material). Using the preference order, if the aim is to select the best treatment arm, then using one of the approaches of Chen and Simon 8 is appropriate. If, on the other hand, one wants to obtain a statistically rigorous inference for all clinically relevant between-arm comparisons, for example, in order to inform clinical development of the treatments, then the two analysis strategies proposed here allow one to answer these questions.
There are a plethora of possible multiple-comparison testing techniques 9 which could be applied within our framework for the non-factorial analysis of a factorial trial design. For example, one could use the more complex Hommel 26 procedure rather than Hochberg procedure for testing the questions of interest; the improvement in power is minor (results not shown). In the context of the parallel gatekeeping like the three-step procedure, instead of Bonferroni in Step 1, one could use a truncated Hochberg procedure 9 or alternatively a parametric procedure (such as Dunnett’s 27 method using the asymptotic normality and correlation structure of the test statistics). This would result in an increase in power for testing some of the first-step hypotheses at the cost of less power for testing the combination treatment AB in Step 2. We believe the two procedures we have chosen to highlight offer simplicity and reasonable power for testing the various hypotheses of interest.
Comparing the Hochberg and three-step procedure for non-factorial analysis of a two-by-two factorial trial design, we would generally recommend the three-step procedure. Although Hochberg’s procedure has slightly more power when more of the null hypotheses are false, this would seem to be more advantageous in other multiple comparisons’ settings. For example, if one was testing multiple related clinical endpoints in a randomized trial, then the Hochberg procedure would be advantageous in that the inference for a treatment benefit for an endpoint would be stronger when related clinical endpoints are also showing a treatment benefit. 9 In the present context, however, it is unclear why treatment A working well should make it easier to be convinced that treatment B is working well. Perhaps the biggest advantage of the three-step procedure over Hochberg’s procedure is the ability to use Bonferroni-adjusted simultaneous confidence intervals for the comparisons of the experimental treatments with the control treatment. Whatever procedure is used, it is important not to depend on a factorial analysis when there is the possibility of a statistical interaction between the treatments and to use an appropriate sample size to assess the clinical questions of interest.
Footnotes
Appendix 1
In Appendix 1, we demonstrate that our proposed procedure has type 1 error less than
Declaration of conflicting interests
The author(s) declared no potential conflicts of interest with respect to the research, authorship, and/or publication of this article.
Funding
The author(s) received no financial support for the research, authorship, and/or publication of this article.
References
Supplementary Material
Please find the following supplemental material available below.
For Open Access articles published under a Creative Commons License, all supplemental material carries the same license as the article it is associated with.
For non-Open Access articles published, all supplemental material carries a non-exclusive license, and permission requests for re-use of supplemental material or any part of supplemental material shall be sent directly to the copyright owner as specified in the copyright notice associated with the article.