
Abstract
Before a novel treatment can be deemed a clinical success, an assessment of its risk–benefit profile must be made. One of the inherent challenges for this assessment comes from the multiplicity that arises from comparing treatment groups across multiple outcomes. Composite outcomes that summarize a patient’s clinical status, or severity, across a prioritized list of safety and efficacy outcomes have become increasing popular. In this article, we review these approaches and illustrate through examples some of the challenges and complexities of a composite derived from prioritized outcomes, such as the win ratio. These challenges include the difficult tension between the analytical validity that comes from choosing a pre-specified outcome and an evaluation that is responsive to unexpected safety events that arise during the course of a trial. Other challenges include a sensitivity of the resulting test statistic to the underlying censoring distribution and other nuisance parameters. Approaches that resolve some of the difficulties of the analytical challenges associated with prioritized outcomes are then discussed. Ultimately, a composite outcome of net clinical benefit is another decision tool, but one to be used alongside more traditional analyses of efficacy and safety, and with the broader perspective that investigators, the data safety monitoring board, and regulators bring to an evaluation of risk–benefit.
Keywords
Introduction
Under the classical paradigm for clinical trials, separate efficacy and safety endpoints for an intervention are developed. Early phase studies emphasize safety, while later-stage, large phase III studies have efficacy as the primary endpoint. 1 A fundamental part of assessing a novel intervention is also to examine results from comprehensive safety and efficacy analyses to assess the risk–benefit balance. While evaluation of efficacy in a well-designed clinical trial generally involves a straightforward hypothesis test for whether the size of the benefit is large enough to reject a pre-specified null hypothesis, evaluation of the balance of benefit and risk is much less straightforward. This analysis will necessarily need to take into consideration the serious nature of the condition being treated, whether there are any other available drugs, and the risk–benefit profile of other available therapies. This type of evaluation typically leads to a subjective weighing of the cumulative evidence to address whether the balance of risk–benefit points to an overall benefit of a drug, despite the associated risk.
Recently, there has been renewed attention on the development data-driven statistics that summarize net clinical benefit, which could be part of a risk–benefit evaluation. Evans and Follmann 2 propose that later-stage pragmatic trials should in fact have as their primary outcome an endpoint that summarizes risk–benefit rather than the traditional outcome focused on efficacy alone. These authors argue that an endpoint that assesses the balance of risk–benefit within a patient first and then summarizes that assessment across patients in a given trial is better aligned with the objectives of patient-centered outcomes. Such an endpoint would rely on a system that in some way ranks or combines weighted or scored outcomes that are a combination of efficacy and safety outcomes, in order to quantify the within-patient outcome of balance of risk–benefit. Many proposals to assess net benefit, either over multiple efficacy endpoints or over benefits and risks, have appeared in the statistical literature.3–17 Several authors have developed a two-sample test statistic that summarizes information on whether the experience on the investigational treatment is better across treatment–control pairs.3–7 For example, Buyse 5 looked at the “proportion in favor of treatment”; Pocock et al. 6 estimated the ratio of wins to losses for treatment–control pairs. Others categorize patients with an ordinal or continuous severity score that summarizes outcomes across a list of positive and negative outcomes, with the most extreme (or highest prioritized) outcome typically dominating the severity score.8–10 Outcome ranking-based systems have been applied in clinical settings in infectious disease,11–14 neurological outcomes, 15 and cardiovascular disease.16–17 Others propose a weighted combination of multiple outcomes.18,19 In a recent review, Armstrong and Westerhout 19 identified 140 clinical trials that had a primary composite cardiovascular outcome, and of these, 10 reported a combined efficacy/safety composite to assess net clinical benefit.
The complexity of interpreting test statistics of prioritized or weighted outcomes, which summarize overall patient status across multiple endpoints, often belies their intended simplicity. This article provides a review of a few recent proposals for these clinical severity or “totality of outcomes” composite outcomes in order to highlight important considerations when applying such an approach. Some of the analytical difficulties of creating the test statistic, interpreting the parameter being estimated and potentially using this composite to compare results across trials are highlighted. Finally, concluding remarks regarding the usefulness of such approaches to summarize risk–benefit are discussed.
A motivating example: the Women’s Health Initiative hormone replacement trials
Between 1993 and 1998, the US Women’s Health Initiative randomized 27,347 women into one of two primary prevention trials to examine whether estrogen plus progestin or estrogen alone would prevent coronary heart disease.20,21 Observational studies suggested long-term hormone replacement therapy use would be associated with a 30% to 50% reduction in coronary events and an 8% to 30% increase in breast cancer; a number of other outcomes were of interest, including potential benefits for hip and other fractures.22,23 A monitoring plan was put in place, with formal boundaries for both efficacy and harm. 24 There were eight individual outcomes that were considered roughly of equal importance, including coronary heart disease, the primary efficacy outcome, and breast cancer, the primary safety outcome. The time to the first of these eight events formed the global index encompassing benefit and risk, and there was a two-stage process for stopping early either for harm or for benefit that would consider the primary single outcome and the global index. To recommend stopping for efficacy, first the z-value for the primary efficacy outcome had to cross the one-sided upper O’Brien–Fleming 2.5% boundary and then the global index would be compared to the 5% upper boundary. To stop for harm, if one of the eight monitored endpoints crossed the lower one-sided O’Brien–Fleming 5% boundary, then the global index had to drop below −1. The pre-specified analysis for the global index used a weighted log-rank statistic to down-weight earlier events. It was expected that there would be early efficacy on the heart endpoints, but late harm for breast cancer. The data safety monitoring board (DSMB) also examined the unweighted log-rank for the global index, as it would be undesirable to down-weight early events in the case of early harm.
The monitoring boundaries were chosen based on the pre-trial expectations of the risks and benefits of hormone replacement therapy. During the course of the Women’s Health Initiative trials, however, which endpoint was the safety endpoint and which endpoint was the efficacy endpoint came into question. Early on in the monitoring, the active arm in both trials showed an apparent increased risk of coronary heart disease, stroke, and pulmonary embolism; later on, benefit for breast cancer emerged in one of the trials and harm in the other. 25 A debate ensued mid-trial about whether or not the safety endpoint should be modified in reaction to the emergent data. 25 The DSMB ultimately decided against formally defining a composite endpoint of coronary heart disease, stroke, and pulmonary embolism as a new, monitored endpoint. To make things even more complicated, the level of significance and the direction of the effect for some of the endpoints of interest were different, depending on whether the pre-specified weighted log-rank or the unweighted test was used.
The Women’s Health Initiative hormone replacement therapy trials are instructive on many levels. First, it is notable that despite these trials being preceded by decades of clinical data regarding potential benefits and harms, a wealth of data rarely available at the start of a clinical trial, several unexpected findings still occurred. Second, without perfect knowledge in advance regarding which outcomes will in fact be affected by the therapy (negatively or positively), it is likely that any pre-specified statistic will be missing an important component of the outcomes that contribute to the balance of risk–benefit. Third, monitoring multivariate outcomes is complex, and a single unidimensional p value will rarely be an adequate summary of the overall effect of the intervention. Finally, this example shows the need for incorporating a flexible framework for the assessment of risk–benefit—one that can be responsive to emerging evidence as a trial progresses. Even with a well-laid out framework of statistical hypothesis testing, decision-making will inevitably involve evaluation of data regarding multiple outcomes and a subjective judgment of the totality of evidence regarding risk–benefit. See Freedman et al. 24 and Wittes et al. 25 for further discussion of the monitoring of the Women’s Health Initiative hormone replacement therapy trials.
Assessing risk–benefit with a composite of prioritized outcomes
At all stages of development, investigators and sponsors need to evaluate the risk–benefit balance of an intervention to inform the decision about whether the treatment is worth further study or continued use in a population. In the later phases of development, say in the context of a blinded phase III randomized clinical trial, a DSMB is generally in place and charged with assessing that the intervention maintains an acceptable risk–benefit balance in order to recommend continuation of the study. 26 To this end, this committee would typically be presented with analyses of several separate endpoints; these generally include the primary efficacy endpoint, any key secondary efficacy outcomes, and key safety outcomes, along with tables of the reportable adverse events experienced during the trial. The DSMB then needs to weigh the totality of evidence and make a necessarily subjective judgment regarding the overall balance of benefit and risk and whether to recommend continuing or stopping the trial. An alternate approach to assess for risk–benefit uses a statistical quantity to summarize the risk–benefit quantitatively, say in the form of a composite endpoint. In this section, we concentrate on this second approach, which some in the literature have termed the only objective approach. 2 We will see that the quantification of this risk–benefit balance necessitates a composite endpoint and ultimately subjective choices regarding the relative weight, either directly or indirectly, given to each endpoint in the final test statistic. We focus on recent proposals to assess risk–benefit through a summary of prioritized outcomes.
Pocock et al. 6 propose the win ratio statistic for the setting of a randomized controlled trial, by which patients are first ranked by their baseline risk for the event of interest in order to create matched control–treatment pairs. Members of each pair are then compared according to a predetermined set of prioritized outcomes and ranked as the winner or loser for that pair based on the outcome of highest priority for which they could be compared. For example, if there are two endpoints of interest, time to hospitalization and death, time to death would generally be given the higher priority. The subjects in a pair would be ranked better or worse first by time of death. If this was not possible, say if one patient was censored before the other had died, the patients are then ranked according to their time to first hospitalization. If the entire list of prioritized outcomes was exhausted and subjects within a given pair could not be ranked, then they are considered a tie. This statistic is similar to that of Buyse 5 who considered the proportion in favor of the treatment, estimated by assigning a score to each pair as in favor (1), neutral (0), or not in favor (−1) of the treatment and then taking the mean of this score over all possible treatment–control pairs. Buyse drew connections between his proportion favoring the treatment to the Wilcoxon rank-sum statistic and the “probabilistic index” P(X > Y), where X is the outcome for control and Y for treatment. 27 The win ratio statistic is simply the ratio of wins to losses for the treatment group. The p value is readily computable, as is the confidence interval. 6 The win ratio statistic can also be calculated without matching, averaging over all treatment–control pairs; there is some power gain if you have a good risk profile for matching, but pairing is not necessary. Bebu and Lachin 28 provide a straightforward inference procedure for the case of unmatched pairs. Luo et al.7,29 provide a weighted version of the win ratio statistic, along with software.
The benefits of the win ratio appear intuitive and this has likely led to the popularity of this and related approaches. The statistic can incorporate information regarding the timing of all important outcomes. The win ratio also allows more severe events, not just the first-occurring, to determine the outcome of a pair. This is particularly useful when the earlier events tend to be less severe. If the novel treatment is having a similar effect on the highest prioritized outcomes, then it could have higher power, although this is not guaranteed. Pocock et al. 6 discussed this statistic to summarize overall net benefit across multiple efficacy endpoints typical in the cardiovascular setting; however, it has also been proposed to summarize net benefit across positive and negative outcomes. 30 Less intuitive features of the win ratio are illustrated with the following example adapted from Shaw and Fay. 10
The historic studies of left ventricular dysfunction (SOLVD) included a randomized placebo-controlled trial of enalapril for the prevention of mortality and hospitalization in patients with congestive heart failure and weak left ventricular ejection fraction. 31 There were over 2500 patients randomized and the active drug was found to be beneficial for mortality and for the composite outcome, time-to-first of death or hospitalization. For illustrative purposes only, consider the subset of diabetic subjects, a group who in some settings can have a difficult-to-balance set of risks and benefits. If the diabetic condition increased risk of cardiovascular side effects, the composite outcome becomes one of combined safety and efficacy. In this group, there were 137 deaths out of 319 on enalapril and 145 deaths out of 343 on placebo (Table 1). The hospitalization outcome showed a much larger effect with 94 events on the active arm and 195 on the placebo. The log-rank score test demonstrated that there was no apparent effect on the time to mortality (p = 0.91) and a large effect on time-to-first of mortality or hospitalization (p < 0.001). Statistics that prioritize mortality thus stand to provide a very different summary of benefit than the time-to-first outcome. To compute the win ratio statistic, a risk profile based on available baseline cardiovascular risk factors was used to rank patients on their baseline risk, creating 319 pairs. In all, 24 patients necessarily go unused. Ranking first on time-to-mortality and then on hospitalization yielded 145 wins on the active, 112 wins on placebo, and 62 indeterminate pairs, for a ratio of 1.29 and p value of 0.038. There were 98 wins on death for the active and 91 wins for placebo. Among the minority of 68 pairs ranked on hospitalization, there were 47 wins on active and 21 on placebo. Had the trial run a little longer, and had the trend for death continued, the significance would have been lost. Had there been a shorter trial, there would have been fewer deaths, and the win for the treatment would have been more convincing. What this example demonstrates is that the censoring distributions of these endpoints can determine the relative contribution of the outcomes to the win ratio statistic. Without additional distributional assumptions, the win ratio needs to be estimated for a fixed follow-up time in order to have the same target parameter summarizing the treatment effect for all patients. 32 What this implies for a large-scale trial, in which enrollment is staggered over several years and the length of follow-up varies across patients, is that the target parameter will vary across patients. For a DSMB, it can be informative to compare study results between the trial under review and other concurrent or recent trials of the same, or perhaps similar, interventions. The sensitivity of the win ratio to the censoring distribution limits the ability to compare results across trials, particularly if the study populations’ baseline risk or length of follow-up varies between the trials. Another criticism of the win ratio is that, due to censoring, a number of pairs will have indeterminate status, with no clear winner or loser. To address this issue, Pocock et al. 6 proposed matching pairs within strata based on randomization date. In this SOLVD example, however, matching within randomization year strata yielded a similar number of indeterminate pairs and so the unstratified analysis was used to minimize the difference in matched risk scores.
The number of events and p value for the log-rank statistic for the time to first hospitalization (treating death as censored), death, and time-to-first of either outcome for diabetic subjects in the SOLVD treatment trial (N = 662)a.
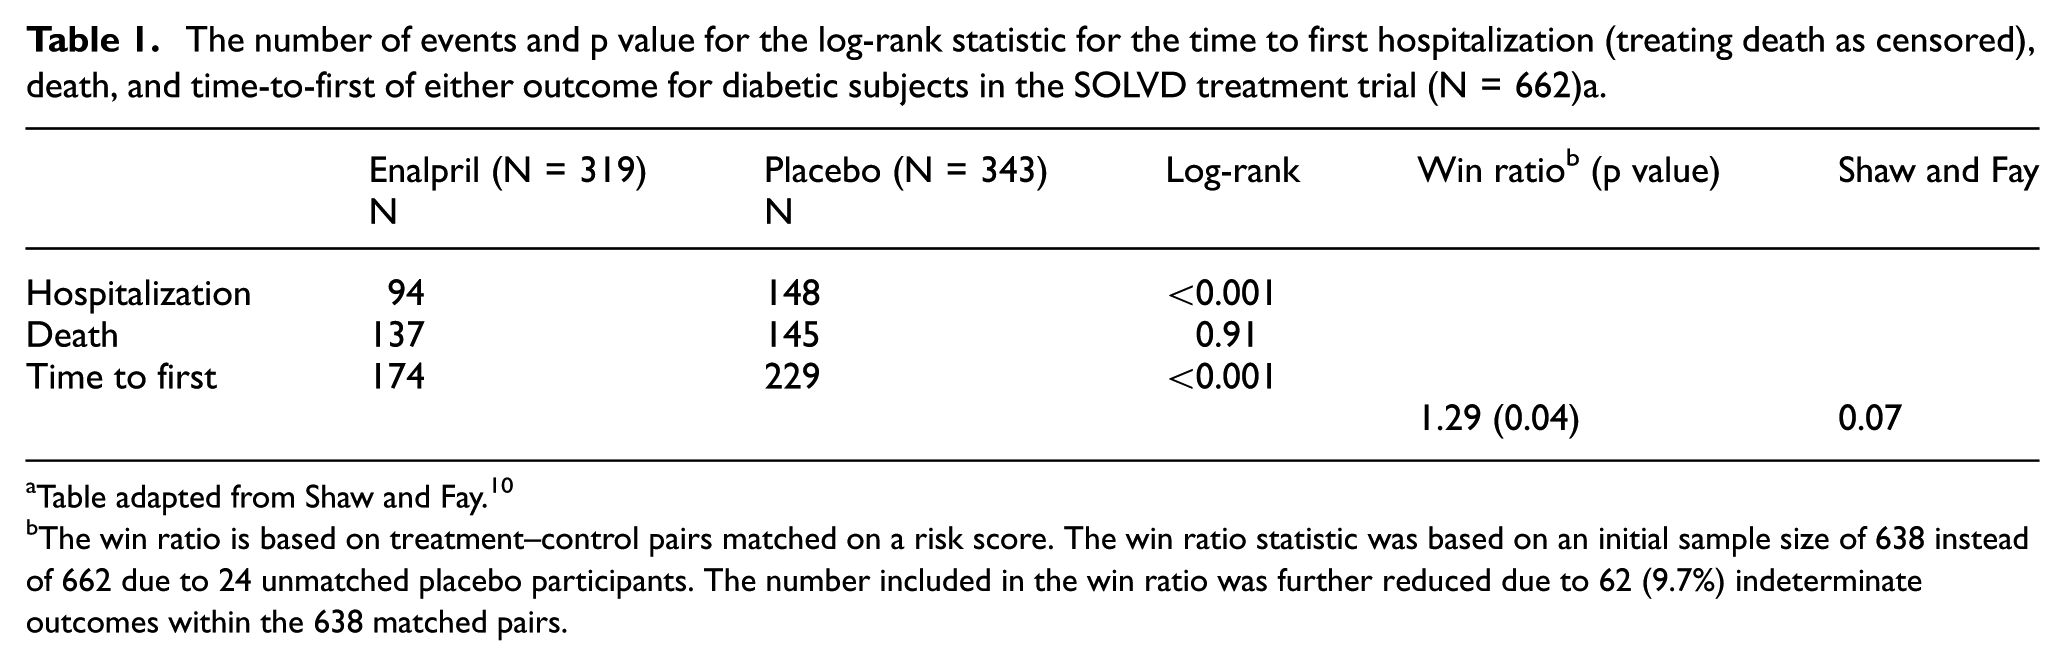
Table adapted from Shaw and Fay. 10
The win ratio is based on treatment–control pairs matched on a risk score. The win ratio statistic was based on an initial sample size of 638 instead of 662 due to 24 unmatched placebo participants. The number included in the win ratio was further reduced due to 62 (9.7%) indeterminate outcomes within the 638 matched pairs.
Other prioritized outcomes involving time-to-event outcomes share the same sensitivity to censoring as the win ratio. In case of Buyse, 5 Pocock et al., 6 and Shaw and Fay, 10 the prioritized composite outcome can be written as a weighted combination of the individual outcomes, with the weights depending on the censoring distributions.10,33 In the case of continuous outcomes, the probability index P(X > Y) has also been criticized for being sensitive to nuisance parameters of a distribution, such as potentially finding a difference between treatments when the only effect of treatment was to change the variance of the outcome.34,35 While the assessment of the risk–benefit balance is difficult whenever that balance changes over time, these trade-offs can be much more difficult to appreciate from a one-dimensional summary than if the risks and benefits were analyzed separately.
Incorporating uncertainty
For settings with time-to-event endpoints, one can take the view that the win ratio and other similar prioritization composites are simply imputing the relative severity using less severe endpoints when the timing of the most severe endpoint is unknown and does so without the incorporating the uncertainty of that imputation. Illustrating this point, Figure 1 shows the time course for two patients: patient 1, the gray line, on treatment 1 (investigational), and patient 2, on treatment 2 (control). The patient on treatment 1 died, but then patient 2 was censored during a shorter follow-up period, so it is unknown whether patient 2 would have been ranked worse or better on survival. Thus, the next step for the typical prioritized outcome is to compare the patients’ hospitalization outcome. Both patients had a hospitalization, so the win ratio would give a win to the investigational treatment because patient 1 was observed to have a later hospitalization. Following censoring, patient 2 went on to die at year 4. Had we known that, the treatment would have been given a loss instead of a win. Furthermore, the win ratio would have assigned the same outcome, a win, to the treatment whether this patient got censored 1 day or 1 year before patient 1 had died. Regardless of how much follow-up without the death event, the win ratio ignores that information and moves onto the next outcome on the priority list. This is equivalent to a single imputation of the missing survival outcome with no uncertainty. Single imputation can lead to an overestimated precision for the study results.
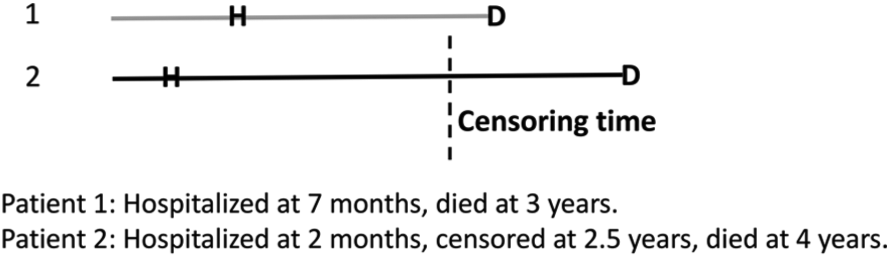
Comparison of time to hospitalization (H) and death (D) for a pair of patients. The left endpoint denotes time of randomization and length of line denotes time between events for each patient. The vertical dotted line indicates the censoring time for patient 2, indicating his death was not observed during the study. Owing to censoring, severity of patient 1 would be classified as more severe for the win ratio statistic because of the shorter time to hospitalization relative to patient 2. The clinical severity statistic of Shaw and Fay 10 would treat severity score of patient 2 as interval-censored, between a score that represents the best and worst possible severity scores over a chosen length of follow-up post-randomization. The possible scores for patient 2 depend on the possibilities for the unobserved death time, ranging from a score based on a death just after the censoring time (before the death of patient 1) to a score derived from patient 2 having survived until the chosen milestone time point.
In contrast to the prioritization approaches, such as the win ratio, there are a number of available methods to compare treatment groups with a summary of a multivariate outcome that do incorporate the uncertainty of each outcome. Shaw and Fay 10 proposed a two-sample rank-based statistic for clinical severity that uses information on the bivariate survival distribution. These authors considered the setting of a bivariate outcome in which it was assumed one event was the true event of interest (i.e. death) and the second event was a surrogate, so that the severity was determined by the survival endpoint if observed, and otherwise using the surrogate. The test statistic was formed from a weighted average of the different possible severity rankings for a patient, where the weights were derived from the probability of a specific outcome conditional on the censored event time(s) and derived from the bivariate distribution. In the authors’ example, the clinical severity summarized the net benefit observed over outcomes representing anti-infective efficacy (clearing tuberculosis) and death, which can be considered both a safety (due to drug toxicity) and efficacy (due to disease severity) endpoint. In a 20-week trial of a novel treatment for drug-resistant tuberculosis, a subject was given a score of k if he died in week k; a score of 21 if he survived 20 weeks without clearing tuberculosis; and a score of 41-k if he cleared tuberculosis in week k. Thus, all who died were ranked worse (lower) than the survivors. If a subject dropped out at week 16 after having converted in week 5, his possible severity scores are as follows: 36 if he truly survived 20 weeks, 17 if he died in week 17, 18 if he died at week 18, and so on. These authors repeated an analysis of the above described example for SOLVD and found that their proposed rank test for the severity score had p = 0.07 for the treatment group difference. Although similar, the treatment effect was less certain than suggested by the single imputation win ratio method (Table 1).
Claggett et al. 9 also present a method to account for censoring in the case of an ordinal severity score summarizing a patient’s clinical status across multiple, potentially censored, endpoints encompassing risks and benefits, by applying inverse probability of censoring weighting. Rauch et al. 33 discuss two alternate approaches. The first is to remove the dependence of the prioritized outcome test statistic on the underlying censoring distributions by replacing the weights that censoring had introduced into the test statistic with predetermined, fixed weights that do not depend on the probability of observing the endpoints. The second proposed alternative approach was to conduct a test for the unweighted composite endpoint supported by testing of the most important subcomponents to resolve the interpretation difficulties, using an appropriate multiple testing procedure such as a sequentially rejective test or other gate-keeping strategy. 33
Discussion
Data-driven summary statistics for risk–benefit assessment can be easy to gravitate to, as they appear to be a more objective way to combine data across multiple endpoints, relative to an individual having to process separate analyses of several individual outcomes. Ironically, one of the most attractive aspects of the prioritized composite outcome is that it can incorporate subjectivity directly. That is, the prioritization incorporates input from a panel of clinical experts and/or patients as to which outcomes should be weighed more heavily in the composite. The downside to such a numerical summary of risk–benefit is that it is often hard to appreciate the target parameter truly being estimated, which can involve both implicit weighting from the relative frequency of the individual outcomes and explicit investigator-defined weighting of the multiple outcomes. It is also not widely appreciated that similar censoring distributions are generally needed for time-to-event outcomes to make the estimated parameter comparable across patients and across trials. In settings where the follow-up time is fixed across patients or where any censoring has been handled appropriately,9,10,32,33 prioritized outcomes will be a more straightforward comparison across patients.
The usual caution for composite outcomes applies to prioritized outcome composites. Composites that summarize outcomes of varying severity and varying frequency are hard to interpret. 36 Others have criticized their use to summarize outcomes that vary in the direction of the treatment effect, potentially allowing an efficacy outcome of lesser clinical importance to obscure a serious harm.19,37,38 Any comprehensive analysis of a composite outcome should be accompanied by an analysis of the individual sub-outcomes for better interpretation. In addition, prioritized outcomes should make transparent the time-specific nature of the outcome, such as 48-week severity, to clarify the time frame of interest. If follow-up varied between study participants, then the censoring must be handled analytically in a way to allow the severity endpoint to estimate the same target measure of risk–benefit across participants.9,10,33
Sensitivity analysis provides important information regarding the robustness of study results to varying assumptions about the relative priority or weighting of the endpoints under consideration. Follmann et al. 16 evaluated the inter-rater agreement of a priority ranking of hypothetical patient profiles in a cardiovascular setting and were encouraged by the level of between-rater agreement. Consensus panels of patients and clinicians can offer input a priori on the most important components for a composite outcome and their relative weights or priority, and these perspectives may differ. These types of consensus panels may need to be reconvened during or at the end of a trial if unexpected events occur during the trial that were not accounted for in the original evaluation of severity. Sensitivity analyses are also a natural way to evaluate the impact of different systems of weighting endpoints or assigning the priority ranking.
Outside the risk–benefit setting, there are many other alternative choices for test statistics whose focus is to efficiently combine information from multiple outcomes into a single test statistic.39–44 Many of these summaries assume a common treatment effect, or at least a consistent direction of the effect, across the outcomes and thus would not be appropriate for the risk–benefit setting. Omnibus testing approaches also often implicitly treat the sub-outcomes as having equal importance. Other strategies that, for efficiency, inversely weight the univariate statistics according to their variance will down-weight a seldom observed outcome, such as death, relative to a more frequently observed surrogate, which may not be desirable as a summary of the risk–benefit.39,43
No approach is going to work for every setting. Ultimately, the prioritized outcome is another decision tool, but one to be used alongside more traditional analyses and with the broader perspective that investigators, the DSMB, and regulators bring to an evaluation of benefit risk.
Footnotes
Declaration of conflicting interests
The author(s) declared no potential conflicts of interest with respect to the research, authorship, and/or publication of this article.
Funding
The author(s) received no financial support for the research, authorship, and/or publication of this article.