
Abstract
Background:
More than 95% of recent cancer randomized controlled trials used the log-rank test to detect a treatment difference making it the predominant tool for comparing two survival functions. As with other tests, the log-rank test has both advantages and disadvantages. One advantage is that it offers the highest power against proportional hazards differences, which may be a major reason why alternative methods have rarely been employed in practice. The performance of statistical tests has traditionally been investigated both theoretically and numerically for several patterns of difference between two survival functions. However, to the best of our knowledge, there has been no attempt to compare the performance of various statistical tests using empirical data from past oncology randomized controlled trials. So, it is unknown whether the log-rank test offers a meaningful power advantage over alternative testing methods in contemporary cancer randomized controlled trials. Focusing on recently reported phase III cancer randomized controlled trials, we assessed whether the log-rank test gave meaningfully greater power when compared with five alternative testing methods: generalized Wilcoxon, test based on maximum of test statistics from multiple weighted log-rank tests, difference in t-year event rate, and difference in restricted mean survival time with fixed and adaptive
Methods:
Using manuscripts from cancer randomized controlled trials recently published in high-tier clinical journals, we reconstructed patient-level data for overall survival (69 trials) and progression-free survival (54 trials). For each trial endpoint, we estimated the empirical power of each test. Empirical power was measured as the proportion of trials for which a test would have identified a significant result (p value < .05).
Results:
For overall survival, t-year event rate offered the lowest (30.4%) empirical power and restricted mean survival time with fixed
Conclusion:
The empirical power assessment with the past cancer randomized controlled trials provided new insights on the performance of statistical tests. Although the log-rank test has been used in almost all trials, our study suggests that the log-rank test is not the only option from an empirical power perspective. Near universal use of the log-rank test is not supported by a meaningful difference in empirical power. Clinical trial investigators could consider alternative methods, beyond the log-rank test, for their primary analysis when designing a cancer randomized controlled trial. Factors other than power (e.g. interpretability of the estimated treatment effect) should garner greater consideration when selecting statistical tests for cancer randomized controlled trials.
Keywords
Introduction
The randomized controlled trial (RCT) is the key clinical research method used to rigorously evaluate the efficacy and safety of a new therapy compared with a control therapy. Typically, regulatory approval of new developed cancer drugs is based on statistically significant differences in time-to-event outcomes from phase III RCTs. Results from RCTs also play a key role in making coverage determinations by payers and treatment decisions by practitioners.
While there are many methods to compare the survival time distribution between two randomized groups, our recent study 1 revealed that more than 95% of contemporary cancer RCTs used the log-rank test, or an asymptotically equivalent hazard ratio (HR)-based test (e.g. the score test or Wald test based on the partial likelihood via Cox’s 2 proportional hazards (PH) model) to detect a treatment difference. Although log-rank/HR-based tests offer maximal power when the ratio of the hazard functions from two groups is constant over time (i.e. PH), the routine use of the log-rank/HR-based test has one notable shortcoming. Using a log-rank/HR-based test as the primary analysis leads investigators to automatically choose the HR to report the magnitude of the treatment effect, yet the HR does not provide an easily interpretable summary of the treatment effect magnitude.3–8 Specifically, because the HR is not a ratio of two numbers but a ratio of two functions of time, there is no absolute number from the control group that can be a reference to assess if the reported HR indicates a clinically meaningful magnitude of the treatment effect. This is true regardless of whether or not the PH assumption is correct.3,4 When the PH assumption is violated, the interpretation is rather difficult because the HR derived from the standard Cox’s method is affected by the study-specific censoring time distribution. 9
For those non-PH cases, instead of using the standard Cox’s method, one may use a different approach to estimate the HR (e.g. Kalbfleisch and Prentice, 10 Xu and O’Quigley, 11 and Schemper et al. 12 ). Since HRs estimated through those procedures will not depend on the study-specific censoring time distribution, the resulting HR can be interpreted as an “average” HR under non-PH scenarios. It can also be interpreted as an approximation of “odds of concordance” with a particular weight function, as proposed by Schemper et al. 12 However, these approaches also have some drawbacks with regarding interpretation of the treatment effect magnitude. The average HR is essentially a weighted average of time-specific HR over a time range, so the weight function and the time range should be clearly reported together with the average HR to aid interpretation. However, if the weight function is not intuitive, the interpretation of the HR could be challenging for clinicians/patients. The time range would also need to be a clinically relevant range to permit clinical interpretation of the treatment effect, unless the average HR is independent of the length of follow-up time. Moreover, the lack of a reference number from the control group will still be an issue for the average HR, as it is for the standard HR. A nice illustration of the difficulties that arise when using HR for shared decision-making is shown in the paper by McCaw et al. 13 Also, a recent survey found that 47% of respondents misinterpreted the HR, 14 supporting the concern that HR can be a challenging way to summarize the treatment effect magnitude.
To address the shortcomings of the log-rank/HR-based approach, several alternative approaches have been introduced.
3
For example, restricted mean survival time (RMST)-based analysis3,4,7,15–17 is one alternative gaining more recent attention. As with all methods, the RMST-based analysis has pros and cons. Robustness is one notable advantage over HR as the inference of RMST-based metrics (e.g. RMST difference) do not require strong model assumptions. Another major advantage is the existence of a reference value from the control group, which can help clinicians/patients interpret the magnitude of the treatment effect summarized by the difference or ratio of RMSTs. Also, a recent theoretical study found that the RMST-based test has similar power compared with the log-rank test for PH scenarios, and it can offer a greater power than the log-rank test for non-PH scenarios except for delayed difference patterns.
18
On the other hand, one disadvantage of the RMST-based approach is that interpretation of RMST depends on the time-window. When the time ranges from 0 to
As mentioned earlier, more than 95% of contemporary cancer RCTs use the traditional log-rank/HR approach. 1 This indicates that although there are many alternative statistical methods, most of them are only found in statistical journals. When a new alternative statistical method is proposed, Monte Carlo simulation studies are conducted to assess the performance of the new method. These numerical studies rely on artificial data and configurations/settings that are quite limited. More convincing real-world evidence would be necessary for an alternative statistical method to be realistically utilized in practice. A major factor impeding adoption of non-log-rank/HR methods may be simply the impression that the log-rank test offers the greatest power in real-life settings since statistical theory has demonstrated that log-rank/HR-based tests offer the greatest power at least under PH scenarios. 19 However, it is unknown whether the log-rank/HR-based approach has a practically meaningful power advantage against alternative testing procedures in the real-world setting. Focusing on cancer RCTs, we take an evidence-based approach for comparing the empirical power of statistical tests.
Materials and methods
We identified phase III cancer RCTs recently reported in major medical journals, reconstructed patient-level data 20 and analyzed them to determine the empirical power of different statistical testing procedures.
Data sources and searches
Using PubMed, we searched for papers that reported overall survival and/or progression-free survival results from phase III RCTs and were published in one of seven journals: JAMA, JAMA Oncology, Journal of Clinical Oncology, Journal of the National Cancer Institute, Lancet, Lancet Oncology, and New England Journal of Medicine. The registration date on PubMed had to be between 1 July 2016 and 30 June 2017. Two authors (M. Horiguchi and H. Uno) independently examined the papers to confirm eligibility. The criteria for inclusion in the analysis were as follows: (a) two-arm phase III RCT that reported overall survival or progression-free survival, (b) comparative groups were randomized, (c) study not primarily designed to show non-inferiority, (d) reported results for the primary analysis of the study, and (e) had sufficient information to reconstruct patient-level data (i.e. Kaplan–Meier curve with number at risk at several time points). For each eligible study, we reconstructed the patient-level data for overall survival, progression-free survival, or both, using the algorithm proposed by Guyot et al. 20 We confirmed that our reconstructed subject-level data reproduced practically identical results that were reported in the original papers (Supplementary Material S1).
Statistical testing procedures for comparing treatment groups
We analyzed six statistical methods for testing the treatment effect.
Log-rank test
The log-rank test is asymptotically equivalent to testing if HR equals 1 in Cox’s 2 PH model. This test offers the highest power under PH scenarios. In this study, we used the log-rank test to represent all log-rank/HR-based tests.
Generalized Wilcoxon test
This is a test in the class of weighted log-rank tests, 21 which includes the log-rank test as a special case. Compared with the log-rank test, the generalized Wilcoxon test places relatively more weight on early study time points. Thus, this test offers higher power for early difference patterns compared to the log-rank test. While there are several testing procedures called the generalized Wilcoxon test, we specifically used the Peto–Prentice Wilcoxon test.22,23
Max-Combo test
A test based on maximum of several weighted log-rank test statistics. The non-PH working group, a collaboration of the US Food and Drug Administration and the pharmaceutical industry, highlighted the Max-Combo test as a way to address non-PH issues.
24
The test statistic of their Max-Combo test is the maximum of test statistics from multiple weighted log-rank tests in the
RMST with a fixed
test
RMST for each group can be estimated non-parametrically as the area under the Kaplan–Meier curve. For implementation of this test, either a specific time point or a specific rule to determine the truncation time point
RMST with an adaptive
test
This approach allows the investigator to specify a set of candidate
t-year event rate difference test
This test compares survival probabilities at a specific time point
All analyses were performed using R version 3.5.1. The program packages used to implement the above six tests are listed in Supplementary Material S2. Prior to conducting the analyses, we performed a numerical study and confirmed that the type I error rates of the six tests were controlled at a two-sided alpha level of .05 even with the smallest sample sizes in our set of papers (Supplementary Material S3). This confirms that we can perform a fair power comparison of these testing procedures, because their false-positive errors are the same. We did not include median difference testing in this comparison, because it is not applicable for all studies.
Statistical analysis
We considered a total of nine tests, since there were two entries from the RMST tests with a fixed
Results
A total of 150 articles were identified by PubMed search. Of these, 69 and 54 papers satisfied eligibility criteria for the analysis of overall survival and progression-free survival, respectively (Figure 1). Table 1 summarizes the characteristics of the eligible studies by outcome variable. The primary endpoint was overall survival in 49% of the studies that were eligible for the analysis of overall survival, and the primary endpoint was progression-free survival in 63% of the 54 studies that were eligible for the analysis of progression-free survival. The log-rank test was used in almost all circumstances—97% of studies for overall survival and 100% of studies for progression-free survival. Violation of the PH assumption was suggested in 7% of overall survival and 33% of progression-free survival analysis. About 80% of studies had sample sizes over 300 for overall survival and progression-free survival. For overall survival, median follow-up time was greater than 3 years in 39% of studies, whereas for progression-free survival, median follow-up time was less than 1 year in 48% of studies. Other characteristics (e.g. journal, cancer type) of the eligible studies are listed in Supplementary Material S4.
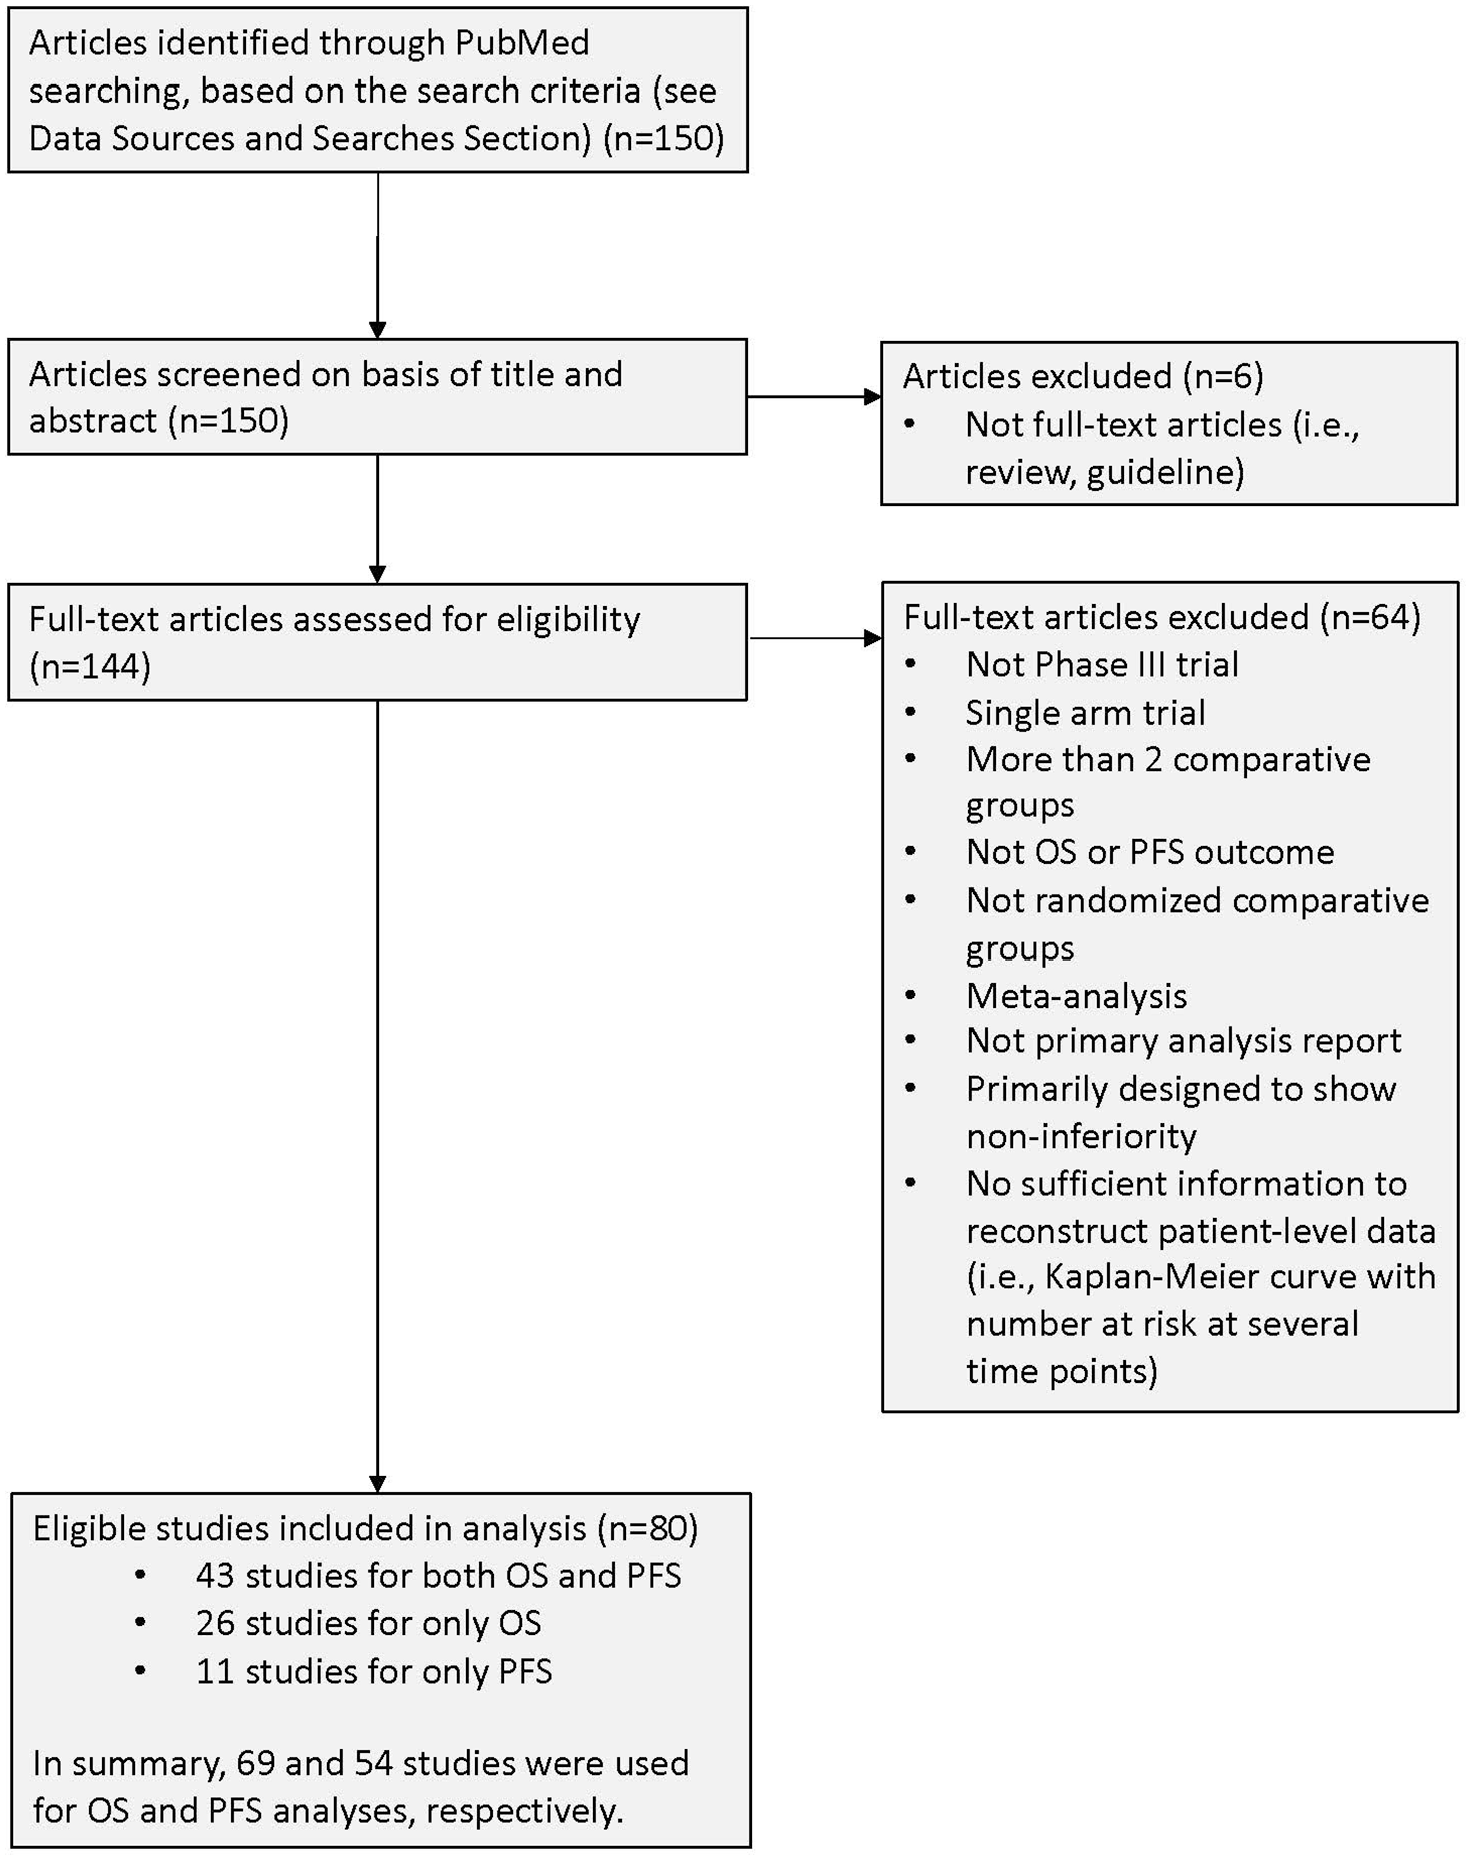
Flow diagram of study selection.
Study characteristics.
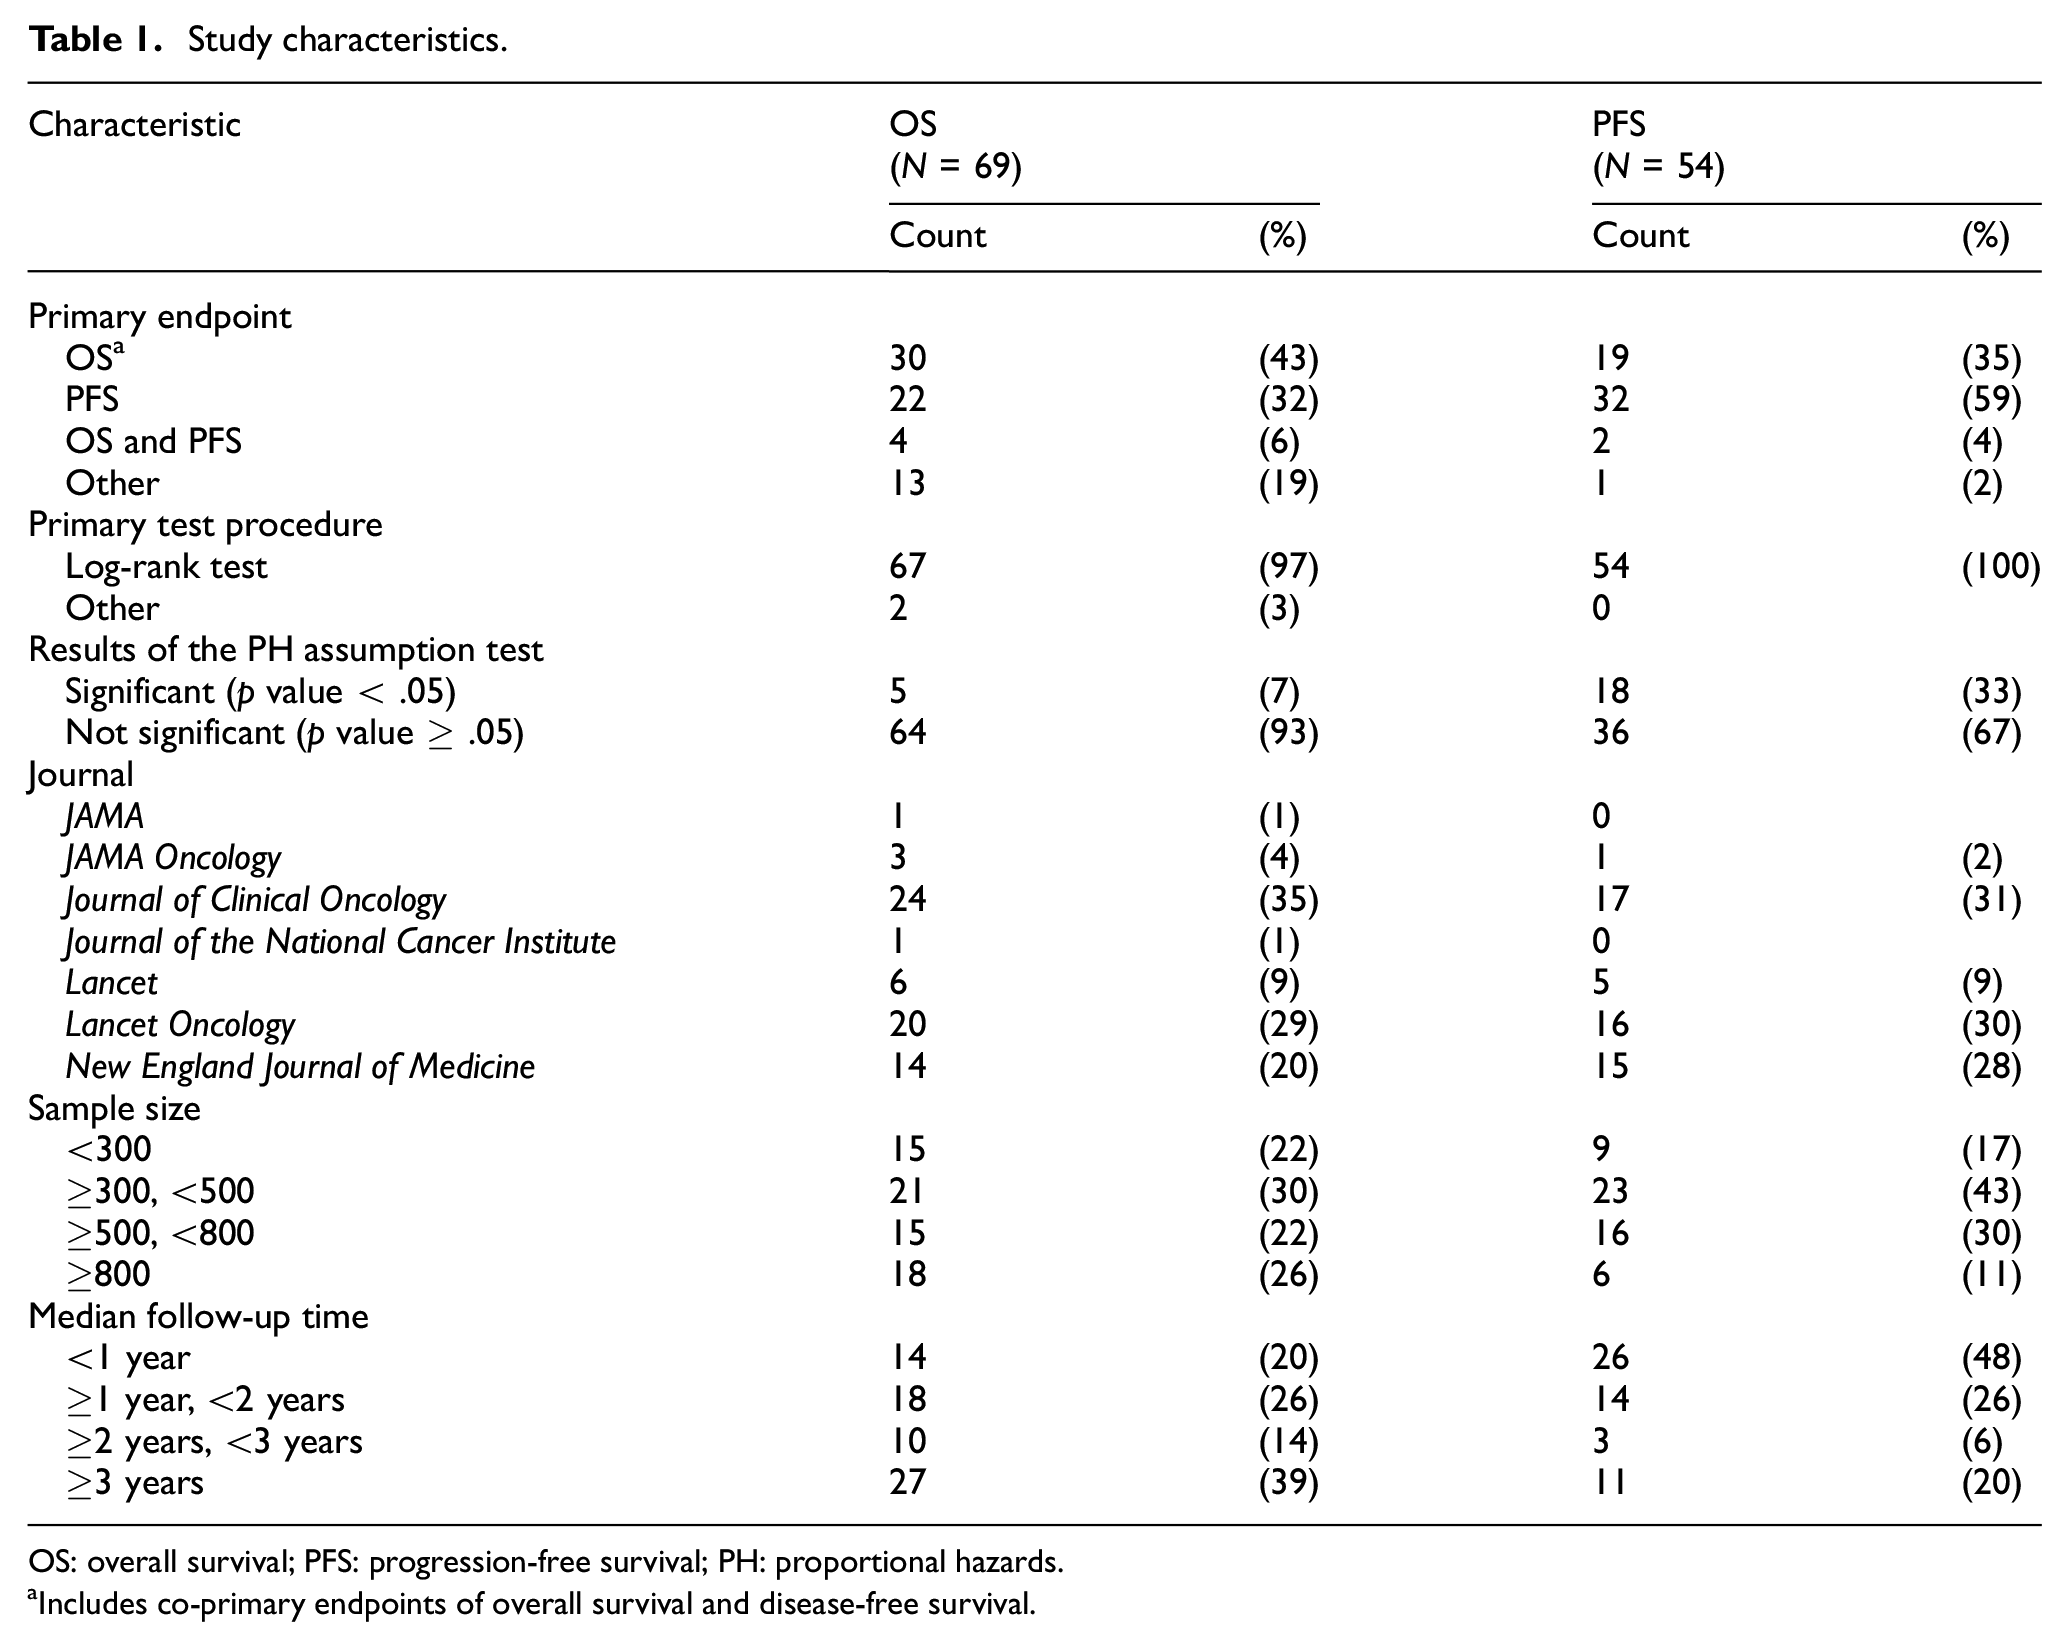
OS: overall survival; PFS: progression-free survival; PH: proportional hazards.
Includes co-primary endpoints of overall survival and disease-free survival.
We applied a total of nine tests to the data from each study and calculated p values. The results are described as scatter plots to contrast the log-rank test and the others. Figure 2 shows the p values, for overall survival (N = 69), from RMST-based test with a fixed
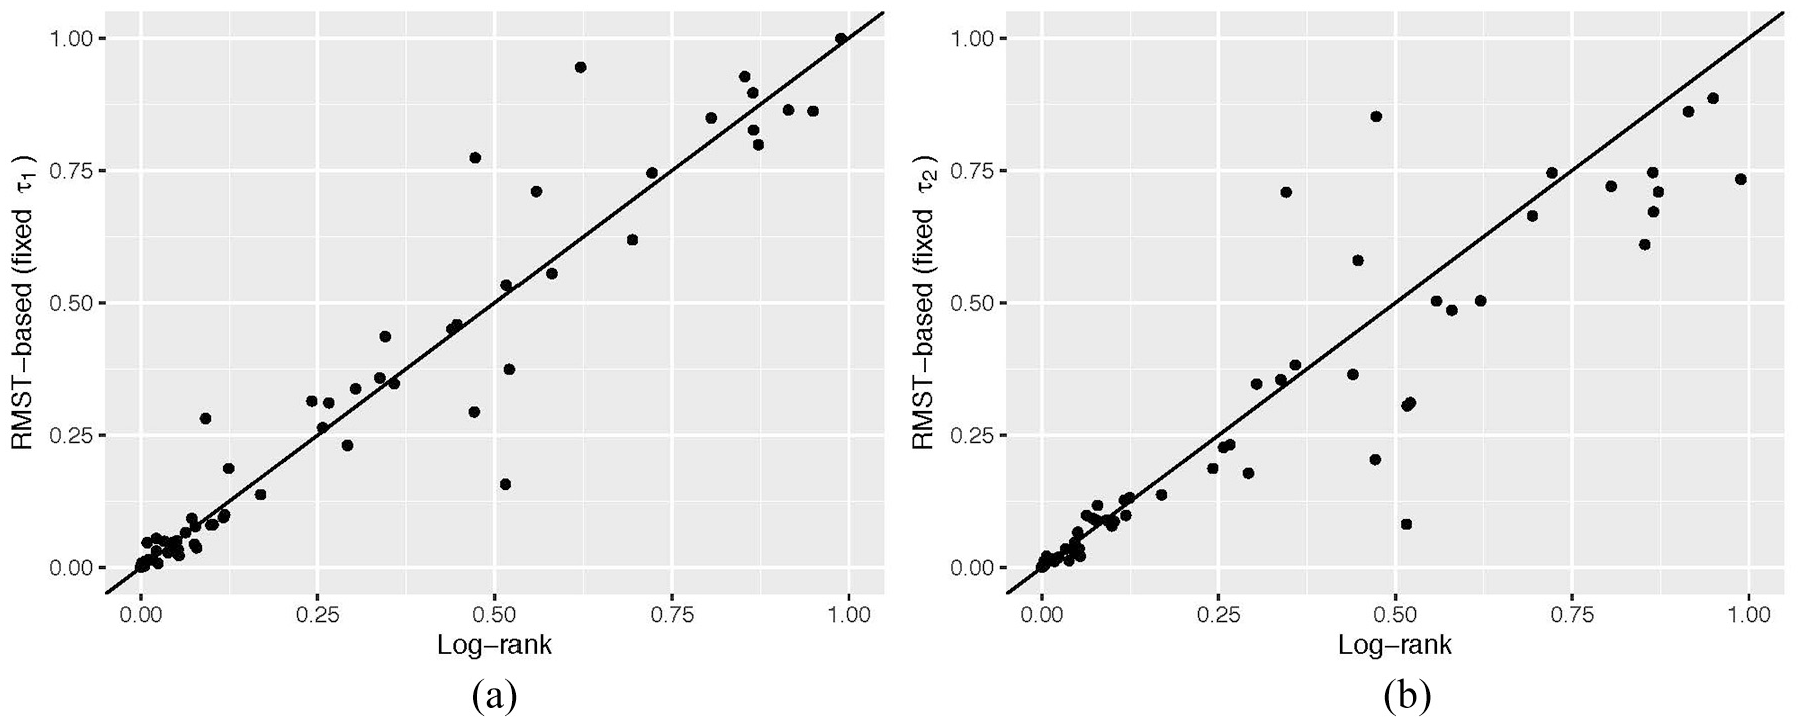
Distribution of p values from tests for difference in RMST with fixed (a)
Distribution of p values from tests for difference in RMST with fixed (a)
For the overall survival outcome, the empirical power estimates were 37.7% for the log-rank test, 36.2% for the generalized Wilcoxon test and the Max-Combo test. They were 43.5% and 40.6% for the RMST test with a fixed
Empirical power of selected statistical tests for overall survival.
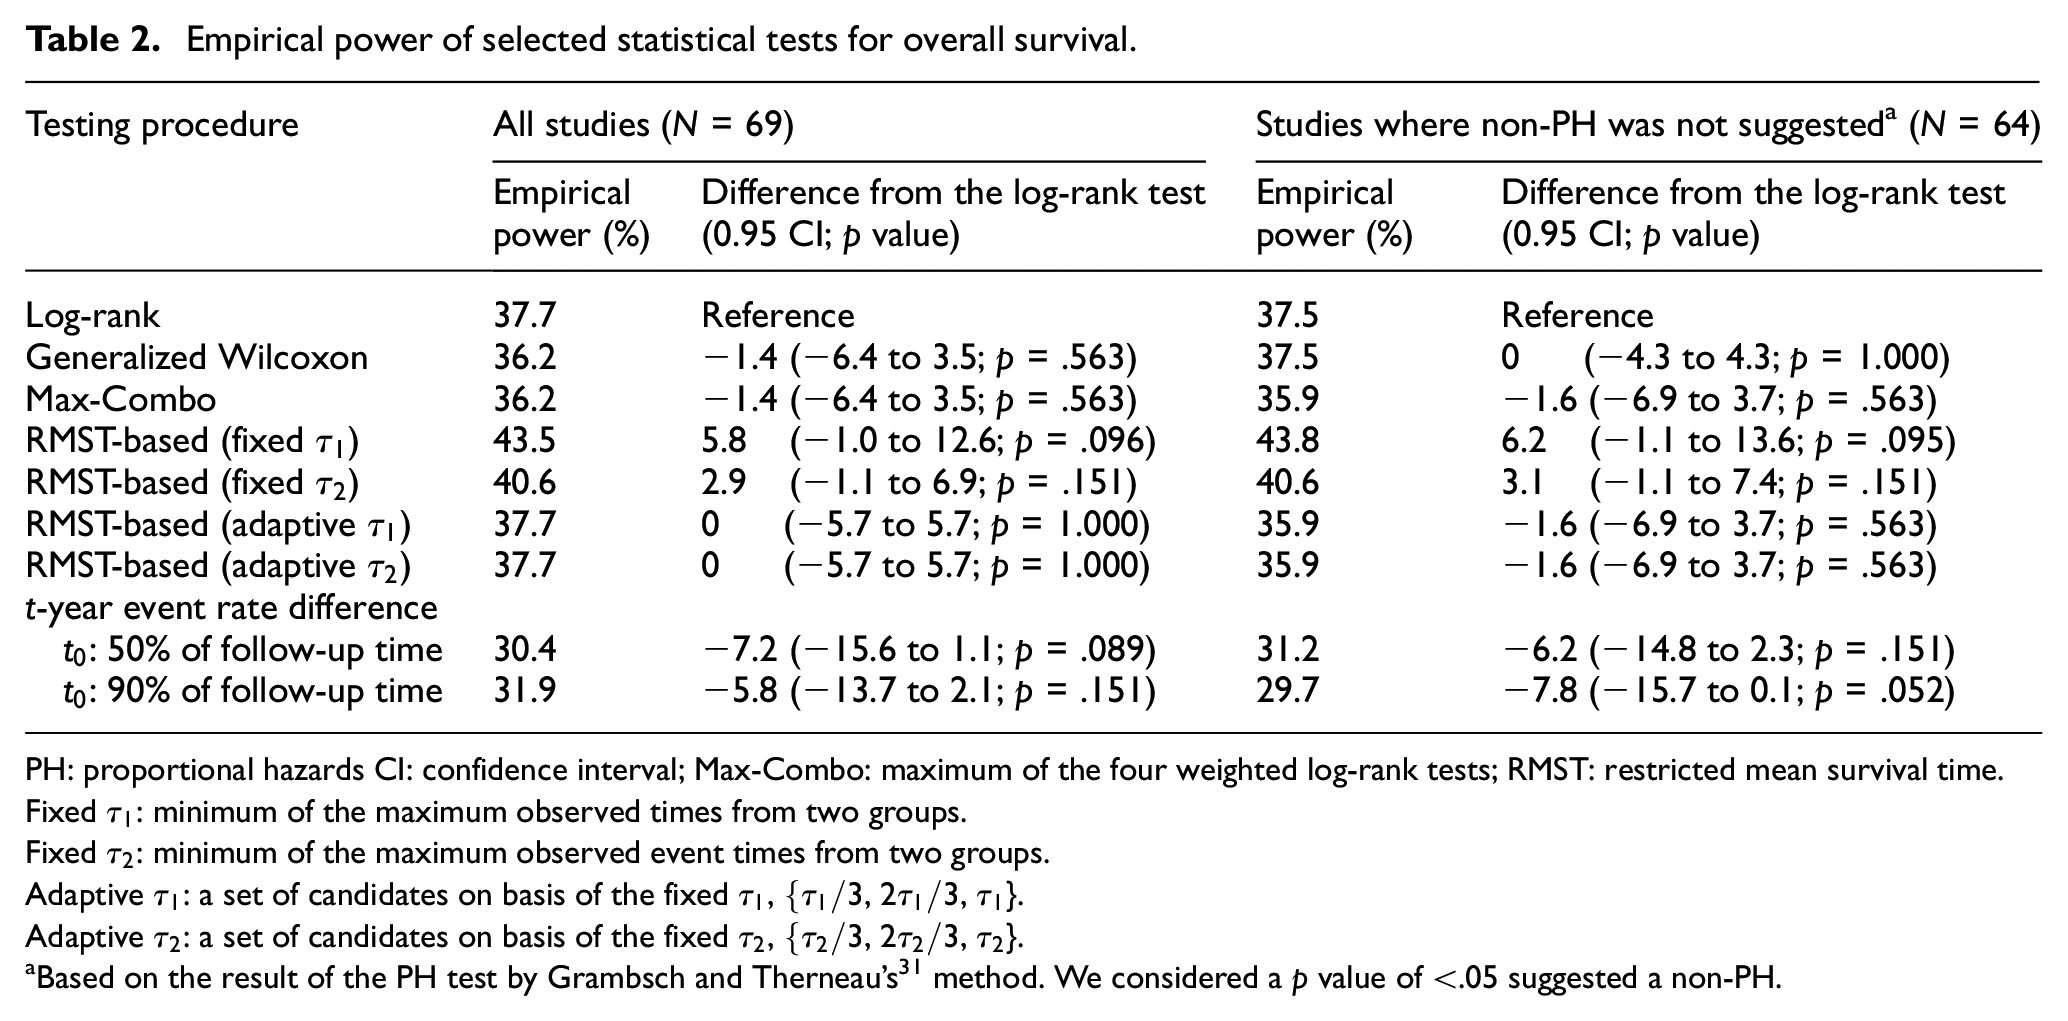
PH: proportional hazards CI: confidence interval; Max-Combo: maximum of the four weighted log-rank tests; RMST: restricted mean survival time.
Fixed
Fixed
Adaptive
Adaptive
Based on the result of the PH test by Grambsch and Therneau’s 31 method. We considered a p value of <.05 suggested a non-PH.
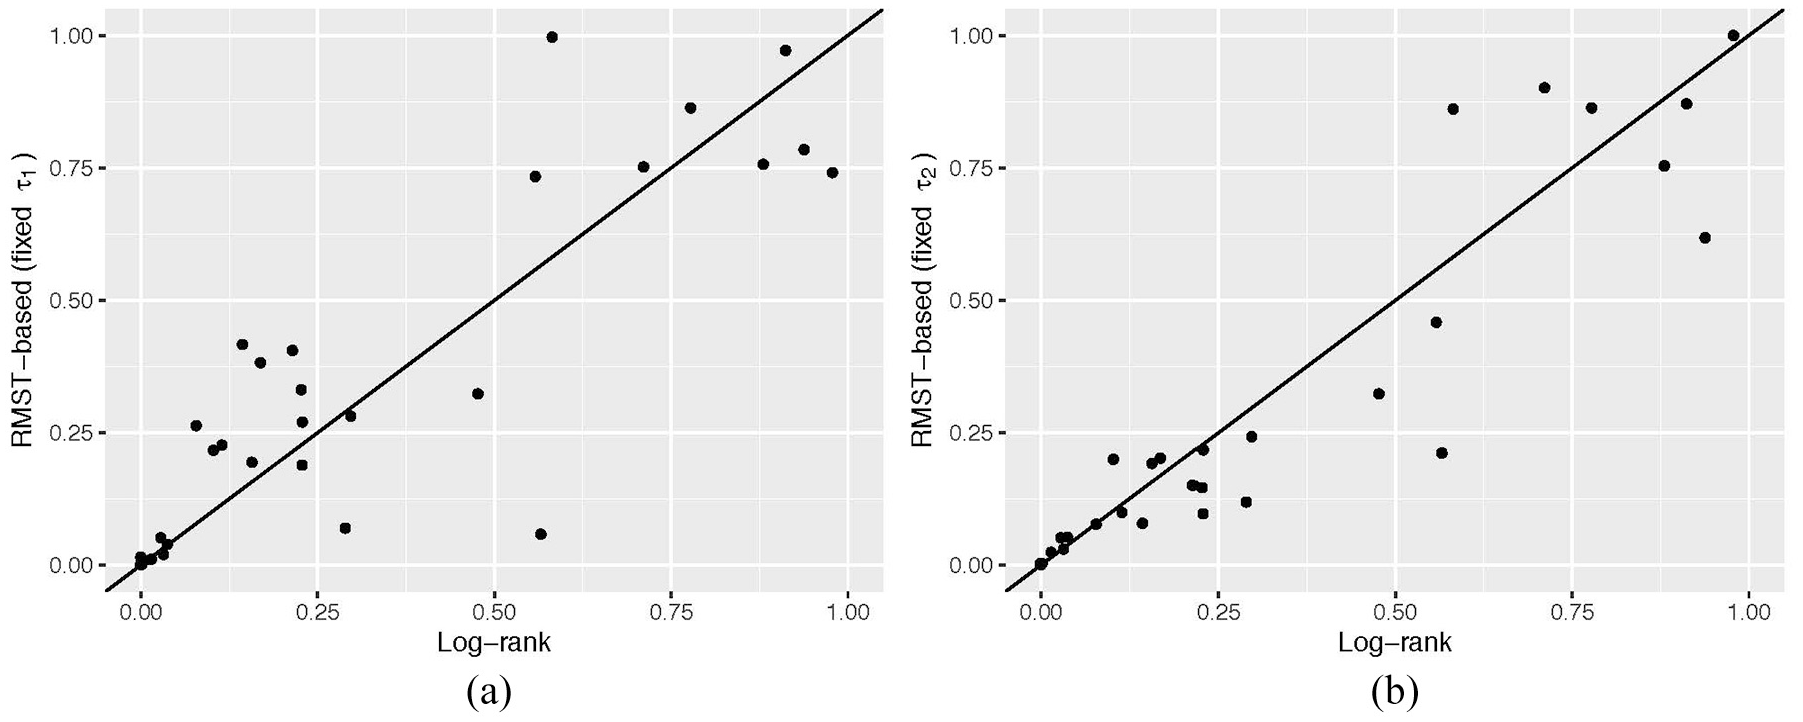
For progression-free survival, the log-rank test was used for 54 studies (Table 1). The empirical power estimates were 59.3% for the log-rank test, and 61.1% for the generalized Wilcoxon and the Max-Combo tests. They were 57.4% and 55.6% for the RMST test with a fixed
Empirical power of selected statistical tests for progression-free survival.
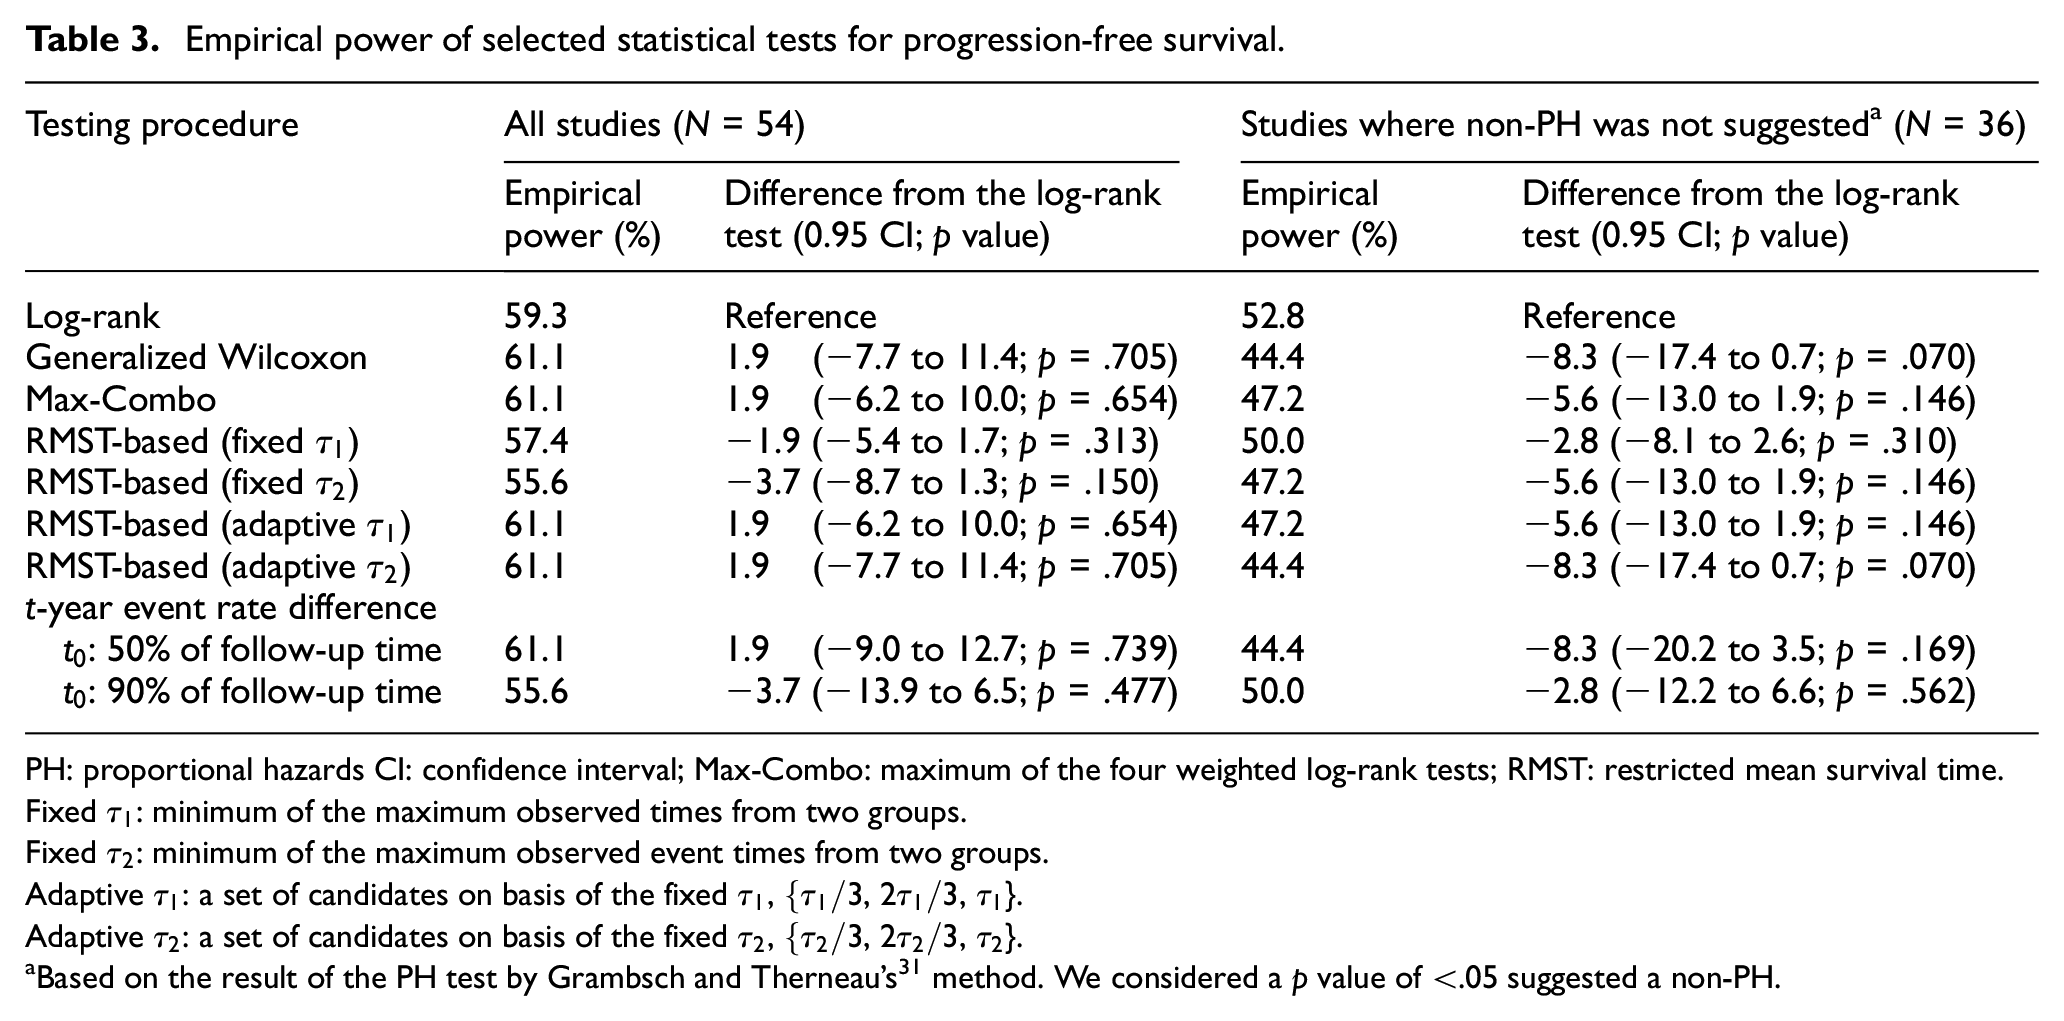
PH: proportional hazards CI: confidence interval; Max-Combo: maximum of the four weighted log-rank tests; RMST: restricted mean survival time.
Fixed
Fixed
Adaptive
Adaptive
Based on the result of the PH test by Grambsch and Therneau’s 31 method. We considered a p value of <.05 suggested a non-PH.
As a sensitivity analysis, we conducted the same analysis for each outcome, leaving only the studies where the primary endpoint corresponds to each outcome of our analysis (N = 34 for each outcome). The empirical power estimates with this subgroup of studies were generally higher (Supplementary Material S7) than our primary results (Tables 2 and 3) for both outcomes. However, we did not see notable differences among the tests in the subgroup analysis.
Discussion
While many statistical methods are available for conducting these analyses, one specific approach—log-rank/HR-based testing—has been used in almost all circumstances.
1
We gathered real-world data from 80 published cancer RCTs to compare the empirical power of nine tests from the six distinct analytic methods. We found no evidence to support the concern that using methods other than the log-rank test would result in a meaningful power loss. No statistically significant difference was seen in empirical power among the nine tests. Although the sample size of this study was relatively modest, the results of the 95% CIs for the difference in empirical power suggested that the potential power loss associated with the RMST-based test with a fixed
Demonstrating that methods other than the log-rank test offer reasonable empirical power is important. Perhaps the most notable shortcoming of using the traditional log-rank/HR method is the limited interpretability of the HR. Since the generalized Wilcoxon test and each component of the Max-Combo test are weighted versions of the log-rank test, the corresponding summary measures of those tests will be also HR-type measures. Specifically, the estimation procedures will use the partial likelihood with the weight that corresponds to the one used for the weighted log-rank test to estimate the HR.32,33 However, as we discussed in the “Introduction” section, the HR that corresponds to the weighted log-rank test will also share the same interpretation issues as the standard HR calculated from the Cox PH model or the average HR. Although each summary measure has its pros and cons, those measures based on the RMST and t-year event rate tests, which represent the difference or ratio of the tests’ respective metrics, may be more preferable to the HR-type measures in terms of providing more robust and more intuitive quantitative information about the magnitude of the treatment effect.
A potential barrier to selecting an RMST-based test at the design stage would be the need to prespecify
Given the results regarding empirical power, coupled with the interpretability of the summary measures of treatment effect, RMST-based analyses (fixed
There is one notable limitation in our study. Because we collected the studies from published papers, our results could have been affected by publication bias. Negative trials or trials suspended early may have been more likely to go unpublished. 40 However, given that the log-rank test has been routinely used for almost all trials, the direction of the bias of our analysis favors the log-rank test and suggests our results are robust.
Conclusion
Among recently published cancer RCTs, we found six methods for testing the significance of a treatment difference provided similar empirical power. While the log-rank test has been used in almost all recent cancer RCTs, our empirical analysis was not able to confirm the power superiority of this test in the past cancer trials. Alternative testing strategies appeared to offer similar empirical power in both PH and non-PH scenarios. As with all statistical methods, the log-rank test also has some disadvantages. Given these findings, factors other than only the power to detect a between-group difference should garner greater consideration when selecting statistical tests for cancer RCTs. For example, the RMST-based approach might be employed to provide a clinically interpretable summary of treatment effect, without concern for power loss if the log-rank test were not used. In summary, our results suggest that trial investigators could have more options than the log-rank/HR approach for design and analysis of cancer RCTs to accomplish the objectives of their studies.
Supplemental Material
Supplementary_Material – Supplemental material for Empirical power comparison of statistical tests in contemporary phase III randomized controlled trials with time-to-event outcomes in oncology
Supplemental material, Supplementary_Material for Empirical power comparison of statistical tests in contemporary phase III randomized controlled trials with time-to-event outcomes in oncology by Miki Horiguchi, Michael J Hassett and Hajime Uno in Clinical Trials
Footnotes
Acknowledgements
The authors greatly appreciate the insightful comments and suggestions from two referees and the editors.
Declaration of conflicting interests
The author(s) declared no potential conflicts of interest with respect to the research, authorship, and/or publication of this article.
Funding
The author(s) disclosed receipt of the following financial support for the research, authorship, and/or publication of this article: The work was partially supported by institutional funds of Dana-Farber Cancer Institute.
Supplemental material
Supplemental material for this article is available online.
References
Supplementary Material
Please find the following supplemental material available below.
For Open Access articles published under a Creative Commons License, all supplemental material carries the same license as the article it is associated with.
For non-Open Access articles published, all supplemental material carries a non-exclusive license, and permission requests for re-use of supplemental material or any part of supplemental material shall be sent directly to the copyright owner as specified in the copyright notice associated with the article.