
Abstract
Background/Aims
The quality of the evidence used to evaluate a drug’s safety and efficacy depends, in part, on how well participants adhere to the prescribed drug-taking regime. There are multiple approaches to measure adherence in clinical trials, varying in their cost and accuracy. We demonstrate a method for evaluating the cost-effectiveness of common adherence monitoring methods, considering the costs and data quality for drugs that differ in how forgiving they are of nonadherence.
Methods
We propose a simulation approach to estimate the value of evidence about adherence, considering both costs of collection and potential errors in interpreting clinical trial results. We demonstrate the approach with a simulated clinical trial of nitrendipine, a common calcium channel blocker. We consider two trial designs, one using pretrial adherence to “enrich” the trial sample and one without an enrichment strategy. We use scenarios combining high and low values of two key properties of a clinical trial: participant adherence and drug forgiveness.
Results
Under the conditions of these simulations, the most cost-effective adherence monitoring approach depends on both trial participant adherence and drug forgiveness. For example, the enrichment strategy is not cost-effective for the base scenario (high forgiveness and high adherence), but is for other scenarios. We also estimate the effects of evaluable patient analysis, a controversial procedure that excludes nonadherent participants from the analyses, after a trial is completed.
Conclusions
Our proposed approach can guide drug regulators and developers in designing efficient clinical trials and assessing the impact of nonadherence on trial results. It can identify cost-effective adherence-monitoring methods, given available knowledge about the methods, drug, and patients’ expected adherence.
Keywords
Introduction
A common problem for drug developers and regulators is patient adherence. 1 Not knowing how regularly patients take drugs complicates the interpretation of safety and effectiveness estimates in clinical trials and postlicensing use. We offer a general approach to evaluating the cost-effectiveness of methods for estimating adherence, which can be used when designing clinical trials.
Our approach can accommodate nonmodifiable factors, such as how quickly a drug acts and how sensitive it is to incomplete adherence, and modifiable factors, such as the inclusion criteria for study participants. We illustrate the approach with a simulated clinical trial of the hypertension drug nitrendipine, augmented by research on dosing behavior and drug properties.
The problem with uncertainty about adherence
Rates of reported adherence during clinical trials vary widely. One review found mean adherence levels ranging from 40% to 98%. 2 As a result, the adherence level in a trial may not be known without direct assessment. The potential importance of adherence information can be seen with Truvada, a prophylactic drug whose initial trial was stopped early because it appeared ineffective at preventing HIV transmission, whereas later trials found a relative risk reduction of 87% compared to placebo, after adjusting estimates for participant nonadherence. 3 Overestimating trial adherence can also lead to approving unduly higher doses for adherent patients, increasing side effect risks. 4
Intent-to-treat (ITT) analysis, the gold standard for evaluating effectiveness, evaluates all participants according to their assigned treatment group. To accommodate expected nonadherence, sample size is often increased. When nonadherence is unexpectedly high, the study can be underpowered, leading to a misinterpretation of drug effectiveness. One alternative approach uses enrichment strategies to increase a study’s observed effect size. 5 One such strategy excludes potential participants who are nonadherent during a pre-trial run-in period in which they receive a placebo drug, then uses ITT analysis with the remaining participants.6,7 A second alternative corrects for nonadherence statistically. For example, the controversial evaluable patient analysis, or per-protocol analysis, excludes participants who were nonadherent during the trial, as with Truvada.8–10 The US FDA sometimes allows this method as a secondary analysis, informing future trial design and anticipating real-world experience. It does not allow positive evaluable patient analysis results to compensate for null ITT results. 11
Measuring adherence
Estimating adherence in a trial requires choosing among methods that vary greatly in their cost and accuracy. The most common options are surveys, pill counts, plasma drug concentration sampling, and electronic monitoring.9,12,13 To illustrate these tradeoffs, we use two contrasting cases: participant self-report surveys (low cost, low accuracy) and biosensor-enabled electronic monitoring (high cost, high accuracy). 14 Surveys 15 are inexpensive and easy to administer. However, participants’ reports are often inaccurate, with patients typically overestimating their adherence. 16 Current and previous biosensor-enabled electronic monitoring products use sensor-embedded pills to signal when pills interact with stomach acid.17,18 These systems are highly accurate, but also expensive and burdensome for patients, compared to alternate monitoring systems.
A simulation approach
We offer an approach that predicts the costs and benefits of alternative methods for monitoring adherence. In its current form, it incorporates five potentially critical factors in trial design: (a) expected adherence; (b) modifiable factors, such as trial design; (c) trial analysis method; (d) monitoring method; and (e) nonmodifiable properties, such as a drug’s sensitivity to nonadherence, called forgiveness. Although forgiveness may be modifiable during drug design, we treat it as nonmodifiable once a trial design is set. Our approach uses simulation methods to estimate (a) the sample size needed to achieve desired statistical power; (b) outcome error rates, given a drug’s pharmacometric profile; and (c) the cost-effectiveness of these design choices.
Methods
We illustrate our model with a hypothetical 8-week phase II trial for a hypertensive drug, based on the calcium channel blocker nitrendipine, using available pharmacokinetic and pharmacodynamic research. 19 Our simulations follow Figure 1. At the top are disease and drug characteristics that can affect participant dosing behavior (adherence), drug pharmacokinetics, and pharmacodynamics.
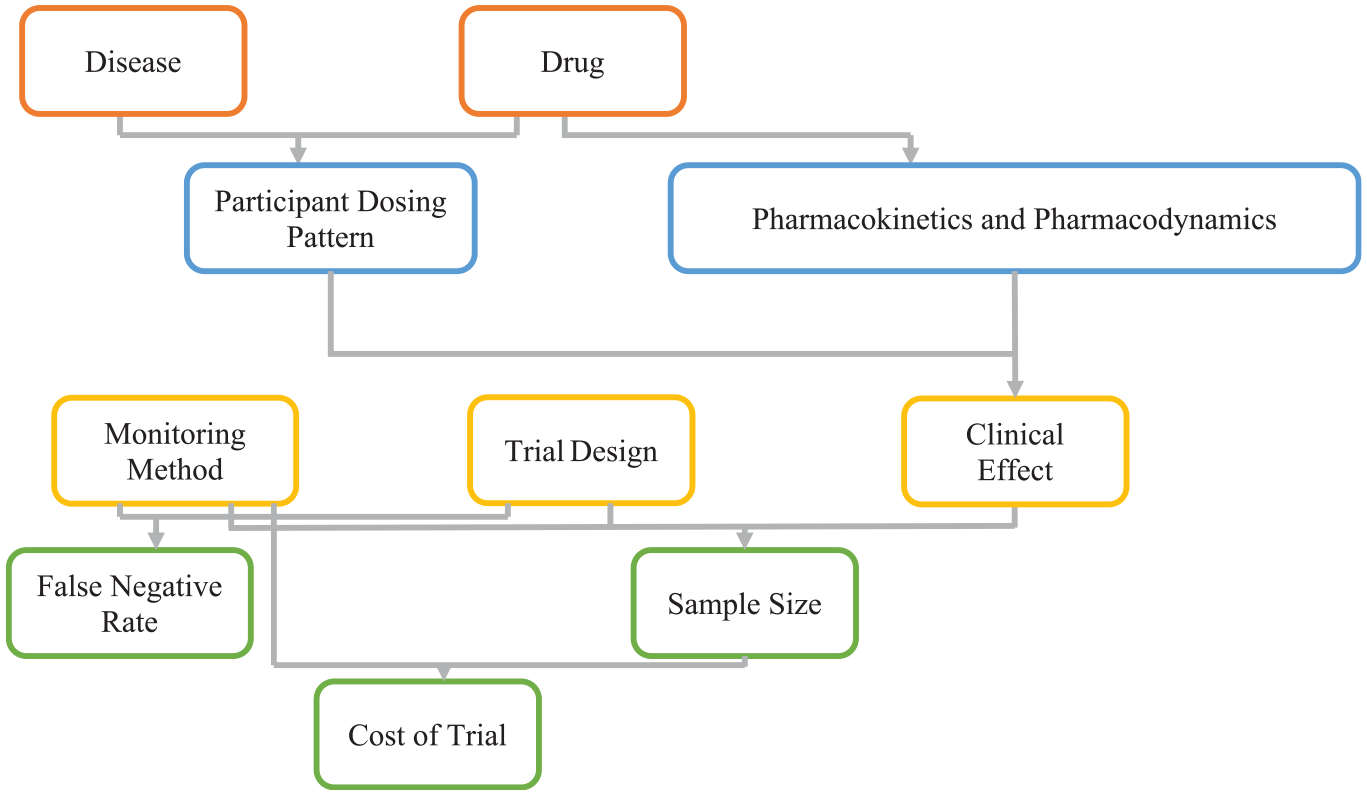
As described in the text, the clinical effect, along with the sample size, affect the statistical power of a study. The clinical effect is affected by many factors including the pharmacokinetics and pharmacodynamics of the drug, and how well the participants follow their dosing regimen. For example, people with hypertension are, on average, much more adherent than the participants in the Truvada trials cited above.3,20 This difference may reflect, in part, hypertension patients being much older. 21 It could also be that the risks of a heart attack are better understood by hypertensive patients than the risks of contracting HIV are for people exposed to HIV. Adherence may also be affected by the side effects of the drug, with patients being more willing to take drugs with fewer side effects. Different drugs also have varying pharmacokinetic patterns of absorption and retention, for example whereas nitrendipine tends to have a high clearance rate, Truvada tends to have a slow clearance rate. Similarly, they differ in terms of pharmacodynamics; for example, hypertensive drugs tend to quickly affect blood pressure, whereas Truvada takes several weeks to lower HIV-positive patients’ viral load. 22 The choice of monitoring method affects which participants are chosen for analysis, thereby affecting the clinical effect through the dosing pattern and the sample size directly. The monitoring method and sample size will affect the cost of the clinical trial.
The dosing pattern, pharmacokinetics, and pharmacodynamics jointly determine the drug’s clinical effects (e.g. change in blood pressure or stroke risk). Pharmacokinetics and pharmacodynamics also determine a drug’s forgiveness. For example, missing a dose will have less effect if a drug has a long half-life or short onset time. According to EMERGE guidelines. 23 Adherence has three phases: initiation, implementation, and persistence. We use Fellows et al.’s 20 helix-coil model of the implementation phase of adherence to simulate participant dosing patterns. We assume that all trial participants initiate treatment. 24 We did not model persistence, expecting few dropouts with this relatively short trial. We use results from Locatelli et al. 25 to model nitrendipine’s pharmacokinetics, and Shimada et al.’s 26 ion-channel binding pharmacodynamic model for the base case, reducing the drug onset rate for the low forgiveness scenario. Appendix A in the supplemental material provides detailed dosing patterns, pharmacokinetic, and pharmacodynamic modeling information.
The lower part of Figure 1 combines clinical effect, monitoring method, and trial design, to estimate the sample size needed to achieve the desired statistical power for detecting an expected treatment effect with an expected false-negative error rate. Monitoring method and sample size combine to determine trial cost. The following sections detail the modeling of these relationships. Appendix B contains pseudocode for the simulation. R code and simulated participant files have been uploaded to the Open Science Framework (https://osf.io/cqnpz).
Monitoring methods
Our approach treats participants as “adherent” if they meet a percent days covered (PDC) threshold (e.g. taking 80% of doses on time), using a range of thresholds that trial designers might choose (50%, 60%, 70%, 80%, and 90%). To calculate PDC values, we use time frames of 1 week for the run-in period and 8 weeks for the full trial. We use estimates of self-report accuracy from El Alili et al., 16 who validated them with MEMS recordings, an electronic monitoring method that records when pill bottles have been opened. 27 That study found a correlation of 0.35 between self-reports and MEMS records, with self-reports overestimating adherence by 17%. 16 We simulate these relationships by sampling from a distribution of correlated binomial random variables to obtain the probability that simulated participants correctly report being adherent or nonadherent. Because research on electronic monitoring using current biosensor-enabled technologies has found these devices to be highly accurate17,18,28 and we expect these devices to be improved in the future, we treated electronic monitoring as having perfect information about participant dosing.
Trial design and analysis
We simulate two trial designs and associated analysis methods. One design uses a run-in enrichment strategy to increase the number of adherent participants in the study sample, then performs ITT analysis on the full trial sample. The second design has no enrichment strategy, but uses evaluable patient analysis, considering only participants who pass a PDC threshold for the full trial. Following Fellows et al., 20 who found consistent dosing behavior over time, we assume the same adherence model parameters during the run-in period and full trial. We simulate an 8-week trial, the average length of phase II essential hypertension clinical trials registered on clinicaltrials.gov, 29 as estimated by a procedure described in Appendix C. Our discussion of study limitations considers the implications of these assumptions.
Enrichment strategy sample sizes and trial costs
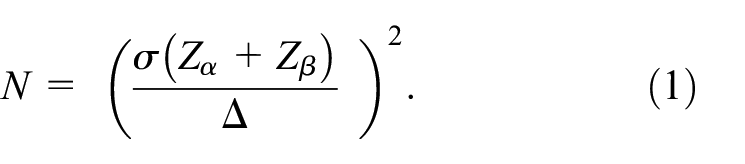
For the placebo effect size, we assume a mean and standard deviation of 5.9 and 1.1 mmHg, respectively, based on research with hypertensive patients. 30 End-of-trial treatment effects for the treatment group are based on previous studies of patient behavior and drug properties.20,25,26 The effect size (Δ) subtracts the placebo mean from the treatment mean. We use a pooled standard deviation (σ) for the effect size denominator. We allow a type I error (α) of 5%, as is standard for clinical trial power calculations. 11 Equation (1) calculates the sample size needed to achieve 80% power for each scenario. It assumes normal distributions for the underlying random variables. Sample size for the run-in equals the expected number of people needed to find N adherent participants (for a given PDC threshold).
Trial costs use estimates from previous research 31 finding that participants in a phase II hypertension trial cost about $38,000 (2019 dollars) for each year the trial is in the field. 32 An 8-week hypertension trial typically lasts about 14 months from initial recruitment through data analysis. 29 We use these costs to estimate the cost of the full trial, for the average of the run-in and trial sample sizes.
False-negative error
The false-negative error rate is how often a clinical trial fails to reject the null hypothesis appropriately. With ITT analysis (no monitoring), no participants were excluded. With evaluable patient analysis, the rates were calculated after excluding nonadherent participants (for each threshold). Because the true effect size was positive, false-positive errors were not considered.
Scenario analyses
We create four scenarios, combining high and low values of two nonmodifiable phase II trial properties: the drug’s forgiveness and participants’ adherence. Our high and low forgiveness scenarios reflect association rate constants (how quickly the drug binds to receptors) of 0.13 and 0.10. Our high and low adherence scenarios reflect probabilities of adherence being followed by adherence (in the successive dosing period) of 95% and 82%. We examine the sensitivity of estimates of trial sample size and false-negative rate to three modifiable properties of the trial: (a) whether it uses enrichment or evaluable patient analysis; (b) the PDC threshold; and (c) the adherence monitoring method: none, survey, electronic. Table 1 summarizes the values used for these modified factors. Additional sensitivity analyses appear in Appendix D.
Values of the manipulated factors used in the simulation scenarios. The run-in enrichment period was only used in conjunction with intent-to-treat analysis. Conversely, evaluable patient analysis was only studied with no run-in period. Appendix E contains sources for the base values.
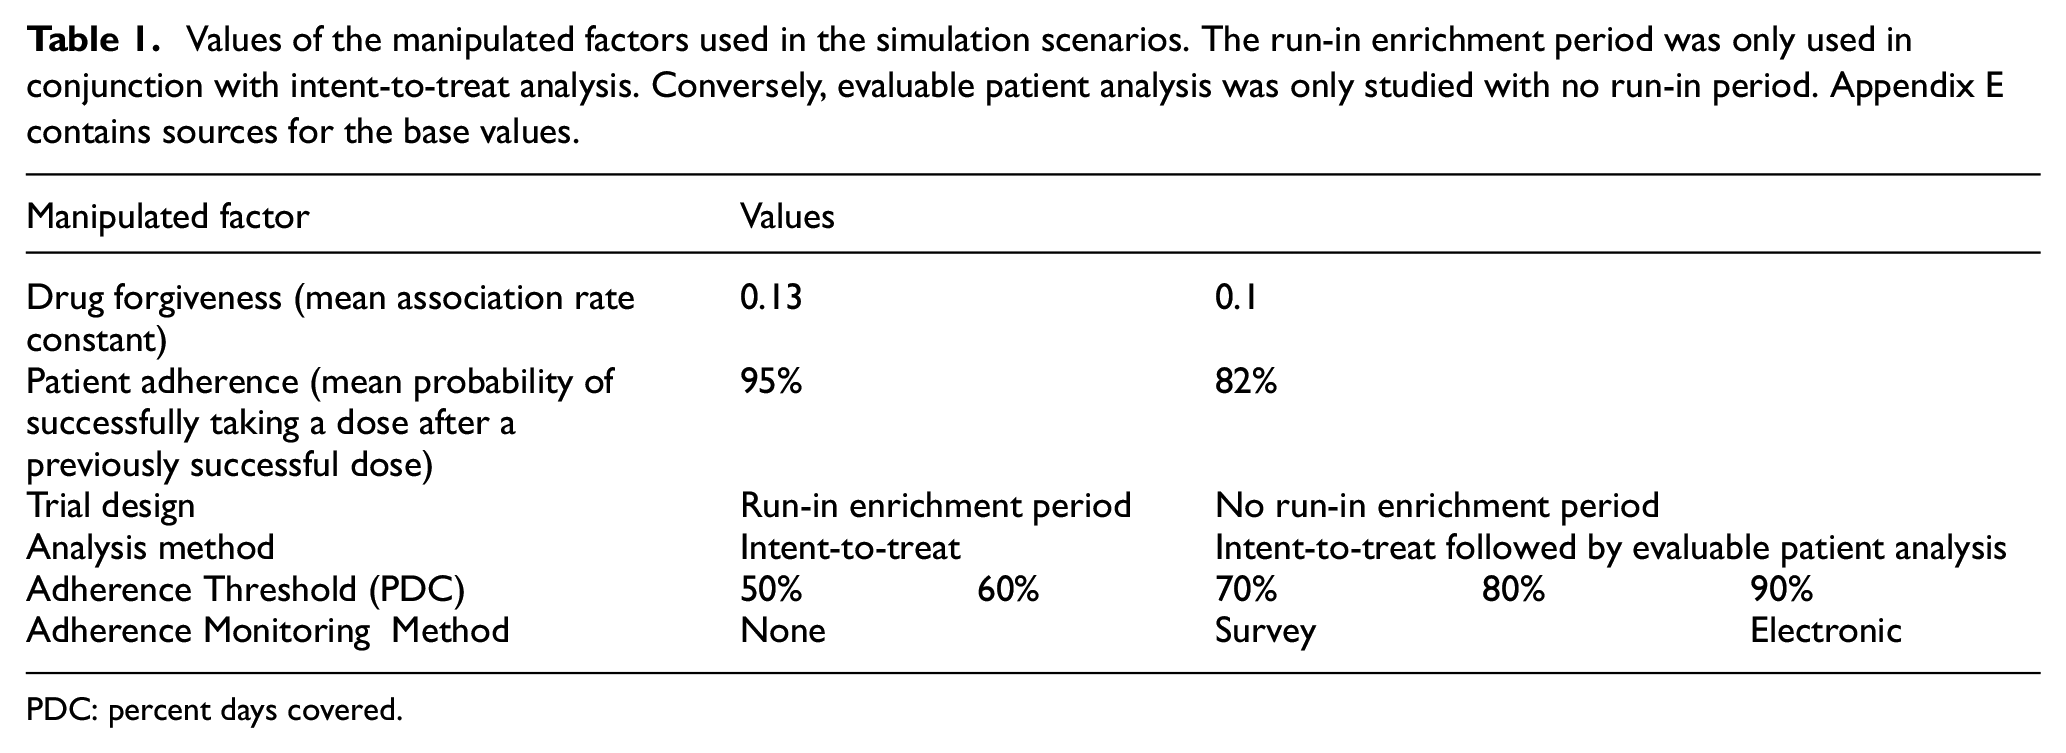
PDC: percent days covered.
Results
Trial with run-in period
Figure 2(a) and (c) displays the sample size needed to achieve 80% statistical power for each arm of a two-armed trial (drug vs placebo) of nitrendipine, with high and low adherence, respectively. Figure 2(b) and (d) shows comparable results for a hypothetical, less forgiving version of nitrendipine. High and low adherence represent average participant adherence rates of 72% and 92%, respectively. (Appendix F has the percent of participants reporting adherence correctly and incorrectly for each scenario.) Each figure shows results for a trial with no monitoring (dotted line), self-report surveys (dashed line), and electronic monitoring (solid line). With no monitoring, participants are immediately randomized to the treatment or placebo condition. With both survey and electronic monitoring, a 1-week run-in period screens participants based on their adherence to a placebo, at a PDC threshold (horizontal axis). Participants who pass that threshold are randomized to a treatment or placebo condition.
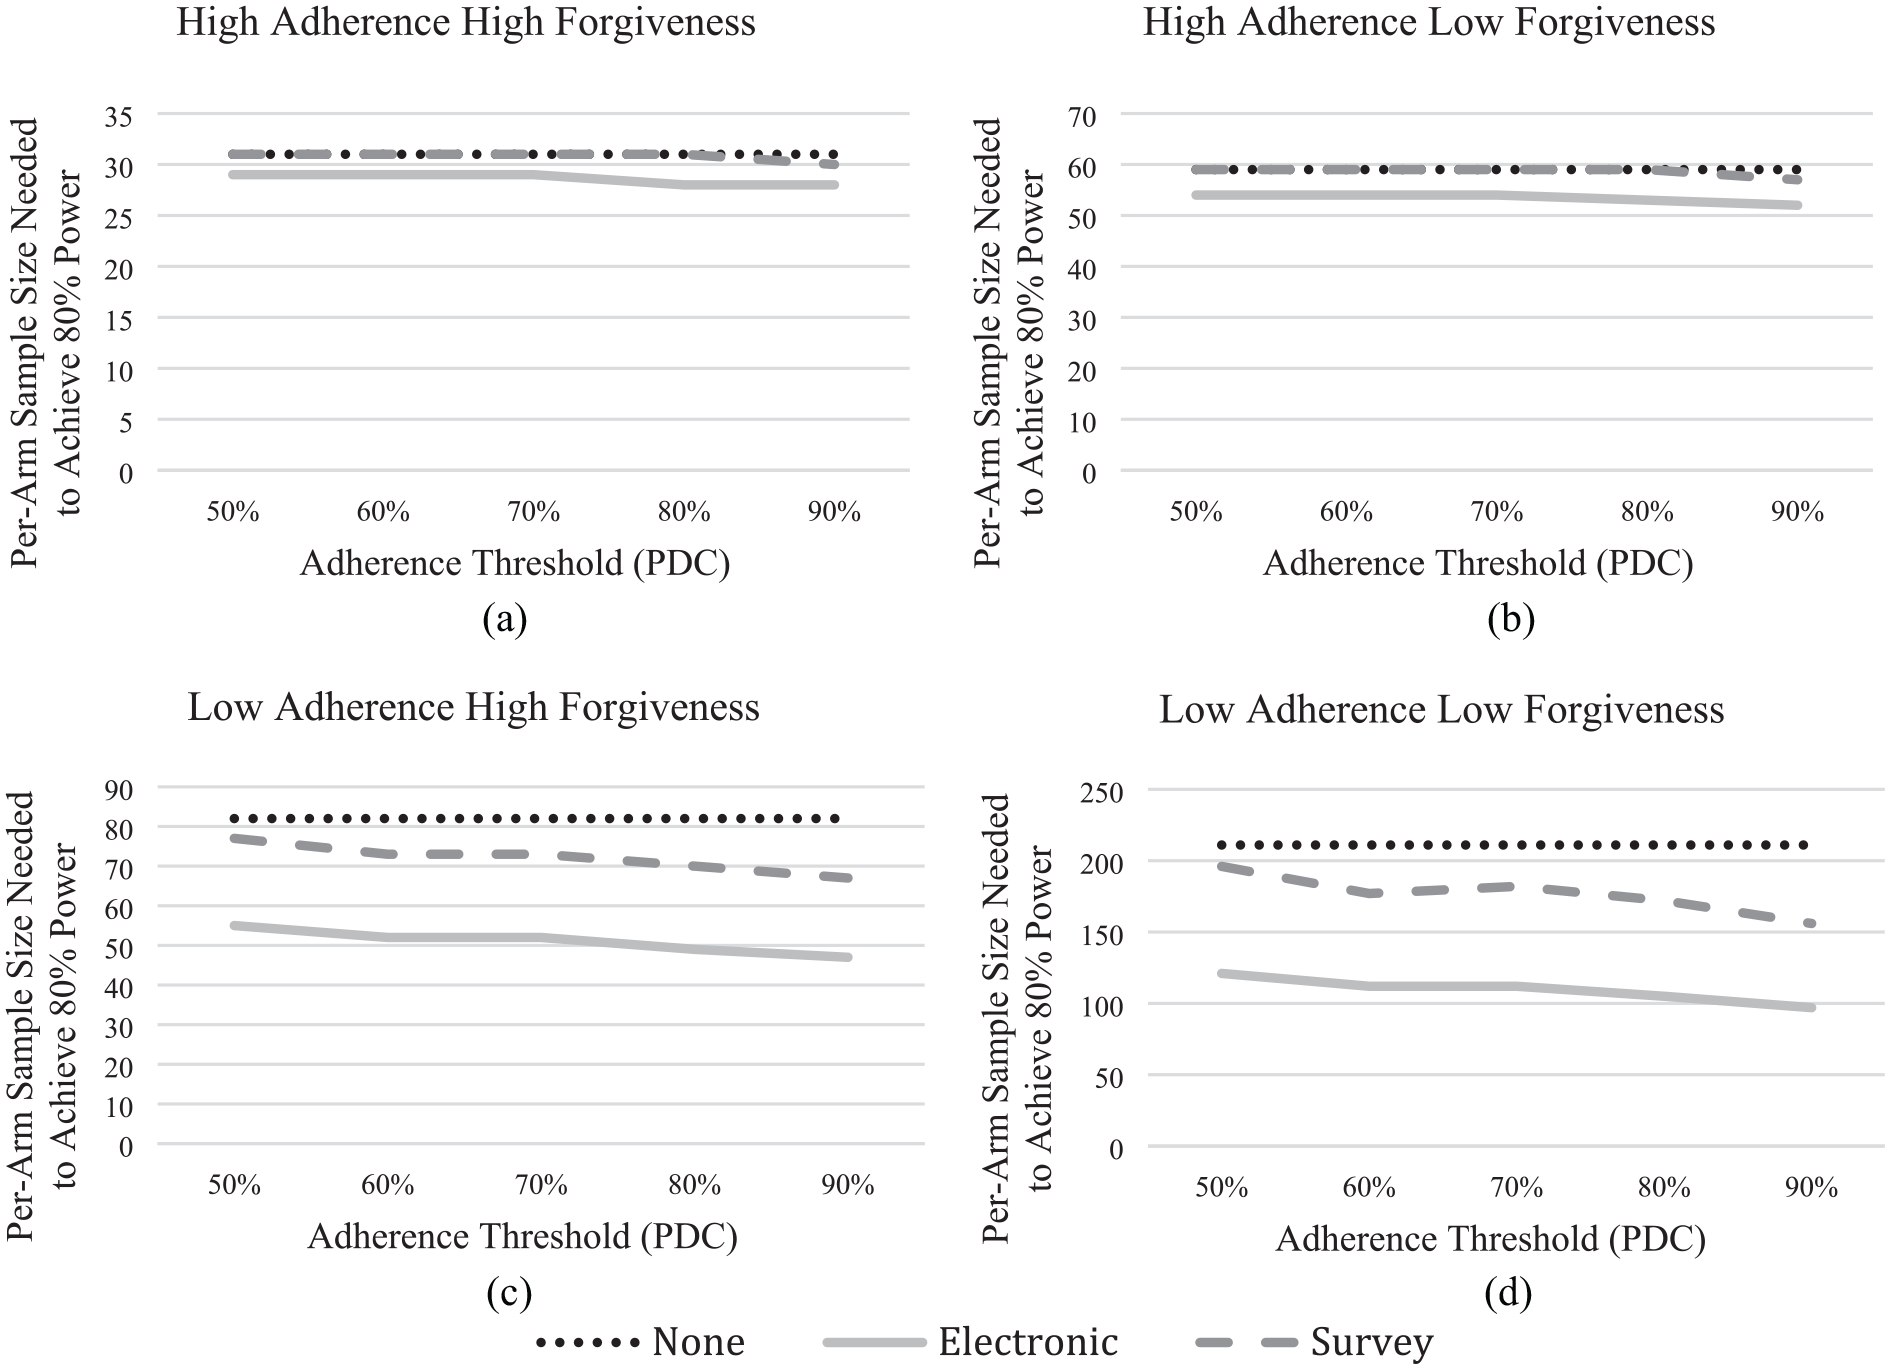
Per-arm sample size needed to achieve 80% statistical power for a clinical trial with a treatment effect of 0.8 and 0.6, for the high forgiveness and low forgiveness drugs, respectively, as a function of (i) participant adherence during the trial (where (a) and (b) correspond with the high adherence scenarios and (c) and (d) correspond with the low adherence scenarios); (ii) drug forgiveness (where (a) and (c) correspond with the high forgiveness scenarios and (b) and (d) correspond with the low forgiveness scenarios); (iii) monitoring method during the trial (none, electronic, and survey); and (iv) run-in period adherence thresholds for including participants in the trial measured in percentage of days covered which increase along the x-axis for all scenarios (PDC). Note: Because the no-monitoring trial has no run-in period PDC is not used to inform the sample size and the corresponding no monitoring line (none) is flat for all scenarios.
As would be expected, the baseline condition (high adherence, high forgiveness) requires the smallest sample. If participants generally take the drug, then the trial sends the clearest signal. If the drug is forgiving enough to retain clinical efficacy when a dose is missed, then strict adherence is less important. Under those favorable conditions the most stringent monitoring (electronic) reduces the sample size per arm by only two to three participants (e.g. from 31 to 29, for PDC = 50%). With less accurate monitoring (self-report survey), the sample size is the same as with no monitoring, except at the most stringent threshold (e.g. from 31 to 30, for PDC = 90%). Figure 2(d) shows the other extreme, low adherence, and a less forgiving drug. Here, monitoring procedures have much larger effects. With no monitoring, 211 participants are needed per arm. Self-report survey monitoring reduces the needed sample to 196 with the least stringent adherence threshold (PDC = 50%) and to 156 with the most stringent (PDC = 90%); the stricter requirement compensates for the survey’s relatively low validity. With electronic monitoring, the sample size is further reduced to 121 with PDC = 50% and 97 with PDC = 90%.
Figure 3 shows the same scenarios with an alternative measure: the number of participant-days needed to achieve 80% statistical power for the full trial and run-in period combined (where there is one). With a forgiving drug and adherent participants (Figure 3(a)), no monitoring dominates. As seen in Figure 3(d), more stringent PDC thresholds provide less benefit when measured in terms of participant-days, given the additional participants that run-in periods disqualify. Indeed, for both surveys and electronic monitoring, the curves are roughly flat across PDC thresholds. Here, electronic monitoring still has benefits, while surveys no longer do.
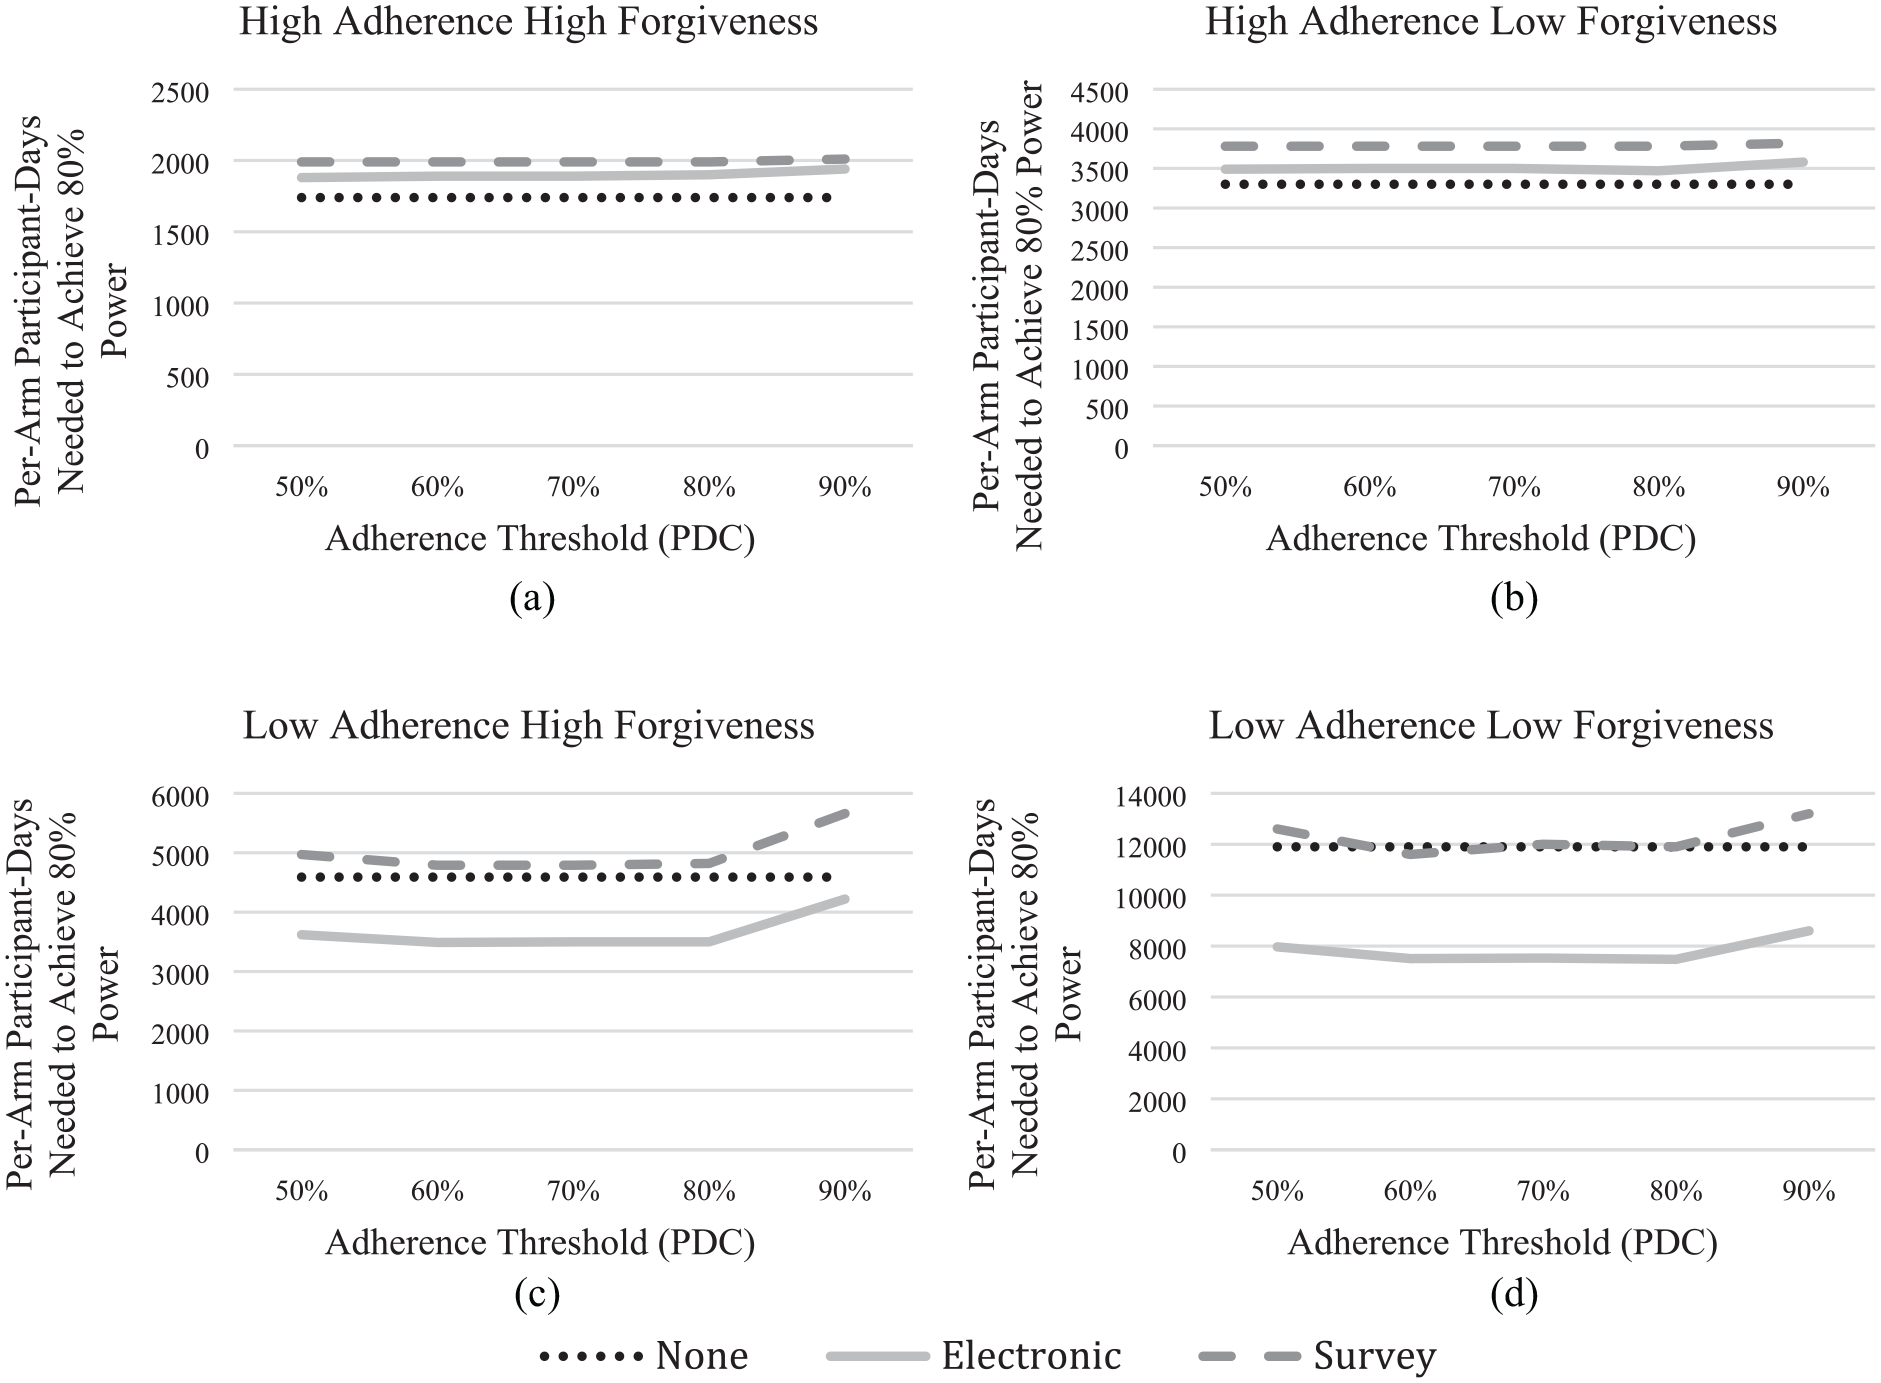
The participant-days measure combines the number of participants needed for the run-in period and the number of participants needed for the full trial. As in Figure 2, (a) and (b) correspond with the high adherence scenarios while (c) and (d) correspond with the low adherence scenarios; (a) and (c) correspond with the high forgiveness scenarios while (b) and (d) correspond with the low forgiveness scenarios. While the sample size needed for the full trial decreases as the adherence threshold increases, as shown in Figure 2, the number of participants needed for the run-in period also increases. Note: Because the no-monitoring trial has no run-in period PDC is not used to inform sample size and the corresponding no monitoring line (none) is flat for all scenarios.
As anticipated, the two intermediate treatment conditions show intermediate results. Overall, when compared to the baseline (upper left), lower forgiveness (upper right) has less effect than does lower adherence (lower left), given the high and low values used here. As with the baseline case, the enrichment strategy has little effect on either the number of participants or participant-days with high adherence-low forgiveness. Here, too, electronic monitoring weakly dominates no monitoring for participants, whereas no monitoring dominates for participant-days. With low adherence-high forgiveness (lower left), electronic monitoring dominates, requiring fewer participants and participant-days. However, the advantage is less than with the low forgiveness case and less still for participant-days with high PDC. Surveys dominate no monitoring for sample size (Figure 2(c)); no monitoring dominates surveys for participant-days (Figure 3(c)).
Cost analysis
Trial participants can incur multiple costs, including recruitment, exams, staff time, record keeping, incentives, and laboratory tests. 31 Those costs could justify expensive monitoring, if it produced commensurate savings. Figure 4 compares cost estimates for a survey and electronic monitoring, for trials with and without a run-in period. In the base case (Figure 4(a)), cost savings are greatest with a lenient threshold (PDC = 50%) and electronic monitoring, although the savings are small, $50,000. The break-even cost for using electronic monitoring is $1600 per run-in participant for this scenario. At the other extreme, with low adherence and low forgiveness (Figure 4(d)), the cost savings are greatest with a moderate threshold (PDC = 60%) and electronic monitoring. The savings are substantial for electronic monitoring, $5.0M ($28,000/participant), and surveys, $1.2 M ($7600/participant). With a more lenient threshold (PDC = 50%), cost savings are $4.9M ($28,000/participant) and $700 K ($4500/participant), respectively. In the intermediate scenarios, a run-in period with electronic monitoring is cost-effective, where 50% PDC is the optimal threshold. In contrast, with survey monitoring, the study is less costly without a run-in period. Thus, with these intermediate scenarios, whether a run-in design is cost-effective depends on monitoring the method and threshold.
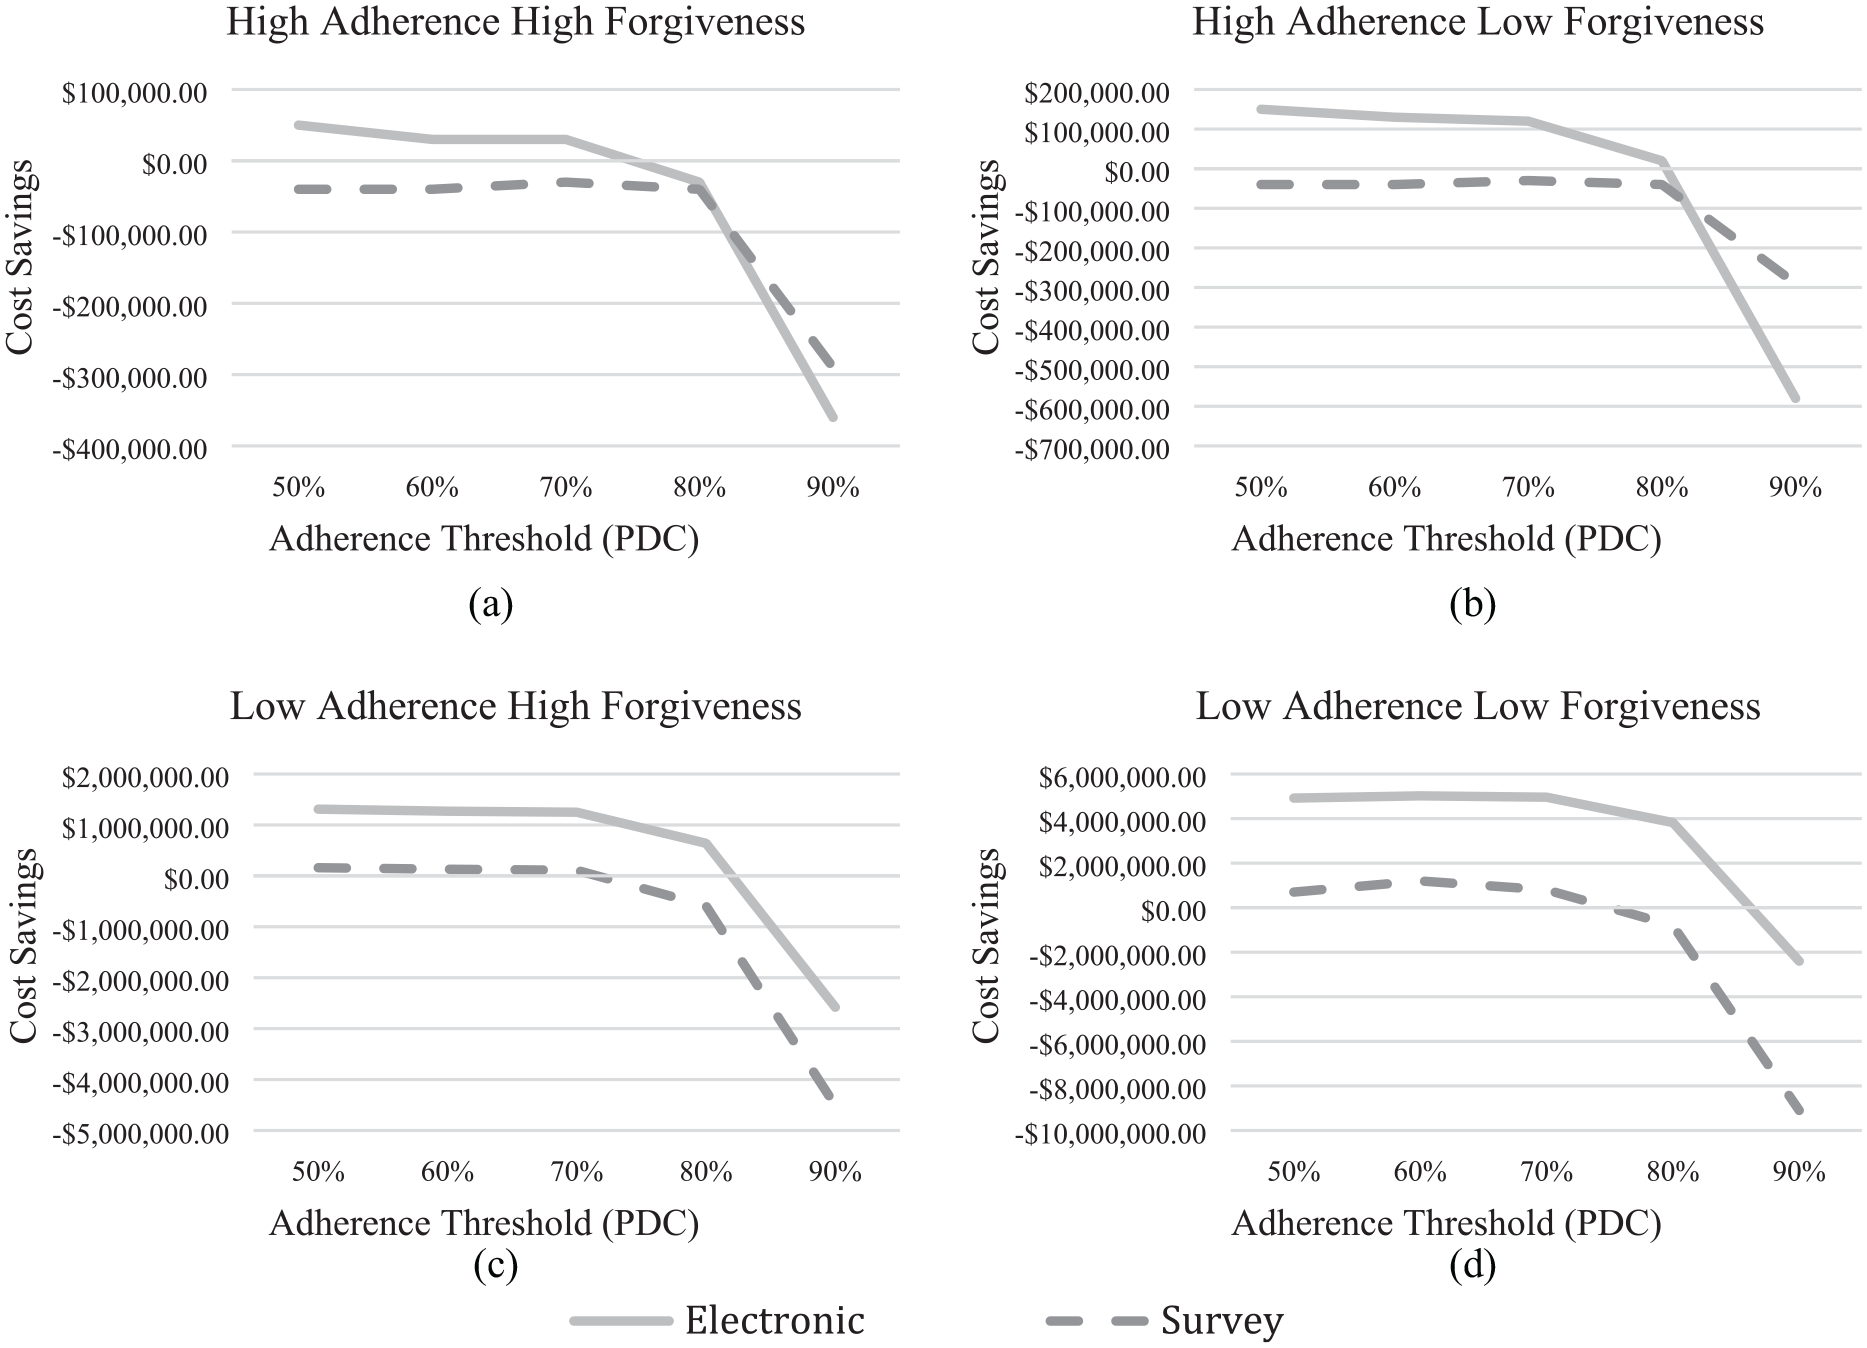
Cost savings incorporate the per participant trial costs to estimate the cost-saving benefits of using a 1-week run-in period to estimate adherence. As in Figure 2, (a) and (b) correspond with the high adherence scenarios while (c) and (d) correspond with the low adherence scenarios; (a) and (c) correspond with the high forgiveness scenarios while (b) and (d) correspond with the low forgiveness scenarios. The cost savings are most beneficial for the low adherence-low forgiveness groups, although some meager cost savings are still present for electronic monitoring at the lowest adherence threshold for the high adherence high forgiveness scenario.
Evaluable patient analysis
Evaluable patient analysis estimates trial effects, after excluding participants who fail to meet preset conditions, such as providing complete data. Here, we treat participants as evaluable if they pass specified PDC (adherence) thresholds. We ask how often trials that fail to achieve statistical significance in full-sample ITT analyses prove statistically significant when repeated with just adherent (evaluable) participants. Such cases could be considered false negatives, in the sense that using the full sample obscures treatment effects seen with adherent participants. Our analysis estimates the average effect among the adherent subpopulation.
Figure 5 shows the rate of such false negatives. These simulations used the sample size for the no monitoring condition in Figure 2 for the ITT test. With that size sample, one would expect 80% of replicated tests to reject the null hypothesis, and 20% to be false negatives. Because we defined the treatment effect for the simulations, we know that nonsignificant results reflect noisy data and not an ineffective drug. In actual trials, one would not know.
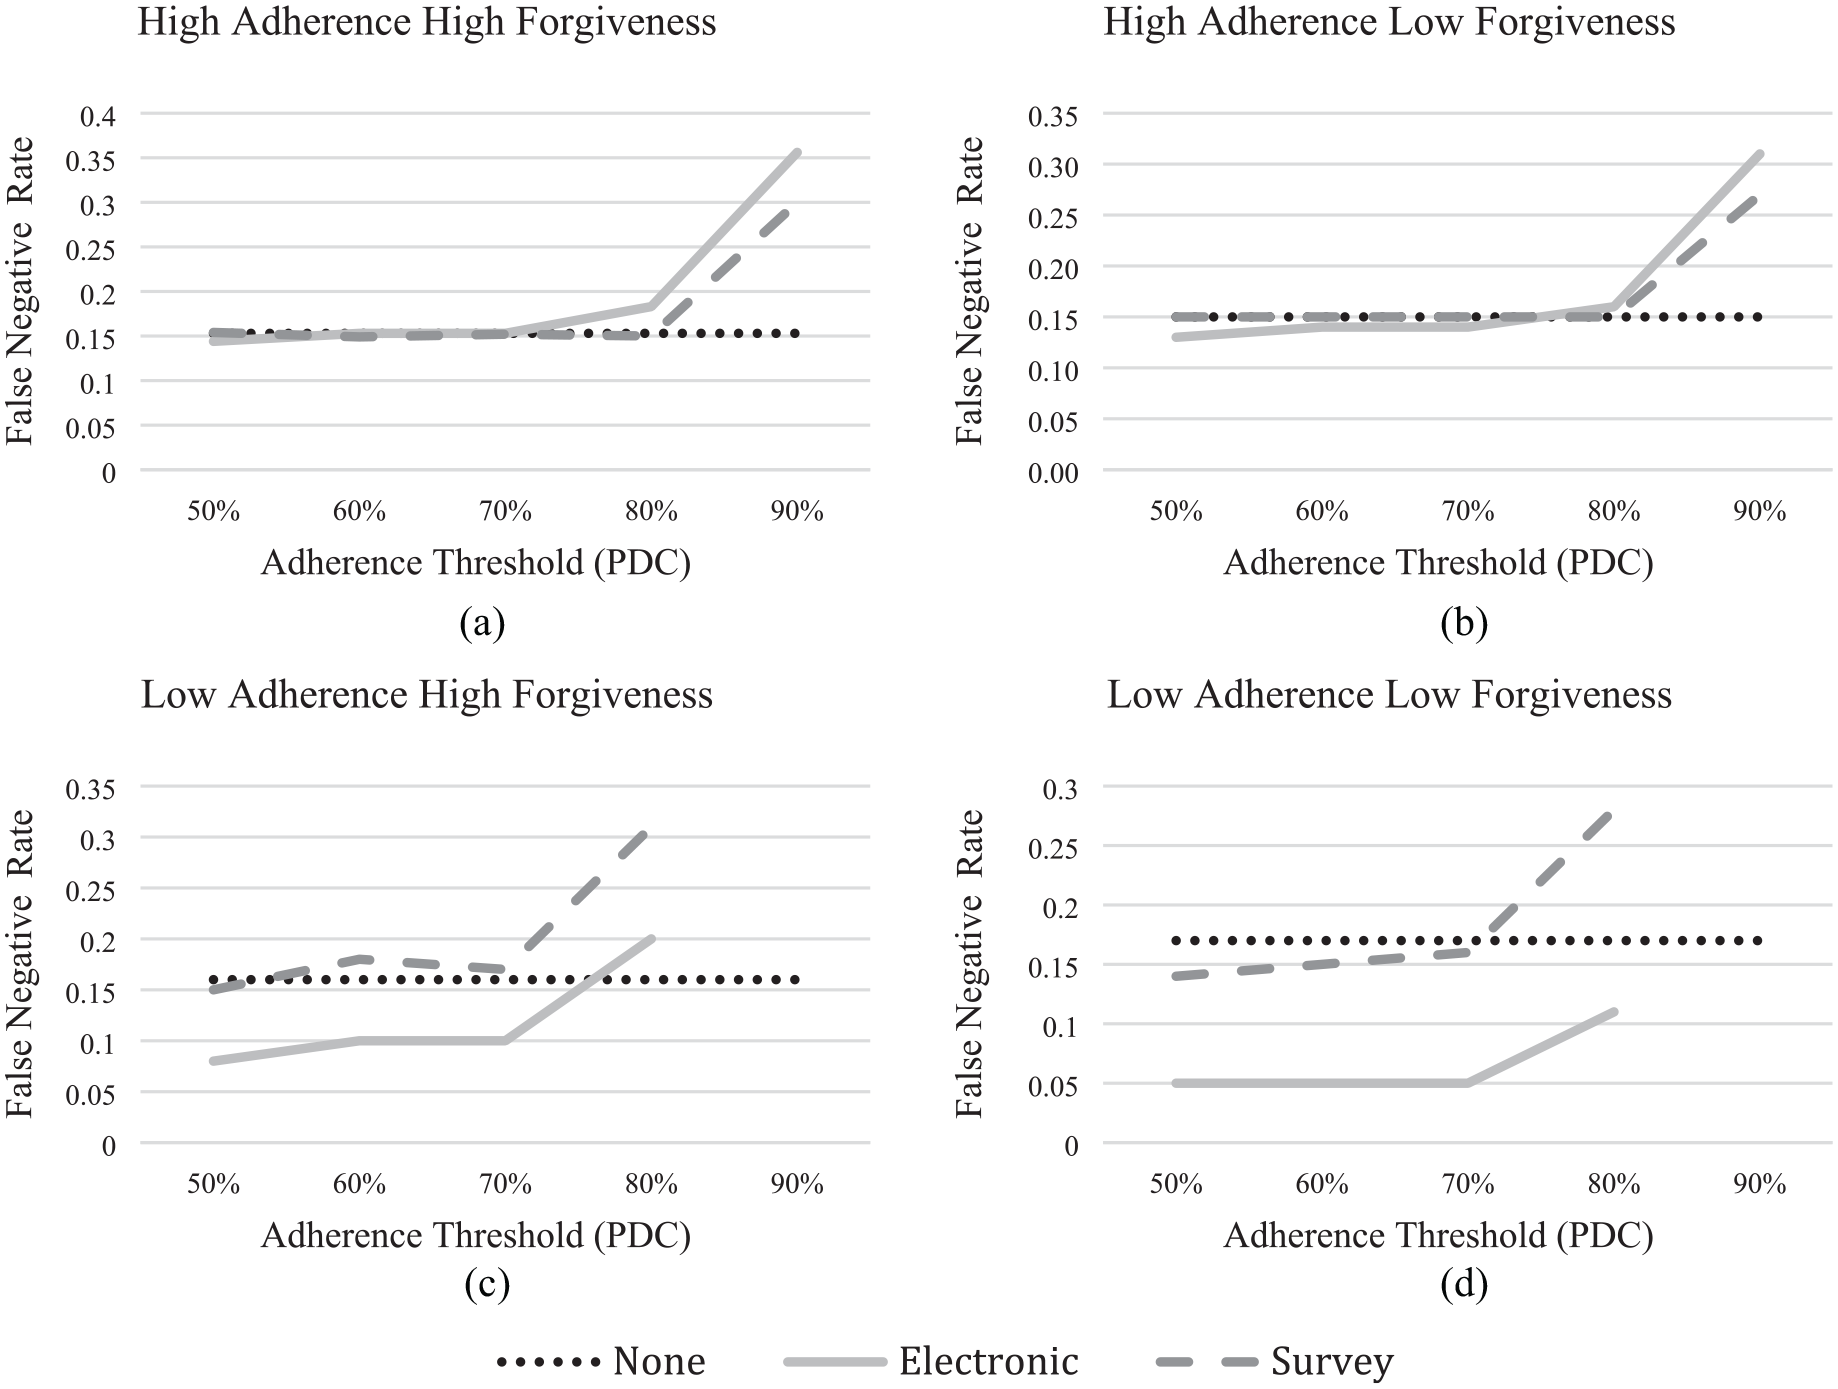
As in Figure 2, (a) and (b) correspond with the high adherence scenarios while (c) and (d) correspond with the low adherence scenarios; (a) and (c) correspond with the high forgiveness scenarios while (b) and (d) correspond with the low forgiveness scenarios. As the adherence threshold used to differentiate between adherent and nonadherent participants increases, the expected effect size among the evaluable participants increases. In turn, the number of evaluable participants decreases. Due to this trade-off, the expected false-negative rate increases as the threshold increases. To optimize the benefit of using evaluable patient analysis, the threshold with the lowest false-negative error should be used. Note: Because adherence levels are so low in the low adherence scenarios ((c) and (d)), the PDC threshold is truncated at 80%, so as not to screen too many participants.
Figure 5(a) shows the baseline high adherence-high forgiveness condition. With no monitoring, we estimate a false negative error rate of about 15%. That is below the expected value of 20%, likely due to the difference between calculated power (which assumes normality) and actual power (which does not have a closed form that considers pharmacodynamics). Using surveys to identify nonadherent participants does not reduce the error rate. Using electronic monitoring reduces it to 14%. At the other extreme, the low adherence-low forgiveness condition (Figure 5(d)), the false-negative error is about 17% with no monitoring. Survey monitoring reduces it to 14%–16%, depending on the PDC screening threshold. Given its ability to identify adherent (evaluable) participants in this low-adherence population, electronic monitoring achieves a much lower false-negative error rate, ranging from 5% to 11%, depending on the adherence threshold. In the intermediate scenarios, evaluable patient analysis is more effective at reducing the false-negative error in the low adherence-high forgiveness trial (Figure 5(c)) than in the high adherence-low forgiveness trial (Figure 5(b)). In both cases, electronic monitoring outperforms surveys in reducing false negatives, by better identifying evaluable (adherent) participants.
Discussion
We propose a general approach to assess the value of information about participants’ adherence in pharmaceutical clinical trials. An enrichment strategy can use adherence information to inform trial design, by selecting participants with better adherence in a run-in period that observes adherence to a placebo. Evaluable patient analyses use adherence information in post hoc analyses that look only at adherent trial participants. Our method estimates the value of patient-monitoring methods for those strategies. It can accommodate trial design, patient adherence, drug forgiveness, and adherence thresholds, in predicting four measures relevant to trial design: statistical power, number of participant-days needed, costs, and false-negative rate (significant treatment effects hidden by the inclusion of nonadherent participants).
We illustrate the method with a simulated clinical trial of nitrendipine, a calcium blocker for treating hypertension, using input values from the research literature. We find that, with adherent participants, a clinical trial for nitrendipine would not benefit from either an enrichment strategy or electronic monitoring (upper left in Figures 2–5). Such trials should also meet FDA’s desire for pragmatic trials, approximating real-world adherence. The benefits of less pragmatic designs, which result from decreasing the sample size by excluding nonadherent participants, increase some when the drug is less forgiving (upper right), even more when participants are less adherent, and more still with a low forgiveness-low adherence condition. The bias introduced by these less-pragmatic designs would also increase, forcing a trade-off.
These estimates quantify the tradeoffs in alternative trial designs, for drugs varying in forgiveness and patients varying in adherence. They assess the opportunities for reducing false negatives, whereby drugs fail because people are not taking them, as with Truvada. They show the return on investments in adherence-related trial design and monitoring procedures, in terms that can be contrasted with their monetary costs and deviation from realistic (pragmatic) trials. They show the sensitivity of evaluable patient analyses to trial design, informing the inferences that they can support, relative to (full sample) ITT analyses.
In addition to evaluating clinical trial designs and analyses, the method could guide plans for monitoring conditionally approved drugs, as with the US FDA’s Risk Evaluation and Mitigation Strategies. It could also be used in other domains, such as individuals’ adherence to behavioral interventions or power plants’ adherence to air pollution controls. Each application would need estimates of model inputs.
Future work and limitations
Like all simulations, ours makes assumptions about model parameters. We were fortunate to be able to draw on research regarding drug pharmacometrics, participant adherence, and monitoring method accuracy, in setting the ranges for our sensitivity analyses. The accuracy of model predictions depends on the strength of those inputs. In this example, the pharmacometric models, based on small samples, may be particularly uncertain.
One assumption in our simulation was equivalent adherence parameters in the run-in period and the full trial. In an actual trial, run-in period adherence might be lower because participants did not experience the drug’s benefits or higher because they did not experience its side effects. Adherence might also depend on a trial’s informed consent procedures. For regulated trials with minimal risk, FDA can allow a waiver of initial informed consent, if appropriate and fuller information is provided after participation. 33 That could allow giving the placebo to trial participants without disclosing the implications of their adherence for participation in the full trial. Such procedures raise practical questions, regarding how well run-in period adherence predicts trial adherence, and ethical ones, regarding the appropriateness of limiting disclosure.34,35 In terms of the simulation results, higher adherence during the run-in period would decrease the value of that form of enrichment in all scenarios. Future analyses could consider these factors, as well as adding the effects of drop-outs during the trial to the model.
We compared two monitoring methods, surveys and biosensor-enabled electronic monitoring, bracketing the ranges of cost and effectiveness, as a proof of concept for an integrated approach to designing cost-effective clinical trials. Future analyses could consider other common monitoring methods, such as pill counts, electronic detection of package entry, and blood sampling, which we would expect to perform similarly to the electronic monitoring method for thresholds that are not time-dependent. We used PDC as the threshold for identifying adherent participants. The model could also be extended to consider thresholds determined by dosing time. While we used a placebo-controlled trial, the model could also accommodate positive-controlled trials, using the pharmacometric models for two drugs.
As with all research, the ethical aspects of these trial designs and analysis methods bear scrutiny, along with their practical implications. Evaluable patient analysis has been criticized for the bias that results from imperfect randomization.36,37 An empirical study found that run-in designs disproportionately exclude participants who are less educated and identify as Black, leading to selection bias. 38 Future research could extend the methodology to other enrichment strategies, such as using incentives to increase adherence.
Such analyses can inform, but not make trial design and regulatory decisions. Someone must still decide which interventions justify the costs. Someone must also decide whether the benefit from methods that increase participants’ adherence in clinical trials compensates for making trials less pragmatic and more biased, by selecting populations less representative of eventual users.
Supplemental Material
sj-docx-1-ctj-10.1177_17407745221084127 – Supplemental material for The value of adherence information during clinical pharmaceutical trials
Supplemental material, sj-docx-1-ctj-10.1177_17407745221084127 for The value of adherence information during clinical pharmaceutical trials by Emily N Grayek, Baruch Fischhoff, Alexander L Davis and Tamar Krishnamurti in Clinical Trials
Footnotes
Acknowledgements
We thank Joel Greenhouse, PhD, and Clara Heering for input on how adherence information is used during clinical trials, and Sara Eggers, PhD, for input on how the FDA treats adherence information. The views expressed are those of the authors.
Declaration of conflicting interests
The author(s) declared no potential conflicts of interest with respect to the research, authorship, and/or publication of this article.
Funding
The author(s) disclosed receipt of the following financial support for the research, authorship, and/or publication of this article: Funding was provided by a CIT Deans Fellowship, the Department of Engineering and Public Policy, and Dartmouth Medical School, and the Richard King Mellon Foundation.
Supplemental material
Supplemental material for this article is available online.
References
Supplementary Material
Please find the following supplemental material available below.
For Open Access articles published under a Creative Commons License, all supplemental material carries the same license as the article it is associated with.
For non-Open Access articles published, all supplemental material carries a non-exclusive license, and permission requests for re-use of supplemental material or any part of supplemental material shall be sent directly to the copyright owner as specified in the copyright notice associated with the article.