
Abstract
Targeted agents and immunotherapies have revolutionized cancer treatment, offering promising options for various cancer types. Unlike traditional therapies the principle of “more is better” is not always applicable to these new therapies due to their unique biomedical mechanisms. As a result, various phase I–II clinical trial designs have been proposed to identify the optimal biological dose that maximizes the therapeutic effect of targeted therapies and immunotherapies by jointly monitoring both efficacy and toxicity outcomes. This review article examines several innovative phase I–II clinical trial designs that utilize accumulated efficacy and toxicity outcomes to adaptively determine doses for subsequent patients and identify the optimal biological dose, maximizing the overall therapeutic effect. Specifically, we highlight three categories of phase I–II designs: efficacy-driven, utility-based, and designs incorporating multiple efficacy endpoints. For each design, we review the dose–outcome model, the definition of the optimal biological dose, the dose-finding algorithm, and the software for trial implementation. To illustrate the concepts, we also present two real phase I–II trial examples utilizing the EffTox and ISO designs. Finally, we provide a classification tree to summarize the designs discussed in this article.
Introduction
Targeted therapy is a type of cancer treatment that specifically targets and attacks cancer cells while minimizing damage to normal tissues. It is based on the idea that cancer cells have specific characteristics or genetic mutations that make them vulnerable to certain types of treatment, while normal tissues do not. Targeting these unique features of cancer cells can be more effective and cause fewer side effects than traditional chemotherapy and radiation therapy. Several targeted agents exist, such as monoclonal antibodies, small molecule inhibitors, and hormone therapies.1,2 Immunotherapy is a cancer treatment that uses the patient’s immune system to fight cancer. It stimulates or enhances the immune system’s ability to recognize and attack cancer cells. Several types of immunotherapies exist, including checkpoint inhibitors, chimeric antigen receptor (CAR) T-cell therapy, and cancer vaccines.3–6 Targeted therapy and immunotherapy revolutionize how physicians treat cancer and have been used to treat many types of cancer, including breast, lung, colorectal, melanoma, lung, kidney, and other types of cancer.7,8
In phase I dose-finding trials for cytotoxic agents such as chemotherapy and radiotherapy, the primary goal is to determine the highest safe dose of a new drug that can be given to patients without causing unacceptable toxicity, referred to as the maximum tolerated dose. The underlying mechanism is that higher doses of the drug can be more effective in treating cancer, but there is also a greater risk of toxicity. However, because of their specific biomedical mechanisms, the “more is better” principle often does not hold for targeted therapy and immunotherapy. Increasing the dose of these agents beyond the optimal therapeutic range may fail to improve treatment outcomes and increase the risk of toxicity. Hence, the goal of dose-finding trials for targeted agents and immunotherapies is to identify the optimal biological dose (OBD) that yields the best therapeutical effect by considering the toxicity and efficacy outcomes jointly. In Figure 1, we provide an illustrative example of the difference between the maximum tolerated and OBDs. The dose-limiting toxicity rate monotonically increases with the doses, and dose 3 is the maximum tolerated dose with the highest acceptable toxicity rate of 0.25. However, the dose–efficacy curve is plateaued, and doses 2 and 3 yield the same objective response rate of 0.5. Although doses 2 and 3 are safe, dose 2 has a much lower toxicity rate than dose 3. Therefore, dose 2 should be the OBD by jointly considering the toxicity and efficacy outcomes. Since toxicity and efficacy outcomes are involved in a single dose-finding design to find the OBD for targeted agents and immunotherapies, it is typically referred to as the phase I–II design.
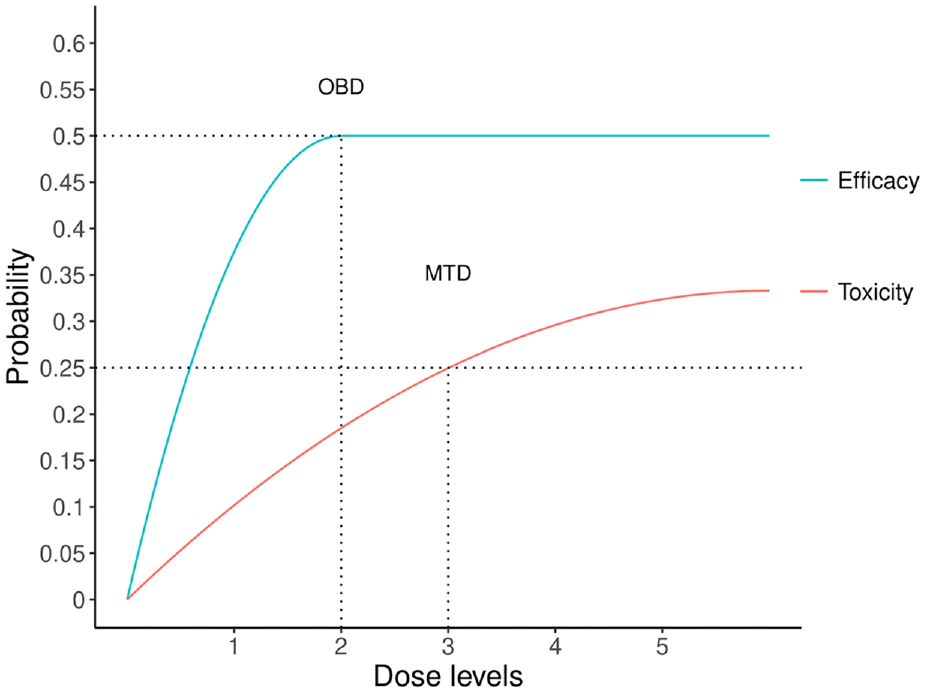
An illustrative example for maximum tolerated dose (MTD) and optimal biological dose (OBD).
A phase I–II design includes several essential elements such as primary toxicity and efficacy endpoints for dose-finding, a risk–benefit trade-off criterion to define the OBD, a statistical model to characterize dose–toxicity and dose–efficacy relationships, and adaptive decision rules for dose escalation/de-escalation. Figure 2 provides a general diagram for conducting a dose-finding clinical trial using the phase I–II designs. Numerous publications on phase I–II designs for targeted agents and immunotherapies are available in the literature.9–12 These innovative designs have gained popularity among the pharmaceutical industry and regulatory agencies due to their potential benefits in identifying the true optimal dose. As evidence, various organizations have created innovative design working groups, which have suggested techniques, approaches, and implementation policies to be evaluated by regulatory agencies. Among these groups are the Biopharmaceutical Division of the American Statistical Association, the Pharmaceutical Research and Manufacturers of America, the Biotechnology Industry Organization, and the Drug Information Association. The Food and Drug Administration (FDA) has also provided guidance to sponsors and applicants on interacting with the FDA on complex, innovative drug development trial design proposals, including phase I–II designs. 13
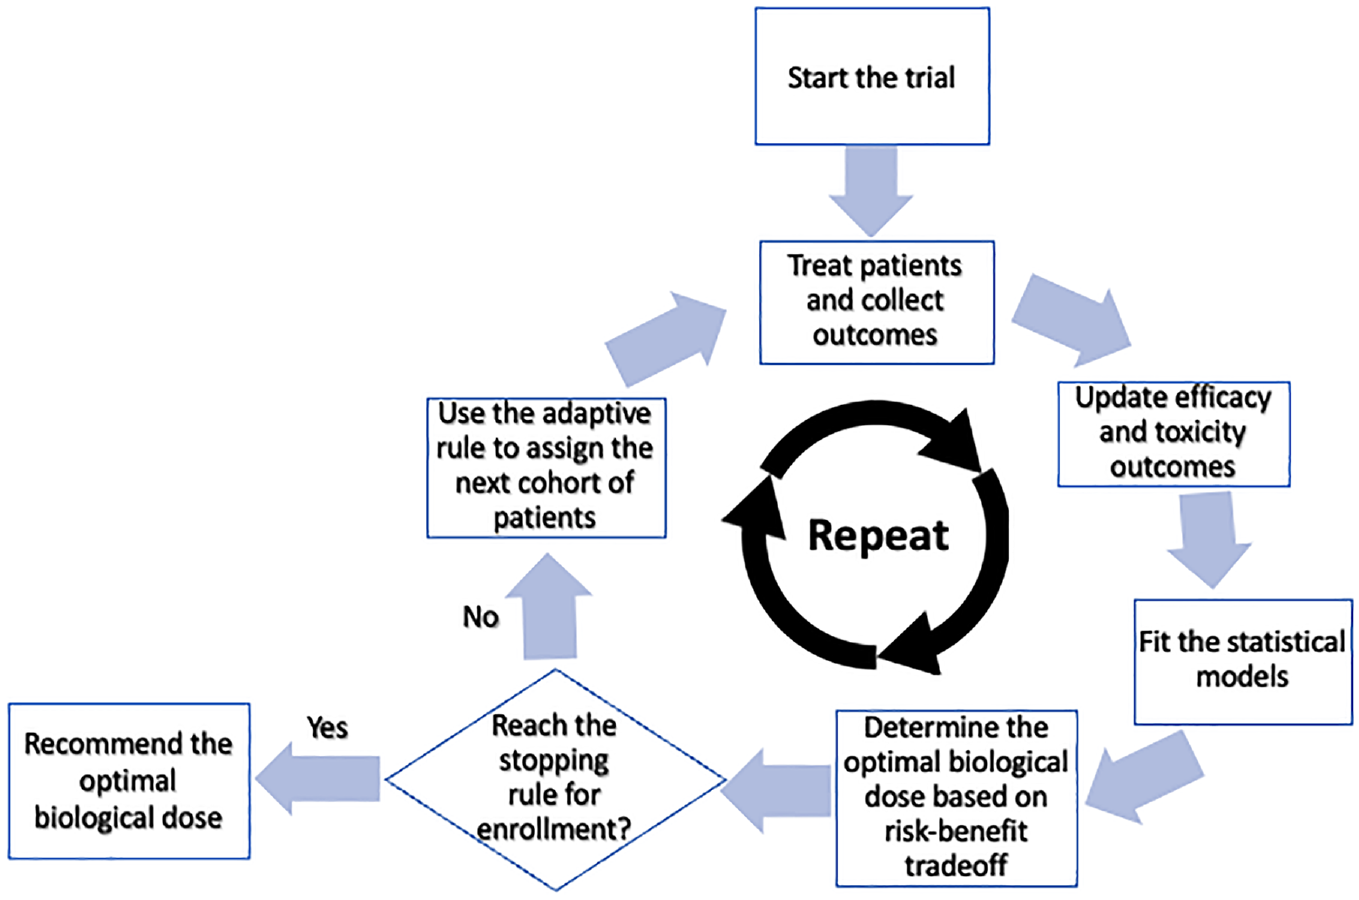
Diagram of the phase I–II design.
Moreover, considering the emergence of targeted therapies and immunotherapies that require tailored dose-finding designs, the FDA has recently launched “Project Optimus” to re-evaluate the dose optimization and selection approach used in developing oncology drugs. 14 Given the significance of this research and the potential impact it can have in the field of clinical medicine, in what follows, we review the dose–outcome model, the definition of the OBD, the dose-finding algorithm, and the software development for several innovative phase I–II clinical trial designs. We also provide real trial examples using phase I–II designs discussed in this article. Finally, we conclude this article with a brief discussion.
Efficacy-driven designs
If identifying the OBD is to attain the highest possible efficacy while ensuring patient safety, efficacy-driven designs should be employed. One such design is the ISO design proposed by Zang et al. 15 The ISO design is developed based on the observation that the dose–efficacy curves for targeted agents and immunotherapies are typically unimodal or plateau within the therapeutic dose range. Thus, identifying the OBD can be transformed into locating the inflection point of the dose–response curve (e.g. the OBD in the dose–efficacy curve of Figure 1). The model selection method is used under the ISO design to determine the location of the inflection point. The idea is that although the underlying true location is unknown, the number of possible locations is limited because only a few doses can be considered in a dose-finding trial. For example, assuming a total of five doses of a new agent is under investigation in a trial, we can specify at most five statistical models representing different locations of the inflection point. Specifically, model 1–5 indicates that dose 1–5 is the true OBD, respectively. The efficacy rates are then repeatedly estimated under each model. Finally, among multiple sets of efficacy rate estimates, the best set is selected by optimizing a statistical goodness-of-fit objective function.
While the ISO design is primarily efficacy-driven, monitoring toxicity during the dose-finding process is crucial to ensure patient safety. This is done by calculating a posterior probability of toxicity at each dose based on the observed toxicity data, which measures the chance that the toxicity rate is unacceptably high. Then, during each interim analysis, any dose with a posterior probability higher than a cut-off value (e.g. 0.9) will be claimed as excessively toxic and excluded from further consideration. The first step in the dose-finding procedure is to monitor the toxicity outcomes and exclude the overly toxic doses. The second step is calculating the best efficacy rate estimates using the model selection method. The OBD is identified as the dose with the highest efficacy rate while still safeguarding patients. Where there are ties, the lowest dose among the ties is selected. The dose decision for the next cohort of patients is then made by comparing the location of the current dose with the identified OBD. Once the maximum sample size is reached, the latest identified OBD using all accumulated toxicity and efficacy outcomes is selected. A freely available R Shiny App to implement the ISO design is available at https://trialdesign.org/one-page-shell.html#MTADF.
The ISO design is applicable for unimodal and plateaued dose–response curves, but the latter is often more clinically relevant in practice. The mISO design is advantageous when the underlying dose–efficacy curve can be specified as plateaued. 16 The idea is that doses within the plateau have nearly the same efficacy rate, allowing us to combine efficacy outcomes across these doses. This combination transforms the plateaued dose–response curve into a monotonically increasing curve, making it amenable to the conventional phase I dose-finding designs. However, the lowest dose within the plateau is unknown. Like the ISO design, the mISO design addresses this issue using the model selection method based on the Akaike information criterion (AIC). In addition, unlike the ISO design, which only excludes excessively toxic doses, the mISO design excludes any doses with unacceptable toxicity or efficacy profiles from further consideration. Suppose all the doses are found unacceptable during any interim analysis time. In that case, the whole trial is early terminated, and no dose should be selected as the OBD. Simulation studies have shown that the mISO design performs better than the ISO design when the underlying dose–response curve is plateaued. A computer software package for implementing the mISO design is available at https://github.com/yongzang2020/mISO.
Utility-based designs
Unlike efficacy-driven designs, utility-based designs consider efficacy and toxicity outcomes as co-primary endpoints and use utility functions to assess the risk–benefit trade-off. The OBD is then defined as optimizing the utility function to balance the efficacy and toxicity outcomes. The EffTox design is the first utility-based phase I–II designs. 17 Similar to the mISO design, the EffTox design restricts the dose-finding procedure to doses that exhibit acceptable efficacy and toxicity profiles only to enhance the safety and ethics of clinical trials. The design uses a complicated six-parameter parametric dose–outcome model to characterize the dose–efficacy, dose–toxicity, and efficacy–toxicity correlations. Based on this dose–outcome model, the utility function is formulated as a nonlinear function of the toxicity and efficacy rates at different doses. The idea is that a higher risk of toxicity is a reasonable trade-off for a greater benefit of efficacy. The utility function quantifies the risk–benefit trade-off and transforms the two-dimensional (toxicity, efficacy) outcomes into a single utility value criterion, which measures the overall desirability at each dose. For example, through a specific configuration of the utility function, a dose with 15% efficacy rate and no toxicity, a dose with 100% efficacy rate and 50% toxicity rate, and a dose with 30% efficacy rate and 15% toxicity rate can be considered as equally desirable in terms of their utility values. The parametric model estimates the toxicity and efficacy rates at different doses during each interim analysis. The estimates are then utilized in the utility function to determine the dose with the highest overall desirability to which the next cohort of patients will be assigned. At the end of the trial, the dose with the largest desirability is selected as the OBD. A graphical user interface–based software for implementing EffTox is available at https://biostatistics.mdanderson.org/SoftwareDownload/SingleSoftware/Index/2.
An alternative utility-based design, BOIN12,
18
is based on elicited utilities of all the possible (efficacy, toxicity) outcomes. For binary efficacy and toxicity endpoints, there are four possible outcomes: 1 = (no toxicity, efficacy), 2 = (no toxicity, no efficacy), 3 = (toxicity, efficacy), and 4 = (toxicity, no efficacy). A utility score of 100 is assigned to the most desirable outcome (no toxicity, efficacy), and a utility score of 0 is assigned to the least desirable outcome (toxicity, no efficacy). Then, using these two boundaries as references, the physicians can elicit the scores of the other two outcomes, which should be between 0 and 100. An illustrative example of a utility table is provided in Table 1. Let
An illustrative utility table for utility-based designs.
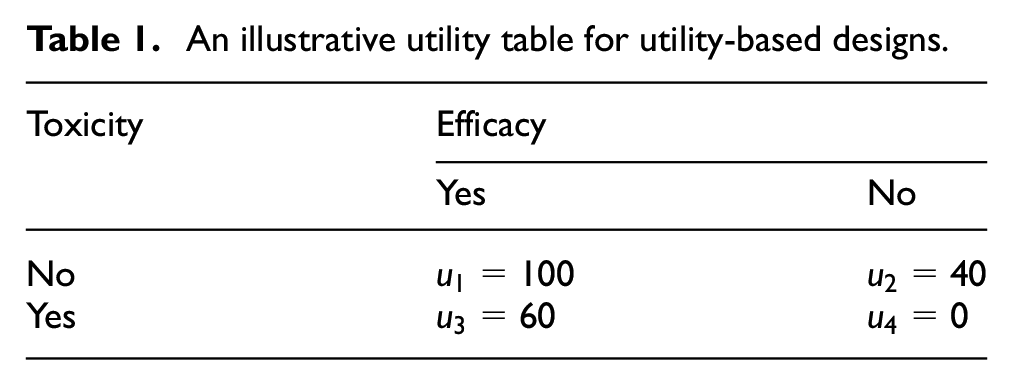
Under the BOIN12 design, the OBD is defined as the dose with the highest mean utility and acceptable toxicity and efficacy profiles. The dose-finding rules of the BOIN12 design incorporate both the BOIN design 19 and the mean utility. At each interim dose decision time, the BOIN design is initially used to determine whether the current dose is below, above, or close to the maximum tolerated dose. If the dose is above the maximum tolerated dose, the next cohort of patients is treated at a lower dose. If the dose is close to the maximum tolerated dose, and at least six patients have been treated, the next cohort is treated at the dose with the higher mean utility between the current dose and the lower dose. Suppose fewer than six patients have been treated or the dose is below the maximum tolerated dose. In that case, the next cohort is treated at the dose with the highest mean utility among the current and neighboring doses. At the end of the trial, the maximum tolerated dose is identified using the BOIN design, and the final OBD is chosen as the dose with the highest mean utility among those not higher than the maximum tolerated dose. A freely available R Shiny App to implement the BOIN12 design is available at https://trialdesign.org/one-page-shell.html#BOIN12.
Multiple efficacy endpoints
Traditionally, tumor response, such as complete or partial remission, has been used as the primary efficacy endpoint for many phase I–II clinical trials. However, to better understand the treatment efficacy, a growing trend is to include multiple efficacy endpoints in a single trial, such as immune response, pharmacodynamic endpoint, and survival endpoint. In line with this pattern, several new phase I–II designs have been proposed to integrate multiple efficacy outcomes.
One such design proposed by Liu et al. 20 focuses on immunotherapies and simultaneously considers toxicity, efficacy, and immune response (LGY2018 hereafter). Parametric modeling approaches characterize the plateaued dose–immune response curve and the joint distribution of efficacy and toxicity outcomes conditional on the immune response. The model also specifies that severe immune-related toxicity will occur only when the immune response exceeds a certain threshold. The utility function is also amended to incorporate the immune response. For dose-finding, LGY2018 adaptively randomizes patients to doses with acceptable efficacy and toxicity profiles based on the continuously updated estimates of the posterior mean utility. This adaptive randomization allocates more patients to doses with larger posterior mean utility. Simulation results indicate that LGY2018 outperforms conventional phase I–II designs that only consider efficacy and toxicity. However, no publicly available software is available to implement LGY2018 in clinical practice.
From a pharmacological perspective, pharmacodynamic information is an appropriate indicator for evaluating therapeutic effectiveness. Compared to primary efficacy endpoints such as tumor response, which may require long follow-up time, the assessment window for pharmacodynamic evaluation is relatively short, making it an appropriate surrogate efficacy endpoint. The DROID design 21 proposes incorporating pharmacodynamic information into the dose-finding procedure. The key innovation of the DROID design is that it incorporates the dose-ranging framework widely used in non-oncology studies into the oncology dose-finding methodology and develops a two-stage dose optimization design. In the first stage, patients are sequentially enrolled and adaptively assigned to investigational doses to establish the therapeutic dose range, defined as the range of doses with acceptable toxicity and pharmacodynamic profiles. At the end of stage I, a recommended phase 2 dose set is selected as a subset of the doses in the therapeutic dose range, yielding desirable efficacy performances. The recommended phase 2 dose set is refined from the therapeutic dose range to exclude doses that lack clinical efficacy but show sufficient pharmacodynamic effect. In stage 2, more patients are randomized to the recommended phase 2 dose set to assess the dose–response relationship. Toxicity and futility monitoring rules are applied at each interim analysis time in stage 2 to drop overly toxic or ineffective doses from the recommended phase 2 dose set. At the end of stage 2, based on all the accumulated data, the OBD is selected as the lowest dose that reaches the pharmacodynamic plateau and achieves desirable toxicity and efficacy performances. A freely available R Shiny App to implement the DROID design is available at https://trialdesign.org.
Compared to cytotoxic agents, targeted therapies and immunotherapies aim to stop tumor growth rather than kill cancer cells. Therefore, evaluating the treatment effect of these novel agents often requires considering progression-free survival rather than just tumor response. Furthermore, using tumor response as the primary endpoint to select the OBD may result in suboptimal progression-free survival due to high relapse rates after the initial response, leading to high failure rates in subsequent phase III studies. The Gen I–II design 22 has been developed to address this issue. This design jointly models toxicity, short-term efficacy, and long-term survival outcomes, and the OBD is defined by survival outcome. The joint short-term efficacy–toxicity outcome is modeled independently among different doses, whereas a flexible parametric dose–response assumption is made to model the survival outcome. The Gen I–II design is a three-stage design (Figure 3). In stage 1, any conventional phase I–II design can be used to identify a candidate dose set containing doses with acceptable short-term efficacy and toxicity. In stage 2, more patients are randomized to the candidate dose set to explore acceptable doses more thoroughly, with the candidate dose set updated using accumulated data. In stage 3, additional patients are randomized to the latest candidate dose set, and all patients in the candidate dose set are followed for an extended period to harvest their survival outcomes. The OBD is selected with the best survival outcome and acceptable toxicity rate at the end of stage 3. Simulation studies show that the Gen I–II design has correct OBD selection rates that may be an order of magnitude larger than those of conventional phase I/II designs using only toxicity and short-term efficacy. An R package for implementing the Gen I–II design is available at https://github.com/yongzang2020/Gen-I-II.
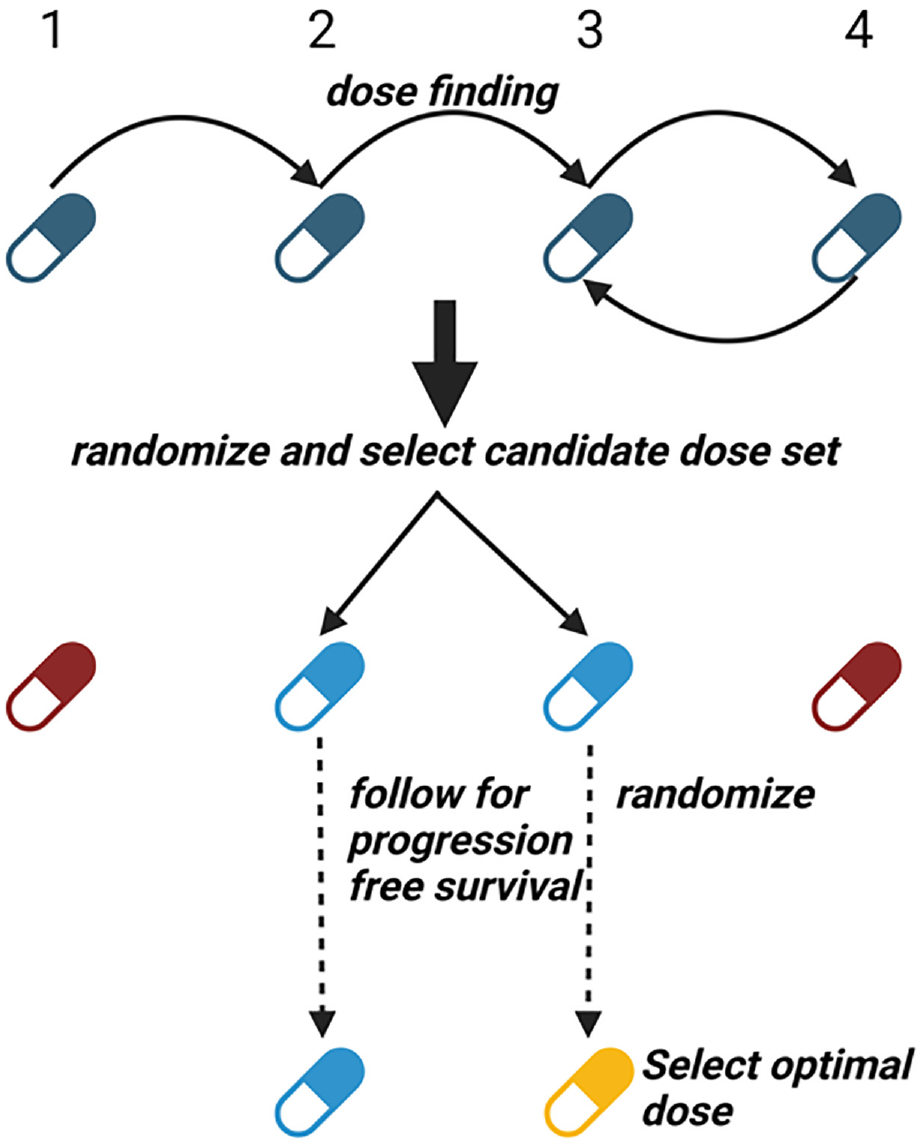
The schematic for the Gen I–II design. Blue color indicates the doses under evaluation. Red color indicates doses that are overly toxic or less efficacious. Golden color indicates the selected optimal dose.
Trial examples
This section provides two real examples of phase I–II trials using innovative designs. The first trial investigates the combination of sitravatinib and nivolumab in immunotherapy-naïve patients with advanced clear renal cell carcinoma. 23 The primary objective is to identify the OBD of sitravatinib in combination with a fixed dose of nivolumab, based on a trade-off between efficacy and toxicity. The primary toxicity endpoint is the time to dose-limiting toxicity within 12 weeks of starting therapy, while the primary efficacy endpoint is the absence of progressive disease at 6 weeks by investigator assessment and Response Evaluation Criteria in Solid Tumors 1.1. Secondary endpoints include objective response rate, disease control rate, progression-free survival time, overall survival time, and quality-of-life. To handle the late-onset outcomes (e.g. pending outcomes for the existing patients while new patients are coming), a modified version of the EffTox design 24 is used for dose finding. Four doses of sitravatinib (60, 80, 120, and 150 mg daily) are investigated, and the trial begins with the 80 mg dose. Using the modified EffTox design, 15, 24, and 3 patients are treated at the 80, 120, and 150 mg doses, respectively, resulting in dose-limiting toxicity rates of 26.7%, 41.7%, and 100%, and objective response rates of 26.7%, 37.5%, and 100%. The estimated EffTox desirability scores are 0.787, 0.755, and 0.630 for the 80, 120, and 150 mg doses, respectively. Since the 80 and 120 mg doses have comparable desirability scores, additional criteria are used to select the OBD. Specifically, the 120 mg dose has significantly better progression-free survival and quality-of-life results than the 80 mg dose. Hence, the 120 mg dose is selected as the OBD.
The second example describes a phase I–II clinical trial of hydroxychloroquine that induces the secretion of tumor suppressor Par-4 from normal cells. 25 The trial aims to determine the OBD of hydroxychloroquine for patients with early-stage solid malignancies. The trial enrolled nine patients with early-stage solid malignancies, divided into three cohorts of three patients each, who received hydroxychloroquine twice daily at either 200 or 400 mg doses. The trial uses the ISO design for dose finding, and the procedures are outlined in Figure 4. The primary toxicity outcome was dose-limiting toxicity, and the primary efficacy outcome was the two-fold induction of Par-4 levels. The first cohort received a low dose 200 mg, with no dose-limiting toxicity observed, and all three patients exhibited a two-fold induction of Par-4 levels. Thus, the ISO design recommended dose escalation, and the next cohort received a high dose of 400 mg. No dose-limiting toxicity was observed, and two out of three patients achieved the desired Par-4 level induction. The corresponding efficacy rates were estimated to be 100% and 67%, respectively, for the 200 and 400 mg doses. Therefore, the final cohort of three patients received the low dose of 200 mg again. No dose-limiting toxicity was observed, but only one patient had desirable efficacy outcomes. Using all the accumulated data, the trial found that the 200 and 400 mg doses had an identical dose-limiting toxicity estimate of 0% and an efficacy estimate of 67%. This indicates that the dose–response curve had plateaued. Under these circumstances, the ISO design favors the low dose 200 mg and selects it as the OBD. On the other side, assuming a phase I design, such as the BOIN design, is used to run this trial, with the conventional 30% toxicity rate as the targeted toxicity rate. Then, because no dose-limiting toxicity was observed for the first and second cohorts of patients, the last cohort would be treated at 400 mg dose instead of 200 mg dose. Subsequently, unless all the patients in the last cohort experienced dose-limiting toxicity, the 400 mg dose would be selected at the end of the trial. However, the 200 and 400 mg doses give the same efficacy rate of 67%. The 200 mg dose selected by the phase I–II design is preferable to the 400 mg dose selected by the phase I design because a lower dose always indicates a lower risk of toxicity. Besides, treating the last cohort of patients at the 200 mg dose is also safer than treating them at the 400 mg dose.
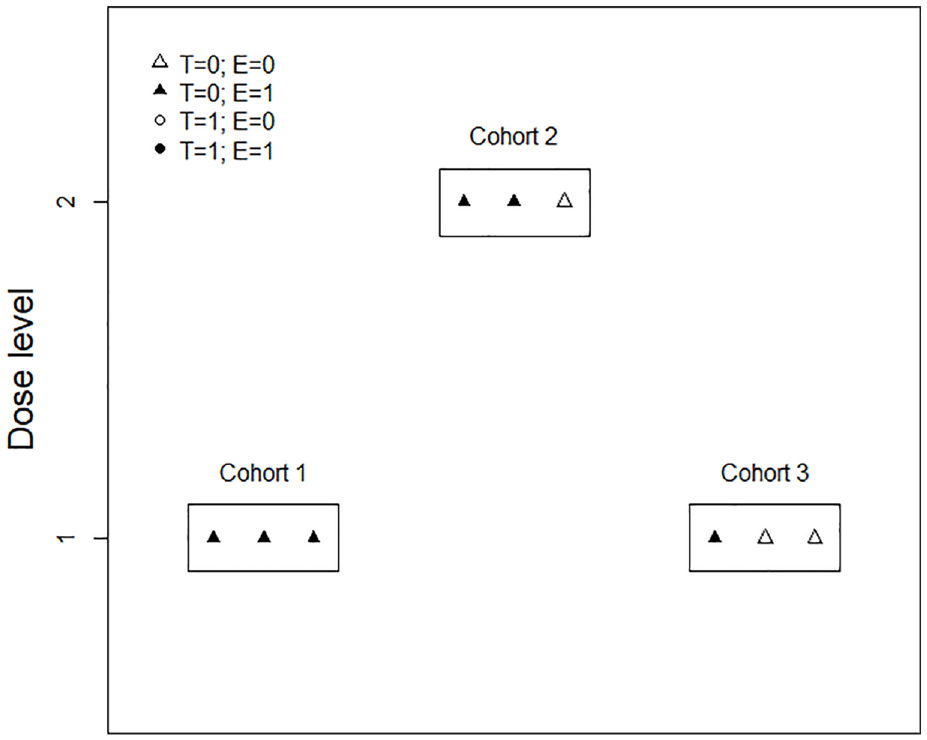
The dose-finding procedures for the hydroxychloroquine trial example.
The original efficacy outcome used in this hydroxychloroquine trial is the Par-4 levels, a continuous outcome. However, it is generally challenging to directly utilize the continuous toxicity or efficacy outcome in early-phase clinical trials because (1) most popular early-phase trial designs (e.g. 3 + 3, BOIN, Simon’s two-stage design) are developed for binary outcomes only; (2) modeling continuous outcomes requires larger sample size than the binary outcomes whereas the sample size for early-phase trial is typically limited; (3) collecting and recording continuous outcomes can be resource-intensive and time-consuming, and (4) continuous data are more susceptible to missing data and measurement error issues, which can complicate the data management procedure and increase the overall cost. Hence, to apply the ISO design to the hydroxychloroquine trial, the efficacy outcome has been dichotomized into the binary outcome based on a clinically meaningful cut-off, a commonly used strategy in clinical practice.
We also note that the hydroxychloroquine trial’s result may be affected by the small sample size utilized in the study. This limitation leads to a considerable degree of variability in the estimates obtained through the mISO design, thereby introducing significant uncertainty regarding the selection of the 200 mg dose. To address this uncertainty, we recommend considering a subsequent cohort expansion stage, should clinical practice permit, in order to confirm the OBD selection.
Discussion
This article overviews several innovative phase I–II clinical trial designs for identifying OBDs in targeted agents and immunotherapies. To better summarize this article, in Figure 5, we present a classification tree depicting all the reviewed designs based on the type of OBD (efficacy-driven or utility-based), the dose-outcome model (model based or model free), the shape of the dose-response curve (unimodal or plateaued), the secondary efficacy endpoint (immune response, pharmacodynamic, or survival), and the availability of software. It should be noted that there are many other efficacy-driven designs,26–31 utility-based designs,32–38 or designs incorporating multiple efficacy outcomes39–46 not reviewed due to the page limits. Besides, many other phase I–II clinical trial designs have been proposed to handle more complicated clinical settings for targeted agents and immunotherapies such as the late-onset outcomes,24,47,48 drug–drug combination,49–52 dose schedule,53–58 and personalized medicine.40,45,46,59–66 The phase I–II clinical trial designs belong to the class of seamless designs and are dedicated to the early stages of drug development. Many other types of seamless designs, such as the phase II–III design, have also been developed, focusing on the later stage of the drug development, such as the treatment effect confirmation and validation.67–69
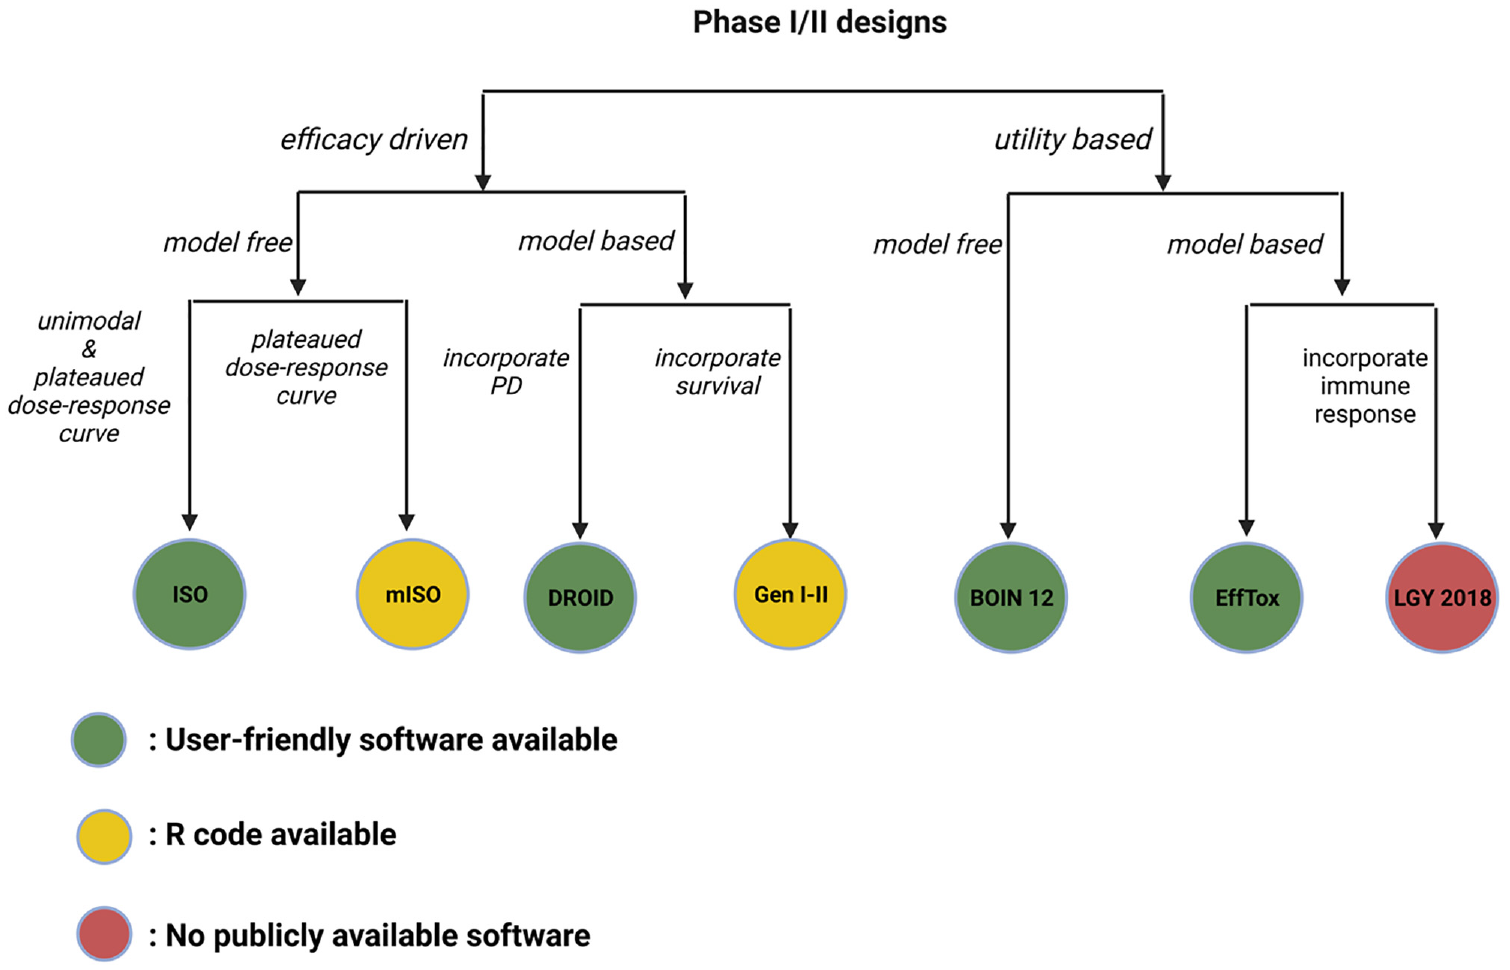
Classification tree for all the discussed phase I–II designs.
Compared with cytotoxic agents, the toxicity and efficacy outcomes of targeted agents and immunotherapies (e.g. immune-related toxicity, disease progression) typically require longer follow-up and can be treated as the time-to-event outcomes. However, the competing risks often arise if multiple time-to-event outcomes are monitored in a single phase I–II trial. For example, the occurrence of immune-related toxicity can terminate the follow-up for disease progression and vice versa. Several phase I–II designs have been proposed, which use the competing risks and semi-competing risks models developed for survival analysis to resolve this issue.70–73
Through the integration of phase I and II trials, a phase I–II trial requires a larger sample size than a traditional phase I trial, resulting in increased costs and longer trial durations. As per the FDA guidelines, no general mathematical formulas are available for determining the sample size of phase I–II designs. 14 Before implementing any phase I–II trial in practice, it is critical to conduct preliminary simulation studies to determine the required sample size based on desirable simulation operating characteristics. This helps to confirm whether conducting a phase I–II trial is statistically and clinically feasible compared to conducting a phase I trial. Determining the sample size for a phase I–II trial is not solely a statistical calculation procedure but requires extensive collaboration between statisticians and clinicians. The performance of phase I–II clinical trials is also sensitive to the missing data, which can significantly impact the trial’s integrity by leading to an incomplete safety and efficacy profile, introducing interim analysis biases, hindering accurate final dose selection, and requiring additional resources and time. Adequate trial design, data management, and statistical analysis methods are essential to mitigate these impacts and ensure phase I–II clinical trials’ credibility and ethical conduct.
Footnotes
Acknowledgements
The authors thank two reviewers for their helpful comments which improve the presentation of this paper.
Declaration of conflicting interests
The author(s) declared no potential conflicts of interest with respect to the research, authorship, and/or publication of this article.
Funding
The author(s) disclosed receipt of the following financial support for the research, authorship, and/or publication of this article: Y.Z.’s research is partially supported by NIH/NCI grants R01 GM150808, R21 CA082709, P30 CA082709, and the Ralph W. and Grace M. Showalter Research Trust award. B.G.’s research is partially supported by the R&D Research Competitiveness Sub-program of Louisiana Board of Regents, Contract no. LEQSF (2022-25)-RD-A-0.