





Abstract
Introduction
Ankle brachial index (ABI) is the ratio of the higher of ankle pressures to the higher of arm pressures. A low ABI is diagnostic for peripheral arterial disease (PAD) and is associated with increased risk of all-cause mortality, cardiovascular mortality, and total mortality as compared with normal ABI.1,2
In contrast with the strong evidence on low ABI, the clinical significance of high ABI (ABI >1.4) is unknown. Most epidemiological studies excluded individuals with high ABI. Few studies comparing cardiovascular risk associated with high ABI have provided discrepant data. Recently, increased left ventricular mass was described in individuals with high ABI. 3 We hypothesized that increased aortic pulse wave velocity (aPWV) could be responsible for increased left ventricular mass and increased cardiovascular risk in individuals with high ABI.
The aim of our study was to compare aPWV as an independent predictive factor for all-cause and cardiovascular morbidity and mortality in individuals with low (ABI <1.0), normal (ABI 1.0–1.4), and high ABI (ABI >1.4) in a random population sample.
Methods
Study population
The Czech post-MONICA (MONItoring trends and determinants in CArdiovascular disease) study is a population survey studying trends and determinants of cardiovascular risk factors in a 1% random sample of the Czech population in nine districts of the country. Methods of the Czech post-MONICA study are described elsewhere. 4 Our study includes individuals aged >25 years from the City of Pilsen. The overall response rate in this district was 68.0%. A total of 911 patients had complete data on ABI and aPWV, which represents 98% of patients examined in the district.
Doppler ABI measurement
Appropriately sized cuffs of the mercury sphygmomanometer (Baumanometer; WA Baum, NY, USA) were placed proximal to the ankles and on the right arm. After at least 5 minutes’ resting period in the supine position, systolic blood pressure was measured in the right brachial artery, right dorsal pedal, posterior tibial artery, left dorsal pedal, and tibial artery in this order, using a pocket Doppler device with an 8 MHz probe (Dopplex multiTM; Huntleigh, Cardiff, UK). Next, systolic blood pressure was re-measured in the right brachial artery for a second time. If the difference between the first and the second brachial systolic pressure measurements was higher than 10 mmHg, all measurements were repeated. All measurements were performed by two physicians experienced in ABI measurement. ABI was calculated separately for each leg by dividing the higher of the ankle systolic pressures by the brachial systolic pressure. The lower of the two leg ABI values was used in further analysis.
Large artery properties measurement
Measurements were done using a semi-automatic Sphygmocor device (AtCor Medical, Australia) in the recumbent position. The methods of measurement were described in detail in our previous report. 5 aPWV was calculated as the ratio of pulse wave time shift between the carotid and femoral arteries and the distance between the two sides. Consecutive registrations of the pulse waves are electrocardiogram-gated and thus, the time shift between the foot of wave at the first and second sites can be calculated. The distance between the two sites was calculated by subtracting the distance from the jugular fossa to carotid pulsation from the distance from the jugular fossa to the pulsation of the femoral artery in the groin. The average of measurements over a period of 8 s was calculated after the exclusion of extreme values.
Statistical analysis
Descriptive statistics are given as mean and standard deviation or frequency and percentage. Previous studies have demonstrated that subjects with ABI <1.0 and ≥1.4 or with incompressible arteries are at greater risk for cardiovascular disease events and mortality than subjects with normal ABI. Participants were divided into three groups on the basis of ABI according to these cut-points. Characteristics of these groups were compared using the one-way ANOVA test with Turkey’s post-hoc test for continuous variables, and the chi-squared test with Bonferroni correction for categorical variables. For continuous variables, when equal variance was violated, the Kruskal–Wallis test was used. The Fisher exact test was employed when the expected number in any cell for a categorical variable was less than 10. Variables significantly differing between the ABI categories were included into binary logistic regression analysis to evaluate factors associated with high ABI. To compare aPWV between the different ABI groups, analysis of variance and a model adjusted for age, sex, systolic, diastolic, mean blood pressure, and observer were used. A two-sided p-value <0.05 was considered to be statistically significant.
Results
Descriptive statistics by ankle brachial index (ABI) groups: continuous variables

Values are mean ± SD.
aPWV, aortic pulse wave velocity; BP, blood pressure; HDL-chol, high-density lipoprotein cholesterol; LDL-chol, low-density lipoprotein cholesterol.
Descriptive statistics by ankle brachial index (ABI) groups: categorical variables

Values are n (%).
CHD, coronary heart disease; DM, diabetes; DVT, deep venous thrombosis; HLP, hyperlipidaemia; HT, hypertension; NS, not significant; PE, pulmonary embolism; TIA, transient ischaemic attack.
Compared with individuals with normal ABI, those with low ABI were significantly older, had higher body weight, larger waist and hip circumferences, and higher systolic blood pressure and glucose level. Prevalence of hypertension, diabetes, hyperlipidaemia, and coronary heart disease was higher in these participants compared with the normal ABI group.
Similar to individuals with low ABI, those with high ABI were older, had higher body weight, larger waist circumference, systolic blood pressure and higher glycaemia compared with participants with normal ABI. In the group with high ABI, the male sex was predominant (87% of males). A higher cardiovascular risk profile of individuals with high ABI was suggested by the higher prevalence of hypertension, diabetes, and deep venous thrombosis (DVT) as compared with those with normal ABI.
Lipid-lowering and antihypertensive drugs by ankle brachial index (ABI) groups

Values are n (%).
ACEI, angiotensin-converting enzyme inhibitor; ARB, angiotensin receptor blocker.
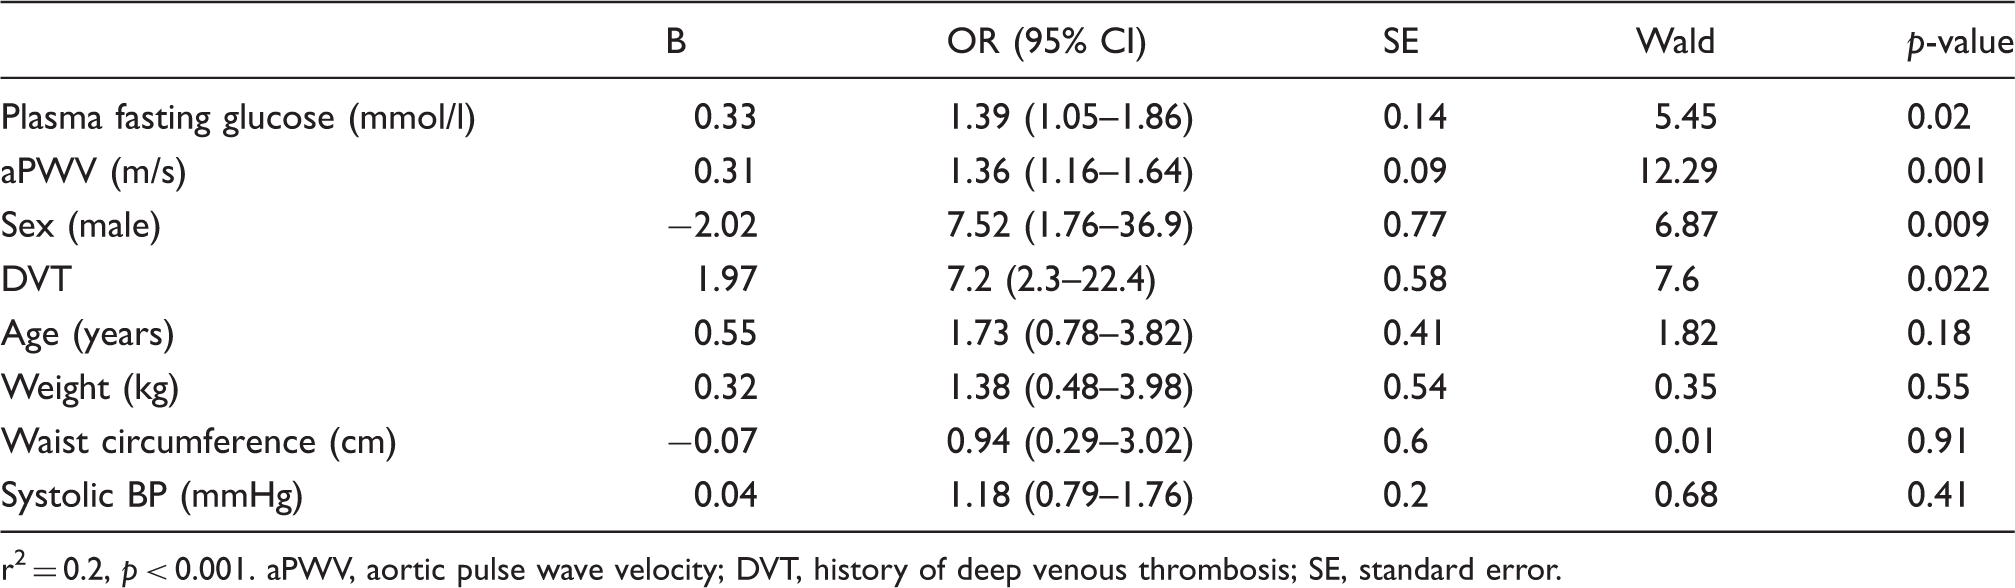
aPWV followed a U-shaped curve with regard to ABI (Figure 1). It was significantly higher in participants with low and high ABI compared with the normal ABI group (11.1 ± 2.8 vs. 8.3 ± 2.3 m/s, p < 0.0001; 10.8 ± 2.5 vs. 8.3 ± 2.3 m/s, p < 0.0001, respectively) and did not differ between individuals with low and high ABI (11.1 ± 2.8 m/s vs. 10.8 ± 2.5 m/s, p = 0.86). In a model adjusted for age, sex, systolic, diastolic, mean blood pressure, and examiner, aPWV remained increased in both extreme ABI groups compared with the normal ABI group [9.8 ± 0.3 m/s (95% CI 9.15–10.46) vs. 8.4 ± 0.1 m/s (95% CI 8.25–8.47), p < 0.001 for low vs. normal ABI group; 9.4 ± 0.4 m/s (95% CI 8.65–10.08) vs. 8.4 ± 0.1 m/s (95% CI 8.25–8.47), p = 0.02 for high vs. normal ABI group] and no difference was found between low and high ABI groups (9.8 ± 0.3 vs. 9.4 ± 0.4 m/s, p = 0.98). In the logistic regression analysis, aPWV together with glucose level, male sex, and a history of deep venous thrombosis were independent predictors of high ABI (Table 4).
Aortic PWV by ankle brachial index (ABI) subgroups. Patients in the low and high ABI groups had increased aPWV compared with the normal ABI group. aPWV, aortic pulse wave velocity. Parameters associated with high ankle brachial index in logistic regression analysis r2 = 0.2, p < 0.001. aPWV, aortic pulse wave velocity; DVT, history of deep venous thrombosis; SE, standard error.
Discussion
ABI measurement has been increasingly used in general practice to identify individuals with low ABI at high cardiovascular risk. However, because of insufficient evidence, there is no consensus on the clinical significance of high ABI in regard to cardiovascular risk. Most large epidemiological studies have excluded these individuals. There are only a few studies showing inconsistent evidence on cardiovascular risk associated with high ABI. Increased risk of all-cause and cardiovascular mortality in individuals with ABI >1.4 was described in the Strong Heart Study in American Indians 6 and in the Cardiovascular Health Study. 7 Similarly, increased risk of cardiovascular mortality at ABI levels below 1.1 and above 1.3 was noted among Japanese haemodialysis patients. 8 Contrary to these findings, the cardiovascular event rates in the Atherosclerosis Risk in Community (ARIC) study did not differ between individuals with high and normal ABI over a mean follow-up period of 12 years. 9 There is also disagreement on the cardiovascular risk profile associated with high ABI. While the prevalence of diabetes was increased in the high ABI group in some studies,6,7,10,11 there was no difference in others.10,12 This discrepancy among studies could be explained by the different methods of ABI measurement used. While studies measuring ABI by Doppler showed increased risk associated with high ABI (Strong Heart Study and Cardiovascular Health Study), others measuring ABI by the oscillometric method (ARIC study) 13 did not find increased risk associated with high ABI. As we and others have shown, 12 the difference between Doppler and oscillometric ABI increases with increasing ABI. Thus oscillometric devices underestimate high ABI. Moreover, an oscillometric device is not able to identify incompressible arteries. Thirty percent of individuals with high ABI had incompressible leg arteries in our study.
An ABI <0.9 is considered to be a sign of lower extremity PAD. There is increasing evidence showing that ABI values previously considered low normal are associated with a poor outcome similar to patients with ABI <0.9. In the Multi Ethnic Study of Atherosclerosis, individuals with ABI 0.9 – 1.10 had higher levels of subclinical atherosclerosis in the carotid and coronary arteries than those with ABI 1.10–1.30. 14 Similarly, in the Strong Heart Study, total and cardiovascular mortality risk increased at ABI <1.10. These findings and increased aPWV in individuals with ABI 0.9–1.0 compared with ABI 1.0–1.4 (10.52 ± 2.9 m/s vs. 8.24 ± 2.14 m/s, p < 0.0001) made us choose ABI = 1.0 as the cut-off for the low ABI group.
We used ABI >1.4 as the cut-off value for the high ABI group. There were 59 individuals with an ABI between 1.3 and 1.4. When setting the cut-off value for high ABI to 1.3, the difference in aPWV between the low and high ABI groups became significant (11.1 ± 2.8 m/s vs. 9.2 ± 2.5 m/s, p < 0.001), while the difference between the normal and high ABI groups remained significant (8.3 ± 2.3 m/s vs. 9.2 ± 2.5 m/s, p < 0.01). After adjustment for age, sex, systolic, diastolic, mean blood pressure, and examiner, the difference between normal and high ABI was no longer significant [8.4 ± 0.2 m/s (95% CI 8.0–8.8) vs. 8.6 ± 0.3 m/s (95% CI 8–9.1)]. This means that in individuals with ABI between 1.3 and 1.4, aPWV is not significantly increased.
The observed prevalence of high ABI in our population sample was 2.5%. It is higher than the 1.15% and 1.2% prevalence of ABI >1.4 in the Cardiovascular Health Study and ARIC study, respectively, but lower than the 9.2% prevalence reported in the Strong Heart Study. An even higher prevalence was reported in individuals with chronic renal failure (23.7%) or on dialysis (41.7%). 15 The prevalence of high ABI observed in our random population sample of the Czech population was comparable with that of low ABI. This suggests that high ABI is not a rare condition in the population.
An abnormally increased ABI is widely believed to be associated with medial arterial calcification caused by calcification of the arterial media and the internal elastic membrane of muscular arteries. 16 Vascular calcification is the consequence of dysregulation between promotion and inhibition of calcification often seen in chronic kidney disease, diabetes mellitus, atherosclerosis and aging. 17 Thus a high ABI is not exclusively associated with diabetes as commonly believed. The prevalence of diabetes in the high ABI group in our study (25%) is similar to the 28% prevalence in the Multi-Ethnic Study of Atherosclerosis and the 25% prevalence in the Cardiovascular Health Study. The lower prevalence of diabetes in our and other studies may be due to the definition of diabetes based on use of antidiabetic drugs and fasting glucose level. Definitions based also on the oral glucose tolerance test or glycated haemoglobin level may have resulted in an increased prevalence of diabetes in the high ABI group.
Another important finding is that cholesterol level is not associated with high ABI. The prevalence of hyperlipidaemia was increased in the low ABI group compared with the normal ABI group, and no difference was found between the normal and high ABI groups. There was no difference in cholesterol levels between the groups, which was most likely due to the high rates of use of lipid-lowering drugs in low ABI individuals (Table 3). This might be yet another proof of the concept that high ABI is linked to stiffness and not to atherosclerosis.
Increased aortic stiffness increases systolic and pulse pressure while decreasing diastolic blood pressure. In our and other studies,3,7 high ABI individuals had slightly increased systolic and pulse pressure, while no difference was seen in diastolic blood pressure compared with the normal ABI group. This could be caused by the frequent use of antihypertensive therapy in the high and low ABI groups in our study. The increased aortic stiffness persisting elevated after blood pressure control is a sign of intrinsic vasculopathy as noted by Guerin et al. 18 This suggests that the increased aortic stiffness in high ABI is due to structural changes of the aorta, presumably calcifications, seen in the muscular arteries of these individuals.
Lately, there has been increasing evidence on the association between atherosclerosis and DVT. 19 Conventional cardiovascular risk factors have been shown to increase the risk of DVT. The proposed mechanism behind this association is arterial and venous endothelial dysfunction. In our study, we have shown increased prevalence of DVT in the high ABI group compared with the normal ABI group. The higher prevalence of hypertension, diabetes and obesity in these individuals can cause endothelial dysfunction leading to higher risk of DVT. The non-significant difference between the low and normal ABI groups is probably caused by lack of power to detect this difference due to the small sample size. Another explanation for the increased rates of DVT in high ABI individuals may be increased lower extremity arterial stiffness due to medial arterial calcification. Increased lower extremity arterial stiffness has been shown to decrease arterial flow volume in the lower extremities of diabetic patients. 20 A decreased flow volume in the arterial system presumably leads to blood stasis in the venous system, an abnormality of Virchow’s triad associated with thrombus formation.
To the best of our knowledge, this is the first study showing increased aPWV in individuals with ABI >1.4. Increased arterial stiffness in patients with PAD has been reported previously. In the Health ABC study, the prevalence of ABI <0.9 increased with increasing quartiles of aPWV. 21 In the Rotterdam study, the presence of PAD was associated with a significantly increased aPWV. 22 Matsumae reported higher aPWV in non-diabetic haemodialysis patients with PAD compared with non-diabetic haemodialysis individuals without PAD. 23 In our study, we found a U-shaped association between ABI and aPWV. In agreement with other studies, we observed increased aPWV in PAD individuals. Moreover, we observed increased aPWV in the high ABI group which was comparable with those with low ABI. Increased aPWV has been shown to be an independent predictive factor for all-cause and cardiovascular mortality, cardiovascular disease, fatal and non-fatal coronary events and fatal strokes in patients with various levels of cardiovascular risk. 24 Increased aortic stiffness through increased left ventricular afterload leads to left ventricular hypertrophy. Increased aPWV can explain the atherosclerosis-independent increase in left ventricular mass recently described in high ABI individuals in Multi-Ethnic Study of Atherosclerosis.
To summarize, we have shown increased aortic pulse wave velocity in individuals with high ABI. The increased aPWV in these individuals indicates increased cardiovascular risk. Prospective studies using the Doppler method of ABI measurement are needed to confirm the increased cardiovascular risk associated with high ABI.
Footnotes
Funding
The study was supported by the Internal Grant Agency of the Ministry of Health of the Czech Republic (grant number NR/9389-3).
Conflict of interest
None