
Abstract
Introduction
Coronary heart disease (CHD) is a multifactorial disease associated with several risk factors that may also interact to increase risk. Therefore, the risk of CHD based on the combined effect of risk factors is more meaningful than the risk based on a single risk factor. Consequently, risk functions have been developed for cardiovascular disease (CVD) 1 – 5 or CHD 6 – 12 that estimate the risk in time taking into account the cumulative effect of risk factors. Such risk scores can be useful in the primary prevention of CVD/CHD by identifying persons at high risk of developing the disease.
In most European countries including the Netherlands, the SCORE function is often used in the primary prevention of CVD.13,14 Separate risk functions have been developed for high- and low-risk regions. These functions estimate the 10-year risk of fatal CVD using the following predictors: age, sex, current smoking, total/high-density lipoprotein (HDL) cholesterol ratio, and systolic blood pressure. 4 Some studies have found that applying these formulas to their own population overestimated absolute risks. 15 – 18 Therefore, several countries including the Netherlands have recalibrated the SCORE function using national estimates of incidence rates and mean risk factor levels. However, the problem with such aggregated data is that the risk factor and disease status are not measured at an individual level. Thus, it would be better to use observed individual data from prospective cohort studies for recalibration. Additionally, the SCORE functions estimate the risk of CVD mortality only, while for clinical practice the prediction of both fatal and non-fatal events is more relevant.
Furthermore, some risk factors such as physical inactivity and body mass index are mostly not included in current risk scores probably due to their limited availability or their limited added value to risk prediction as assessed by the discriminative ability of risk scores. Many studies have investigated whether the inclusion of additional risk factors resulted in an improvement of the risk prediction. 19 – 27 They found that adding predictors resulted in only small improvements in the predictive ability of risk scores using the discriminative ability (determined as the area under the receiver operating characteristic curve) as the criterion. However, adding these factors may still improve risk prediction when evaluated by reclassification of subjects to a more appropriate risk category. 28
Therefore, the goals of this study were (1) to re-estimate the SCORE risk function using individual data on risk factors and both fatal and non-fatal CHD incidence from the Cardiovascular Registry Maastricht (CAREMA) cohort study in the Netherlands; (2) to evaluate whether including additional risk factors or current risk factors in a different manner into this re-estimated function improves risk prediction; and (3) to compare the risk prediction of CHD incidence by the re-estimated and extended risk function from the CAREMA cohort study with the risk predicted by functions of the SCORE project 4 for high-risk (SCORE-high) and low-risk regions (SCORE-low) and the Framingham risk score. 10
Methods
Study population
The study participants, living in the Maastricht region, were derived from two large monitoring projects in the Netherlands: the Monitoring Project on Cardiovascular Disease Risk Factors (PPHVZ) 1987–1992 29 and the Monitoring Project on Chronic Disease Risk Factors (MORGEN) 1993–1997. 30 Each year, a random sample of people aged 20–59 years was selected from municipal registries of Maastricht and surrounding communities, i.e. Eijsden, Margraten, Meerssen, and Valkenburg aan de Geul. Between 1987 and 1997, 21,662 participants, born between 1927 and 1977, were included in this study.
Baseline data
At baseline, all participants completed a self-administered questionnaire on demographic characteristics, medical history, parental history of myocardial infarction, and life style factors such as smoking, alcohol consumption, usual dietary intake, and physical activity. In addition, all participants underwent a physical examination at the Municipal Health Service to measure their height, weight, and blood pressure.29,30 All measurements were carried out by trained staff members who were instructed by the same physician. Non-fasting blood samples were taken for the determination of total and HDL cholesterol levels.
Follow-up
Of the 21,662 participants, 21,148 (97.6%) had given written informed consent to retrieve information from the Municipal Population Registries and their general practitioner or specialist. A migration and mortality follow-up was performed by record linkage of the cohort to the Municipal Population Registries. During follow-up until 31 December 2003, 791 participants (3.7%) died, 621 (2.9%) emigrated, 2,106 (10.0%) migrated to a municipality outside the Maastricht region, and 12 (0.1%) were lost to follow-up.
Cardiological follow-up was performed by record linkage to the Cardiology Information System (CIS) of the University Hospital Maastricht and to the causes of death registry of Statistics Netherlands. Incident CHD was defined as a clinical diagnosis of an acute myocardial infarction, unstable angina pectoris, a percutaneous transluminal coronary angioplasty, or coronary artery bypass grafting according to the CIS or CHD as primary or secondary cause of death according to Statistics Netherlands (ICD9 410–414 or ICD10 I20–I25).
Person time at risk was calculated from baseline until end of follow-up, i.e. a clinical diagnosis of CHD, death, emigration, migration outside the Maastricht region, or censoring at 31 December 2003, whichever occurred first. Participants with CHD at baseline (n = 347), those who migrated to a municipality outside the Maastricht region before baseline (n = 26) or who were lost to follow-up (n = 12) were excluded from the analyses.
Statistical analyses
All analyses were performed using the Stata statistical software package 9.2 (Stata Corporation, College Station, TX, USA). Two-sided p-values are reported throughout this paper, with p < 0.05 considered statistically significant.
Re-estimation
Weibull proportional hazards models with age as time variable were used for the development of the prediction models, similar as in the SCORE project. 4 Separate baseline survival functions were obtained for men and women while the coefficients for the predictors were obtained from the total cohort. Continuous predictors were centred and linearity was checked using restricted cubic spline analyses.
The proportional hazard assumption was tested by checking the log–log curves. To see whether the assumptions about the underlying survival functions made by the Weibull model influenced the risk prediction, the Weibull model was cross-checked with a Cox regression model. Based on previous risk functions, interaction terms were tested between total/HDL cholesterol ratio and sex, 31 and between systolic blood pressure and use of blood pressure-lowering medication. 32
For the re-estimation the same predictors were included as in the SCORE risk function, i.e. age in years (time variable), sex (strata), current smoking (yes/no), systolic blood pressure (mmHg), and total/HDL cholesterol ratio. Because of the low number of missing values and negligible impact on the regression coefficients, participants with missing data on at least one predictor (n = 619) were excluded from the analysis. In addition, participants with inconsistent data on smoking or alcohol consumption (n = 89) were excluded, leaving 20,055 participants including 783 incident CHD cases.
Model performance
Model performance was evaluated in the study population of 40 years and older at baseline. Discrimination was evaluated using the c statistic which is the probability of the model to distinguish between those who developed CHD during the follow-up period and those who did not, taking into account censored follow-up times. Calibration was used to assess the agreement between observed and predicted risks. The 10-year predicted risk of incident CHD was calculated as described in the Appendix (available online). In each decile of predicted risk, the observed 10-year risk was calculated from the 10-year Kaplan–Meier estimate and the ratio between predicted and observed risk was calculated. A calibration plot was made by plotting the observed risk against the predicted risk. The calibration slope and intercept were calculated using a linear regression model with the observed risk as the outcome variable and the predicted risk as the only independent variable. In case of perfect agreement, these estimates are one and zero, respectively. Because the interpretation of the intercept is difficult when the slope is unequal to one, the intercept was calculated with the slope fixed at one. Model performance was assessed in participants of 40 years and older at baseline that were part of the total study population in which the model was developed. Formal internal validation of the model by bootstrapping was not considered indicated, because of the very favourable ratio of events per variable (783/8).33,34
Evaluating improvements in risk prediction
Several changes to the re-estimated SCORE function were investigated to assess their contribution to risk prediction. Besides discrimination and calibration, the prediction models were compared using the net reclassification index (NRI) taking into account persons with incomplete 10-year follow-up.28,35 This estimate refers to the percentage of subjects shifting to a more appropriate risk category (to a higher risk category for cases, to a lower risk category for non-cases) when using the new risk function compared with the original function. According to the predicted risks, subjects were divided in the following risk categories: 0–2%, 2–5%, 5–10%, and ≥10%. 36 The final model from these analyses is referred to as the CAREMA risk function.
The performance of the CAREMA risk function to predict CHD incidence was compared to the performance of SCORE-high and SCORE-low, 4 as these risk functions are mostly used for primary prevention of CVD in Europe, including the Netherlands. However, since the CAREMA risk function predicts the risk of incident CHD, we only used part of the SCORE formulas that predicts the 10-year risk of CHD mortality. Nevertheless, because these SCORE functions predict CHD mortality instead of CHD incidence, the CAREMA risk function was also compared to the Framingham risk function which predicts the same endpoint. 10 For these comparisons, the original formulas and regression coefficients of these risk functions were applied to the population of the CAREMA cohort study.
Results
Baseline characteristics of the Dutch Cardiovascular Registry Maastricht (CAREMA) cohort study, 1987–1997
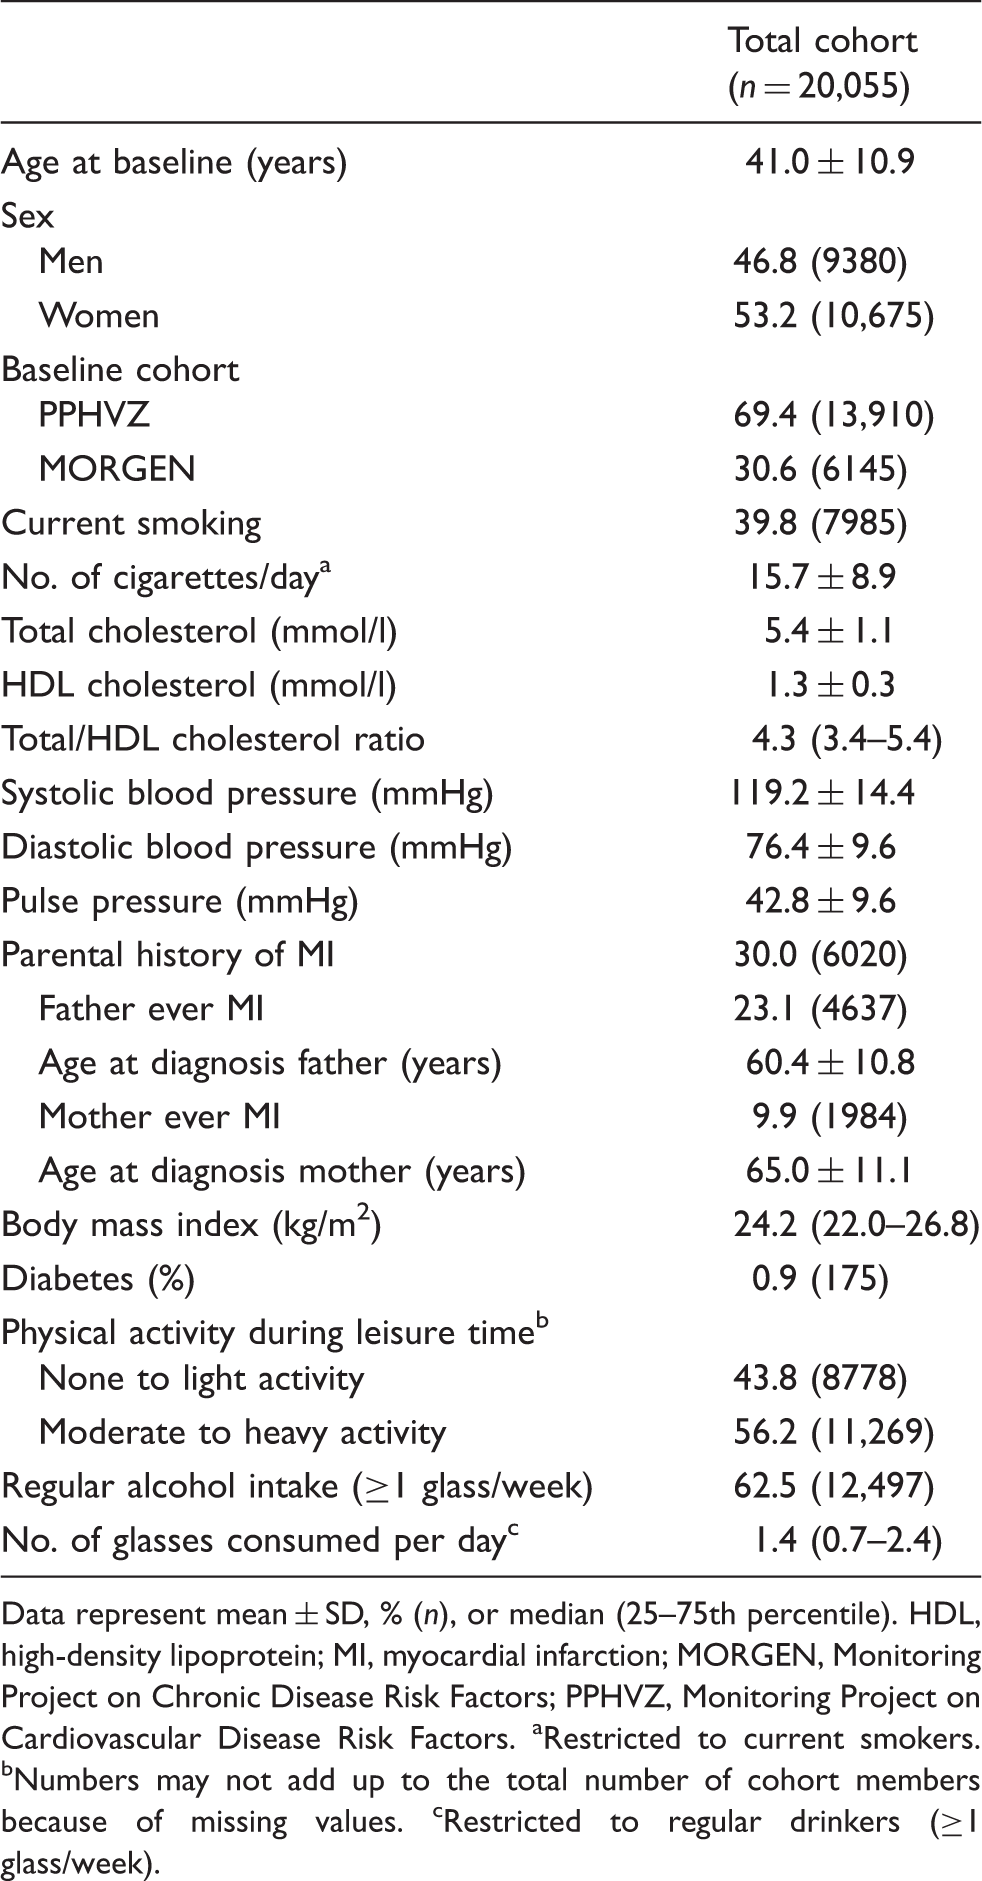
Data represent mean ± SD, % (n), or median (25–75th percentile). HDL, high-density lipoprotein; MI, myocardial infarction; MORGEN, Monitoring Project on Chronic Disease Risk Factors; PPHVZ, Monitoring Project on Cardiovascular Disease Risk Factors. aRestricted to current smokers. bNumbers may not add up to the total number of cohort members because of missing values. cRestricted to regular drinkers (≥1 glass/week).
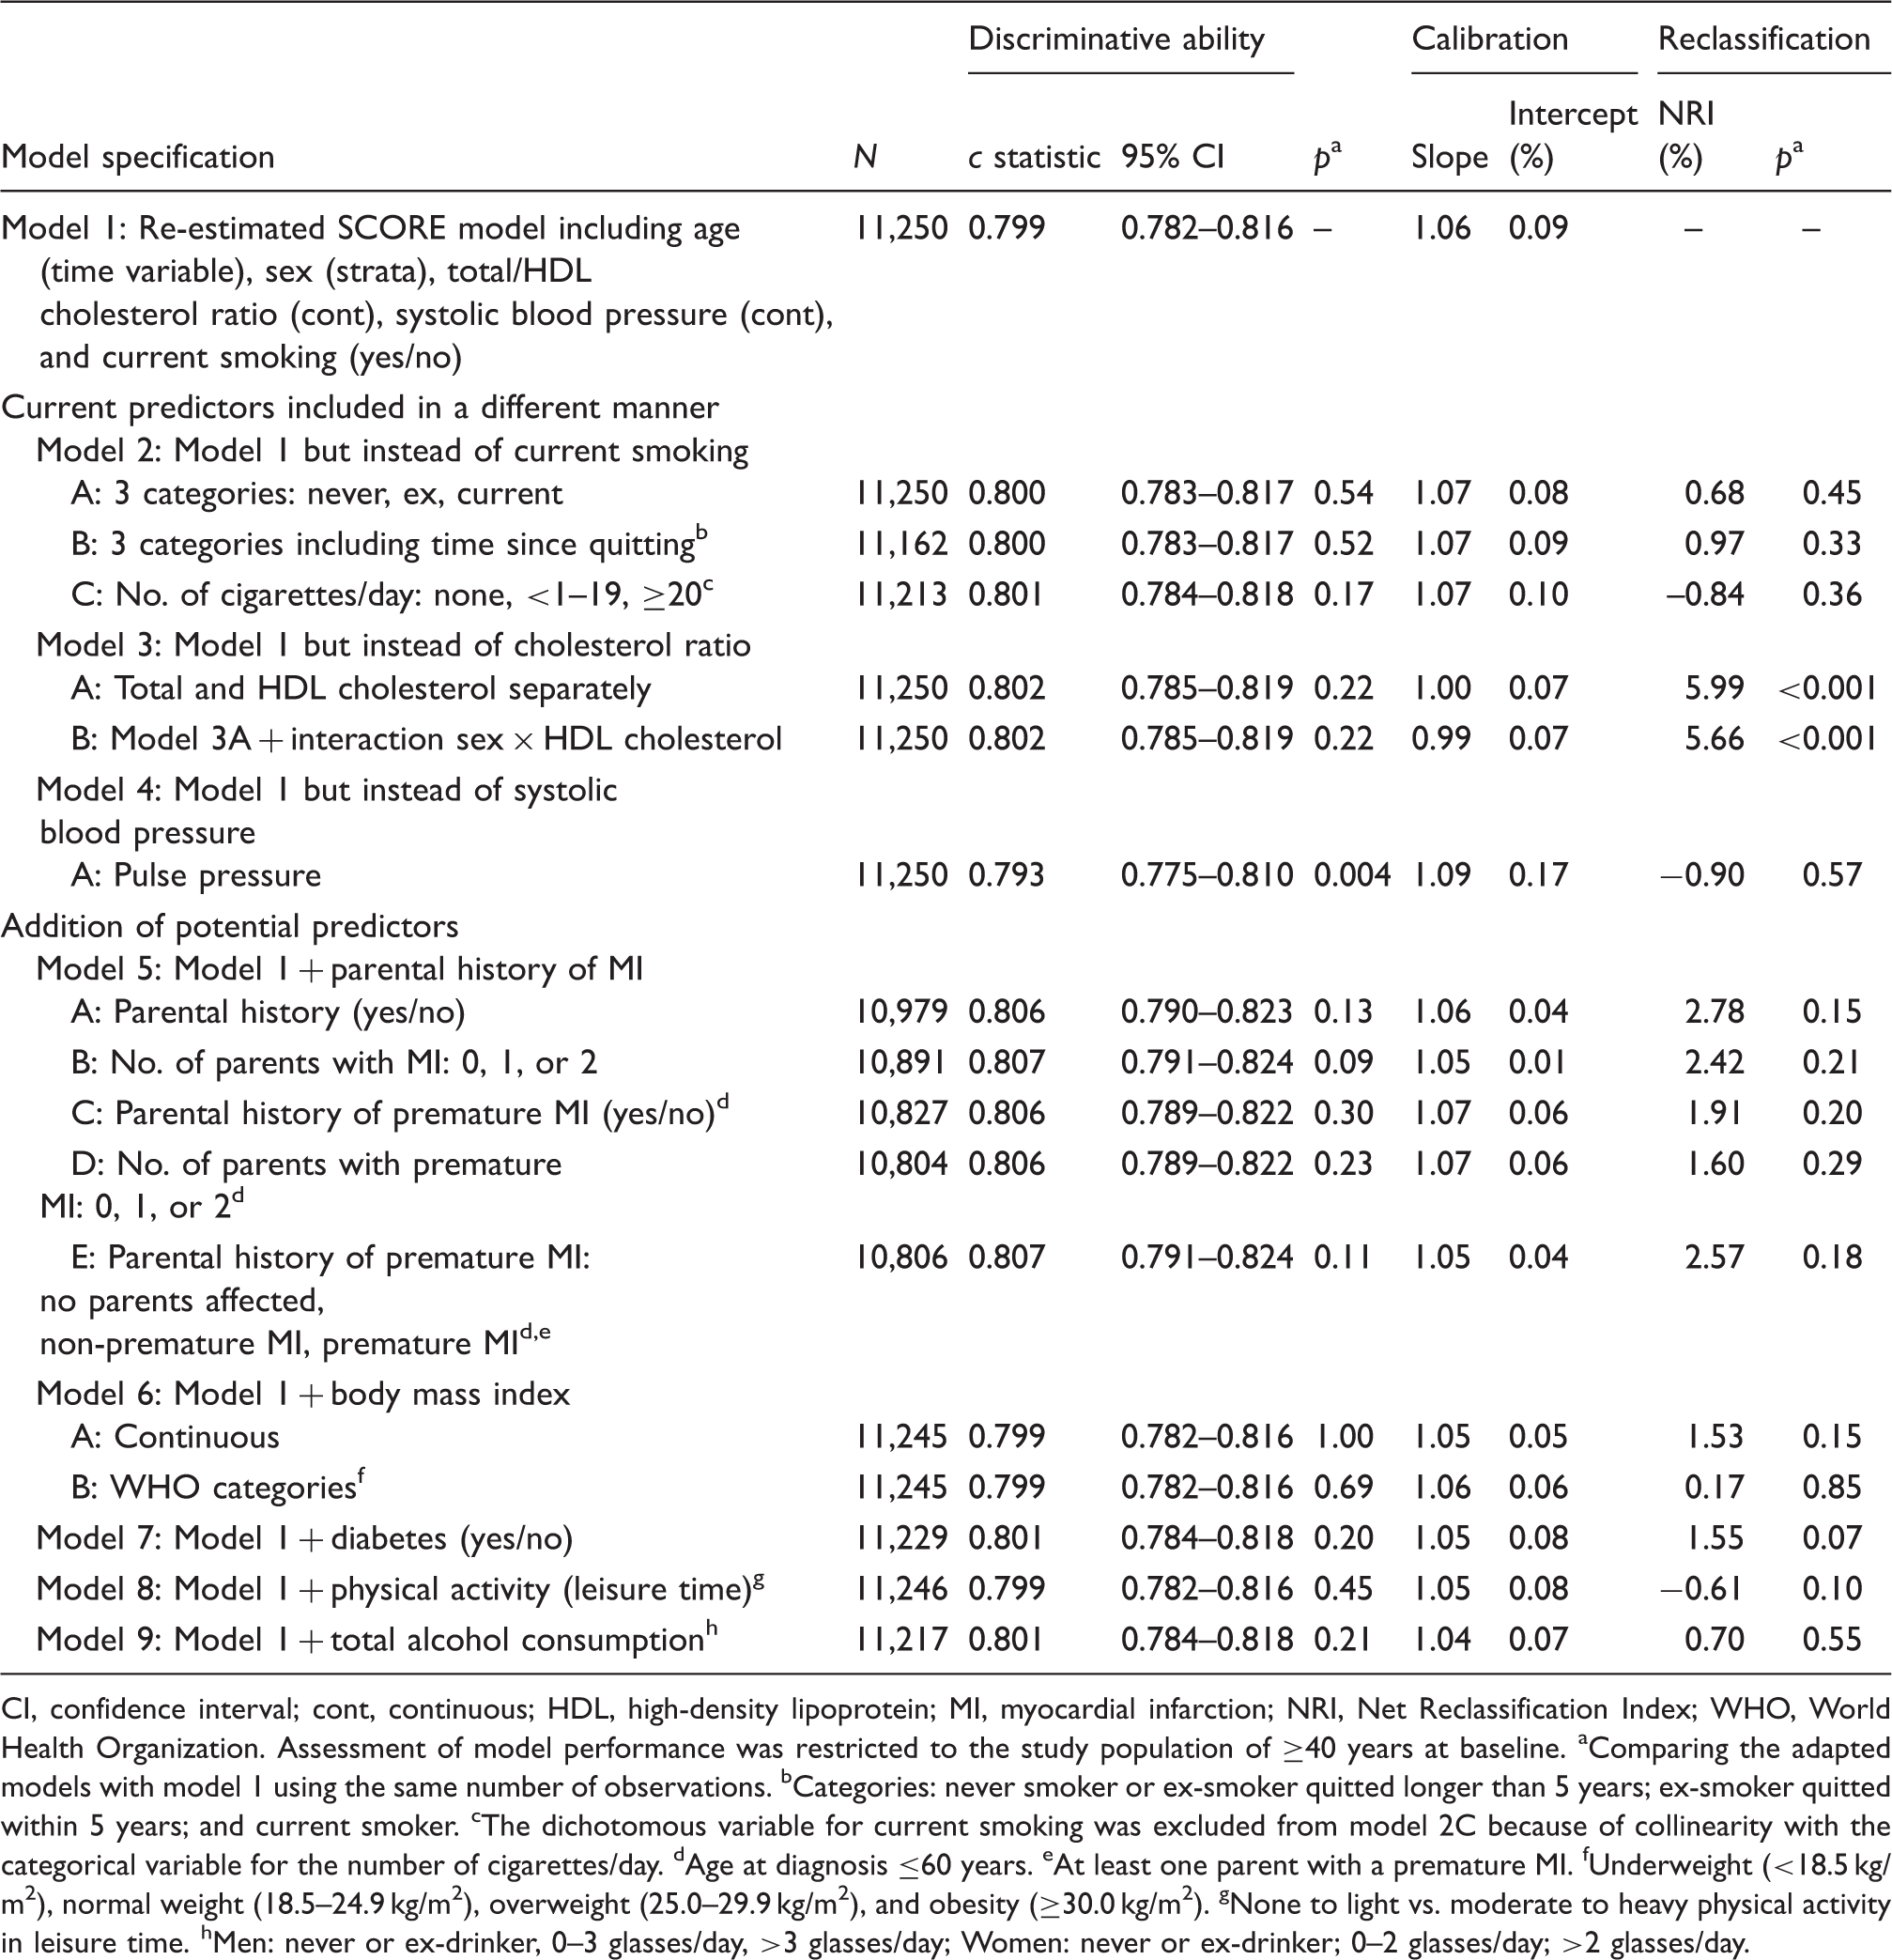
Our re-estimated SCORE risk function had a c statistic of 0.799 (95% CI 0.782–0.816) (Table 2). The calibration slope and intercept were 1.06 and 0.09%, respectively. The model performance significantly decreased after including age as predictor instead of as time variable or using linear transformations for the continuous predictors (data not shown). Although the c statistic increased to 0.806 when parental history of myocardial infarction was added to the model, none of the changes significantly increased the c statistic (Table 2). Based on the NRI, however, replacement of the total/HDL cholesterol ratio by total and HDL cholesterol separately (Table 2, model 3A and 3B) improved model performance of the re-estimated SCORE function (p < 0.001). Furthermore, this change resulted in slightly better calibration compared with the re-estimated SCORE function (model 1). Including an interaction term between HDL cholesterol and sex (model 3B) did not improve the predictive value significantly compared with model 3A. Therefore, the simplest model is preferred. Thus, the CAREMA risk function consists of the following predictors: age in years (time variable), sex (strata), current smoking (yes/no), systolic blood pressure (continuous), total cholesterol (continuous), and HDL cholesterol (continuous). This risk function had a good discriminative ability (c statistic 0.802, 95% CI 0.785–0.819) and calibration (slope 1.00, intercept 0.07%). In Figure 1, the calibration plot and the ratio for predicted/observed risk for the CAREMA risk function are shown.
Calibration plot of the CAREMA risk function (slope 1.00; intercept 0.07%), including an overview of the predicted/observed risk ratio (restricted to the study population of ≥40 years at baseline). Changes in the performance of the re-estimated SCORE prediction model using individual data from the Dutch Cardiovascular Registry Maastricht (CAREMA) cohort study according to several adaptations CI, confidence interval; cont, continuous; HDL, high-density lipoprotein; MI, myocardial infarction; NRI, Net Reclassification Index; WHO, World Health Organization. Assessment of model performance was restricted to the study population of ≥40 years at baseline. aComparing the adapted models with model 1 using the same number of observations. bCategories: never smoker or ex-smoker quitted longer than 5 years; ex-smoker quitted within 5 years; and current smoker. cThe dichotomous variable for current smoking was excluded from model 2C because of collinearity with the categorical variable for the number of cigarettes/day. dAge at diagnosis ≤60 years. eAt least one parent with a premature MI. fUnderweight (<18.5 kg/m2), normal weight (18.5–24.9 kg/m2), overweight (25.0–29.9 kg/m2), and obesity (≥30.0 kg/m2). gNone to light vs. moderate to heavy physical activity in leisure time. hMen: never or ex-drinker, 0–3 glasses/day, >3 glasses/day; Women: never or ex-drinker; 0–2 glasses/day; >2 glasses/day.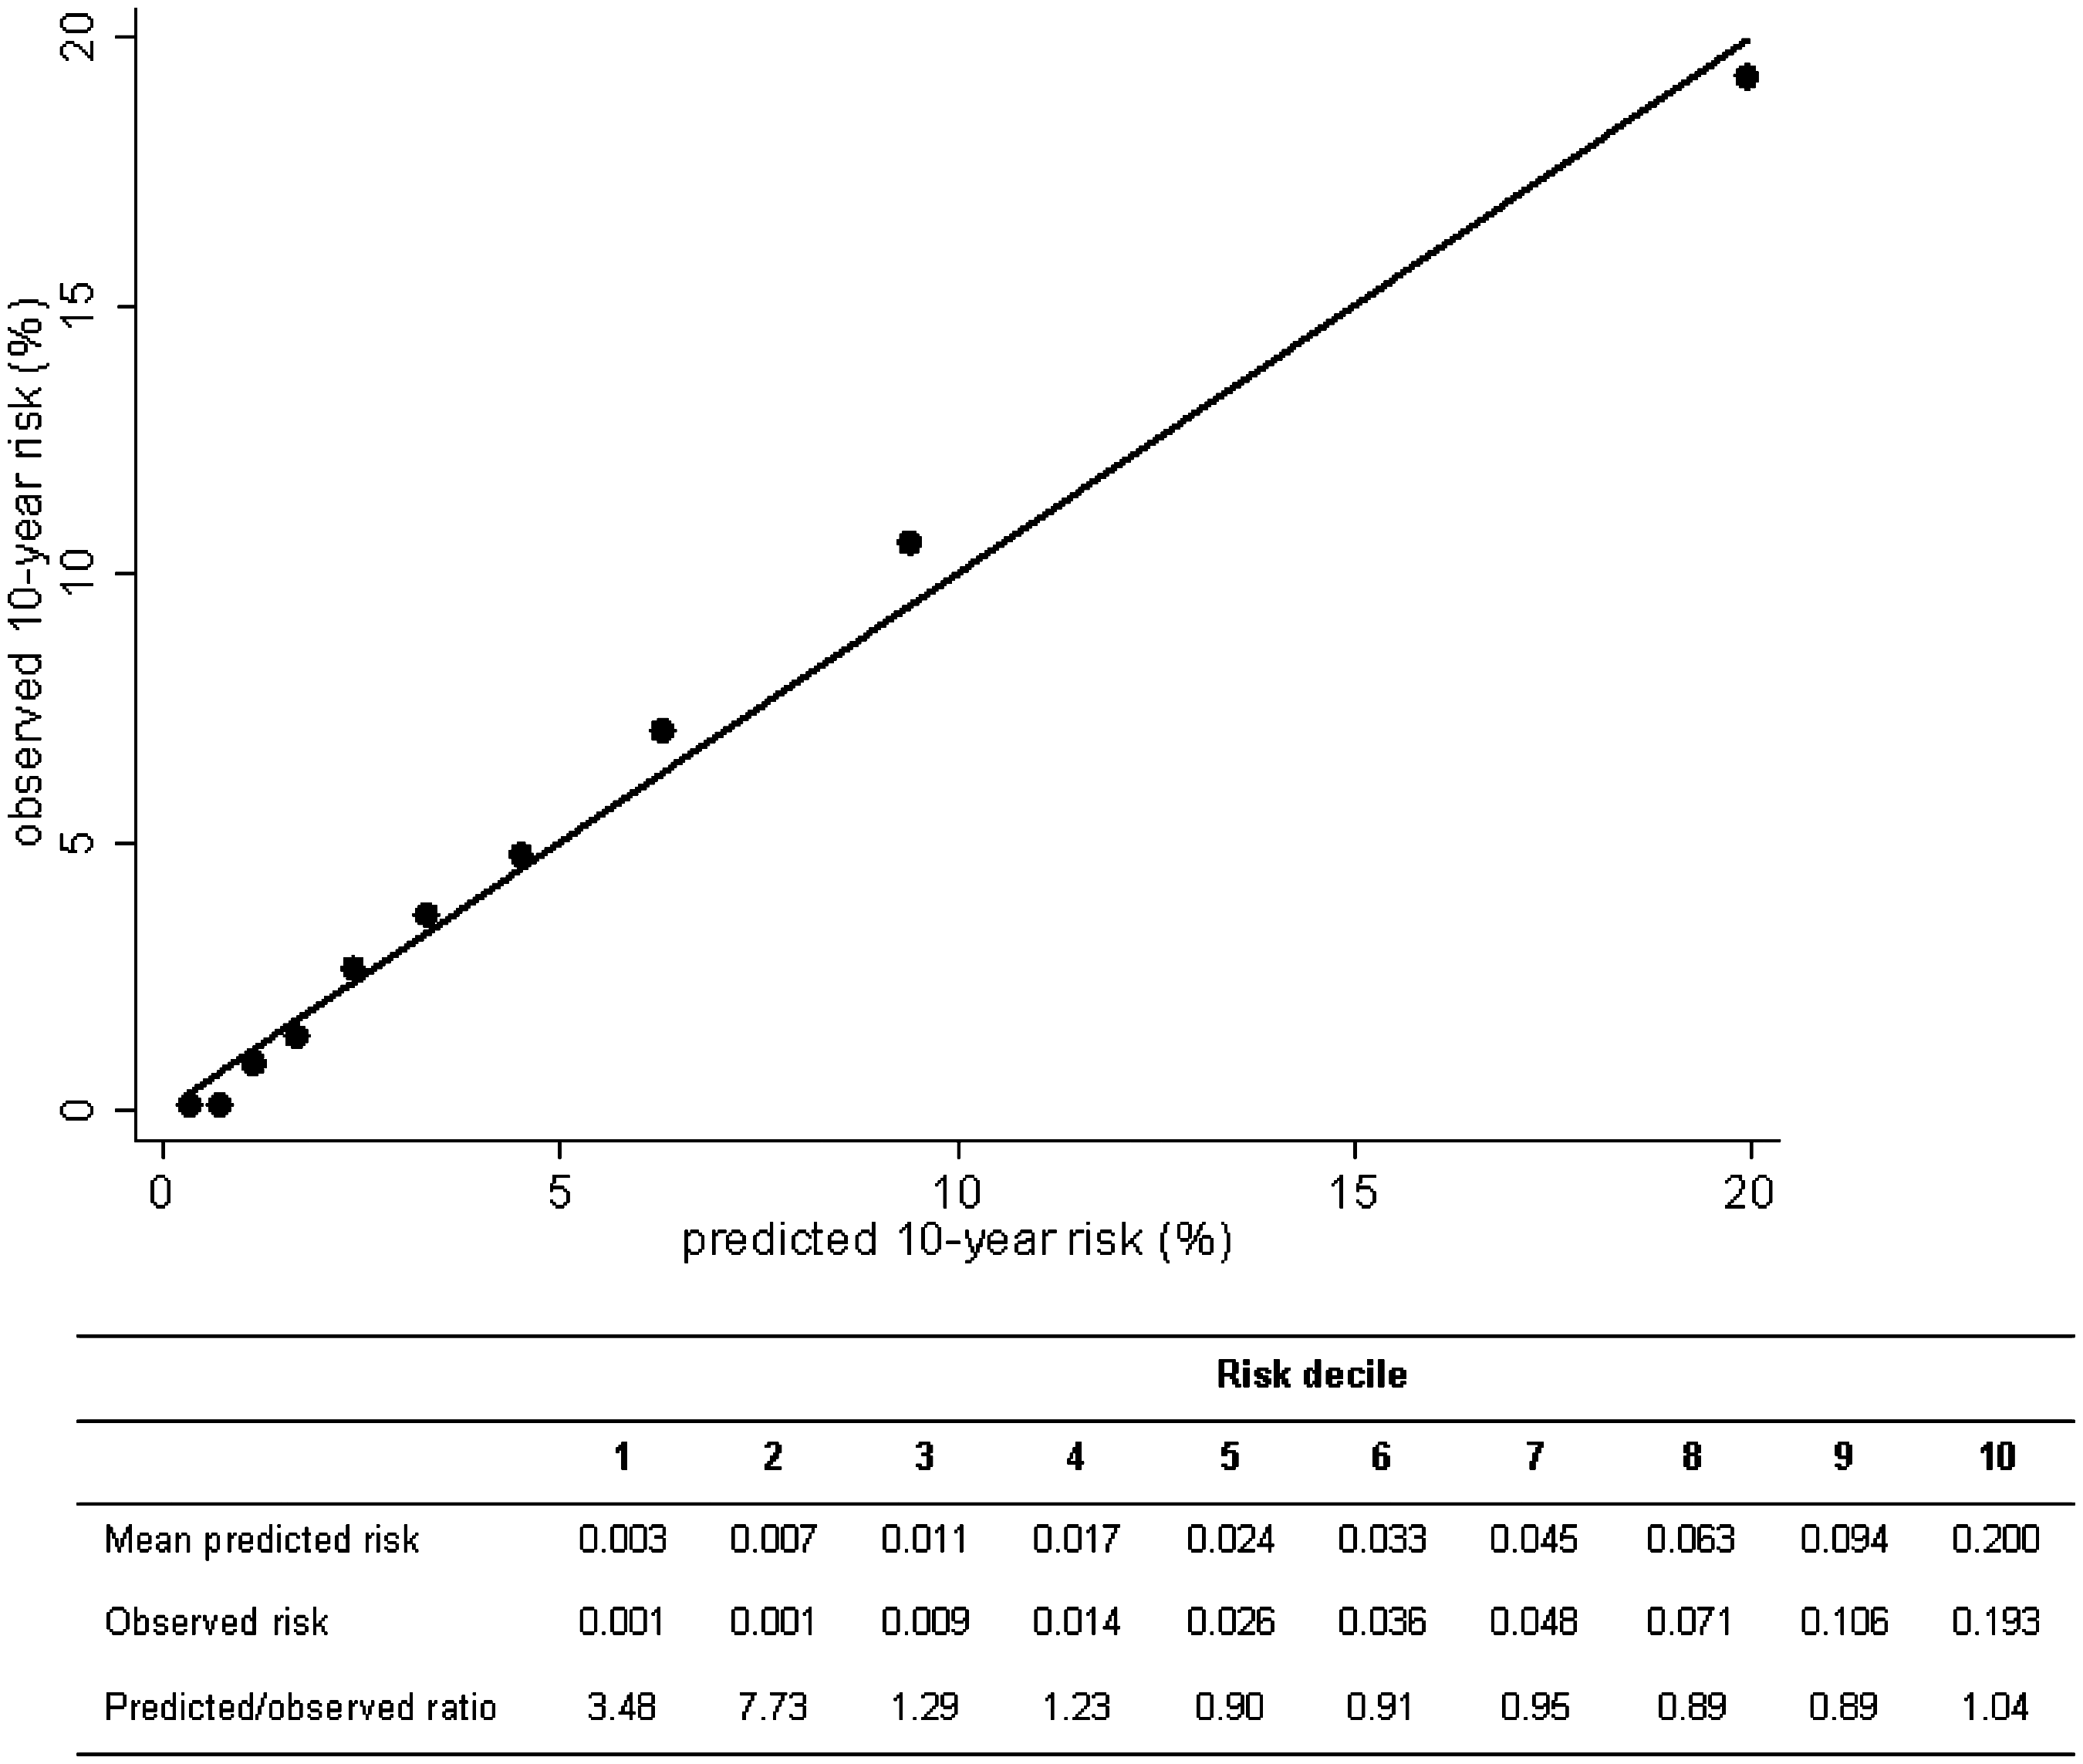
Comparison of the performance to predict coronary heart disease incidence between the Dutch Cardiovascular Registry Maastricht (CAREMA) risk function and existing risk scores in the CAREMA study population
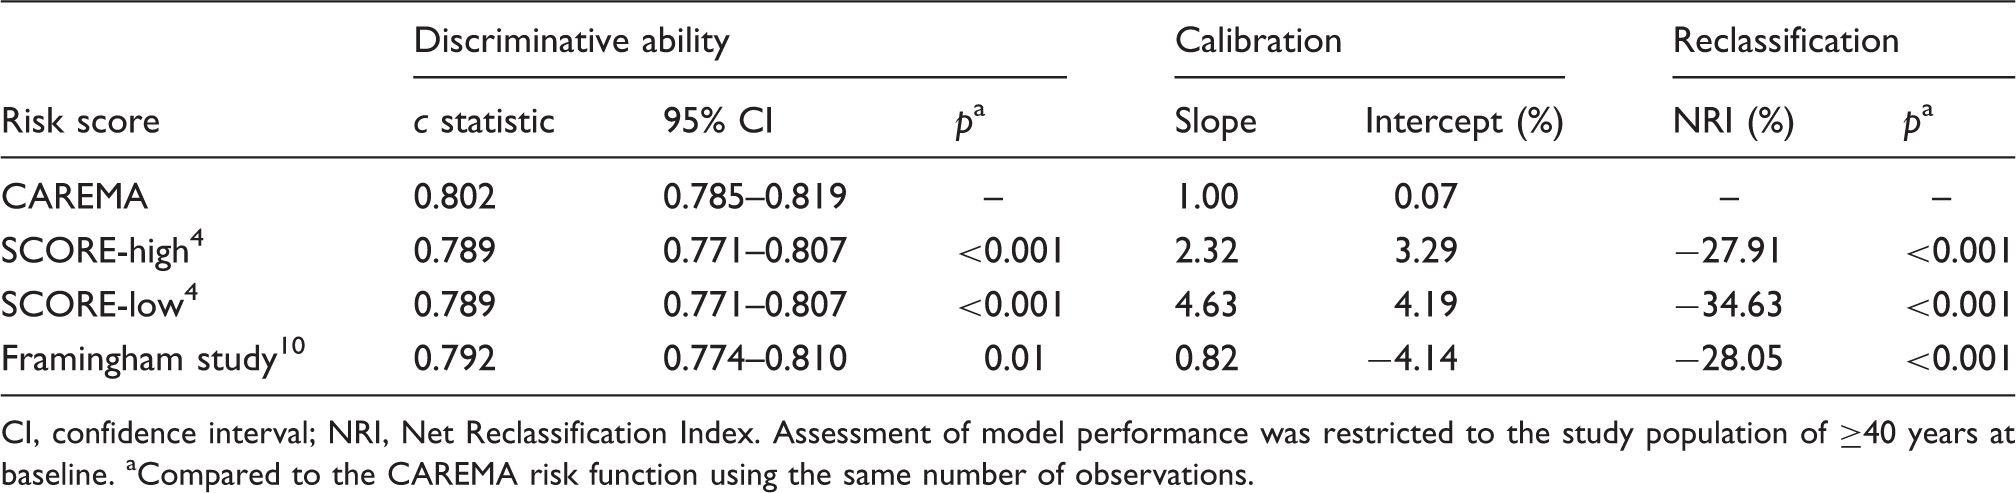
CI, confidence interval; NRI, Net Reclassification Index. Assessment of model performance was restricted to the study population of ≥40 years at baseline. aCompared to the CAREMA risk function using the same number of observations.
Discussion
After re-estimation of the SCORE risk function using individual data on risk factor levels and CHD incidence from the CAREMA cohort study, risk prediction of CHD incidence can be improved by separating the total/HDL cholesterol ratio into total and HDL cholesterol levels. The resulting CAREMA risk function classified 28% of the participants into a more appropriate risk category for CHD incidence compared with the Framingham risk score. Compared with SCORE-high and SCORE-low, the NRIs were 28% and 35%, respectively, which can largely be explained by the difference in disease outcome.
The SCORE risk function calculates the 10-year risk of CVD mortality only. 4 In practice, however, there is at least equal interest in the prevention of non-fatal CVD. Therefore, the endpoint of the SCORE function was extended to include also incident non-fatal CHD cases in this study. In the CAREMA cohort study, hospital-based data on non-fatal CHD events were collected in an extensive manner so the cardiological follow-up is expected to be nearly complete and misclassification of the disease is expected to be low. 37 On the other hand, the endpoint definition had to be restricted to the incidence of CHD instead of CVD, as accurate data on other CVD events such as stroke were not available from the cardiology register. Nevertheless, this difference in endpoint has contributed to the high percentages of both cases and non-cases shifting to a higher risk category when the CAREMA function was used instead of SCORE-high or SCORE-low, while none of the participants were reclassified into a lower risk category (Appendix). For CHD incidence, however, these higher predicted risks are more appropriate. In addition, higher cut-off points for risk stratification are used in the prevention of CVD incidence than of CVD mortality. 14
In the present study, only a small proportion of the study population reported the use of medication for high blood pressure (4.5%) and/or high cholesterol level (0.5%) at baseline. Among previous risk scores studies, only three1,2,11 evaluated blood pressure-lowering medication as potential predictor, of which two studies actually included it in their risk function.1,11 In the present study, systolic blood pressure predicted the CHD risk similarly in participants with and without blood pressure-lowering medication (p interaction = 0.07). No information was available about the start of medication use during the follow-up period. Because medication use may prevent or postpone the occurrence of CHD, inclusion of participants who started to use medication between baseline and end of follow-up may have led to an underestimation of the predicted risk. 38
Many studies found that adding risk factors to current risk scores resulted in no or only small improvements in risk prediction as assessed by the area under the receiver operating characteristic curve (equivalent to the c statistic). 19 – 27 This estimate, however, may be insensitive to detect clinically relevant improvements in risk prediction when the traditional risk factors are already included.28,39 Therefore, in addition to the c statistic, the NRI can be estimated which is probably better qualified for this purpose. 28 Most changes evaluated in this study did not significantly improve risk prediction, regardless whether the c statistic or NRI was used. However, based on the NRI, separating the cholesterol ratio into total and HDL cholesterol levels resulted in a small but significant improvement in risk prediction by the re-estimated SCORE function (NRI 6.0%). This was also reported in a recent publication by the SCORE investigators, 36 although they found a lower NRI (3.8%).
In primary practice in the Netherlands, the Framingham risk score has been used for CVD prevention in the past, while it is nowadays replaced by the SCORE risk charts. In the present study population, the Framingham risk score overestimated the 10-year absolute risk of CHD, as was also found in other studies. 40 This can be explained by the higher CHD incidence and mortality and the higher prevalence of risk factors at the time the Framingham risk score was developed. Because of this, the SCORE project developed risk functions for high- and low-risk regions based on European data, but predicted the 10-risk of fatal CVD instead of total CVD. Although SCORE-low can be used quite well to predict the risk of CVD mortality in the Netherlands, 41 the results of our study show that both SCORE-high and SCORE-low are inappropriate to predict the 10-year risk of CHD incidence. As expected, the CAREMA risk function performed better as it is especially developed to predict this endpoint. Nevertheless, the CAREMA function also performed better than the Framingham risk score, which predicts the same endpoint. The CAREMA function, however, has a home advantage as its performance is evaluated in the population in which the function is developed. Although the CAREMA function may be a useful tool to predict the 10-year risk of CHD incidence in the Netherlands, its performance has first to be validated externally as well.
In conclusion, a re-estimated SCORE risk function with total and HDL cholesterol separately instead of the cholesterol ratio can be used for the risk prediction of CHD incidence in this Dutch population. Although the CAREMA risk function which includes these changes performed better than the SCORE and Framingham risk function in this study population, external validation of the function is necessary before use in practice.
Footnotes
Acknowledgements
The authors wish to thank D Kromhout for supervision of the PPHVZ project and the MORGEN project steering committee [HB Bueno de Mesquita, HA Smit, WMM Verschuren, JC Seidell (project leader)], epidemiologists and field workers of the Municipal Health Service in Maastricht for their contribution to baseline data collection and those involved in the logistics management (A Jansen, J Steenbrink) and the data management (A Blokstra, A van Kessel, P Steinberger, E den Hoedt, I Toxopeus, J van der Laan). The authors further wish to thank D Jaspers, A Hilton, V Visser, P Erkens, S Philippens, J Bremen, B Bleijlevens, T van Moergastel, and S van de Crommert for assistance in clinical data collection. The authors thank Dr AP Fitzgerald and Dr MT Cooney for providing more detailed information on the SCORE coefficients. Statistics Netherlands is acknowledged for providing data on causes of death.
Funding
This work was supported by CAPHRI School for Public Health and Primary Care. The Monitoring Project on Cardiovascular Disease Risk factors (PPHVZ) and the MORGEN study were financially supported by the Ministry of Public Health, Welfare and Sports of the Netherlands.
Conflict of interest
None declared.
References
Supplementary Material
Please find the following supplemental material available below.
For Open Access articles published under a Creative Commons License, all supplemental material carries the same license as the article it is associated with.
For non-Open Access articles published, all supplemental material carries a non-exclusive license, and permission requests for re-use of supplemental material or any part of supplemental material shall be sent directly to the copyright owner as specified in the copyright notice associated with the article.