
Abstract
Keywords
Introduction
A large proportion of cardiovascular disease (CVD) risk can be explained by simple modifiable classic risk factors such as abnormal apolipoprotein levels, smoking, and hypertension but they cannot fully explain the distribution of risk in the general population. Primary prevention guidelines for CVD treatment rely on defining thresholds of risk in the population, with preventive therapies aimed at those identified to be at high risk (>20% 10-year risk of CVD) while those at low risk (0⊟5%) can avoid treatment and its potential side effects.1,2 Although, a substantial part of the population attributable fraction of CVD risk occurs among those at intermediate risk (5⊟20%). However, prevention strategies aimed at all in the intermediate risk group may be too costly. More accurate predictions across a range of risk thresholds are needed and may help to reduce the burden of disease more efficiently. Several risk scores exist (e.g. Framingham risk score, 3 PROCAM 4 ) but the applicability and refinement of these risk score models to local populations can be complicated by variations in absolute risk, background characteristics of populations, and methodological and statistical challenges.5,6 Decision making could be guided by additional information from emerging risk factors such as biomarkers, arterial function tests, or imaging tests of atherosclerosis.7,8 Although many studies have shown promising associations between individual biomarkers and cardiovascular risk, their ability to enhance the performance of risk algorithms is modest and contested.9,10 This has stimulated interest in combining multiple biomarkers together into novel risk scores to improve risk prediction. 11 − 13
More precise risk estimation is an important part of assessing the clinical utility of novel risk scores but the value of this information depends on how it is used to guide therapy and improve clinical outcomes. Recently there have been important contributions to both the statistical and clinical literature, expounding a more informative approach to the choice and use of prognostic models that could be used to tailor treatment in different patient groups.14,15 Essentially, they remind us to consider at least four complementary aspects of model assessment, namely discrimination, calibration, external validation, and risk re-stratification.1,15,16 None of these characteristics alone will provide a sufficient demonstration of clinical utility. 17 Decision analysis can assess the clinical value of a model and improve standard statistical performance measures by incorporating costs and benefits. 18 There are two general problems associated with applying traditional decision-analytic methods to prediction models. First, they require additional data, such as costs or quality-adjusted life years, often not included in the validation dataset. The second problem is that decision analysis requires a binary result from the evaluated test. Prediction models often provide a result in continuous form, such as the probability of an event from 0% to 100%. To evaluate such a model using decision-analytic methods, the continuous result must be dichotomized (or stratified) at a given threshold and then evaluated for a wide range of such thresholds. To overcome these two difficulties, the novel technique of decision curve analysis was developed. Decision curve analysis attempts to represent a range of threshold probabilities where a patient might opt for treatment depending on how they weigh up the relative harms of false positive and false negative results. 18
The MORGAM project, a prospective population-based study, recently evaluated 30 biomarkers of CVD in 10,466 initially healthy individuals and developed a risk score based on three biomarkers for the prediction of CVD for primary prevention. 19 This biomarker score combined high-sensitivity C-reactive protein (hsCRP), troponin I, and N-terminal pro-B-type natriuretic peptide (Nt-proBNP), with traditional risk factors, to improve 10-year absolute risk estimation for non-fatal and fatal CVD events in middle-aged European populations. 19 The validation of the prediction model demonstrated significant improvement in discrimination (C index improvement from 0.67 to 0.7 with biomarkers, p = 0.004) and risk reclassification (with net reclassification improvement (NRI) 11%, p = 0.0008). 19
In this paper, we wanted to assess this model’s performance using a decision curve approach, a method which complements the NRI in risk reclassification but can add to the assessment of the model’s utility by incorporating clinical consequences. This relatively new measure has not yet been widely used in practice 15 and could aid in the assessment of our prognostic model for CVD.
Methods
Cohort description
The multinational MONICA, Risk, Genetics, Archiving, and Monograph project (MORGAM, www.ktl.fi/morgam) is a population-based prospective study of coronary events initially established to develop cardiovascular risk scores based on classic risk factors and to determine whether the addition of genetic or biomarker variation could improve the risk score. The project objectives and detailed descriptions of cohorts have been published elsewhere.20,21 The endpoint is the first occurrence of a major cardiovascular event during the follow-up, which includes the first fatal or nonfatal definite or possible myocardial infarction or coronary death, unstable angina, cardiac revascularization, ischaemic stroke, or unclassifiable death. FINRISK and PRIME Belfast are two of 36 MORGAM cohorts which are standardized according to MORGAM criteria. The FINRISK97 cohort recruited men and women aged 25⊟74 years in 1997. 22 The PRIME Belfast cohort recruited men aged 50⊟59 years during 1991⊟1994. 23 In both studies cardiovascular events were classified according to standard criteria, 21 participants with a documented or self-reported history of a major cardiovascular event (e.g. hospitalized unstable angina, coronary bypass grafting, angioplasty) were excluded. Approval from the local research ethics committee was obtained and all subjects gave written informed consent. We examined 30 biomarkers and evaluated the discriminative ability of single biomarkers to improve risk prediction in the FINRISK and PRIME Belfast cohorts. 19 A combination of three biomarkers performed better than any single biomarker at improving discrimination and calibration in the discovery set consisting of FINRISK men. These three biomarkers had a low level of correlation and represent different biological pathways; NT-proBNP is a marker of vascular function and neurohormonal activity, hsCRP is an inflammatory marker associated with plaque development and progression; and troponin I is a marker of myocardial injury. We tested the performance of this score in an independent sample PRIME Belfast men and FINRISK women which were not used for discovery of predictors and found it also improved prediction (external validation). Detailed analytical description of the hsCRP, Nt-proBNP, and troponin I measurements are reported elsewhere. 19 A contemporary sensitive troponin I with a 10% coefficient of variation at the 99th population percentile was used. 19
Statistical analysis
Missing biomarker data were handled using multiple imputation 24 using the WinBUGS software 25 with outcome information included in the imputation model to avoid attenuation of estimated effects in later analyses. 26 Due to their highly skewed distributions, troponin I, hsCRP, and Nt-ProBNP values were cubic root transformed in the analyses. We excluded participants on cholesterol medication at baseline from analysis.
Decision curve analysis is a novel method of evaluating prediction models which combines accuracy measures (sensitivity, specificity) and clinical applicability by considering the consequences associated with the test. 18 Consider this in terms of a clinician’s binary decision to treat or not to treat a patient given an estimated 10-year risk of a disease, denoted p. Assuming no treatment, the patient may or may not develop the disease. A person who would develop the disease and is recommended treatment is deemed a true positive; the utility of this denoted as a. A false positive is a patient who is recommended treatment, but who would not develop the disease, even without treatment; the utility in this case is called b. Similarly, define false negative and true negative for those given a decision not to treat, and let their potential outcomes be c and d respectively. Now a−c is the benefit of a correct decision to treat, while b−d is the cost of unnecessary treatment. The choice of utilities has to weigh factors such as unnecessary drug treatment, with the potential for a rare but serious side effect of statin therapy ⊟ rhabdomyolysis ⊟ and the lifetime psychological impact of high-risk group inclusion. In the decision curve approach the risk threshold is determined by these utility measures. The expected outcome given treatment is pa+(1−p)b, and the expected outcome without treatment pc+(1−p)d. A threshold risk pt guiding the treatment decision is obtained from the equation where the two expected outcomes with and without treatment are set equal. This yields pt = 1/[(a−c)/(d−b)+1]. In other words, the optimal threshold pt depends only on the ratio of the benefit of a correct decision to treat and the benefit of avoiding unnecessary treatment. Risks higher than pt would mean that the treatment is expected to be beneficial. Following Vickers and Elkin, 18 we fix the scale of utility such that a−c = 1 for a positive decision. Then the net benefit from using treatment threshold pt for a population of n persons is (no. of true positives)/n × (a−c)⊟(no. of false positives)/n × (d−b) = (no. of true positives)/n⊟(no. of false positives)/n × (pt/(1−pt)), and hence depends on the utility measures only through the resulting threshold risk. In the decision curve approach, the prediction models are evaluated by presenting the net benefit values for a range of ratios of benefit of a correct decision to treat and the benefit of avoiding unnecessary treatment, or equivalently, for a range of risk thresholds.
We applied the decision curve approach to the FINRISK97 and PRIME Belfast data, comparing two prediction models. The classic risk factor model included blood pressure, high-density lipoprotein (HDL) cholesterol, non-HDL cholesterol (difference between total and HDL cholesterol), body mass index (BMI), daily smoking, and use of antihypertensive treatment at baseline, adjusted for age, sex, and area. We added the three biomarkers (hsCRP, troponin I, and Nt-proBNP) to the classic risk factor model to make the ‘biomarker model’. The risk estimates were calculated as 10-year cumulative incidences for the first CVD event, obtained from a competing risks survival model fitted for CVD and other (non-CVD) mortality. 27 The mortality was modelled using the same covariates as stated above. Proportions of true and false positives were calculated using the cumulative incidence function for CVD, following Vickers et al. 28 This approach also takes into account the censoring in time-to-event data. 28 Overfitting was avoided by calculating the risk estimates using 10-fold cross-validation. 29 The net benefit was presented as a decision curve, by plotting it over a range of threshold probabilities. Bootstrap resampling with 2500 replicates was used to obtain 95% confidence intervals for the difference in net benefit between the classic risk factor model and the biomarker model. All analyses were carried out using R 30 and its Survival library.
Results
Characteristics of the study cohorts
Following exclusion of individuals with prevalent CVD, there were 3753 men and 3986 women from FINRISK and 2524 men from PRIME Belfast used in the decision curve analysis. During follow-up, 320 men and 137 women in FINRISK and 259 men in PRIME Belfast experienced an incident fatal or non-fatal CVD event. In addition, there were 330 deaths due to causes other than CVD for men and women in FINRISK and 133 deaths for men in Belfast PRIME. The mean±SD age at baseline was 48.5 ± 13.6 years in men, 46.5 ± 12.9 years in women in FINRISK. In PRIME men it was 54.7 ± 2.9 years.
Cardiovascular prediction in FINRISK
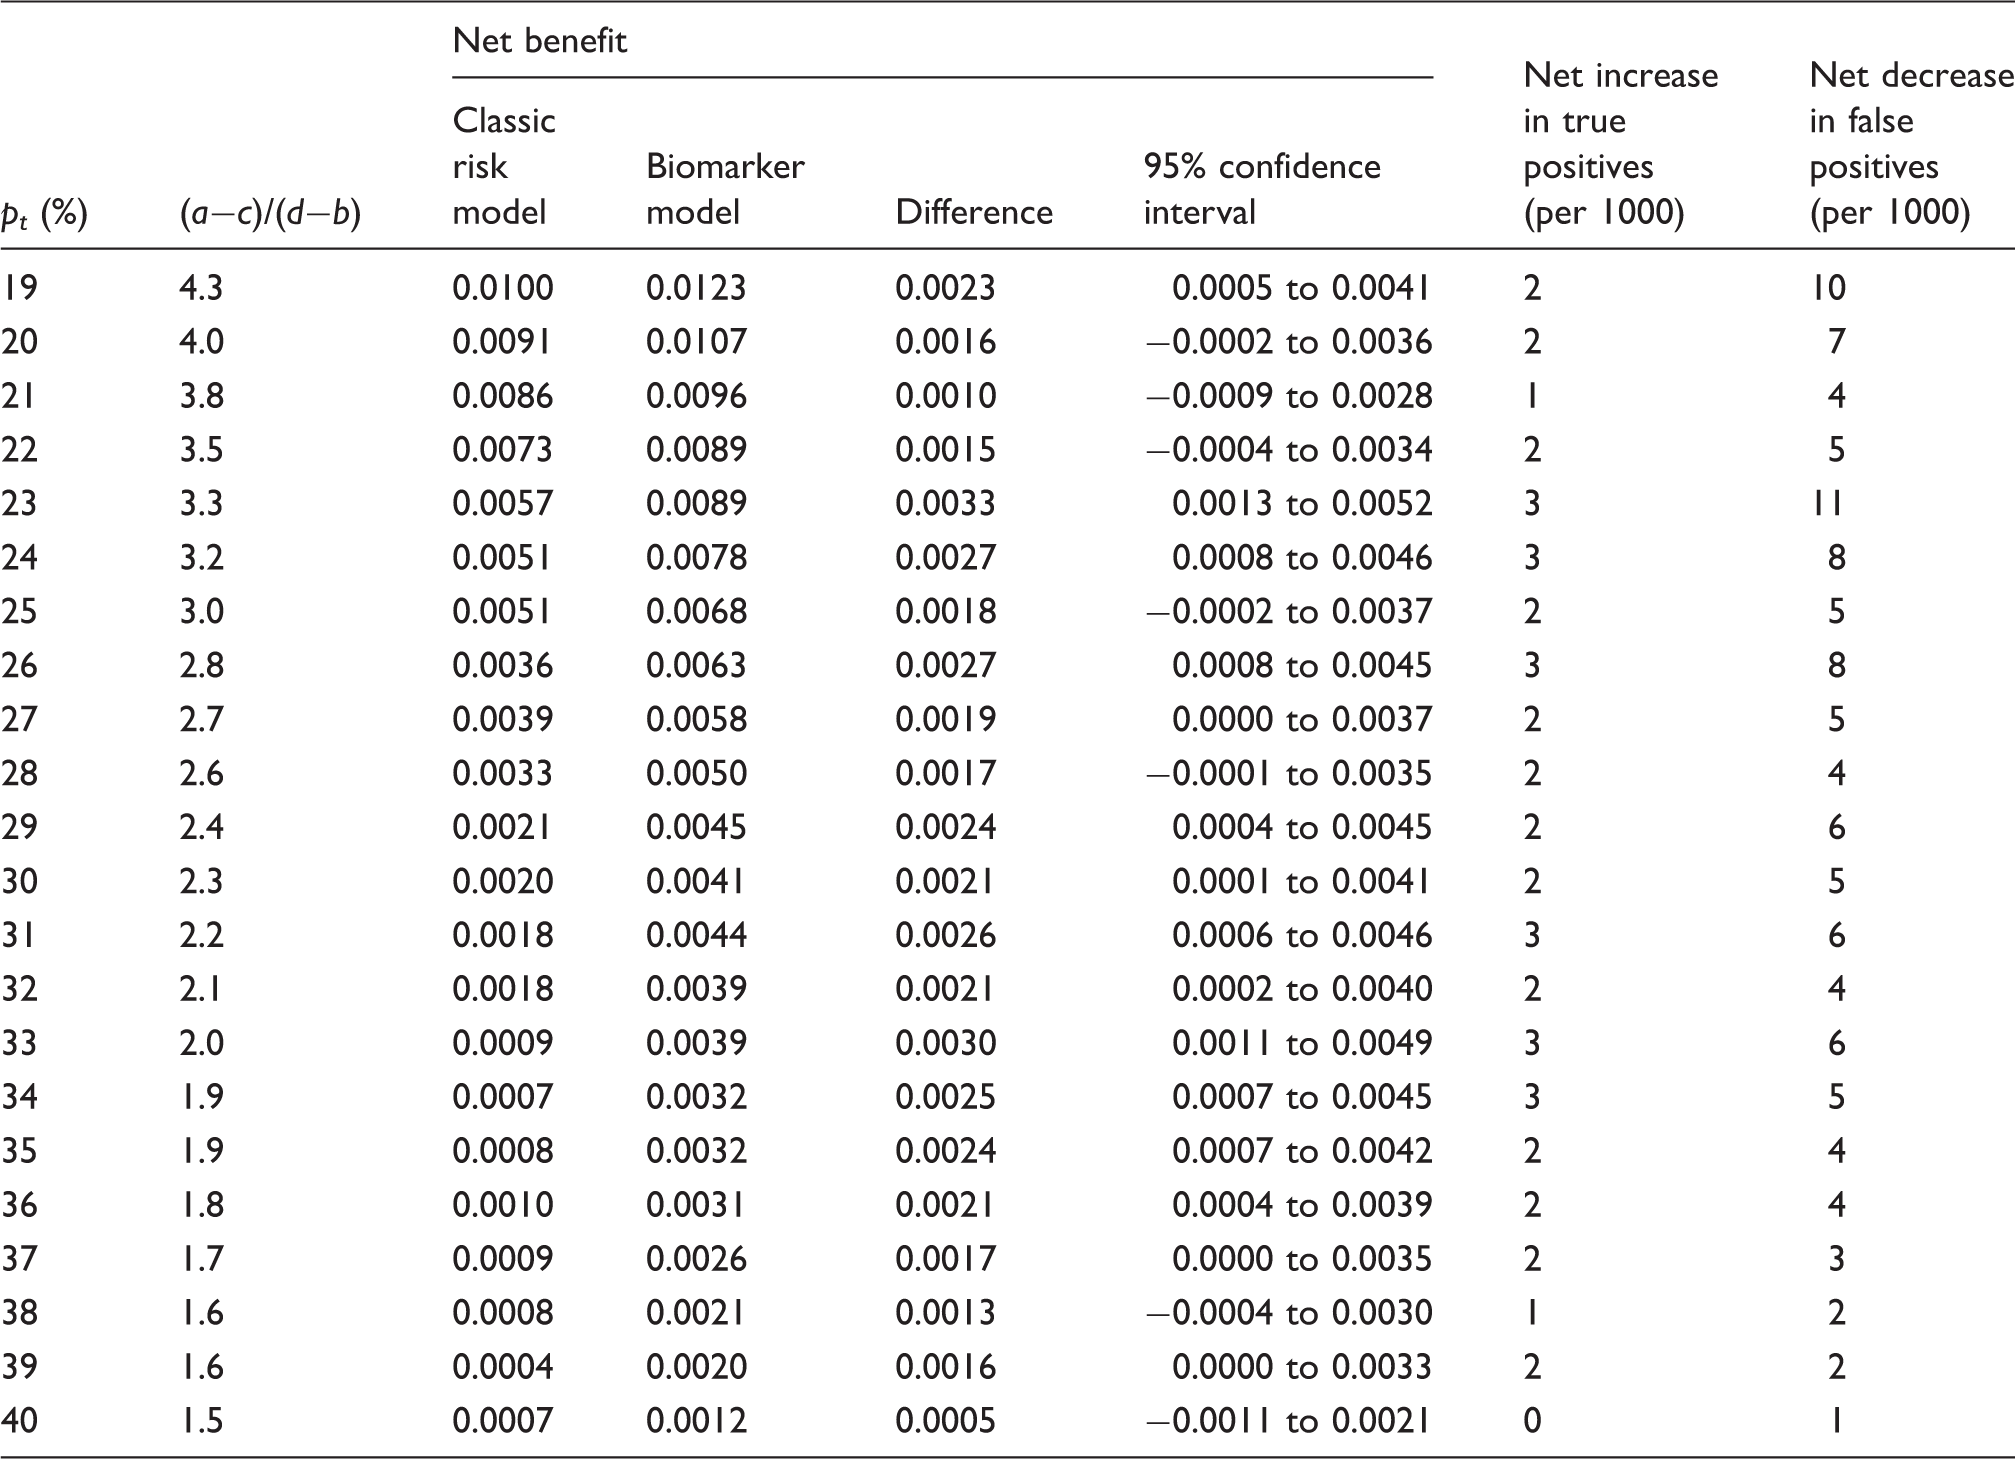
The decision curve graph for FINRISK, with net benefit plotted across a range of threshold probabilities from 1% to 100%, is presented in Figure 1. The baseline classic risk factor model is nested with the biomarker model so any differences between the two curves indicate the added effect of the biomarkers. Both prediction models are useful (in comparison to treat all and treat none strategies) over the risk threshold range of ∼5−40%. For thresholds higher than this (>40%), the models no longer provide meaningful discrimination. For low thresholds (<5%), the benefit from using a model does not differ from the treat all strategy. The biomarker model has a higher net benefit than the classic risk factor model across a range of relatively high threshold probabilities from 20% to 40%. This corresponds to a ratio of 1.5 : 4, for example pt = 20%, the benefit of a correct decision to treat is four times greater than the benefit of avoiding unnecessary treatment (Table 1). The lower graph in Figure 1 shows that collectively the net benefit difference is positive across this range with confidence intervals supporting a significant trend in the data. For example, using a risk threshold of 23%, the net benefit gain from using the biomarker model was 0.0033 (95% CI 0.0013⊟0.0052). This corresponds to a net decrease in the number of false positives of 11 per 1000 individuals and a net increase of 3 true positive cases of CVD per 1000 individuals (Table 1). In terms of clinical utility, use of the prediction model for a patient at pt = 23% would lead to the equivalent of 1.1% fewer treatments in patients not destined for an event without any increase in the number of false negatives. For the intermediate range (pt = 10⊟20%), the net benefit difference between the classic risk factor model and the biomarker model is marginal, with the curves largely overlapping.
Decision curve, plotting net benefit against risk threshold probability of cardiovascular disease relative to treat all or treat none for FINRISK men and women. Old model refers to classic risk factor model; new model refers to the biomarker model (high-sensitivity C-reactive protein, troponin I, N-terminal pro-B-type natriuretic peptide, and classic risk factors). Lower graph shows net benefit variation over risk distribution with 95% confidence intervals. Decision curve results for FINRISK97 men and women: comparison of the net benefit of cardiovascular disease prediction using the classic risk factor model and the biomarker model across a range of threshold probabilities (pt) for FINRISK97 men and women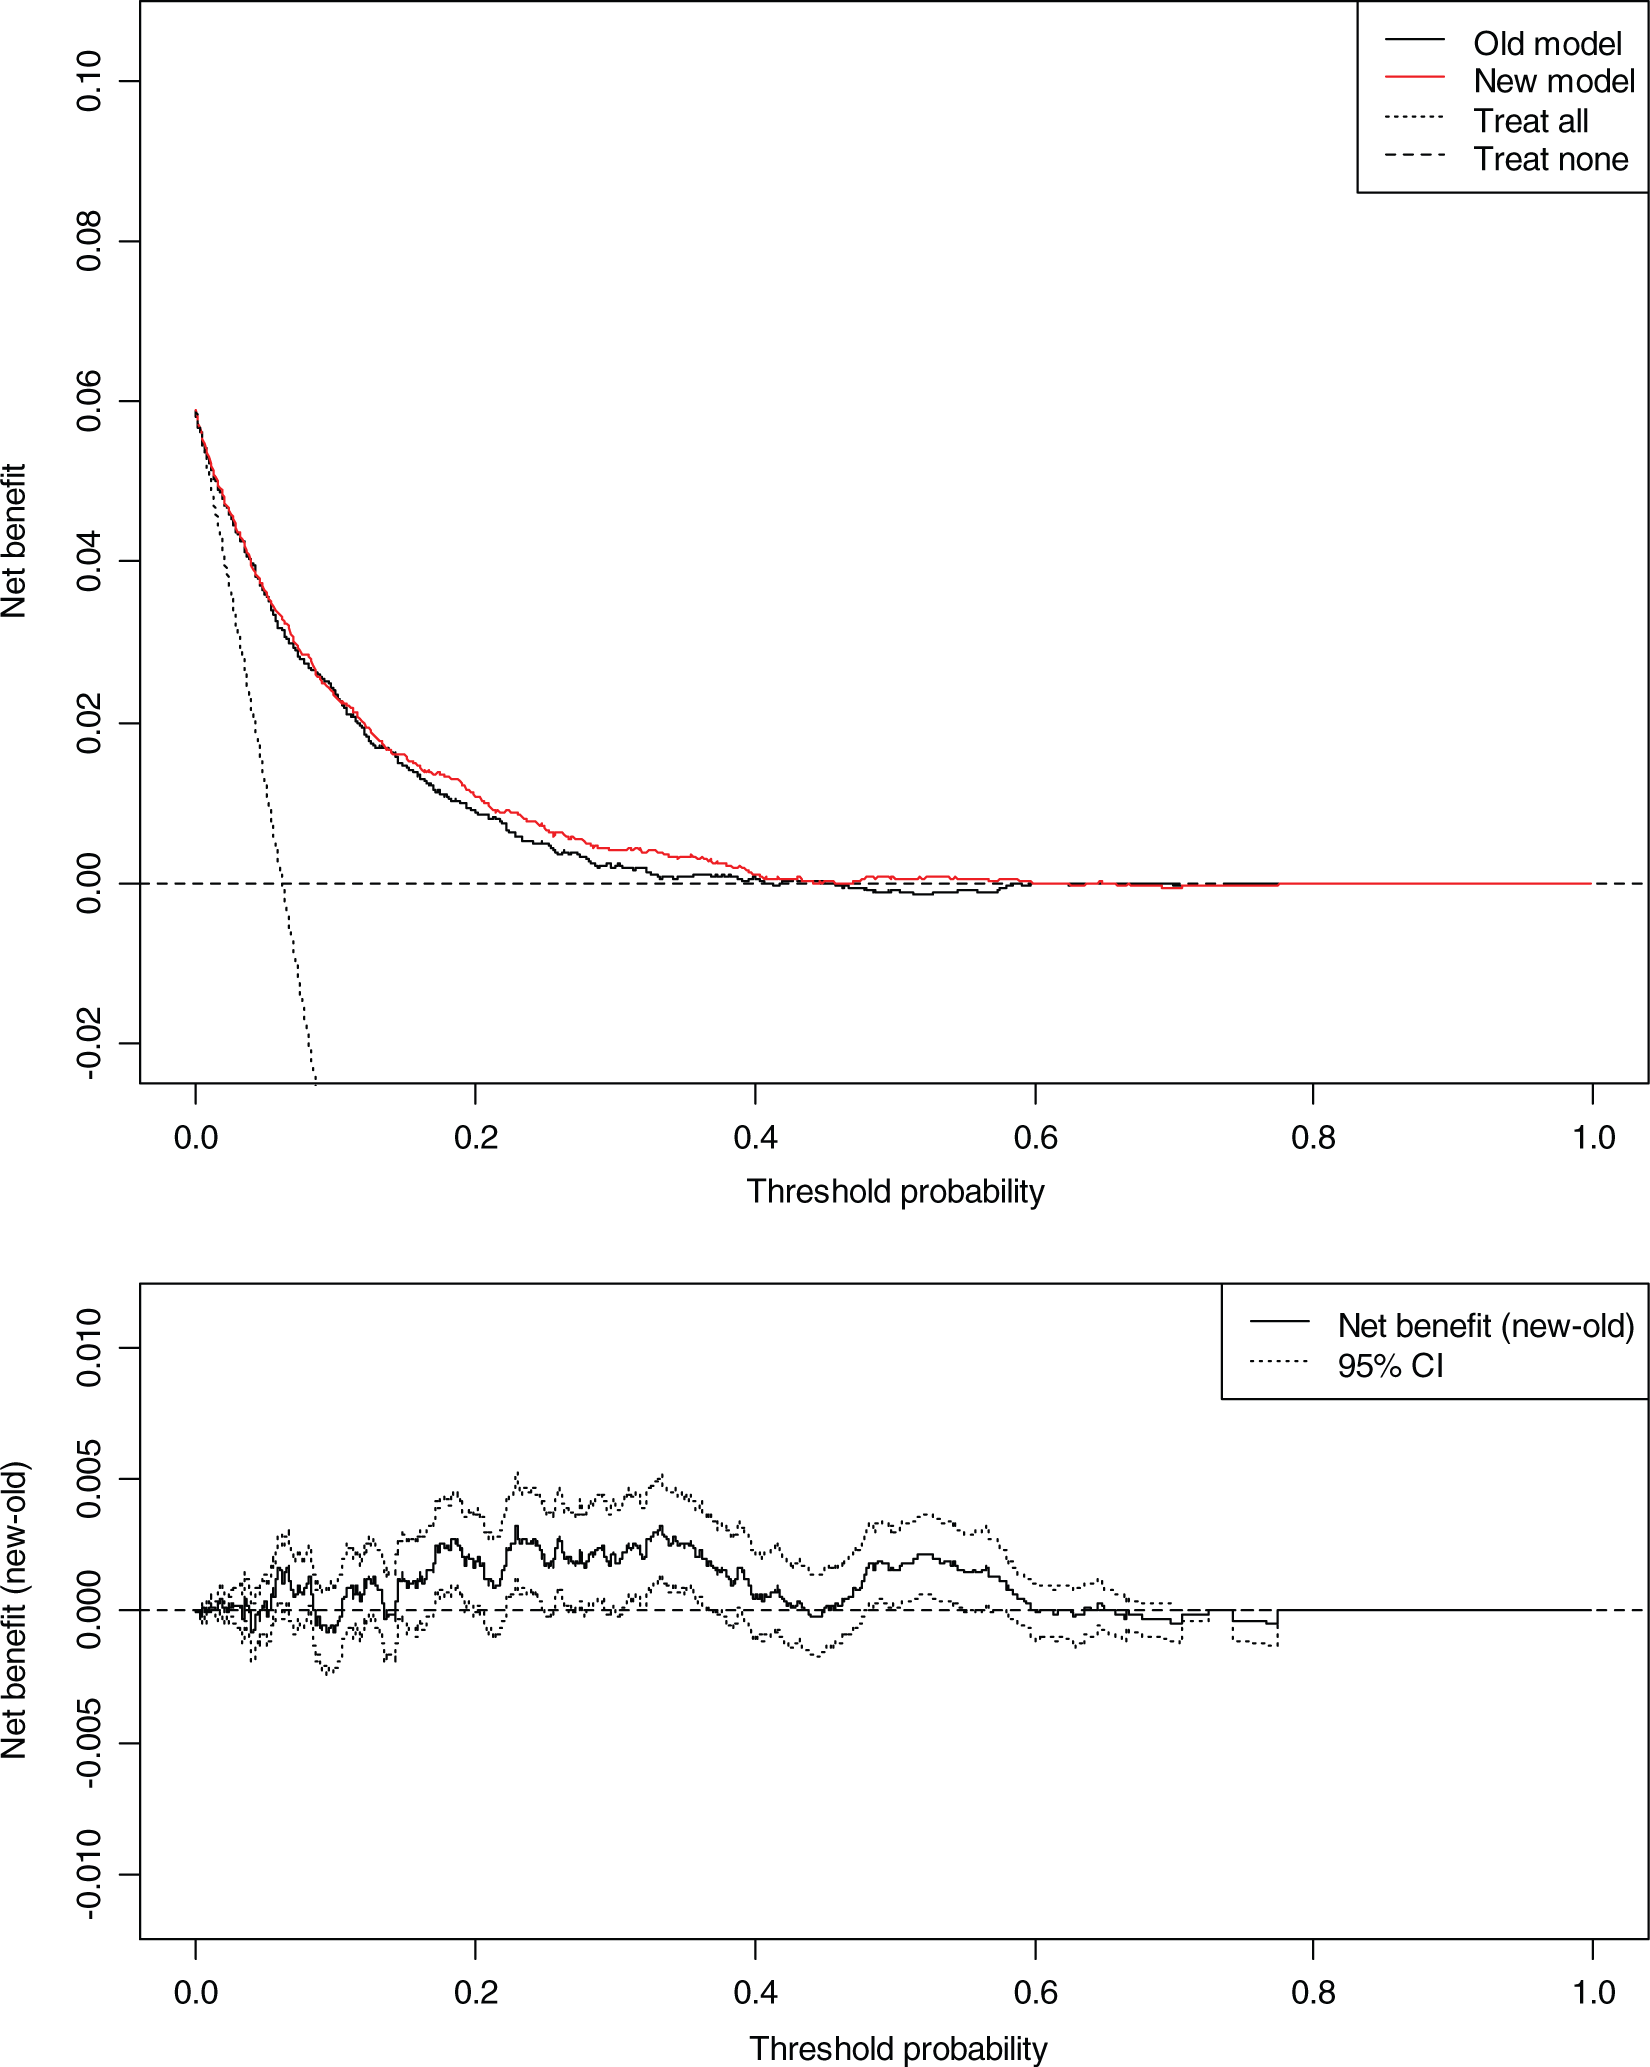
Cardiovascular prediction in PRIME Belfast
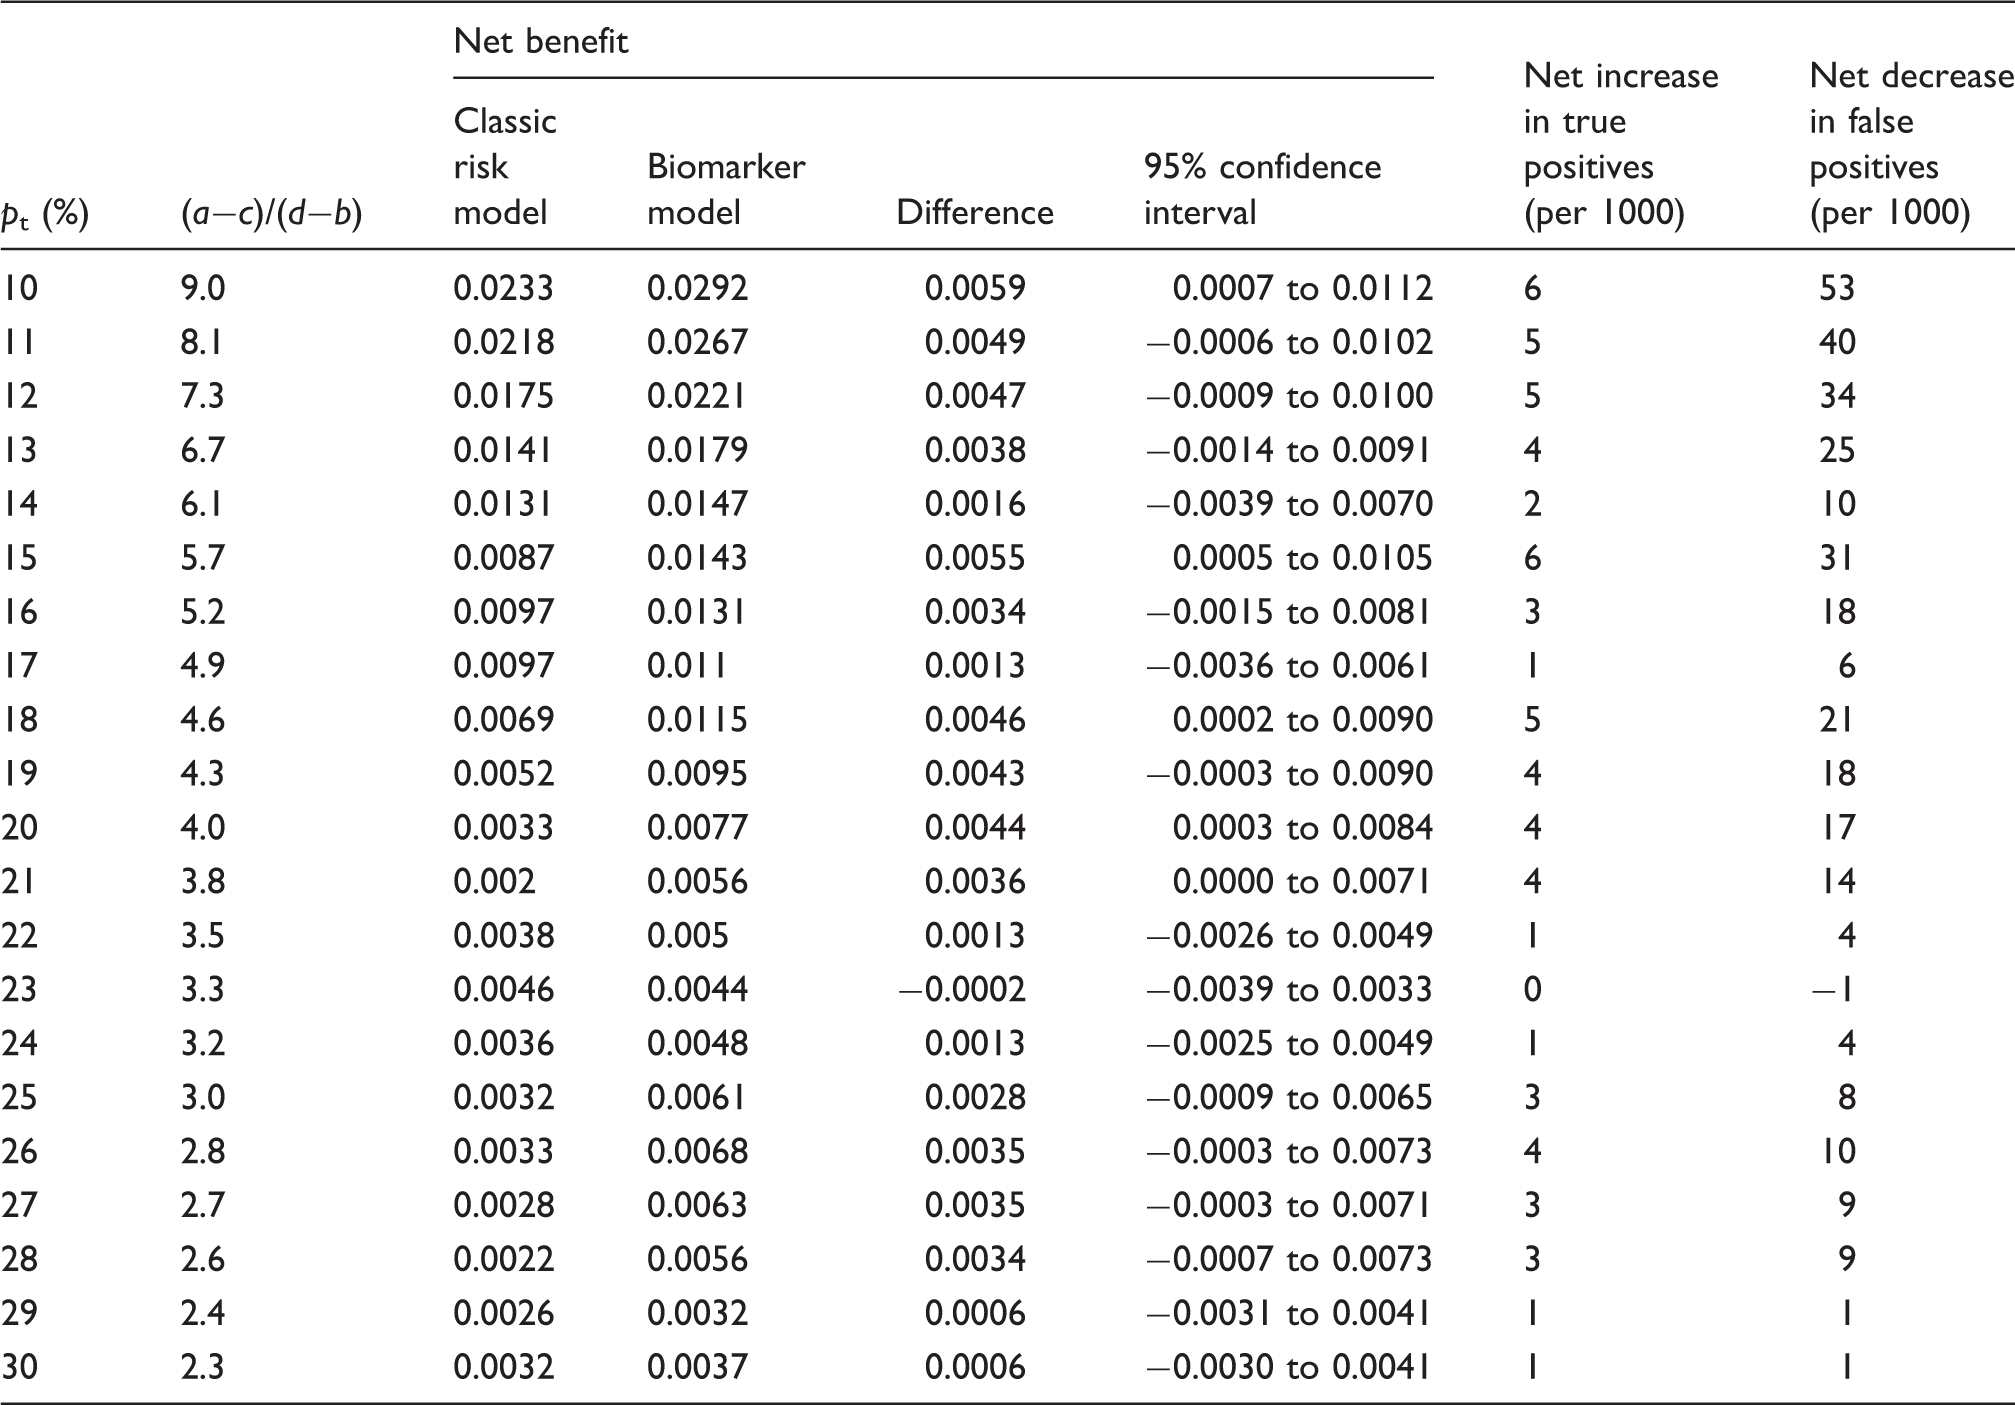
The decision curve graph for PRIME Belfast is depicted in Figure 2. Both prediction models are useful (in comparison to treat all and treat none strategies) approximately over the risk threshold range of 5−40%. The net benefit of the biomarker model has positive values across the range pt = 10⊟20, and at thresholds pt = 10, 15, 18, 20, and 21, significant confidence intervals give some confidence to this trend. Across these points, the net benefit of true positives and negatives reclassify relatively large numbers in each threshold category. Although the results must be considered with caution because the confidence intervals are wide, calculating confidence intervals for 100 risk limits each using 2500 bootstrap replications on a dataset the size of PRIME can lead to a multiple testing problem and measurement error. In the context of the positive benefit of the biomarker model observed in the FINRISK cohort, the correlated result in the independent PRIME Belfast dataset is remarkable. Importantly, and in contrast to FINRISK, here the improvement is largest at threshold probabilities from 10% to 20%, encompassing the intermediate CVD risk range in PRIME Belfast. At pt = 10%, the model with biomarkers performs well, giving a difference in the net benefit of 0.0059 (95% CI 0.0007⊟0.0112) (Table 2). This corresponds to a net increase of 6 true positive patients per 1000 and a net decrease of 53 false positive patients per 1000 are predicted (Table 2). Therefore, choice of this prediction model for patients at pt = 10% would lead to the equivalent of 5% fewer treatments in patients not destined for an event without any increase in the number of false negatives, compared to the baseline model. Across the majority of thresholds, the improvement was in the number of patients who would have been falsely classified as positive with the classic risk factor model.
Decision curve, plotting net benefit against risk threshold probability of cardiovascular disease relative to treat all or treat none for PRIME Belfast men. Old model refers to classic risk factor model; new model refers to the biomarker model (high-sensitivity C-reactive protein, troponin I, N-terminal pro-B-type natriuretic peptide, and classic risk factors). Lower graph shows net benefit variation over risk distribution with 95% confidence intervals. Decision curve result for 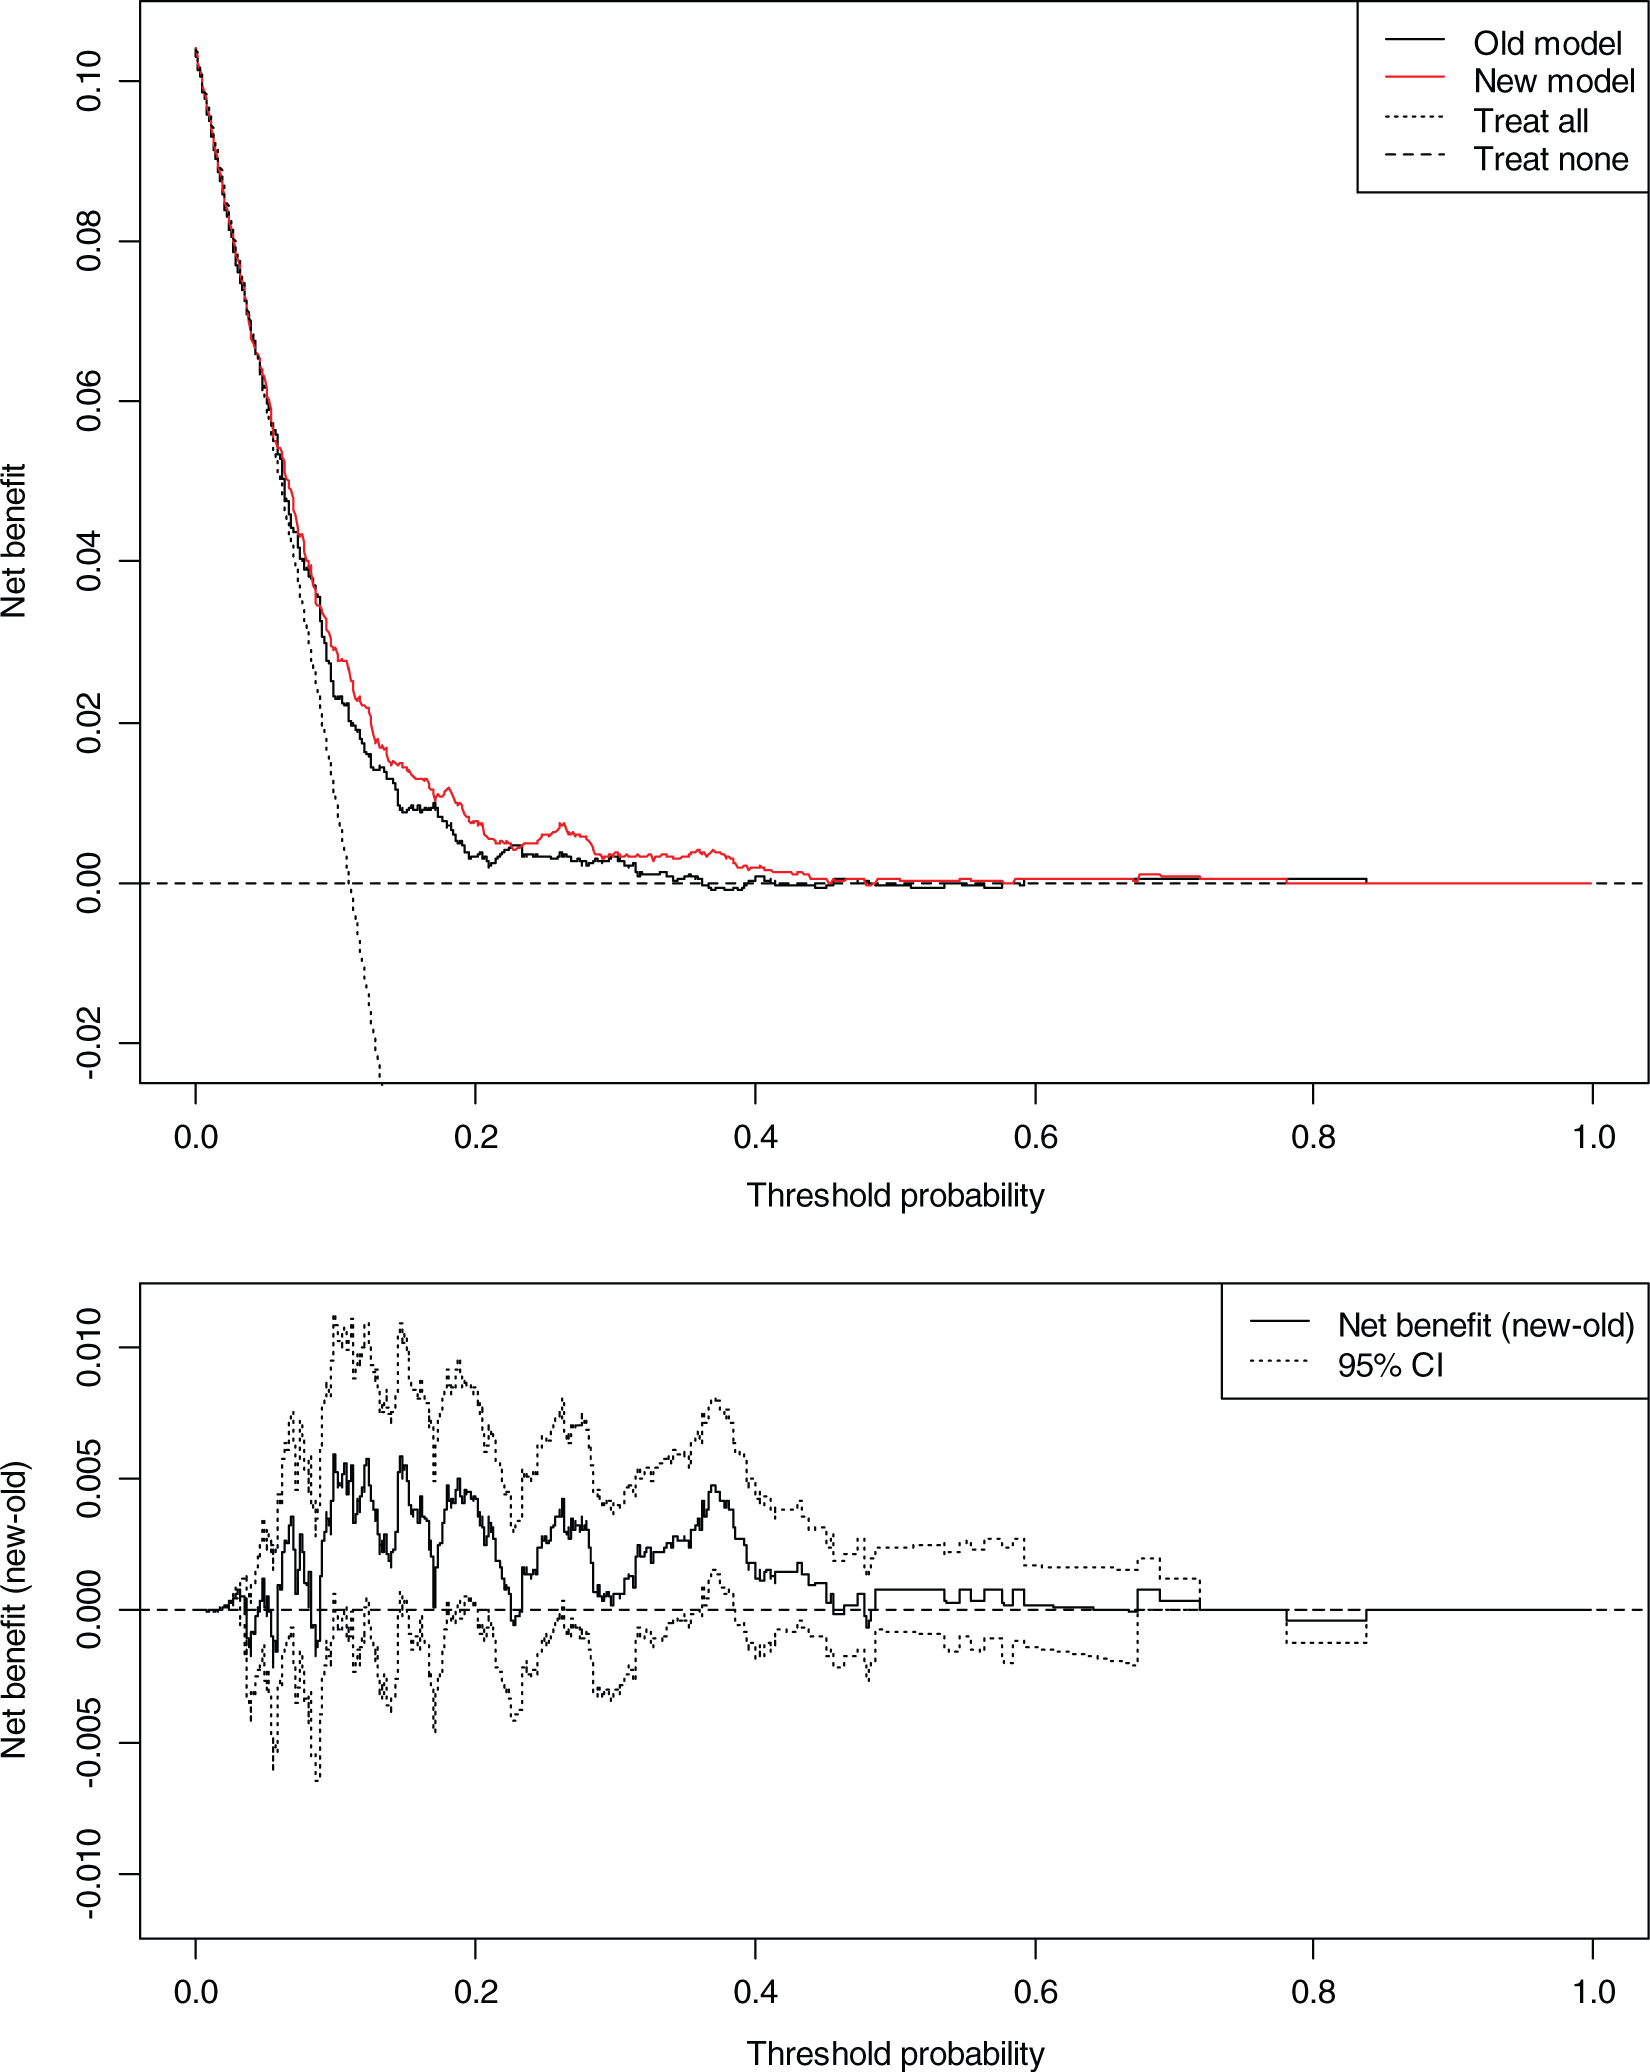
Discussion
This paper has illuminated the quality of decisions based on a biomarker risk score derived from one of the largest prospective population studies with a total of 10,263 subjects to date. The biomarkers represent three different biological pathways of CVD and their combination provides incremental value above individual risk markers and beyond classic risk factors. Studies of new biomarkers should report a variety of statistical methods and decision analytical models like the decision curve should be used when a prediction model shows potential for clinical decisions. 15 On comparing the decision curve results to net reclassification, 19 the results largely complement each other in that reclassifications are in the same direction, but they differ in a number of ways. The distribution of biomarker values in prospective populations can overlap substantially even when case−non-case group means are significantly different. This creates a high proportion of false positives and false negatives around any given cut-off point and the decision curve provides the best means of visualizing this. In this way, the decision curve evaluates the net benefit (incorporating true and false positives) for individual threshold points while the net reclassification evaluates benefit in categories using fixed risk cut offs. In addition, the net reclassification method considers false positives/negatives of equal value regardless of direction while the decision curve can distinguish these effects.
The decision curve approach shows that the biomarker risk score can improve CVD risk prediction at intermediate risk levels when compared to a classic risk factor model for middle-aged men in PRIME Belfast. The greatest net benefit was observed at intermediate thresholds between 10⊟20%, albeit with wide confidence intervals. In contrast, for a general population like subjects in FINRISK, with a wider age range including younger and older men and women, the biomarker risk score improves decisions in the high-risk range but not in the intermediate group. Other large population studies with broad age ranges evaluating multiple biomarkers have also suggested a limited value in this group.11,31 Often the features of the cohort, choice of biomarker, and statistical metrics can contribute to variation in findings.13,32 The decision curve presents the results for reclassification of the FINRISK cohort, as suggested by de Lemos and Rohatgi, 33 which highlights the complicated influence of age and sex on the interpretation of results. In this cohort, events are concentrated in the older age group and age has the largest effect on discrimination. With relatively fewer cases in the intermediate risk group, the ability to assess the potential added benefit of the biomarkers in this category is limited. The ability to test the predictive performance of the model is enhanced by the narrow age range of PRIME Belfast which deals with the dominant effect of age while providing clinically useful information on middle-aged men which explains the modest improvement in risk estimation. However, the smaller sample size of this cohort is reflected in the wider confidence intervals. In part, the confidence intervals also reflect the relative insensitivity of threshold-based measures in general, a criticism commonly associated with the c-index. 34 Other biomarker risk scores tested on narrow age ranges have shown improved prediction for male subgroups. 35 We must also bear in mind that Finland and UK have high absolute risks of CVD so the contribution of biomarkers may be specific to such populations. Individuals on cholesterol medication at baseline were removed from the analysis but some subjects will receive treatment during follow up which may influence risk estimates. Nevertheless, the decision curve was estimated with correction for optimism by assessing the confidence interval around the net benefit values, accounting for the censored nature of the data using a Kaplan Meier approach, and considering competing risk of other (non-CVD) mortality in survival analysis.
The modest statistical improvement in middle-aged men could translate to improved clinical decision making and the score could be relatively easily incorporated into the workflow of cardiovascular risk evaluation. First, the biomarkers have shown strong and consistent associations with CVD in multiple studies.11,31,35 They can be robustly and reproducibly measured at reasonable costs and show good discrimination and calibration in our prediction model. 19 While the overall clinical benefit of the model may appear modest if each threshold point is considered separately, e.g. 6 more true cases predicted per 1000 patients and 5% net fewer unnecessary treatments at a pt = 10% for PRIME Belfast. Nevertheless, the biomarker score shows considerable clinical potential to improve risk prediction for middle-aged men at intermediate risk of CVD and should be offered to this subgroup rather than all in the population. For example, this group may include individuals with only single abnormalities of traditional risk factors (such as those with a premature family history of CVD or isolated hypertension) placing them near the threshold for deciding therapy. For these people who are undecided about starting medication for primary prevention, markedly high biomarker levels may tilt the balance in favour of treatment. By varying the threshold probability over an appropriate range, the clinician and the patient can better judge the trade-offs implicit in acting on the results of the biomarker test.
Lowering elevated levels of low-density lipoprotein cholesterol is still the primary target for reduction of CVD risk, usually with statin therapy. The JUPITER trial suggested that statin treatment may be beneficial for individuals with intermediate CVD risk, with normal cholesterol levels and raised CRP levels. 36 While the magnitude of this effect may be questioned 37 and CRP may be a marker not a causal factor for cardiovascular events, 38 it can still be useful for prediction, and, in addition to incorporating it in our score, CRP is one of four novel biomarkers that have been linked to the prediction of other significant outcomes such as diabetes. 39 Across the majority of risk thresholds, the biomarker score mainly down-classified risk for individuals without events in PRIME, suggesting its main benefit could be to reduce unnecessary statin treatments in middle-aged men. While the safety and effectiveness of deferring treatment is unknown, statins for primary prevention confer benefits across a broad range of baseline cardiovascular risk levels. Some have suggested that initiating statin treatment at lower risk levels than currently set would be cost effective provided harms associated with statins are at low levels. 40 However, treating unselected individuals with normal biomarker levels may not be practical and even patients with high risk of CVD are reluctant to begin statin therapy with 50% who begin therapy failing to adhere to treatment a year after prescription. 2 Statins have been linked to low intensity muscle soreness, diabetes mellitus, 41 and potentially fatal liver failure or cancer. 42 Within a narrow range of increased risk of these adverse events, biomarker screening could provide a more effective means of guiding treatment decisions as indicated by a recent cost-effectiveness study of CRP. 40 Indeed cost effectiveness studies can be more sensitive to other contextual factors, such as baseline risk of myocardial infarction and effectiveness and cost of statins or other therapy, than the actual cost of the biomarker tests, and even if these scores are more expensive than classic risk factors, their value may still be proven if clinical outcomes are sufficiently improved in terms of quality-adjusted life years. 43
The effectiveness of biomarkers in a clinical setting would be enhanced if biomarker guided therapies or monitoring could change cardiovascular outcomes or improve the outcome of care. A reduction in hsCRP with statins and an association between achieved concentrations of hsCRP and outcome have suggested that hsCRP could monitor response to statin therapy. 44 hsCRP may act as a treatment-effect modifier, possibly detecting nonresponsiveness to statin therapy which could spare people from unnecessary treatment.45,46 Overall, the biomarker score could result in significant resource implications and requires evaluation in biomarker-guided randomized control trials. 40 While the decision curve approach highlights the score’s potential clinical utility in a single summary measure and adds to its assessment following AHA guidelines, 17 a full decision analysis is needed to assess the cost effectiveness of screening at the population level, the behavioural response to risk perception with the added biomarker information, adherence to therapy and patient outcomes.
New assays capable of detecting very low levels of troponin have been shown to have even greater ability to identify incident coronary heart disease, mortality and hospitalization for heart failure in general populations with no previous signs of disease. 47 These highly sensitive troponin assays have the potential to refine our score but we will need to establish whether prediction based on a single troponin determination is similar or superior to our three marker score by screening in other MORGAM cohorts with different levels of absolute risk.
In conclusion, the decision curve shows the net benefit of a biomarker risk score is improved across intermediate and high risk thresholds compared with a classic risk factor model leading to a small but clinically useful increase in the identification of true cases and potentially a reduction in unnecessary treatments in a middle-aged European male cohort. While the score improves CVD prediction at high risk thresholds in a general cohort of men and women it may only provide marginal benefits among younger and older individuals. Refining CVD risk in middle-aged men could lead to more effective treatment planning to reduce CVD risk in this group.
Footnotes
Sites and key personnel of the contributing MORGAM Centres are given in the online supplementary material (Annex).
Acknowledgements
Abbott Diagnostics, BRAHMS AG, Diadexus and Roche Diagnostics provided test reagents for biomarker testing.
Funding
This work was supported by the Medical Research Council (grant number G0601463, ID number 80983, Biomarkers in the MORGAM populations). VS was supported by the Finnish Foundation for Cardiovascular Research and by the Finnish Academy grant number 129494.
Conflicts of interest
Dr Blankenberg has received honoraria from Abbott Diagnostics (<5,000 USD) and Roche Diagnostics (<5,000 USD) and has worked as a consultant/advisory board member for Brahms (<5,000 USD). No other conflicts of interest are declared.
References
Supplementary Material
Please find the following supplemental material available below.
For Open Access articles published under a Creative Commons License, all supplemental material carries the same license as the article it is associated with.
For non-Open Access articles published, all supplemental material carries a non-exclusive license, and permission requests for re-use of supplemental material or any part of supplemental material shall be sent directly to the copyright owner as specified in the copyright notice associated with the article.