
Abstract
Introduction
Acute appendicitis is the most common reason for emergency abdominal surgery in the pediatric population. Ultrasound (US) is a widely used modality to diagnose acute appendicitis. The aim of this study was to evaluate the effectiveness of portal vein diameter and flow velocity in acute appendicitis diagnosis.
Methods
Portal vein diameter and flow velocity were measured in children who were referred to radiology with a clinical diagnosis of acute appendicitis. The largest appendix diameter and leukocyte count of the patients were recorded. A control group was created which consisted of healthy children, and their portal vein diameter and flow velocities were also measured.
Results
The median age of the population was 10 years (range, 3–17 years). Mean portal vein diameter was 7.53 ± 1.55 mm in the control group, 7.92 ± 1.88 mm in the other diagnosis group, and 8.76 ± 1.91 mm in the acute appendicitis group. Mean portal vein diameter was significantly higher in the acute appendicitis group (p = 0.001). Median portal vein flow velocity was 17 cm/s (10–29 cm/s) in the control group, 18.3 cm/s (8–27 cm/s) in the other diagnosis group, and 20.5 cm/s in the acute appendicitis group. Median portal vein flow velocity was significantly higher in the acute appendicitis group (p = 0.00).
Conclusion
Detecting an increase in portal vein diameter and/or flow velocity in equivocal cases may support other clinical signs associated with acute appendicitis. Portal vein diameter and flow velocity can serve as additional diagnostic markers in acute appendicitis cases.
Introduction
Acute appendicitis (AA), with a lifetime prevalence of 7%, is the most common cause of surgical acute abdomen. Despite the high prevalence, diagnosis is still challenging because of atypical clinical presentation and overlapping symptoms. In the pediatric population, only 50% to 70% of AA cases can be diagnosed at the initial assessment. Prompt and correct diagnosis is crucial in AA cases to be able to prevent unnecessary surgical interventions and/or possible perforations. 1
Imaging plays an important role in AA diagnosis. Recent publications suggest that ultrasound (US), computed tomography (CT), and magnetic resonance imaging have high diagnostic accuracies of suspected AA cases in children. 2 CT has high sensitivity (98.5%) and specificity (98%), although ionizing radiation limits its use, especially in the pediatric population. As US has no ionizing radiation, does not use contrast material, and has a short acquisition time, it is widely used for AA diagnosis. US sensitivity varies between 67% and 88% and specificity between 78% and 98%. These wide ranges are attributed to operator, patients, and device differences.1,3
Recently, some additional US criteria have been evaluated to help AA diagnosis, such as increased periportal and renal parenchymal echogenicity.4,5 Portal vein (PV) thrombosis is a defined complication of AA. 6 Therefore, the aim of this study was to evaluate the possible changes in PV diameter and peak systolic flow velocity in AA cases, and to evaluate the effectiveness of PV diameter and peak systolic flow velocity in AA diagnosis.
Materials and methods
This prospective study was approved by the Local Institutional Review Board. Informed consent was obtained from the parents of all participants. The study data were collected between June 2018 and March 2019.
PV diameter and peak systolic flow velocity were measured in children who were referred to radiology with a clinical diagnosis of suspected AA. The largest appendix diameter and leukocyte count of the patients were also recorded. Leukocyte count values were acquired on the same day as the US examination or on the following day. The patients were followed up to ascertain their final diagnosis. Those with a pathologically confirmed AA diagnosis were selected to constitute the study group/AA group.
Patients with a pathological and/or clinical certain diagnosis other than AA constituted the ‘other pathologies’ group.
Patients were excluded if medical records were insufficient to ascertain final diagnosis, if they had any known hepatic parenchymal disease, cirrhosis, hepatic and/or PV thrombosis, any iatrogenic and/or spontaneous portal shunt, steatosis, or hepatosplenomegaly.
To create a control group, the PV diameter and flow velocities were measured and recorded in children referred to the radiology department with a clinical diagnosis other than abdominal pathologies. Patients were excluded if they had any abdominal pathologies that might change PV measurements (inflammatory bowel disease, familial Mediterranean fever, mesenteric lymphadenitis, gastroenteritis).
According to the above-mentioned criteria, US was applied to 175 children with suspected AA and these patients were followed up. A total of 28 patients were excluded. The AA subgroup consisted of 32 patients and the other pathologies subgroup included 115 patients. The control group consisted of 60 age and gender-matched (with AA and other pathologies subgroups) patients. The flowchart of patient selection is shown in Figure 1.
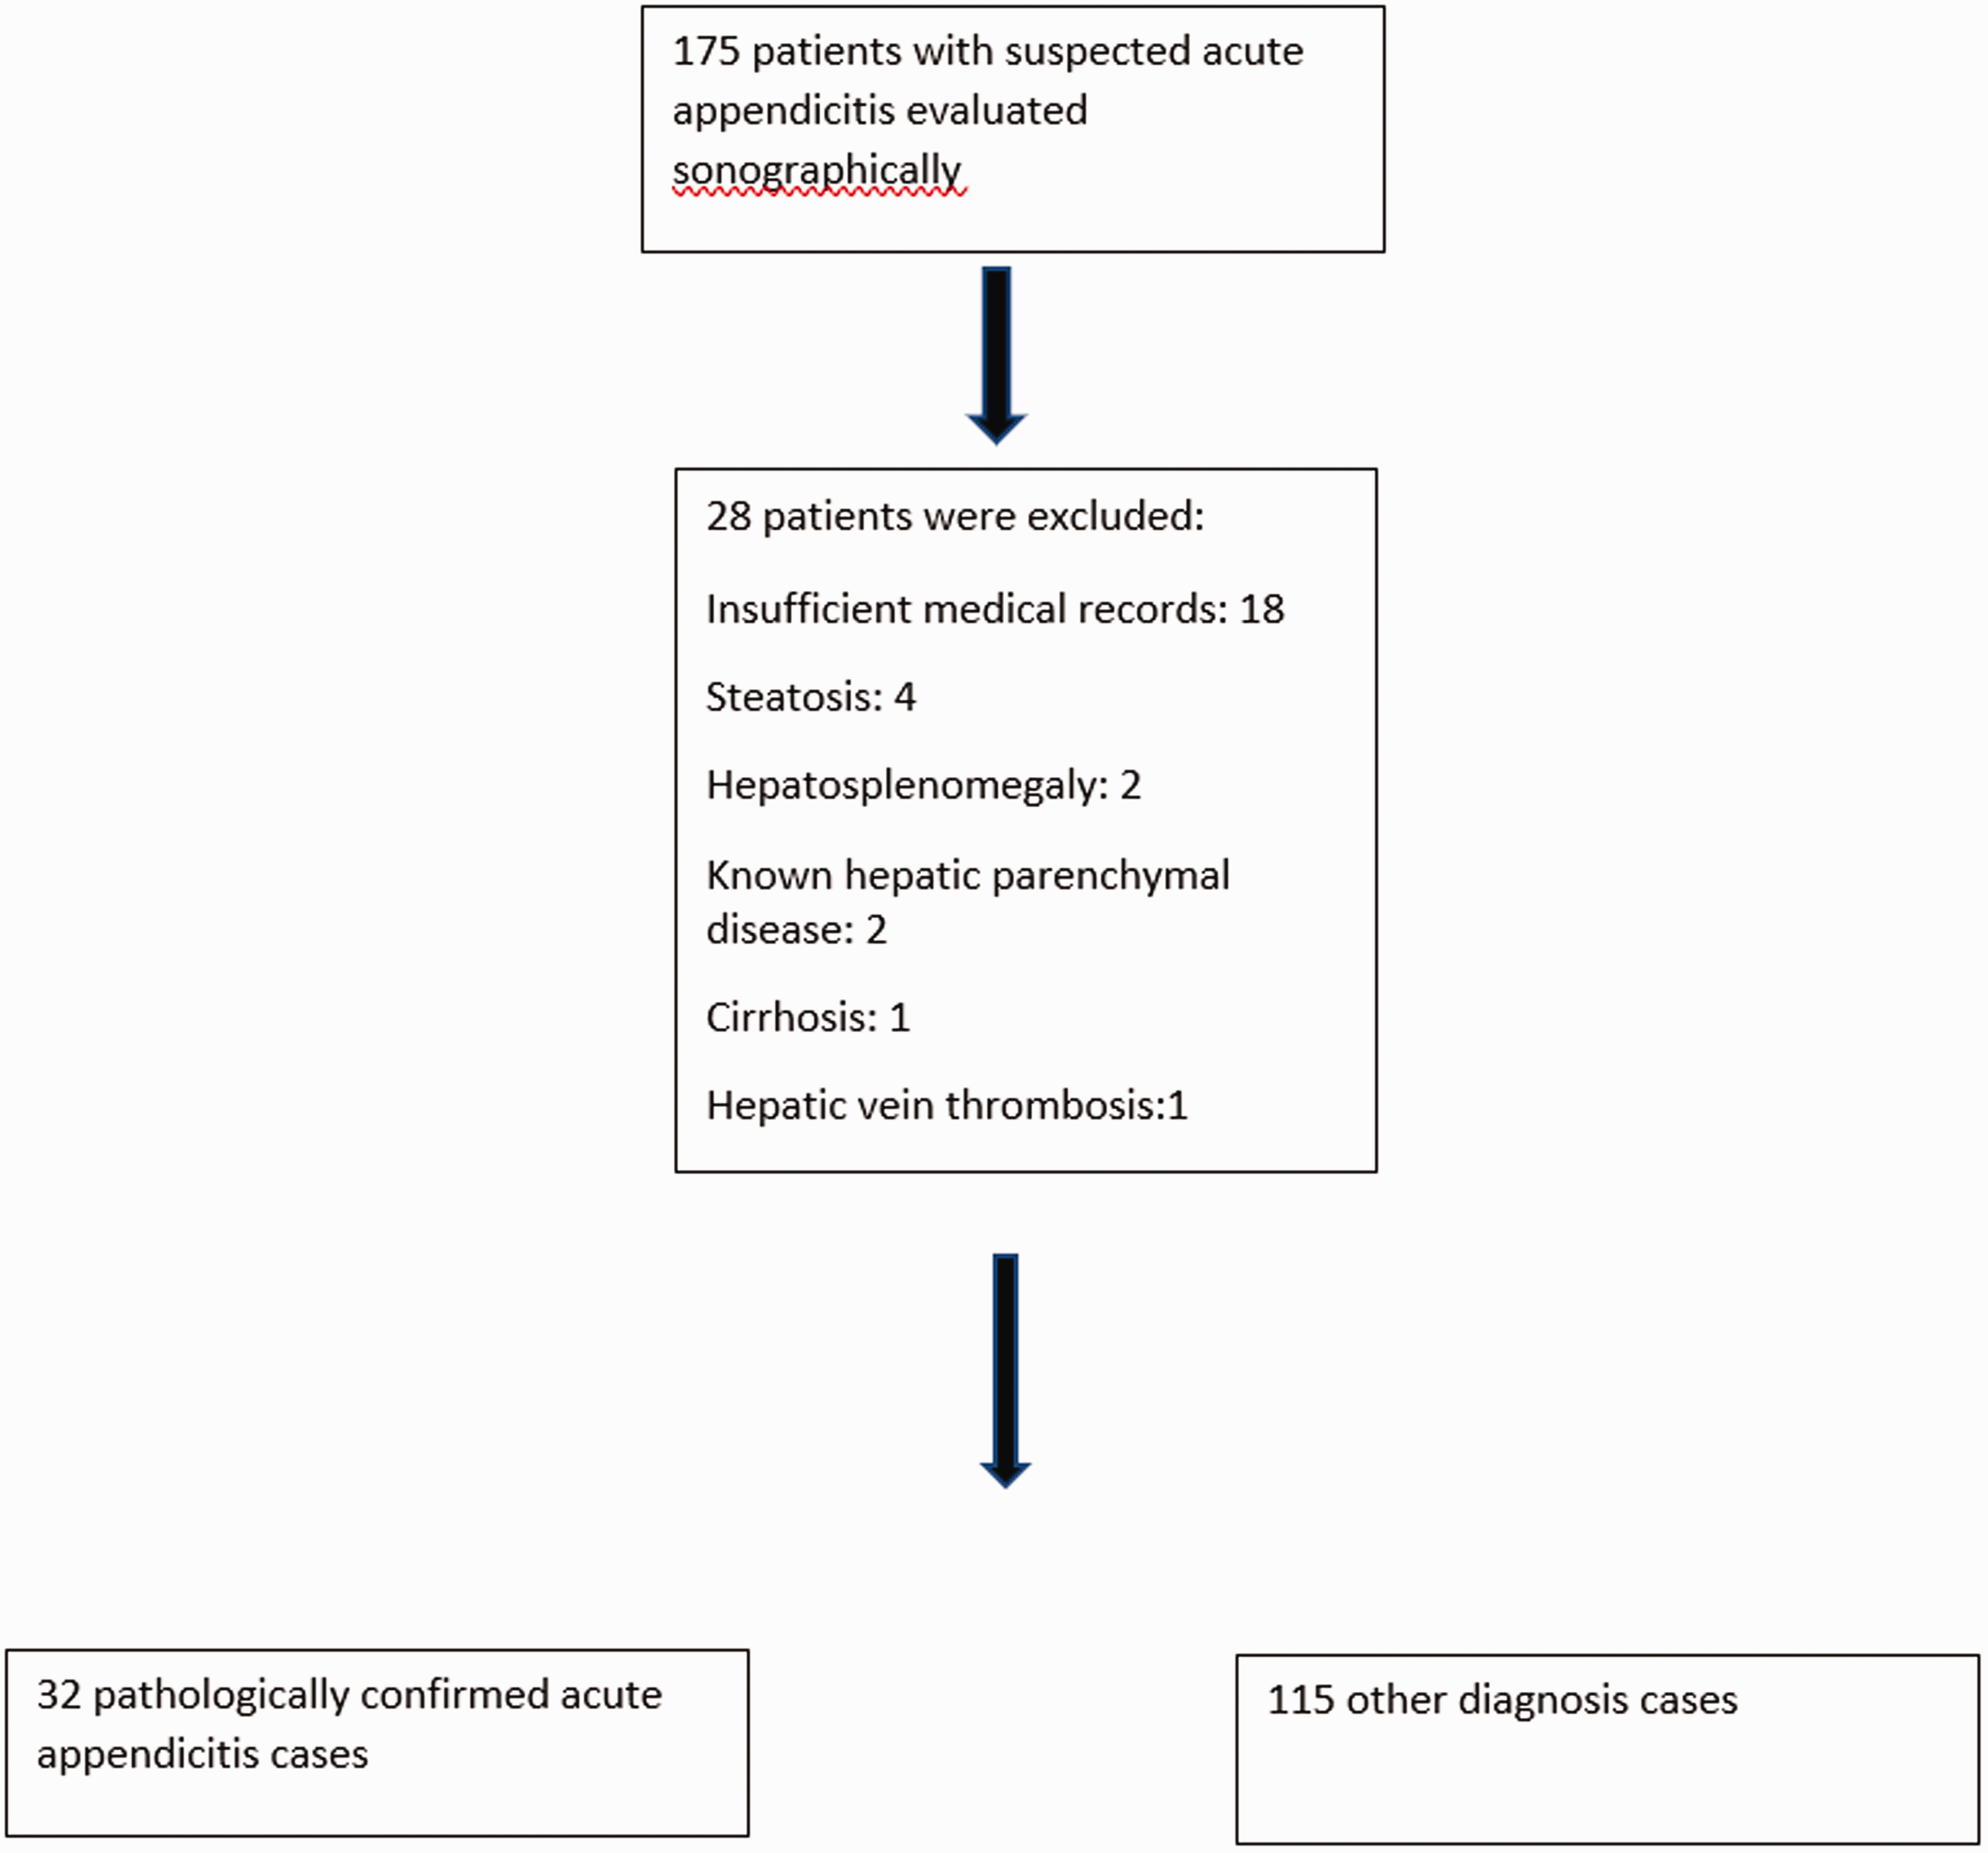
Flow chart for patient selection.
All US examinations of the appendix were performed with the patient supine and using a 7 MHz linear transducer, applying graded compression, beginning from the point at which the patient indicates maximal pain, and then continuing from the hepatorenal fossa through the right lower quadrant. Examinations for PV diameter and flow velocity were performed in the supine position with 3.5 MHz convex transducers (iU22 Philips Healthcare, Best, The Netherlands; and Aplio, Toshiba Medical Systems, Tokyo, Japan). PV diameter and peak systolic flow velocity were measured from the central part of the main PV (Figure 2).
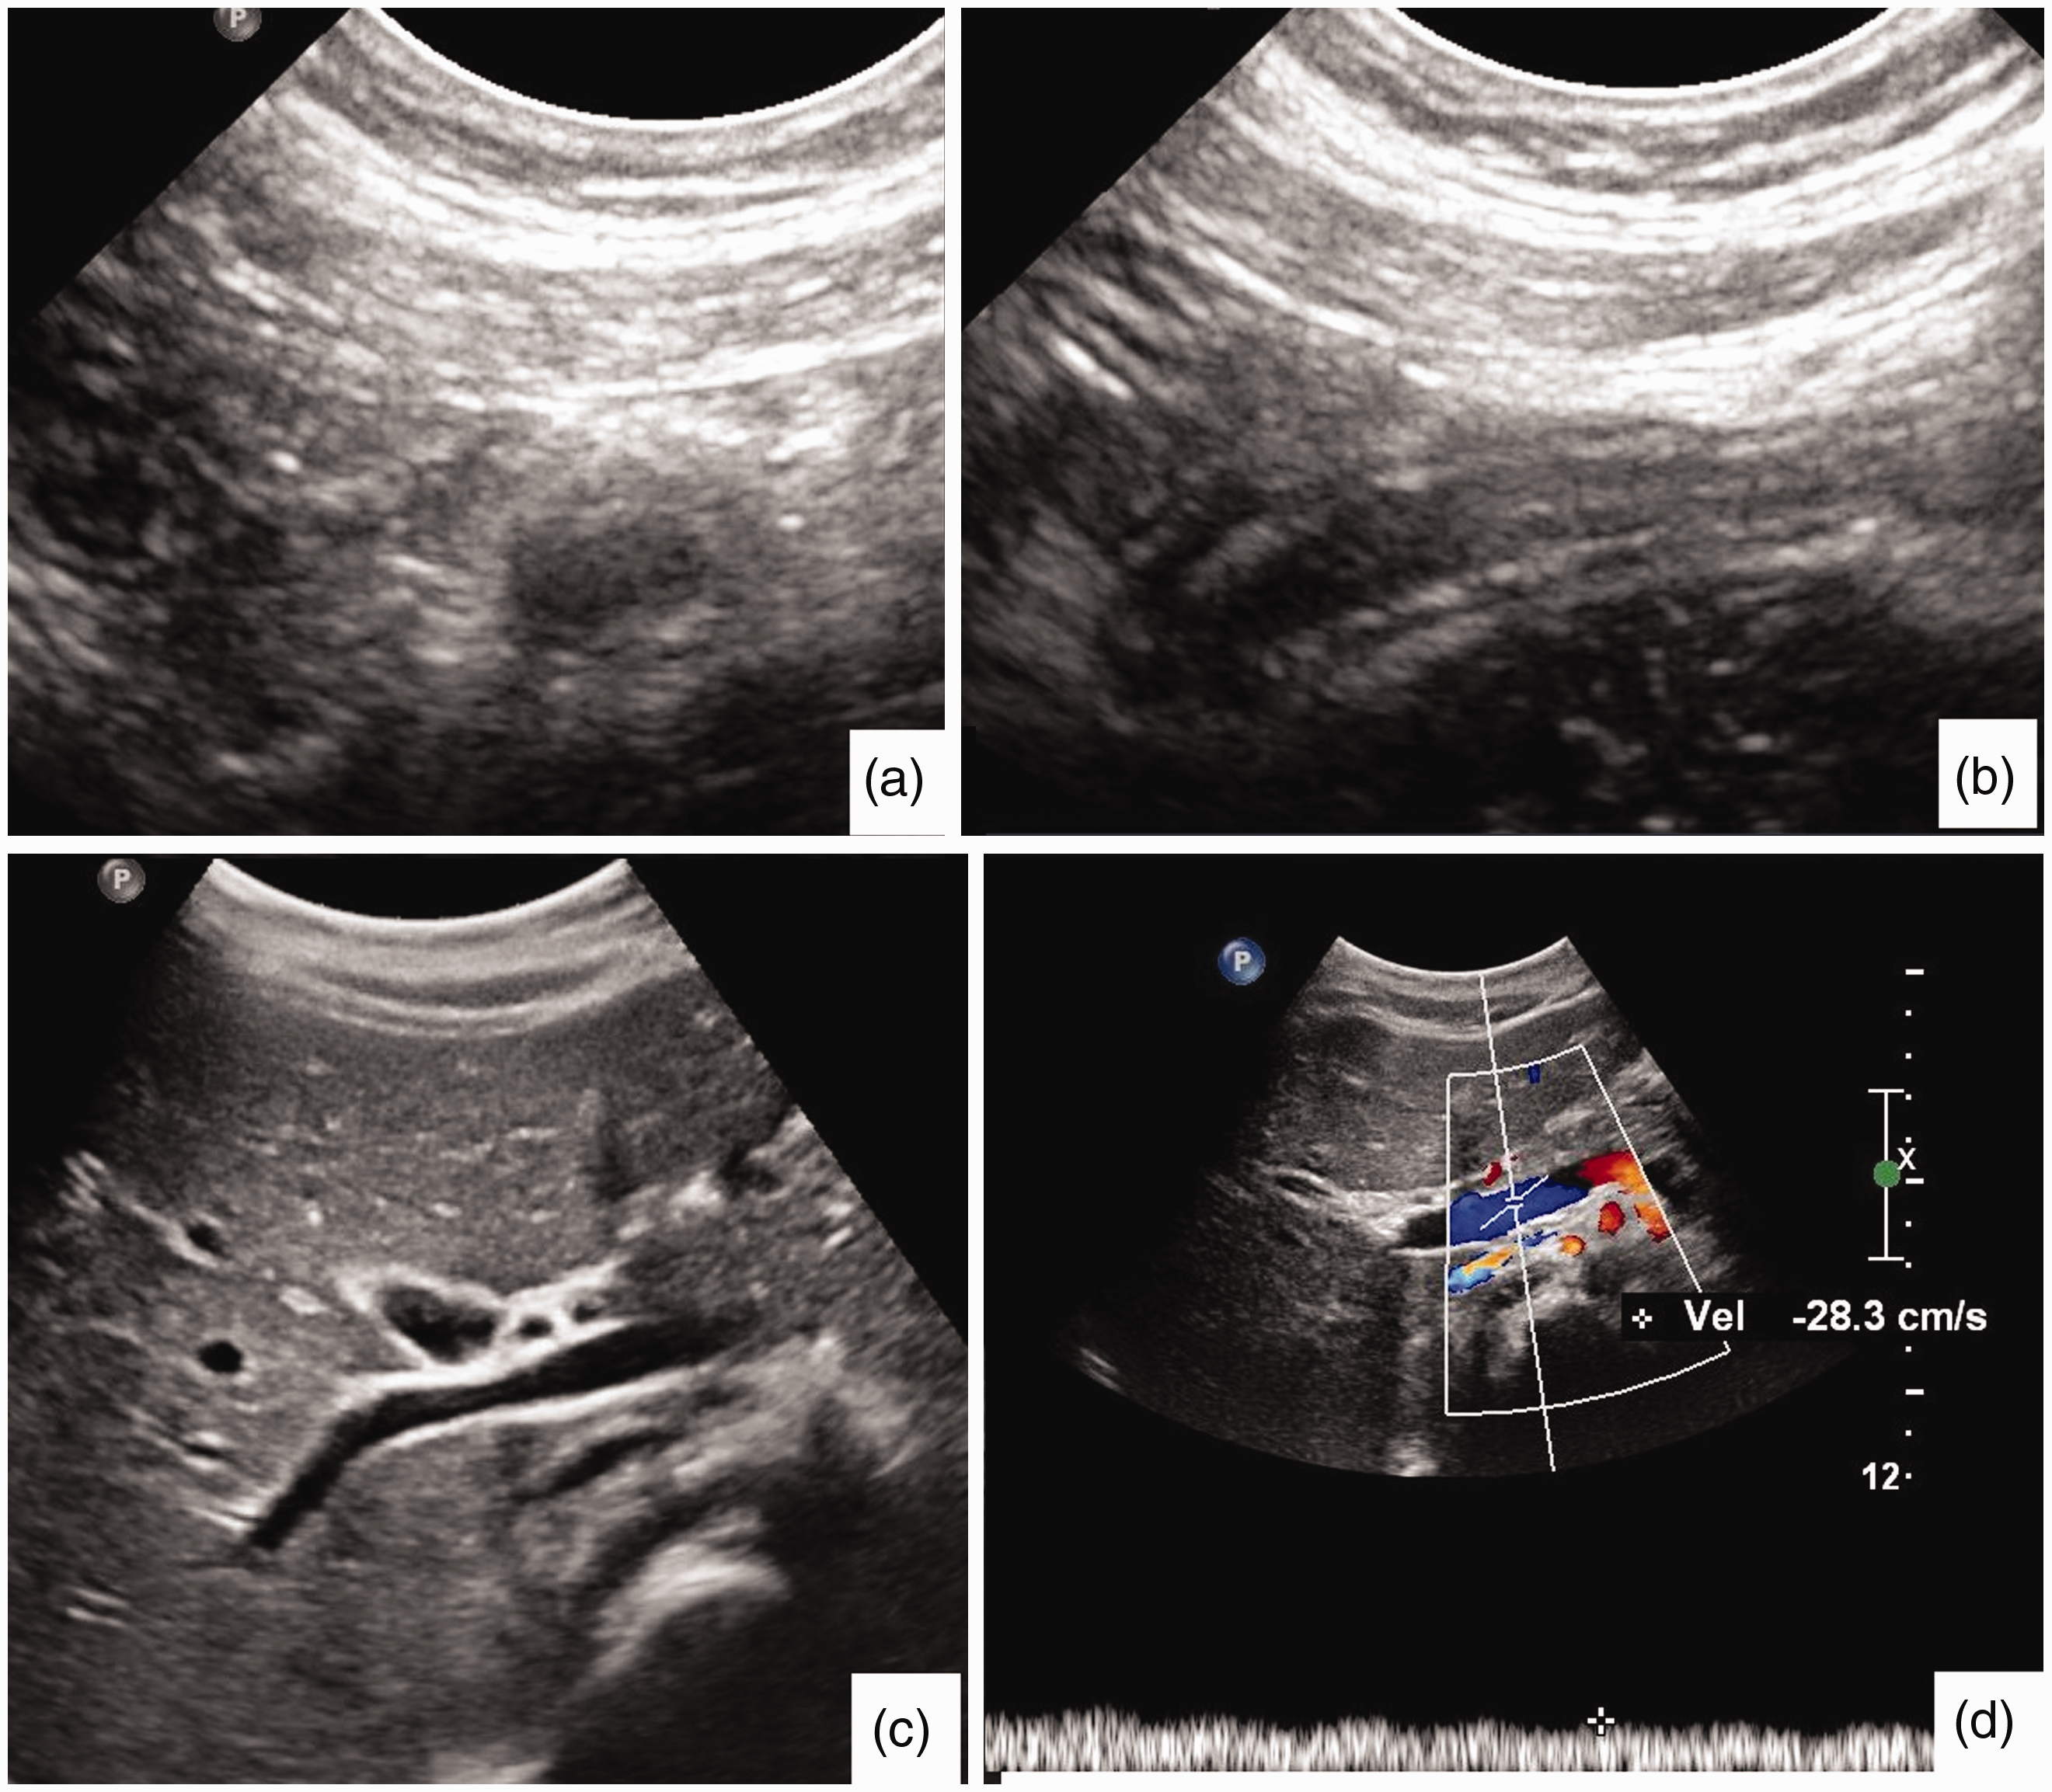
Ten-year-old, acute appendicitis. Non-compressible, enlarged appendix is seen on axial (a) and longitudinal (b) US views. The largest appendix diameter was 7.4 mm. The main portal vein was measured as 9 mm (c) and PV flow velocity was 28.3 cm/s (d).
White blood cell (WBC) count and C-reactive protein (CRP) values were recorded for the AA group.
Statistical analysis
Data were analyzed using the Statistical Package for Social Sciences (SPSS) for Windows vn. 20 software (IBM SPSS Inc., Chicago, IL). Conformity of the data to normal distribution was evaluated with the Kolmogorov–Smirnov test. Numerical variables with normal distribution were shown as mean ± standard deviation (SD) values. The variables not showing normal distribution were shown as minimum–maximum values. Consecutive variables were evaluated with the Student’s t test and Mann–Whitney U test. Pearson and Spearman correlation analyses were used to define possible correlations between PV diameter, PV flow velocity, appendix diameter, and leukocyte count. Logistic regression analysis was performed to evaluate the relationship between PV diameter and appendix diameter. Receiver operating characteristic (ROC) curve analysis was applied to evaluate the diagnostic performance of PV diameter and flow velocity in AA diagnosis. The Youden index was used to define the predictive values of the parameters for AA.
A two-tailed value of p < 0.05 was considered statistically significant.
Results
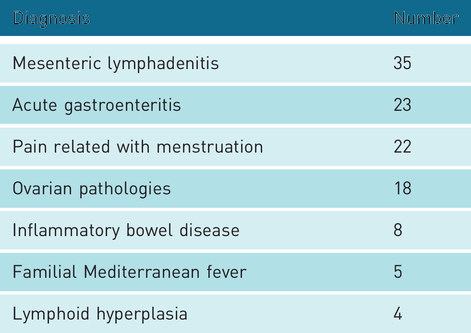
The study population comprised 94 (45.4%) males and 113 females (54.5%) with a mean age of 10 years (range, 3–17 years). Age and gender distribution according to subgroups are shown in Table 1. The final diagnosis of the patients in the other diagnosis subgroup is shown in Table 2.
Age and gender data in groups.
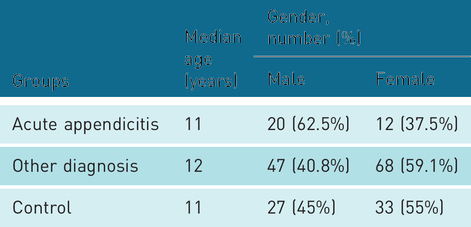
Children in the subgroup without appendicitis but diagnosed with an alternative condition.
The median appendix diameter was 4.6 mm (2.7–7 mm) in the control group, 5.3 mm in the other diagnosis group (3–6.5 mm), and 9 mm in the AA group (7–12 mm).
WBC count was mean 13.2 ± 5.4 109/L in the AA group and 10.8 ± 3.3 109/L in the other diagnosis group. The median CRP value was 31.1 (5–164) mg/dL in the AA group, and 9.3 (3–38) in the other diagnosis group. No statistically significant correlation was determined between the WBC count and CRP values and PV diameter or PV flow velocity in either the AA or other diagnosis subgroups.
The mean PV diameter was 7.53 ± 1.55 mm in the control group, 7.92 ± 1.88 mm in the other diagnosis group, and 8.76 ± 1.91 in the AA group. The mean PV diameter was statistically significantly higher in the AA group than in the other two groups (p = 0.001). The mean PV diameter values were similar in the control and other diagnosis groups (p = 0.073).
The median PV flow velocity was 17 cm/s (10–29 cm/s) in the control group, 18.3 cm/s (8–27 cm/s) in the other diagnosis group, and 20.5 cm/s (15–32 cm/s) in the AA group. The median PV flow velocity was statistically significantly higher in the AA group (p = 0.000), and the values were similar in the control and other diagnosis groups.
According to the Pearson correlation analysis results of the whole study population, the PV diameter and PV flow velocity measurements were positively correlated with the largest appendix diameter. Age was positively correlated with PV diameter (Table 3).
Correlation between parameters.
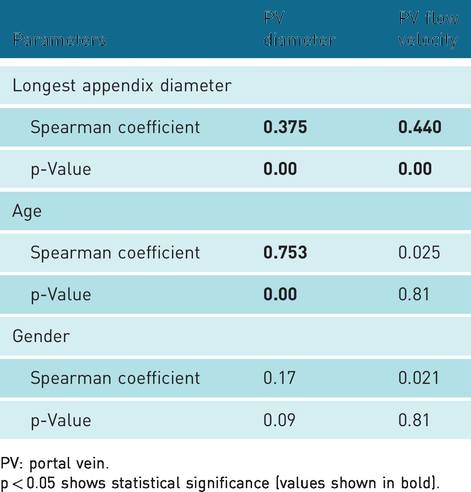
PV: portal vein.
p < 0.05 shows statistical significance (values shown in bold).
The median ages of all subgroups were similar, and further correlation analysis was performed to eliminate the effect of age on other parameters. The positive correlation between PV diameter, PV flow velocity, and largest appendix diameter remained stable (Table 4). Linear regression analysis also supported the positive relationship between PV diameter and largest appendix diameter (r = 0.405, p = 0.001).
Correlations when controlled for age.
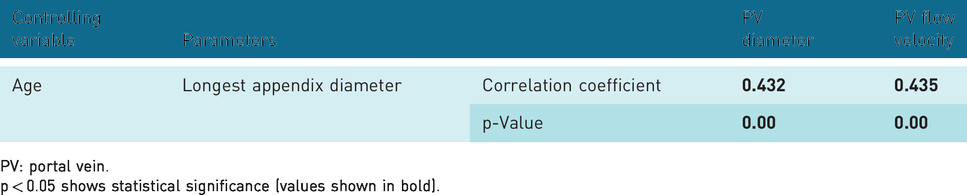
PV: portal vein.
p < 0.05 shows statistical significance (values shown in bold).
According to the ROC analysis results, PV diameter >8.85 mm can predict AA diagnosis with a sensitivity of 65.6% and specificity of 76.7% (area under the curve (AUC) = 713, odds ratio (OR) = 7.6).PV flow velocity >17.5 cm/s was determined to predict AA diagnosis with a sensitivity of 87.5% and specificity of 65% (AUC = 835, OR = 13).
Discussion
The results of this study showed that PV diameter and PV flow velocity were significantly increased in children with AA compared to the healthy control group, and children with other causes of acute abdominal pain, independently of age. In addition, the largest appendix diameter was seen to be positively correlated with PV diameter and flow velocity.
AA is still defined as a diagnostic challenge, especially in the pediatric age group. Atypical presentation, diagnostic overlap with other common pathologies, and concerns about radiation exposure from CT are some of the challenges that can make the diagnosis difficult. 7 US has gained increasing importance in AA diagnosis, and new sonographic diagnostic parameters have been defined to increase the diagnostic efficacy of US in AA diagnosis. 5
In Soyupak et al.’s study, 8 it is reported that mean PV diameter is 7 mm in the whole population and it changes with age. Their population consists of 168 children, age range: 1 month to 15 years. The current study’s results are consistent with the literature, as the mean PV diameter was measured as approximately 7 mm in the control and other diagnosis subgroups. However, the mean PV diameter was determined to be significantly larger in the AA subgroup than in the control and other diagnosis subgroups, as well as normal values stated in the literature. It can be inferred from these data that PV diameter can be a useful clue indicating AA diagnosis. As stated in the above-mentioned literature, and similar to our results, PV diameter increases with age. This situation can create doubts about the diagnostic efficacy of PV diameter in predicting AA. However, correlation analysis was performed in this study against the age parameter and the positive correlation determined between the largest appendix diameter and the mean PV diameters remained stable. Therefore, it can be concluded that PV diameter can be used as a diagnostic parameter for the diagnosis of AA, independently of age.
Changes in PV peak systolic velocity have been evaluated previously, especially in cirrhosis and portal hypertension cases. Normal PV peak systolic flow velocity is defined as 18 cm/s (range, 13–23 cm/s). 9 According to the current study data, median PV flow velocity was within normal limits in all three subgroups. However, median PV flow velocity was significantly higher in the AA cases than in the other children. PV changes, especially thrombosis, have been defined before in patients with inflammatory bowel disease and in AA cases.6,10 A recent study also indicated that periportal echogenicity of the liver increases in acute perforated pediatric appendicitis cases. It has been previously stated that the increase can be the result of edematous response of the liver to intra-abdominal inflammation. 4 The current study findings were consistent with the literature, indicating that PV flow velocity significantly increases as a result of inflammation caused by AA. To the best of our knowledge, this is the first study in English to have defined PV diameter and peak systolic velocity changes in AA cases.
Although PV flow velocities were seen to be increased in the presence of AA, a median PV flow velocity higher than the normal range was not detected in any subgroup. However, it can be considered that with follow-up of patients, PV flow velocities might be seen to exceed normal limits. As all of the AA cases in this study were operated on shortly after the diagnosis, there were no follow-up PV flow velocity measurements.
Cut-off values were defined for both PV diameter and flow velocity in the prediction of AA diagnosis. It was determined that a PV diameter >8.85 mm can predict AA with a sensitivity of 65.6% and specificity of 76.7%, and PV flow velocity >17.5 cm/s can predict AA with a sensitivity of 87.5% and specificity of 65%. Some recently defined new diagnostic clues for AA cases are generally more subjective findings.4,5 Using objective criteria during an ultrasonographic examination can increase both the confidence of the operator and the diagnostic reliability of the examination. Therefore, PV diameter and flow rate can serve as more objective and reliable markers supporting a diagnosis of AA than previously defined new diagnostic US findings. Increased renal echogenicity was defined as a new sonographic clue, and it was stated that presence of this finding increased the possibility of AA diagnosis 2.8-fold (OR = 2.8), 5 whereas an increase in PV diameter beyond the defined cut-off value increases the probability of AA by approximately 8-fold (OR = 7.6). Similarly, a significant increase exceeding the defined cut-off value for PV flow velocity increases the possibility of AA diagnosis approximately 13-fold (OR = 13).
Another previously defined sonographic clue for AA diagnosis is increased periportal echogenicity, with specificity of 77.9% and sensitivity of 29.2%. 4 A significant increase in PV diameter has similar specificity (76.7%) to that of increased periportal echogenicity. Both PV diameter and flow velocity parameters are more sensitive (65.6%, 87.5%, respectively) than increased periportal echogenicity in predicting AA diagnosis. It can be concluded from these data that new diagnostic clues related to PV changes are more successful than those previously suggested.
No significant relationship was determined between WBC count, CRP levels and PV diameter or flow velocity. In the literature, WBC count and CRP have been stated as important diagnostic predictors for AA, especially in children. 11 Therefore, a positive correlation between these inflammation markers and PV parameters was expected. The relatively small population and diagnosis of the cases in the early phases of inflammation might have caused this unexpected result. Further studies with larger populations may be able to define possible correlations.
The current study had some limitations. PV flow velocity and diameter can be affected by many different parameters, such as fasting, inspiration, and position.8,9 Moreover, it is difficult to stabilize a child with abdominal pain to be able to perform an optimal/standardized US and/or spectral Doppler US examination. These inconveniences can decrease the sensitivity and/or specificity of PV parameters by causing false/insufficient measurements and renders the experience of the radiologist/sonographer crucial for an adequate and correct PV examination. Thus, the results of the current study are strongly correlated with the experience level of the US operator. This point raises the need for an inter-/intraobserver reliability study. As only a small number of patients could be examined by both authors, it was not possible to present these data in this study. A consequence of studying an emergency pathology is that the fasting condition of the participants could not be standardized and this might have affected the PV flow velocity and the results of the study. The sample size, especially in the AA subgroup was small, so results could change with further studies of larger populations.
In conclusion, according to these preliminary results, AA can significantly increase PV diameter and flow velocity. Despite the low number of patients and relatively low sensitivity/specificity values of the PV parameters, an increase in PV diameter and/or PV flow velocity may support other clinical signs associated with AA and can serve as an additional diagnostic marker in suspected AA cases, especially in those with equivocal traditional sonographic findings.
Footnotes
Declaration of Conflicting Interests
The author(s) declared no potential conflicts of interest with respect to the research, authorship, and/or publication of this article.
Funding
The author(s) received no financial support for the research, authorship, and/or publication of this article.
Ethics Approval
The local institutional review board approved the current prospective study. Informed consent was acquired from parents of all participants. IRB number: 2018-0087-9.
Guarantor
SA.
Contributors
Both authors contributed equally to this work.
Acknowledgements
None.