






Abstract
Dephosphorisation slag generally consists of a 2CaO·SiO2–3CaO·P2O5 (C2S–C3P) solid solution, CaO–SiO2–FeOx glassy phase, and RO phase (FeOx, MgO and MnO). Its components, such as CaO, FeOx, MnO, and MgO, can be used as a soil conditioner in agriculture to improve acidic soil and supply nutrient elements. To promote its dissolution, CaO–SiO2–Fe2O3 glassy phases with different Al2O3 and Na2O contents were synthesised, and their dissolution behaviour and mechanism were investigated. The addition of Al2O3 significantly inhibited the dissolution of the glassy phase because it increased the degree of polymerisation of the silicate network, and the glassy phase structure became more stable as the Al2O3 content increased. When 3% Na2O was added, the dissolution ratios of elements from the glassy phase were the highest, with the dissolution ratio of Si reaching 21.0% and the dissolution ratios of Ca and Fe reaching 21.6% and 17.7% at pH 5. The substitution of CaO with Na2O significantly reduced the dissolution ratios of all elements. As the Na2O content increased, Na2O had a bigger influence on the silicate structure. Na2O addition enhanced the proportion of
Introduction
China Steel Association reported that the production of crude steel in China has reached about 1.029 billion tonnes in 2023, comprising nearly half of the global total.1,2 A significant quantity of steelmaking slag is inevitably generated as a by-product, but only a small part of slag is used in road construction, cement admixture, and other applications,3,4 resulting in a lower utilisation ratio. During the iron ore beneficiation or sintering process, P2O5 originated from iron ores is difficult to remove during the beneficiation or sintering process. In the blast furnace, it is reduced to phosphorus (P) and enters the molten iron. Therefore, lower-grade iron ore leads to higher P content in the molten iron, further affecting the following steelmaking process. To improve the removal of P from molten iron, dephosphorisation of molten iron in the converter has been employed in many steel plants, so large amounts of dephosphorisation slag were generated.5,6 Dephosphorisation slag is composed of CaO, FeOx, MnO, and MgO, making it effective in improving acidic soil conditions. The elements from slag, such as Ca, Si, P, and Fe ions, play a role in improving soil acidity and enhancing the bioavailability of soil phosphate.7–9 In addition, the concentration of harmful elements in slag generally can meet the pollutant control standards for agricultural land, so it is suitable for agricultural use.10,11 Europe, the United States, and other countries have conducted a lot of research and practice on the application of steelmaking slag in agriculture, such as the utilisation of steelmaking slag for the recovery of paddy fields damaged by Tsunami and slag fertiliser produced during the Thomas steelmaking process.12,13
To achieve effective dephosphorisation in the steelmaking process, it is necessary to maintain high basicity, oxidation property, and strong agitation formed by oxygen blowing operation, which plays an important role in the oxidation of P. Upon the oxidation of P to form P2O5, P2O5 rapidly reacts with CaO present in slag to form the 3CaO·P2O5 phase. Subsequently, it further exists in the form of a 2CaO·SiO2–3CaO·P2O5 solid solution (C2S–C3P). 14 Certain amounts of Ca, Si, and P elements are enriched within this phase in the dephosphorisation slag. Metallic elements such as FeOx and MgO are present in the RO phase. Moreover, a portion of Ca, Si, and Fe exists in the CaO–SiO2–FeOx glassy phase. Compared with converter steelmaking slag, dephosphorisation slag exhibits lower basicity (1.6–2.0), resulting in a higher proportion of glassy phase. 15 In the pursuit of achieving the efficient utilisation of steelmaking slag in the agricultural and marine sectors, researchers have conducted extensive research to study the dissolution behaviour of dephosphorisation slag. Futatsuka et al. 16 investigated the dissolution behaviour of valuable elements from the slag in seawater. It was verified that when the dephosphorisation slag and organic additives were added to the soil, the dissolution efficiency of Fe was better. Maruoka et al. 17 developed a column device simulating paddy field soil during the flooding period to evaluate the role of converter steelmaking slag as a fertiliser. It was confirmed that the application of slag fertiliser had a significant impact on the pH of the soil and the dissolution of Ca and Fe elements, further improving the growth trend and yield of rice. To further study the effectiveness of steelmaking slag fertiliser in paddy fields, some researchers have carried out the application research of commercial slag fertiliser in paddy field,18,19 found that the dissolution ratio of various elements was closely related to the proportion of mineral phase components. By adjusting the mineral composition, the modified slag fertiliser can be prepared to supply large amounts of Ca and Si to the paddy field. 20 However, the specific roles that each mineral phase plays in the dissolution process of various elements remain not fully understood at present. To supply Ca, Si, and Fe to paddy fields simultaneously, Koizumi et al. 21 studied the dissolution behaviour of the Fe-containing glassy phase and found that the co-existence of the CaO–SiO2–FeO glassy phase and the 2CaO·SiO2 solid phase can effectively provide sufficient Ca, Si, and Fe elements to the soil. Since the Fe in slag exists in the form of FeO and Fe2O3, these studies did not clarify the influence of Fe2O3 enriched in the glassy phase on the dissolution behaviour of steelmaking slag. Moreover, they only focused on the dissolution of steelmaking slag in a weak nitric acid solution and did not investigate the dissolution behaviour in organic acids, which are closer to the soil environment.
In the previous experiments on the dissolution behaviour of Ca, Fe, and Si elements in the CaO–SiO2–Fe2O3 glassy phase, it was found that the increase of basicity and Fe2O3 content (25%–35%) was conducive to the dissolution of the glassy phase. However, there exist other elements apart from Ca, Fe, and Si in the glassy phase of the actual dephosphorisation slag. Some researchers investigated the influence of Na2O and Al2O3 on the dissolution behaviour of valuable elements and found that the addition of Na2O promoted the enrichment of the P-rich phase in the dephosphorisation slag. 22 The accumulation of the RO phase by Al2O3 addition was conducive to the dissolution of the P element, 23 but there were few studies on the influence of Na2O and Al2O3 in the glassy phase on the dissolution behaviour. According to previous studies, several glassy phases with various Na2O and Al2O3 contents were synthesised and leached in a citric acid solution to simulate the weakly acidic conditions found near plant roots. The dissolution ratios of Ca, Si, and Fe were examined, and the dissolution mechanisms were analysed from the perspective of silicate structure. This study aimed to establish a theoretical basis for agricultural applications and high-value utilisation of dephosphorisation slag.
Experimental method
Glassy phase synthesis
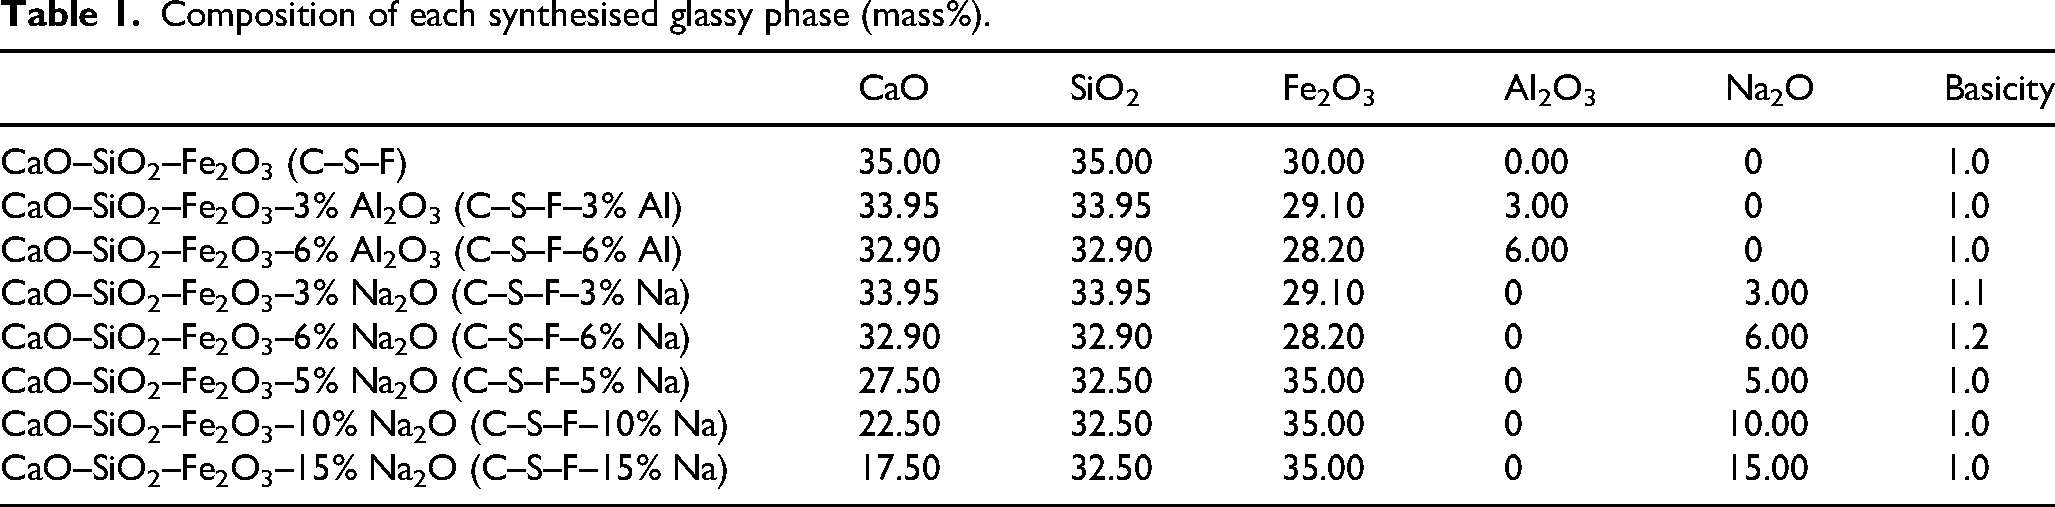
Reagent-grade CaCO3, SiO2, Fe2O3, Al2O3 and Na2SiO3 were used in this experiment. The reagents were mixed to synthesise glassy phases with different mass ratios of Al2O3 or Na2O (0%, 3%, and 6%). To study the effect of the substitution of CaO with Na2O as the basic component, glass samples with different mass ratios of Na2O substitution (5%, 10%, and 15%) were synthesised. CaO was prepared by calcining CaCO3 in an Al2O3 crucible at 1273 K for 10 h. Based on the target composition, 10 g of reagents were thoroughly mixed and heated to 1773 K in a Pt crucible under atmospheric conditions to form a homogeneous liquid phase. Following the melting process, the melt was quenched with water at 1773 K. The chemical composition of eight kinds of glassy phases is listed in Table 1. For the Na2O-substituted series (C–S–F–5% Na, 10% Na, and 15% Na), the Fe2O3 content was fixed, and SiO2 was adjusted to maintain a constant (CaO + Na2O)/SiO2 mass ratio, thereby isolating the effect of Na2O substitution for CaO.
Composition of each synthesised glassy phase (mass%).
The mineralogical compositions of synthesised samples were analysed by X-ray diffraction (XRD) and scanning electron microscope–energy dispersive X-ray spectrometer (SEM–EDS). Raman spectra were measured using a laser Raman microscope produced by JY Co. Ltd. The excitation laser used for analysis had a wavelength of 488 nm, a lens magnification of 50×, and a light source power of 100 MW. The glassy phases were scanned with a frequency range of 400–1300 cm−1 and a wavenumber precision of 1 cm−1. Two replicates were made for each measurement, and integration was performed to obtain the Raman spectra.
Leaching experiment
The primary research methodology and the configuration of the leaching experiment are illustrated in Figure 1. The synthesised glass phases were crushed and ground to particles with sizes <53 µm. One gram of powder was added to a Teflon beaker containing 300 mL of deionised water placed in an isothermal water bath (298 K). The aqueous solution was stirred at a rotational speed of 300 r/min using the magnetic stirrer. During dissolution, Ca2+ ions dissolved into the aqueous solution, which caused an increase in pH. The dilute citric acid (H3C6H5O7, 0.1 mol/L) was continuously injected through a peristaltic pump to keep the constant pH value of the aqueous solution, which simulated the weakly acidic environment of the plant root system. Previous studies 24 have demonstrated that almost all elements in the CaO–SiO2–FeO glassy phase were dissolved within approximately 90 min. Consequently, the reaction time of 90 min is fixed to investigate the effect of Al2O3 and Na2O addition on the dissolution behaviour of glassy phases. After 90 min, approximately 5 mL of leachate was sampled and filtered using a syringe filter (<45 µm).
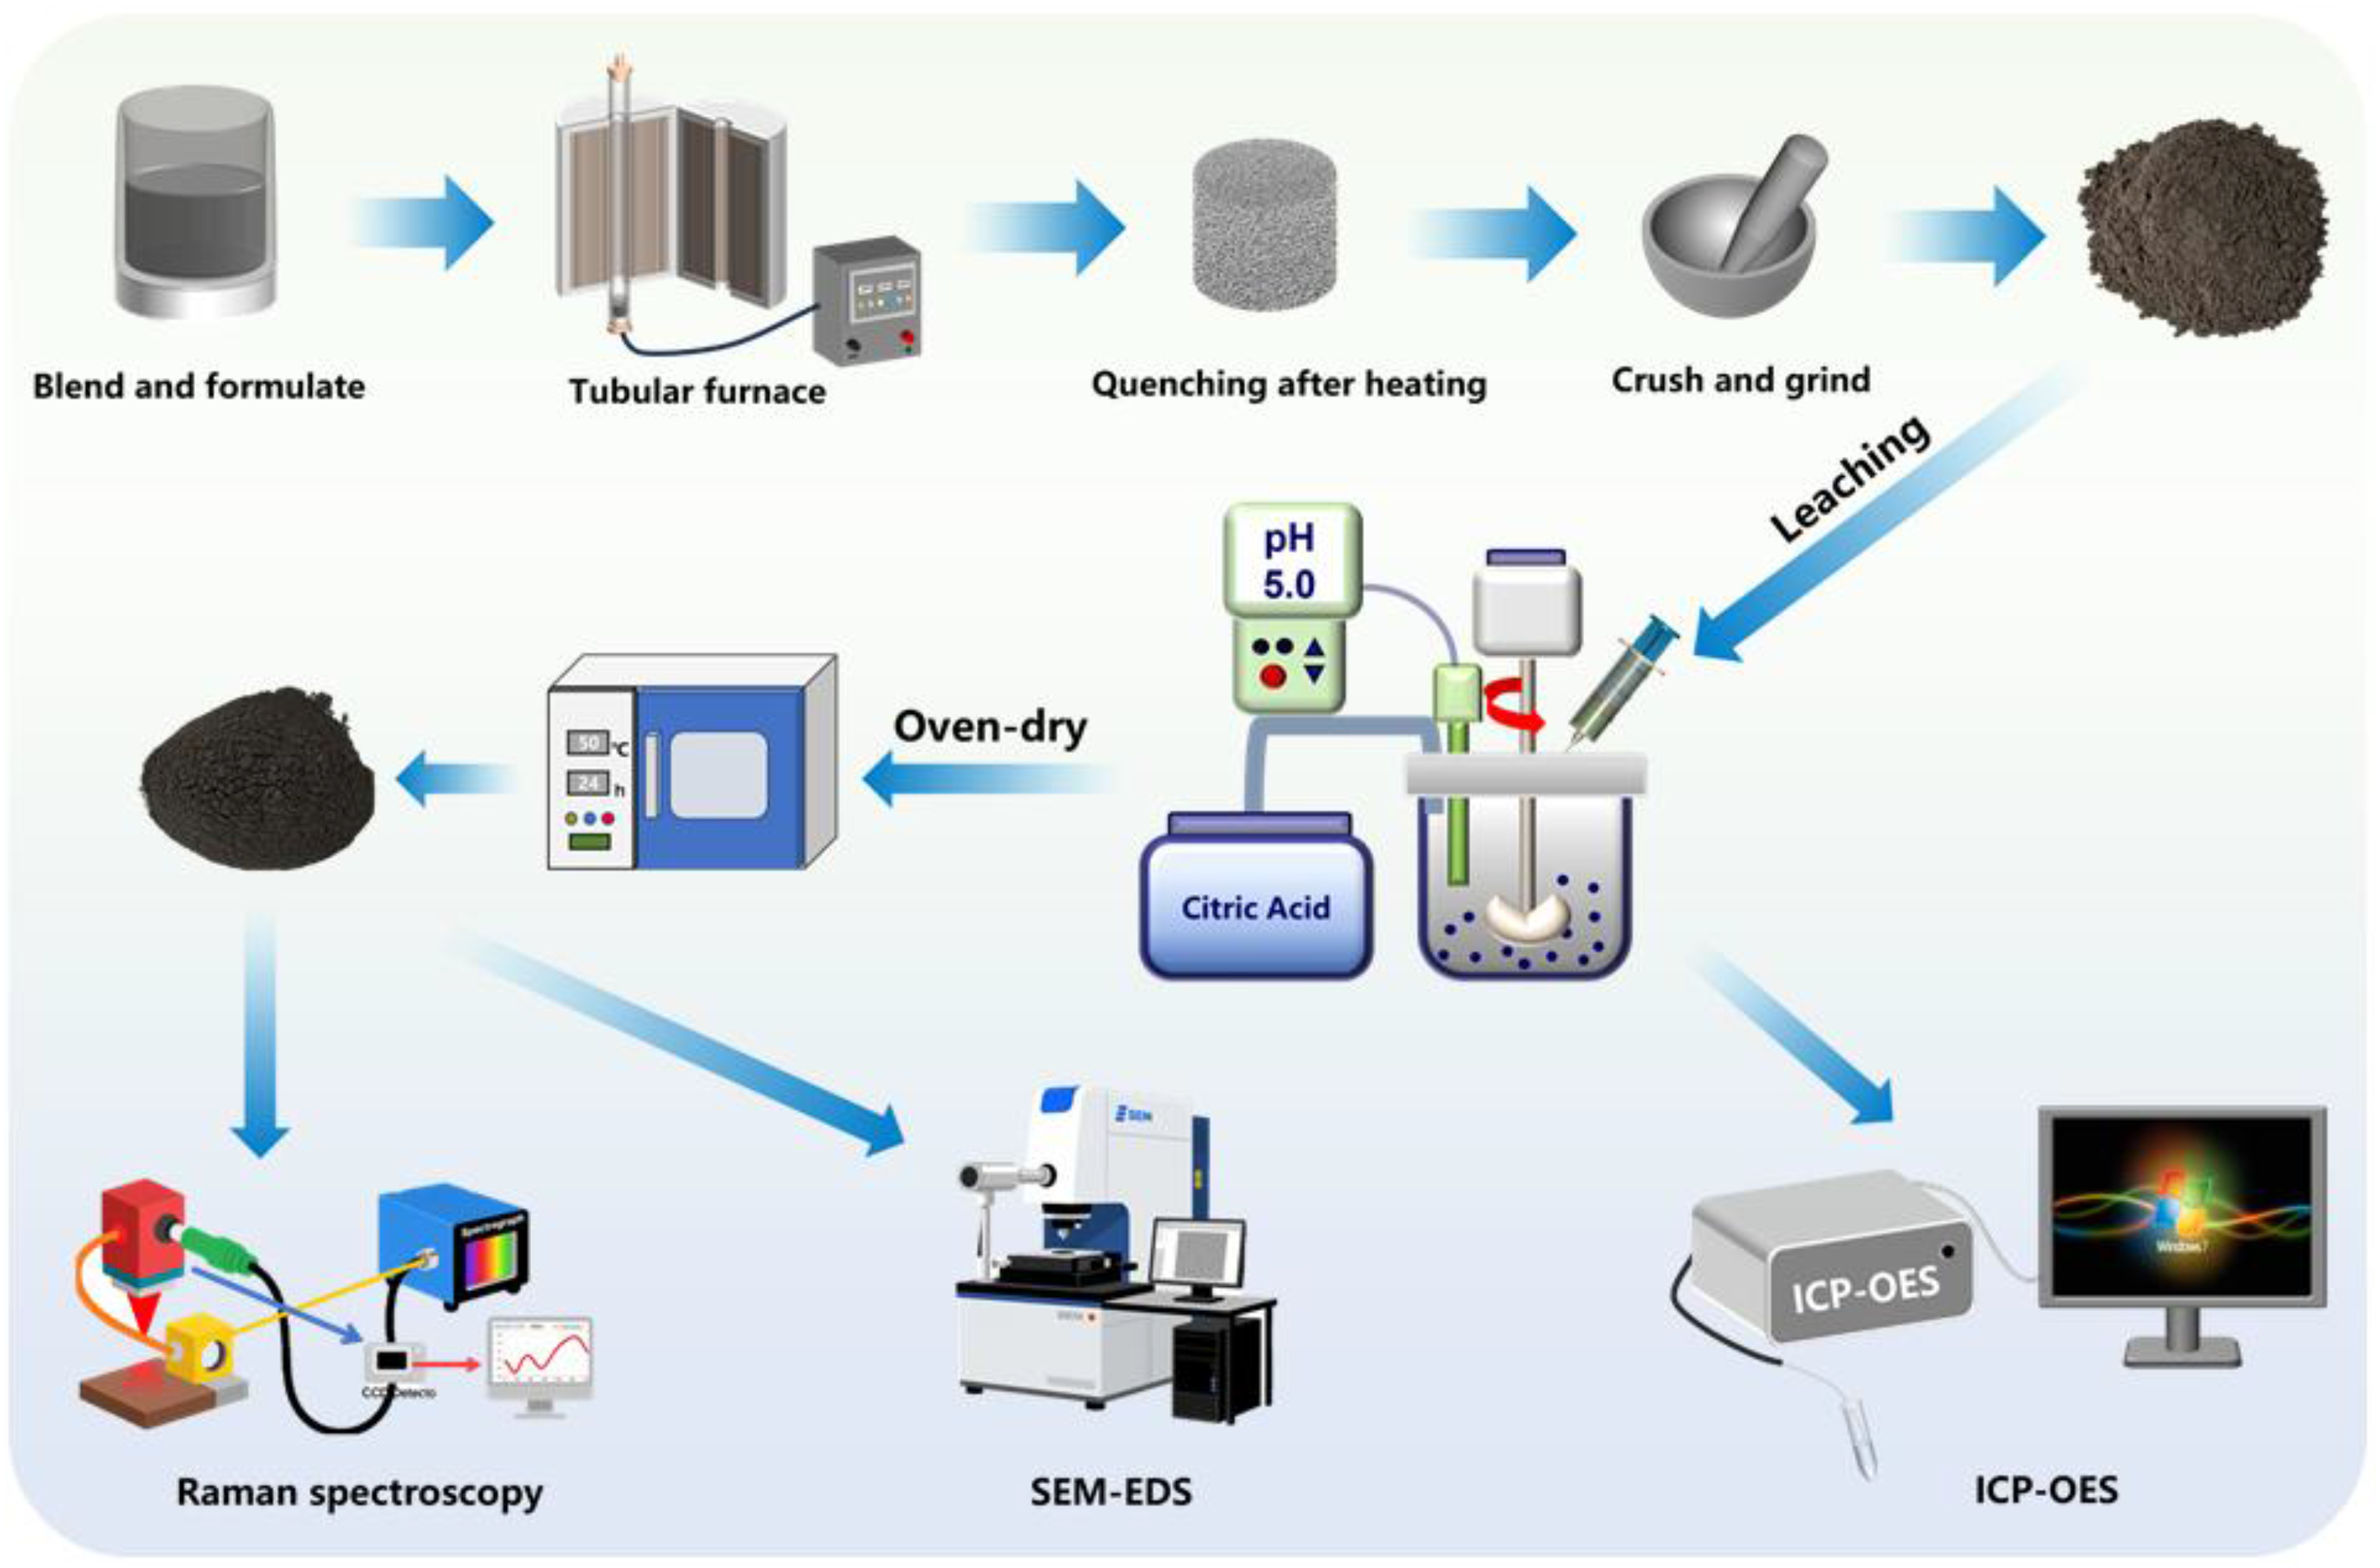
Research methodology and the configuration of the leaching experiment.
The concentrations of various elements in the leachate were analysed using an Inductively Coupled Plasma Optical Emission Spectrometer. The remaining solution was filtered by vacuum filtration, and the undissolved slag sample was collected. The mineralogical composition of the residue was analysed by using SEM–EDS and XRD. To investigate the dissolution mechanism of glassy phases modified with Al2O3 and Na2O, Raman spectroscopy was used to analyse the silicate structure of the glassy phase,
25
which can characterise the structural evolution of silicate with different Al2O3 and Na2O contents. The microstructure of the residues was also investigated via Raman spectroscopy. According to the composition of leachate, equation (1) was used to calculate the dissolution ratio of each element from different samples:
Results and discussion
Mineralogical composition
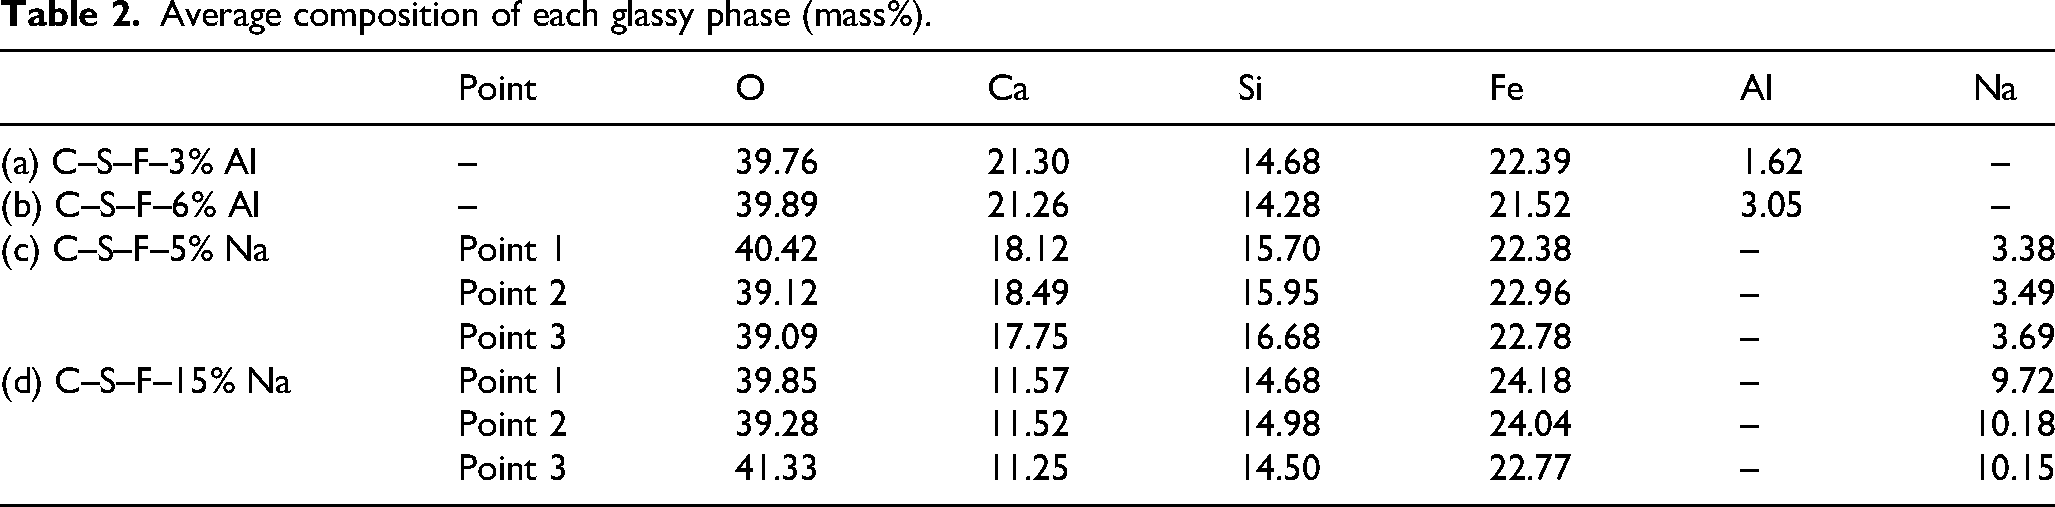
Four typical glass samples were selected, and their microstructure is shown in Figure 2(a)–(d). The morphology of C–S–F–5% Na and C–S–F–15% Na exhibits small pits, which may result from the continuous grinding and polishing during the SEM sample preparation. According to the EDS analysis, there was no apparent difference in chemical composition between the pit and the smooth part, as shown in Table 2, which further proved that this phenomenon is not caused by crystal phase precipitation. The samples were also confirmed as a glassy phase by XRD analysis, as shown in Figure 2(e). An amorphous hump was observed at approximately 30° in the glass phase. The intensity and position of the broad peaks exhibited slight variations among samples, potentially attributable to differences in the glass compositions within the SiO4 tetrahedral framework.
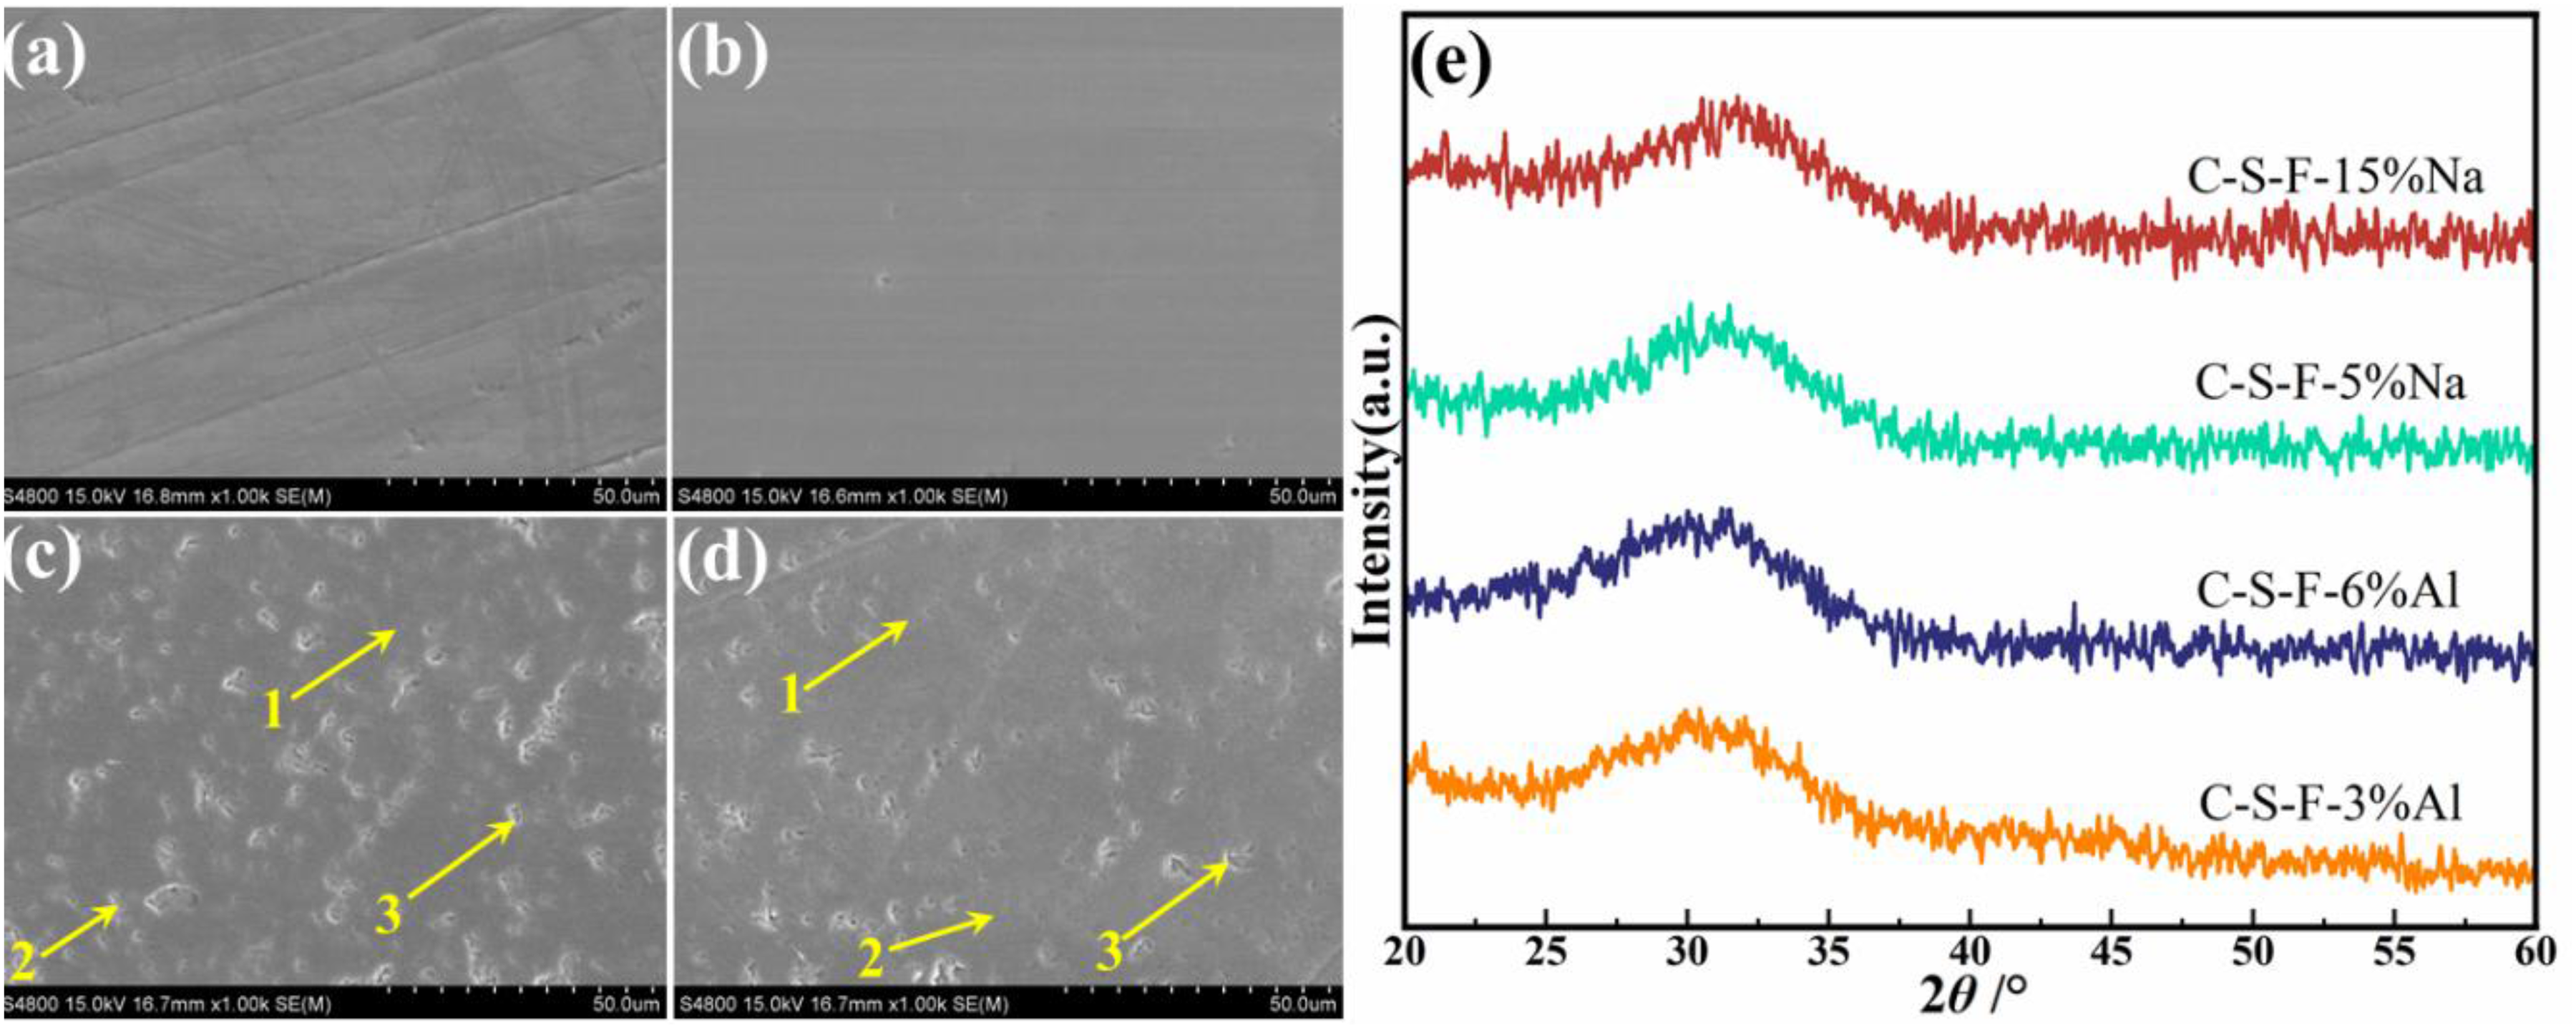
Appearance of the surface of glassy phases (a) C–S–F–3% Al, (b) C–S–F–6% Al, (c) C–S–F–5% Na, (d) C–S–F–15% Na, and (e) X-ray diffraction (XRD) patterns of each glass.
Average composition of each glassy phase (mass%).
Effect of Al2O3 on dissolution behaviour of glassy phases
The dissolution ratio of each element from glassy phases with different Al2O3 contents at pH 5 is shown in Figure 3. For the original C–S–F glass, the dissolution ratios of Ca, Si, and Fe were 13.18%, 14.99%, and 14.51%, respectively. The dissolution of C–S–F–3% Al glass in the aqueous solution was inhibited, leading to a lower dissolution ratio of each element. Among them, Al2O3 addition has the least inhibitory effect on the dissolution of Fe elements, and its dissolution ratio decreased slightly, approximately 13.4%. When the Al2O3 content was further increased to 6%, the dissolution ratio of each element continued to decline, and those of Ca, Si, and Fe from C–S–F–6% Al were only 7.22%, 7.86%, and 9.95%, respectively. In particular, the Al2O3 that was added to the glass was not dissolved in large quantities; its dissolution ratio was around 5%. The leaching efficiency of the Fe element was higher than that of other elements. Therefore, to design a slag sample with high supply ability of Ca, Si, and Fe, its glassy phase should contain a lower Al2O3 content.
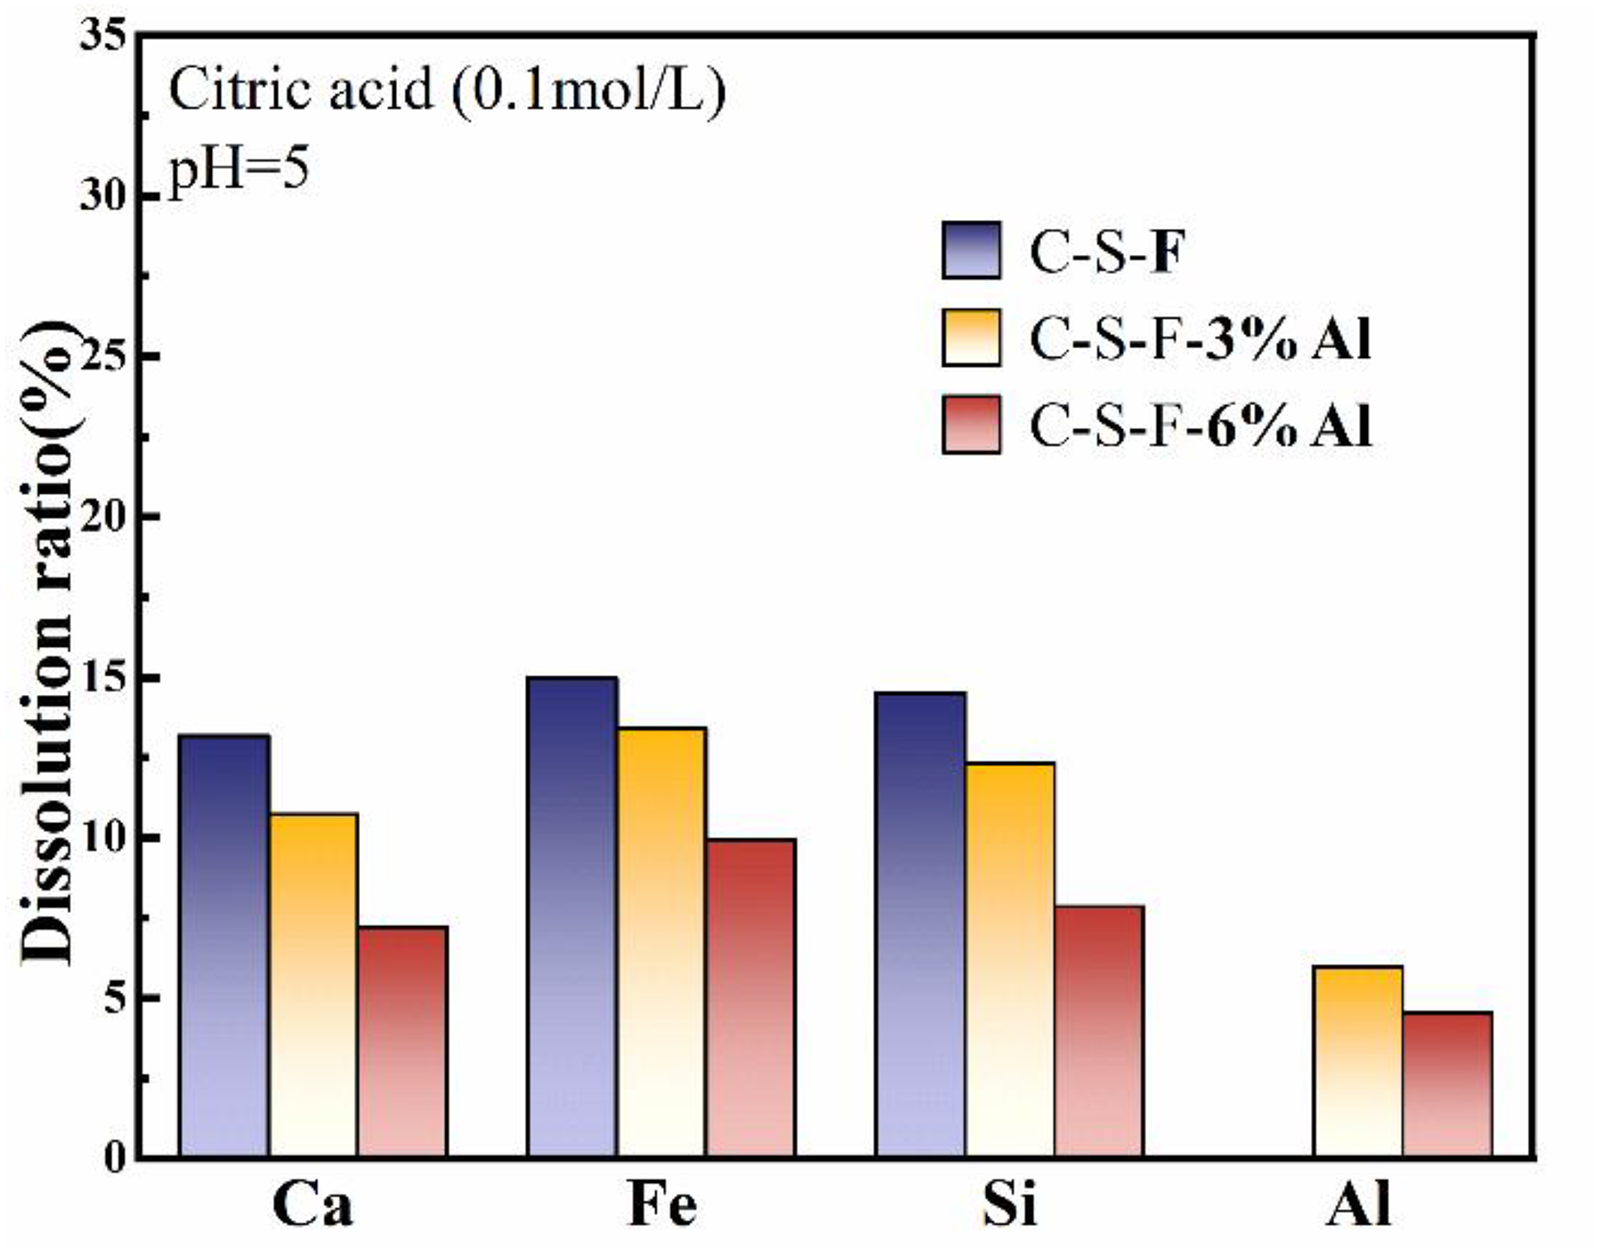
Dissolution behaviour of each element from glassy phases with different Al2O3 contents.
Raman spectra were obtained in the range of 400–1300 cm−1 to investigate the effect of Al2O3 addition on the glass structure. As shown in Figure 4(a), the spectra for the glasses are divided into two central wavenumber regions: 1200–800 cm−1 and 800–600 cm−1, corresponding to the Si–O–Si bonding and Si–O symmetric stretching vibrations, 26 respectively. Fe3+ occupies both tetrahedral and octahedral positions as an amphoteric cation. Peaks in the range of 550–650 cm−1 are attributed to the symmetric stretching vibrations of Fe3+ in octahedral coordination, while peaks around 650–700 cm−1 are associated with Fe3+ in tetrahedral coordination. 27
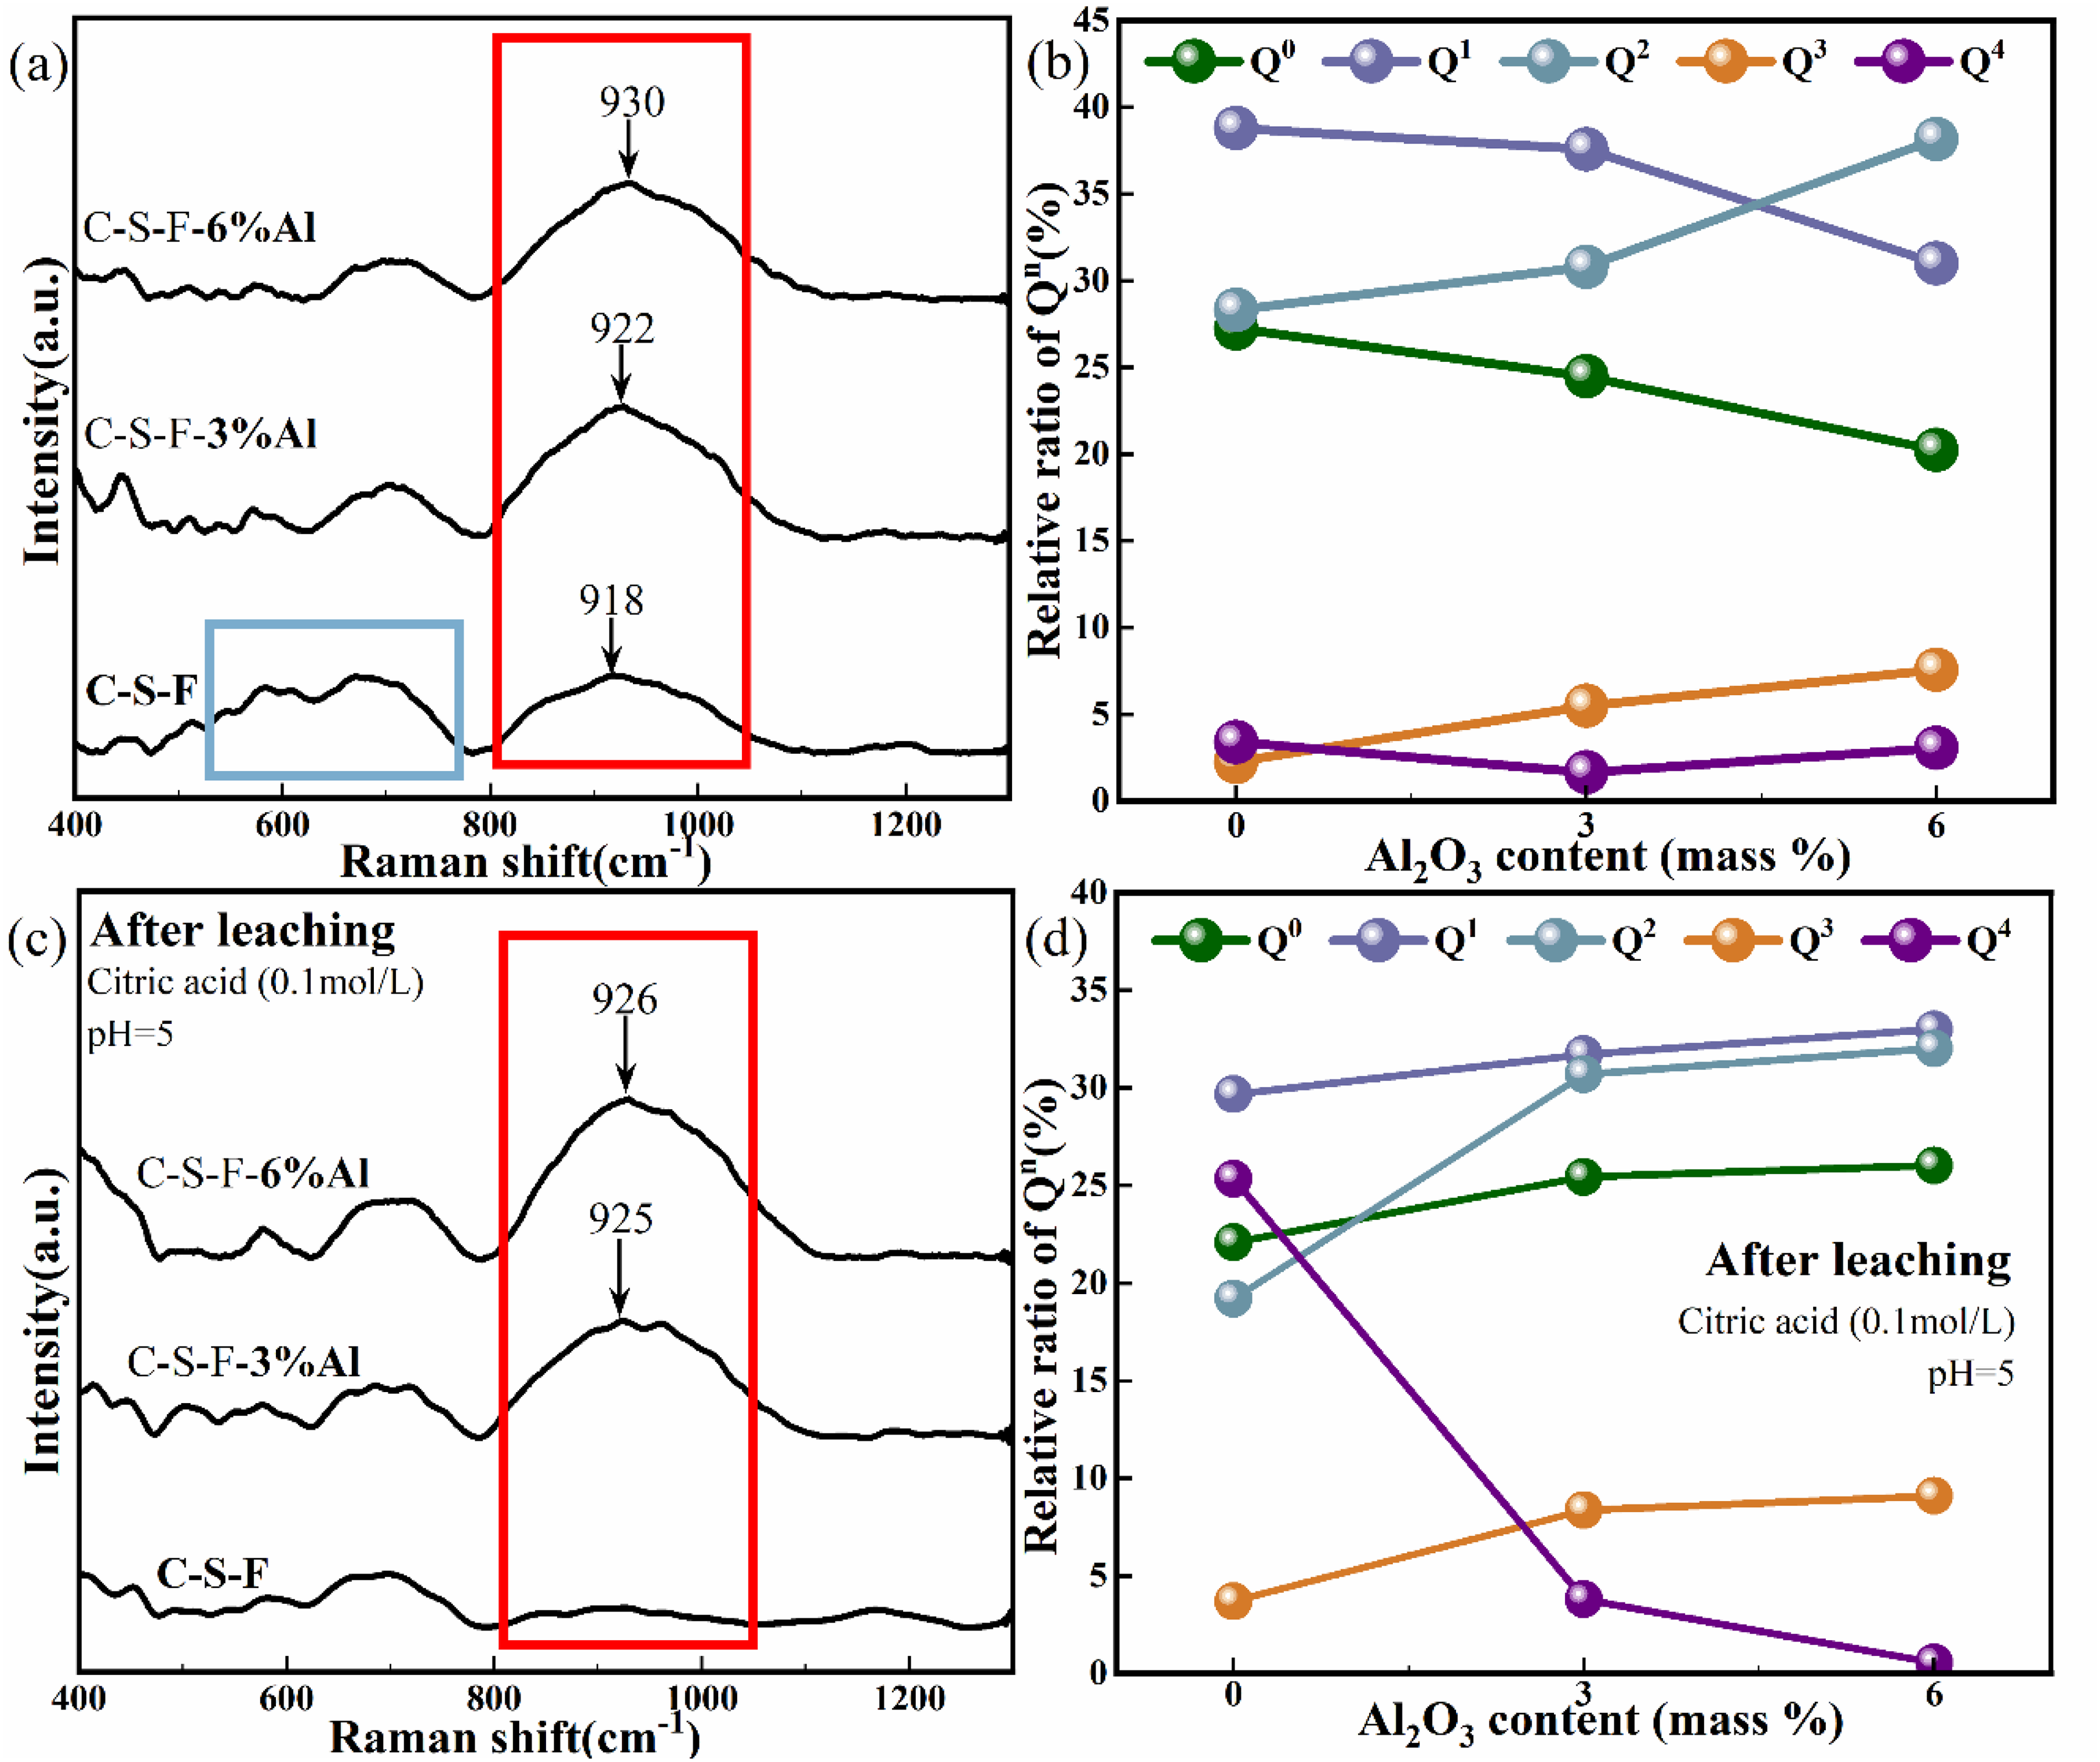
Effects of Al2O3 content on the Raman spectrum of (a) glasses and (c) their residues, and the unit structure ratio of SiO4 tetrahedra of (b) glasses and (d) their residues.
A broad Raman peak was observed in the 600–700 cm−1 range for the original C–S–F glass. There was no distinct peak that appeared around 650 cm−1 in the glasses with Al2O3 addition, which concentrated around 700 cm−1. This could be attributed to the Fe3+ coordination state changing. An increasing Al2O3 content led to a reduction in [FeO6]/[FeO4], 28 with a shift in the Raman spectrum from 675 to 712 cm−1. The Raman spectra of the glasses revealed a significant increase in peak intensity around 920 cm−1 after the addition of Al2O3, accompanied by a shift in the peak position from 918 to 930 cm−1. It indicated that Al2O3 addition induced local structural changes within the silicate network.
After conducting peak fitting analysis on the Raman spectra of glasses, the 
In the C–S–F glassy phase, the ratios of
It is considered that the improvement in stability was closely related to structural changes within the silicate framework. This was confirmed by the corresponding dissolution ratio of each glass. The results showed that with the increase of Al2O3 addition in the glass, the dissolution ratio showed a significant downward trend. When the molar ratio of Al2O3/MO (MO represents basic oxides) was <1.0, the Al–O coordination existed as tetrahedra, similar to the [SiO4] tetrahedral units. In this study, MO primarily presents as CaO, and the Al2O3 addition was relatively low, resulting in a lower molar ratio. Based on these results, it could be concluded that Al2O3 acted as a network former (NWF) in this glass, promoting the polymerisation of the network structure.
Figure 4(c) presents the Raman spectra of residues after leaching of glasses with different Al2O3 contents. The residue of C–S–F glass exhibited obvious changes, with significant peaks near 600–650 cm−1 and 800–1000 cm−1 absent and only a single peak at 699 cm−1 detected. Compared to the residue of C–S–F glass, a consistent rightward shift in the characteristic Raman peaks near 700 cm−1 was observed in the residue with Al2O3 addition, and the intensity of the peak near 920 cm−1 increased slightly.
This result is also shown in the ratio of each structural unit, as shown in Figure 4(d). After the dissolution of the C–S–F glass, the proportions of
Effect of Na2O on the dissolution behaviour of glassy phases
The dissolution behaviour of glasses with different Na2O contents is shown in Figure 5. The dissolution ratios of various elements from C–S–F–3% Na glass increased compared to C–S–F glass. Among them, the dissolution ratios of Fe and Si elements increased significantly, reaching 21.6% and 21.0%, respectively. The dissolution ratio of Ca also increased, but the growth rate was lower than that of other elements, rising from 13.2% to 17.7%. The dissolution ratio of Na was lower than that of other elements, reaching 13.2%. However, when the Na2O content continued to increase to 6%, the dissolution of the glass phase was not improved, and the dissolution ratios of all elements decreased significantly. Increasing Na2O content had the most significant impact on the dissolution ratio of Si, which dropped from 21.0% to 5.1%. For the C–S–F–6% Na glass, the dissolution ratio of Fe was 8.8%, higher than that of other elements.
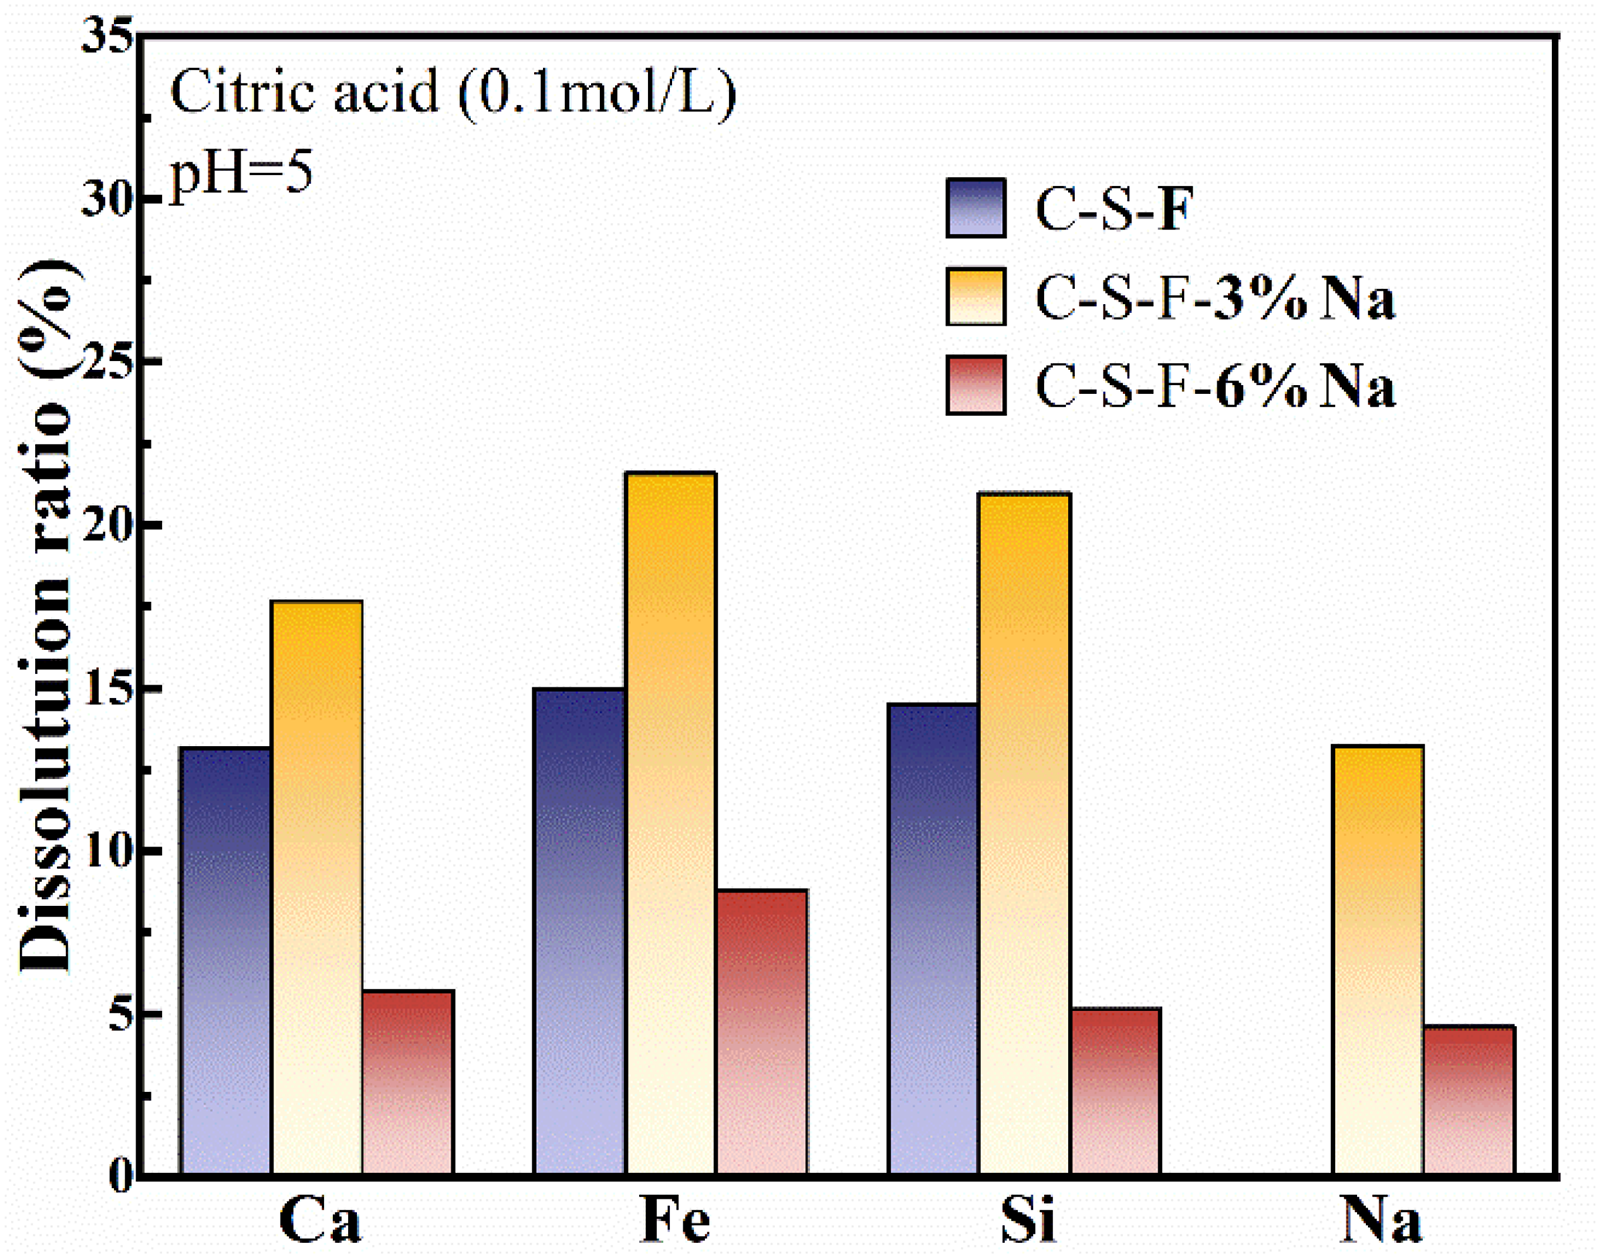
Dissolution behaviour of each element from glassy phases with different Na2O contents.
Figure 6(a) presents the Raman spectra of glasses with Na2O addition. As the Na2O content increased, the central peak near 700 cm−1 shifted to a higher frequency, and the Raman spectra in the range of 550–650 cm−1 gradually became smoother, with no distinct peaks detected in this range for the C–S–F–6% Na glass. Around 920 cm−1, the main peak shifts from 918 to 913 cm−1. In the Raman spectrum of the C–S–F–3% Na glass, a broad peak was observed in this range, which was smoother than in other glasses. After Na2O modification, the ratios of 



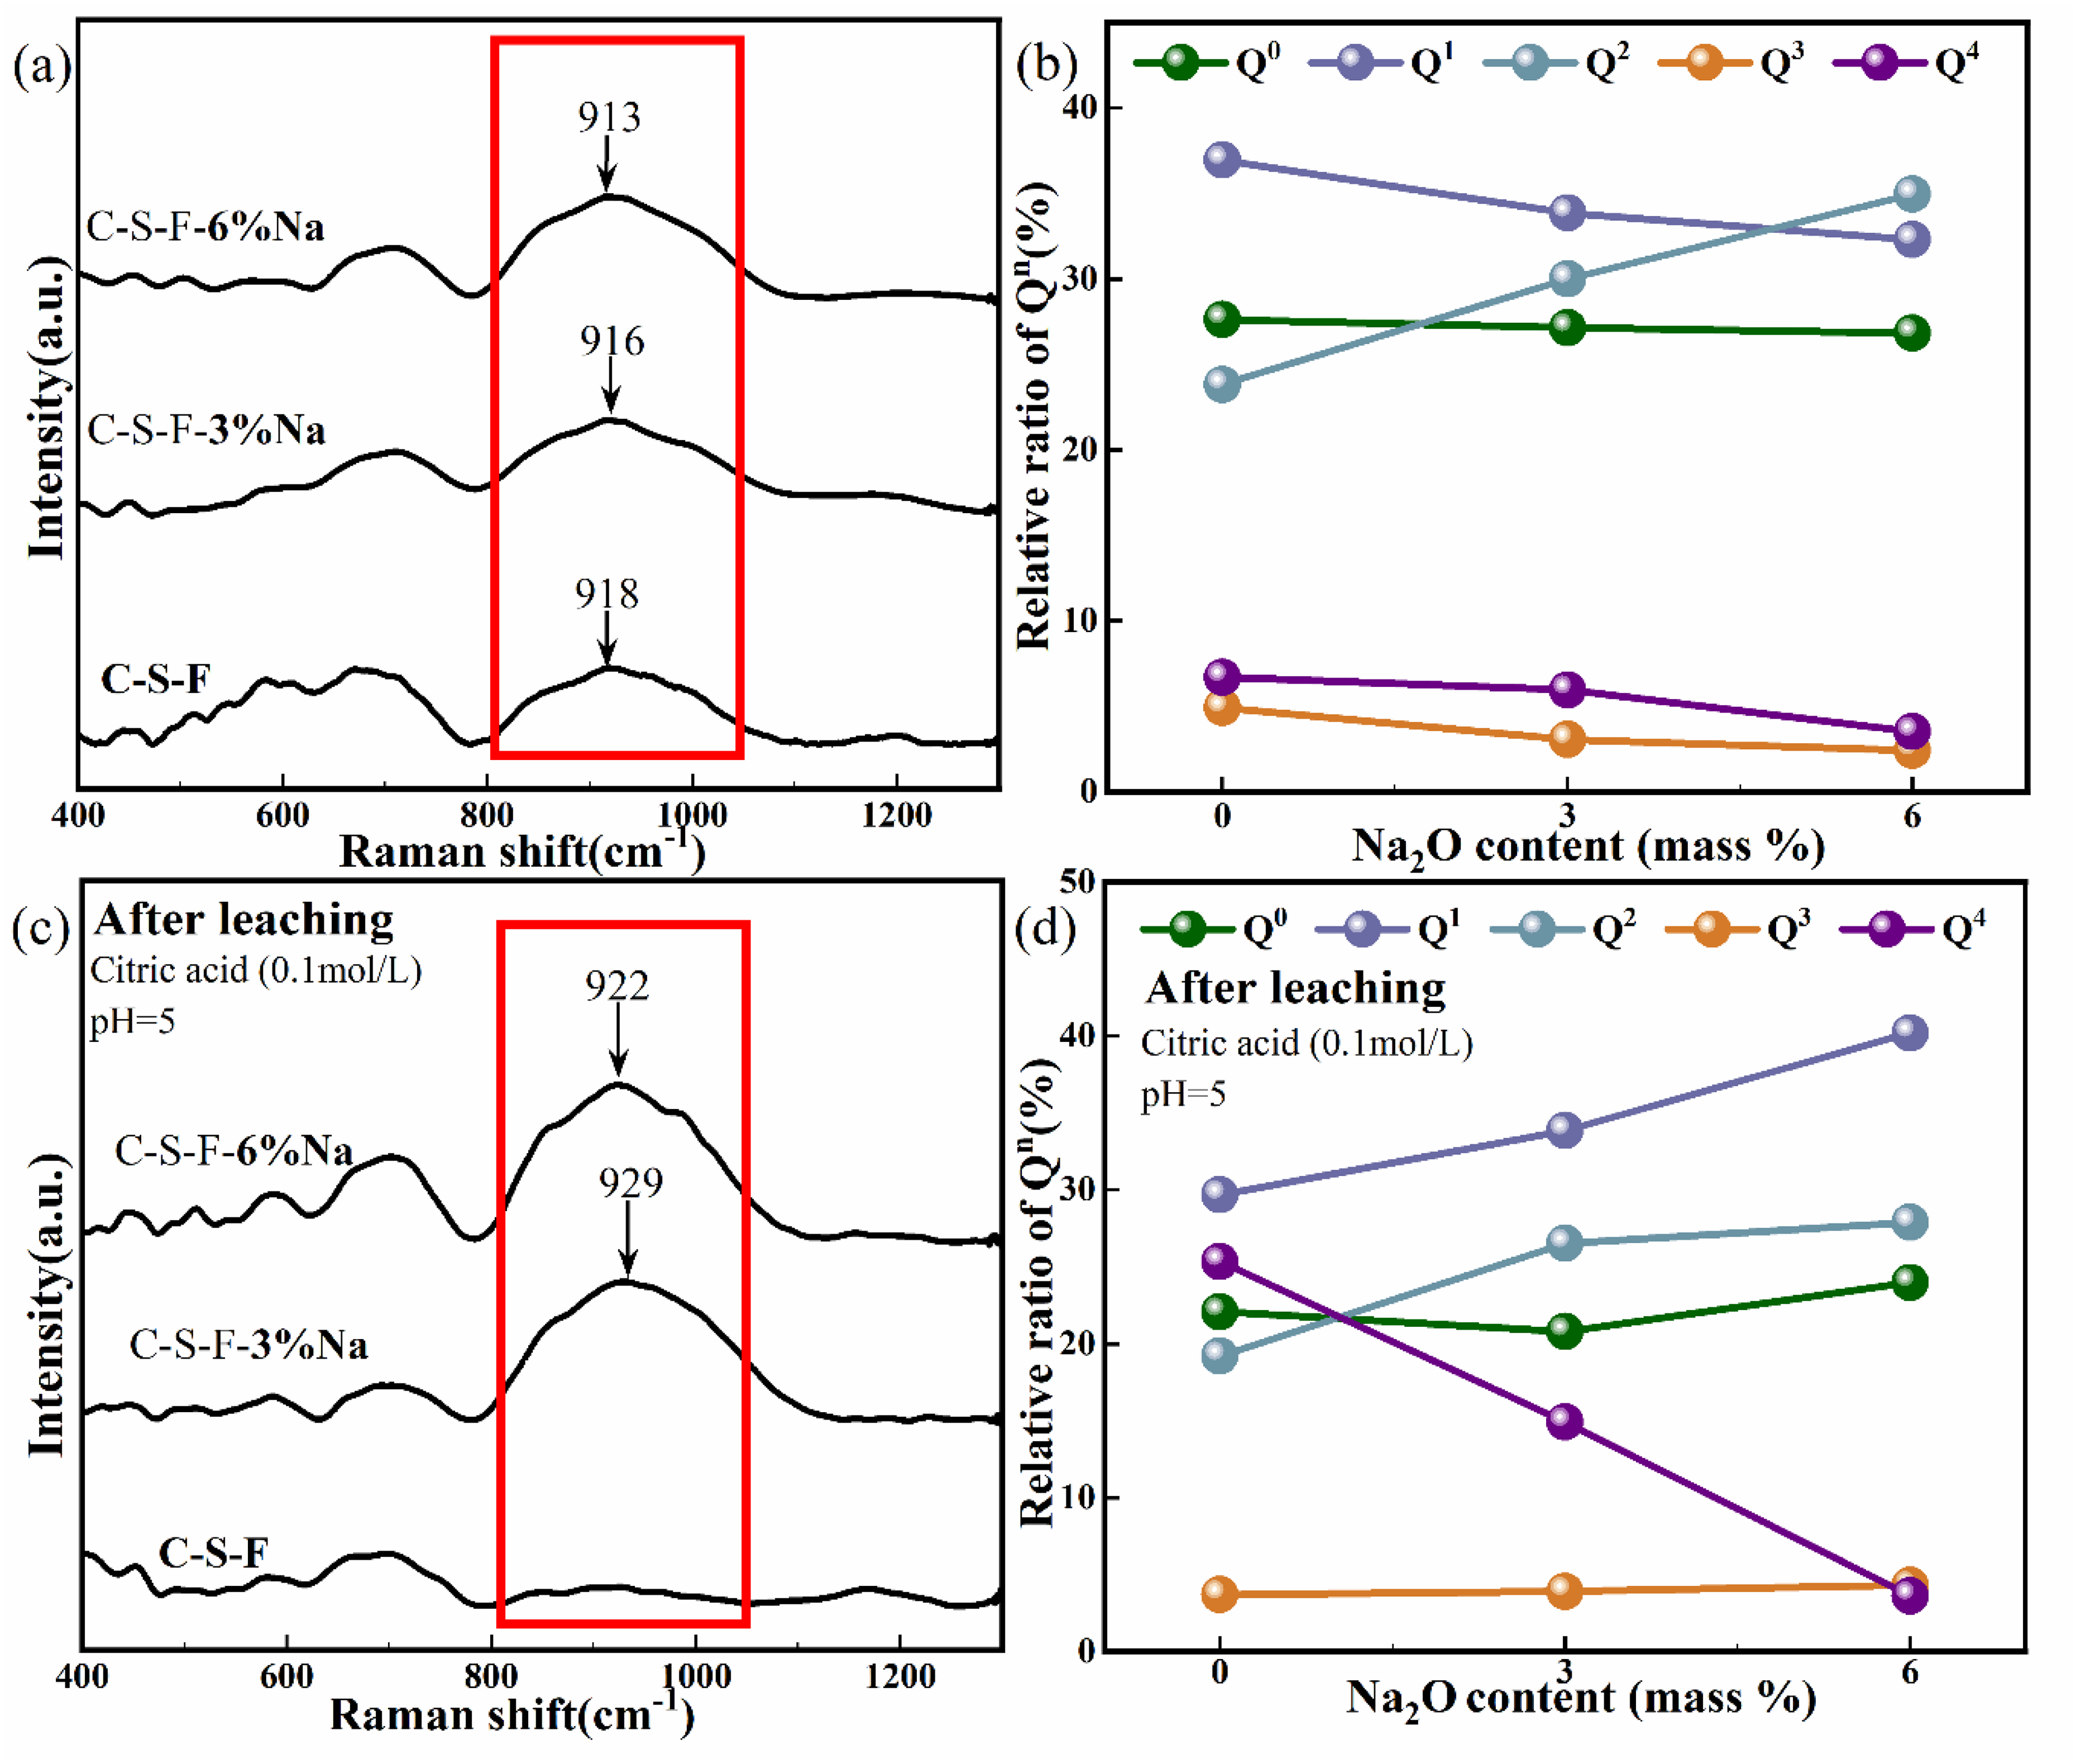
Effects of Na2O content on the Raman spectrum of (a) glasses and (c) their residues, and unit structure ratio of SiO4 tetrahedra of (b) glasses and (d) their residues.
where R+ is the cation of the basic oxides (CaO and Na2O). It is well-known that Na2O, acting as a network modifier (NWM), disrupts Si–O–Si bonds and introduces NBOs. Na2O strengthens the glass network by binding to NBOs in silicate tetrahedra, forming additional bonds. This structural reinforcement limits the selective leaching of
Figure 6(c) displays the Raman spectra of the residue after leaching of these glasses in the acid solution. The peak associated with Si–O bond vibrations near 920 cm−1 shifts to the right, from 916 to 929 cm−1. In contrast, the Raman spectra of the C–S–F–6% Na glass showed only minor changes following leaching. Slight leftward shifts were observed in the peaks near 700 and 920 cm−1, be less pronounced. The deconvolution analysis of the Raman spectra for the residues is presented in Figure 6(d). After leaching, the ratios of
Effect of Na2O substitution for CaO on dissolution behaviour of glassy phases
To further explore the influence of the Na2O content on the dissolution behaviour of the C–S–F system glass, more glasses were synthesised in which the Na2O substitution (5%, 10%, and 15%) for the basic component CaO in the glasses. The dissolution ratios calculated by equation (1) are shown in Figure 7. The dissolution ratios of various elements continuously decreased with the increase in the Na2O substitution. In the C–S–F–15% Na glass, Ca, Si, and Na elements were hardly soluble, with dissolution ratios all around 1.0%. The dissolution ratio of Fe was still the highest in each glass, reaching 6.9% in the C–S–F–5% Na glass.
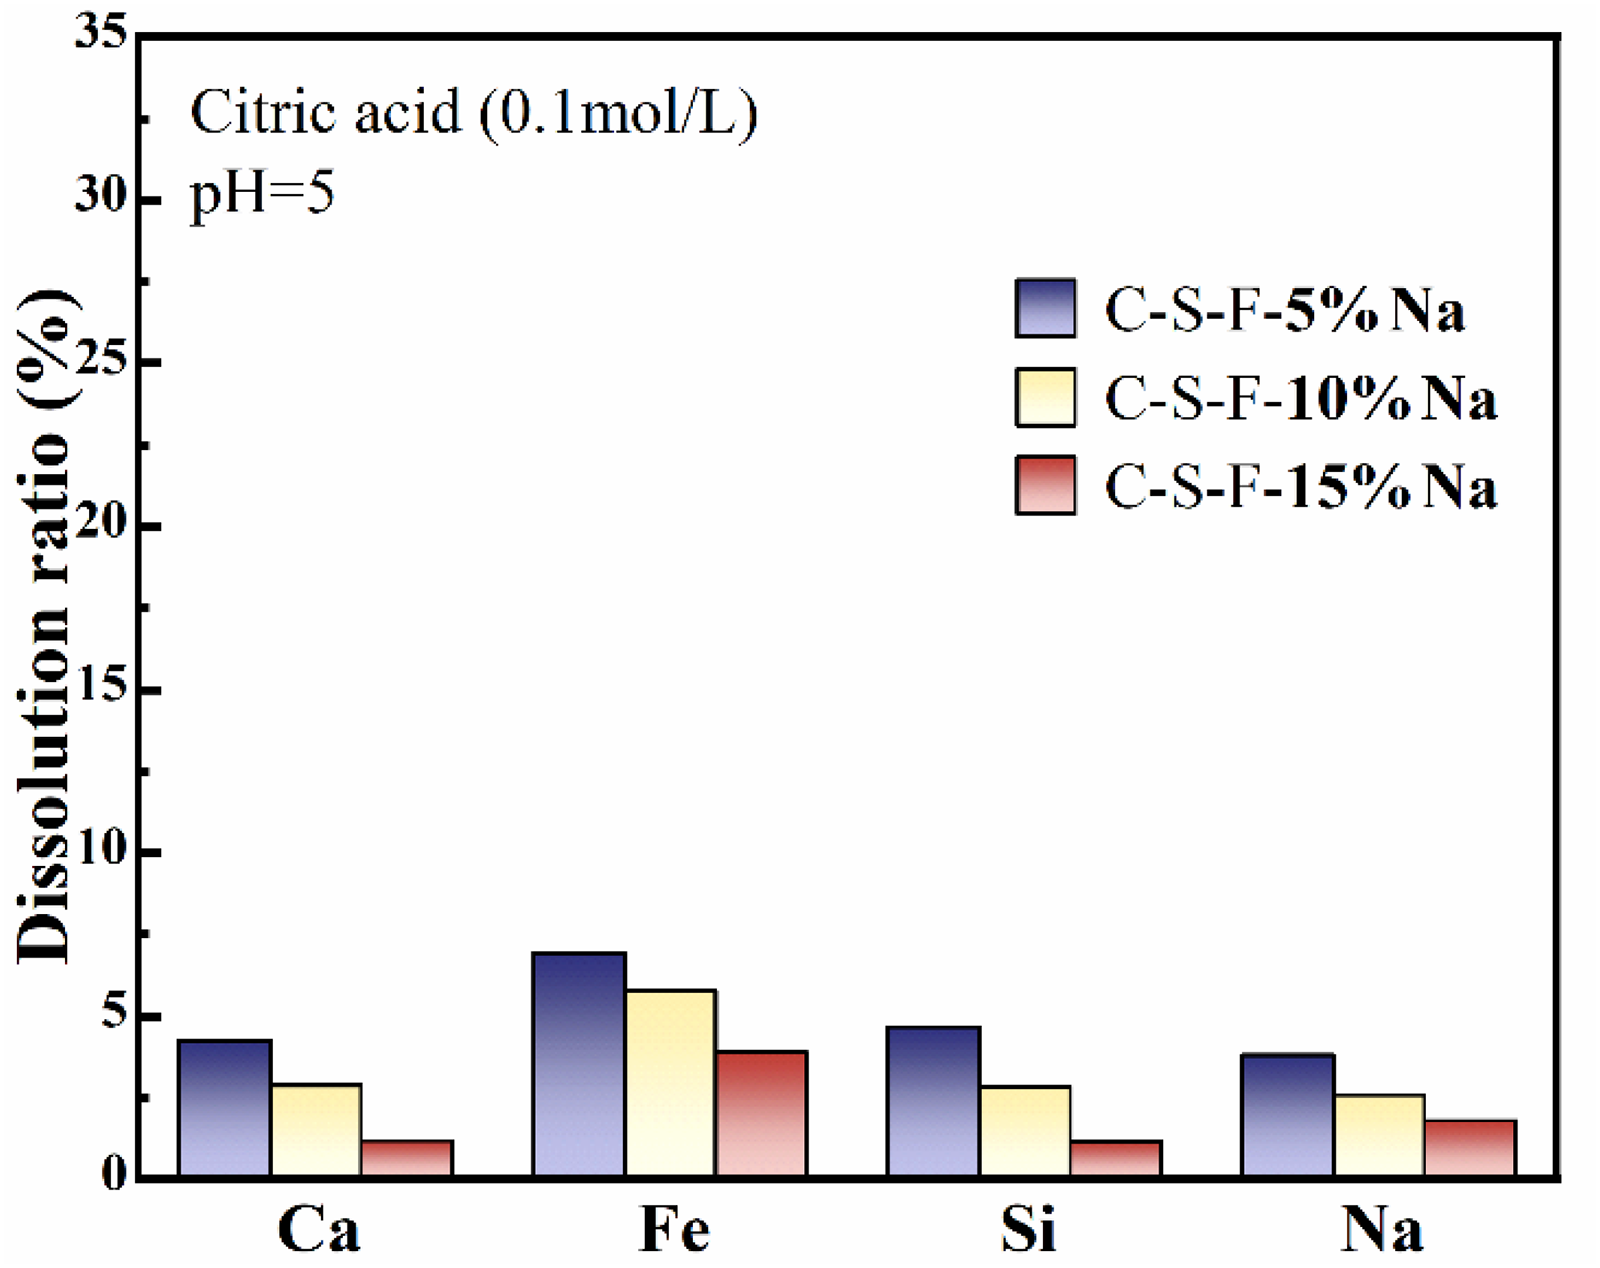
Dissolution behaviour of each element from glassy phases with different Na2O substitutions.
As the Na2O substitution increased, a frequency elevation was observed, accompanied by a reduction in weak peaks within 500–600 cm−1, resulting in a smoother spectrum, as shown in Figure 8(a). As the Na2O substitution increased, the characteristic peak of Fe ions around 700 cm−1 shifted from 675 to 725 cm−1. When the Na2O substitution rose from 0 to 10%, the Raman spectra exhibited a shift from 918 to 924 cm−1. However, this increase in substitution did not significantly influence peak intensity. Similar to the Raman spectra of C–S–F–3% Na glass in Figure 6(a), the silicate structure predominantly consisted of short-range structural units (
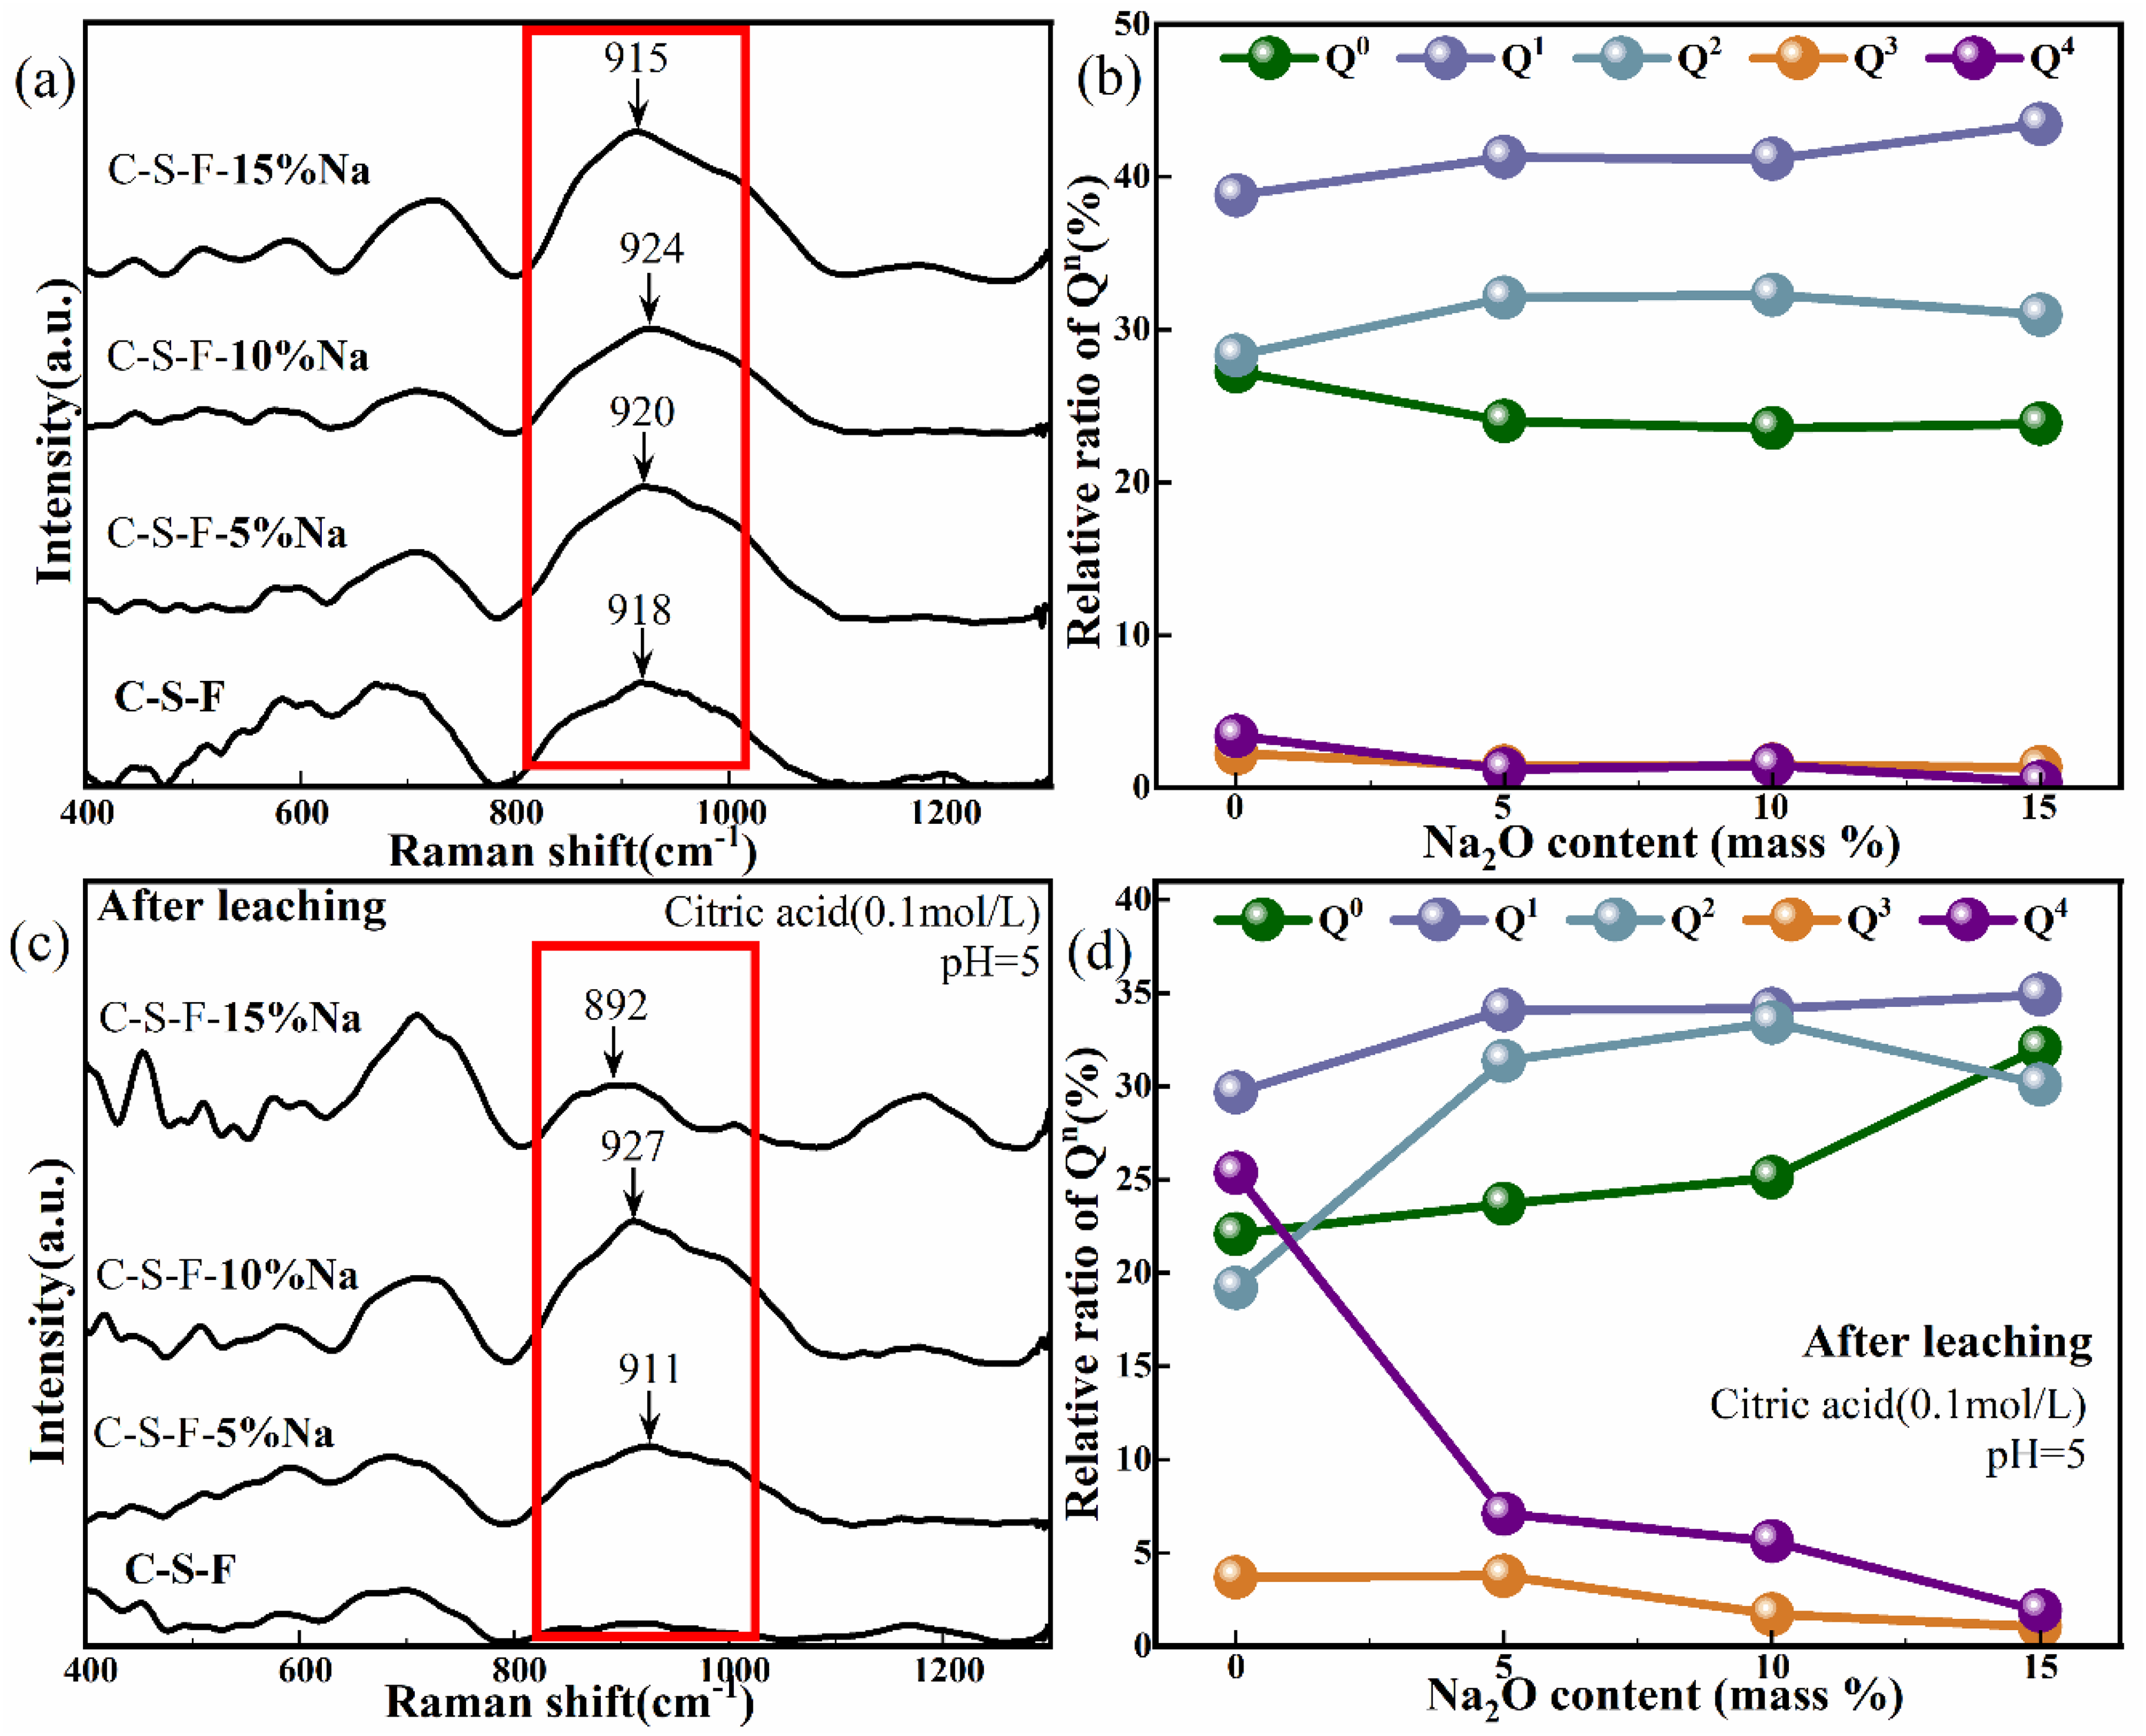
Effects of Na2O content on the Raman spectrum of (a) glasses and (c) their residues, and the unit structure ratio of SiO4 tetrahedra of (b) glasses and (d) their residues.
Notably, the Raman spectrum of the C–S–F–15% Na glass shows a distinct peak around 915 cm−1 with greater intensity than that observed in other glasses modified by Na2O. Using the Trimethylsilylation method, Yang et al. 34 investigated the structure of Na2O–CaO–SiO2 glasses and found that increasing the Na2O/CaO ratio enhances the degree of polymerisation (DOP = NBO/T) in the glass structure. A higher Na2O content reduces the ability of Ca+ ions to counteract the influence of Na+ ions. Therefore, as the Na2O substitution increased, the larger the effect of Na2O on the silicate structure, resulting in a higher DOP in the C–S–F–15% Na glass. The larger ionic radius and lower charge of Na+ facilitate its formation of ionic bonds with O2−, which occupy the voids in the glass network. This bonding increases the proportion of structural units containing a small amount of NBOs in the glassy phase. When the Ca2+ ions act as a network breaker, in order to use their double charge, they must form a link with the second NBOs separately. This is not the case with the Na+ ions, so silicates containing the M2O tend to have a higher DOP than those containing the MO. The schematic diagram is shown in Figure 9. 35
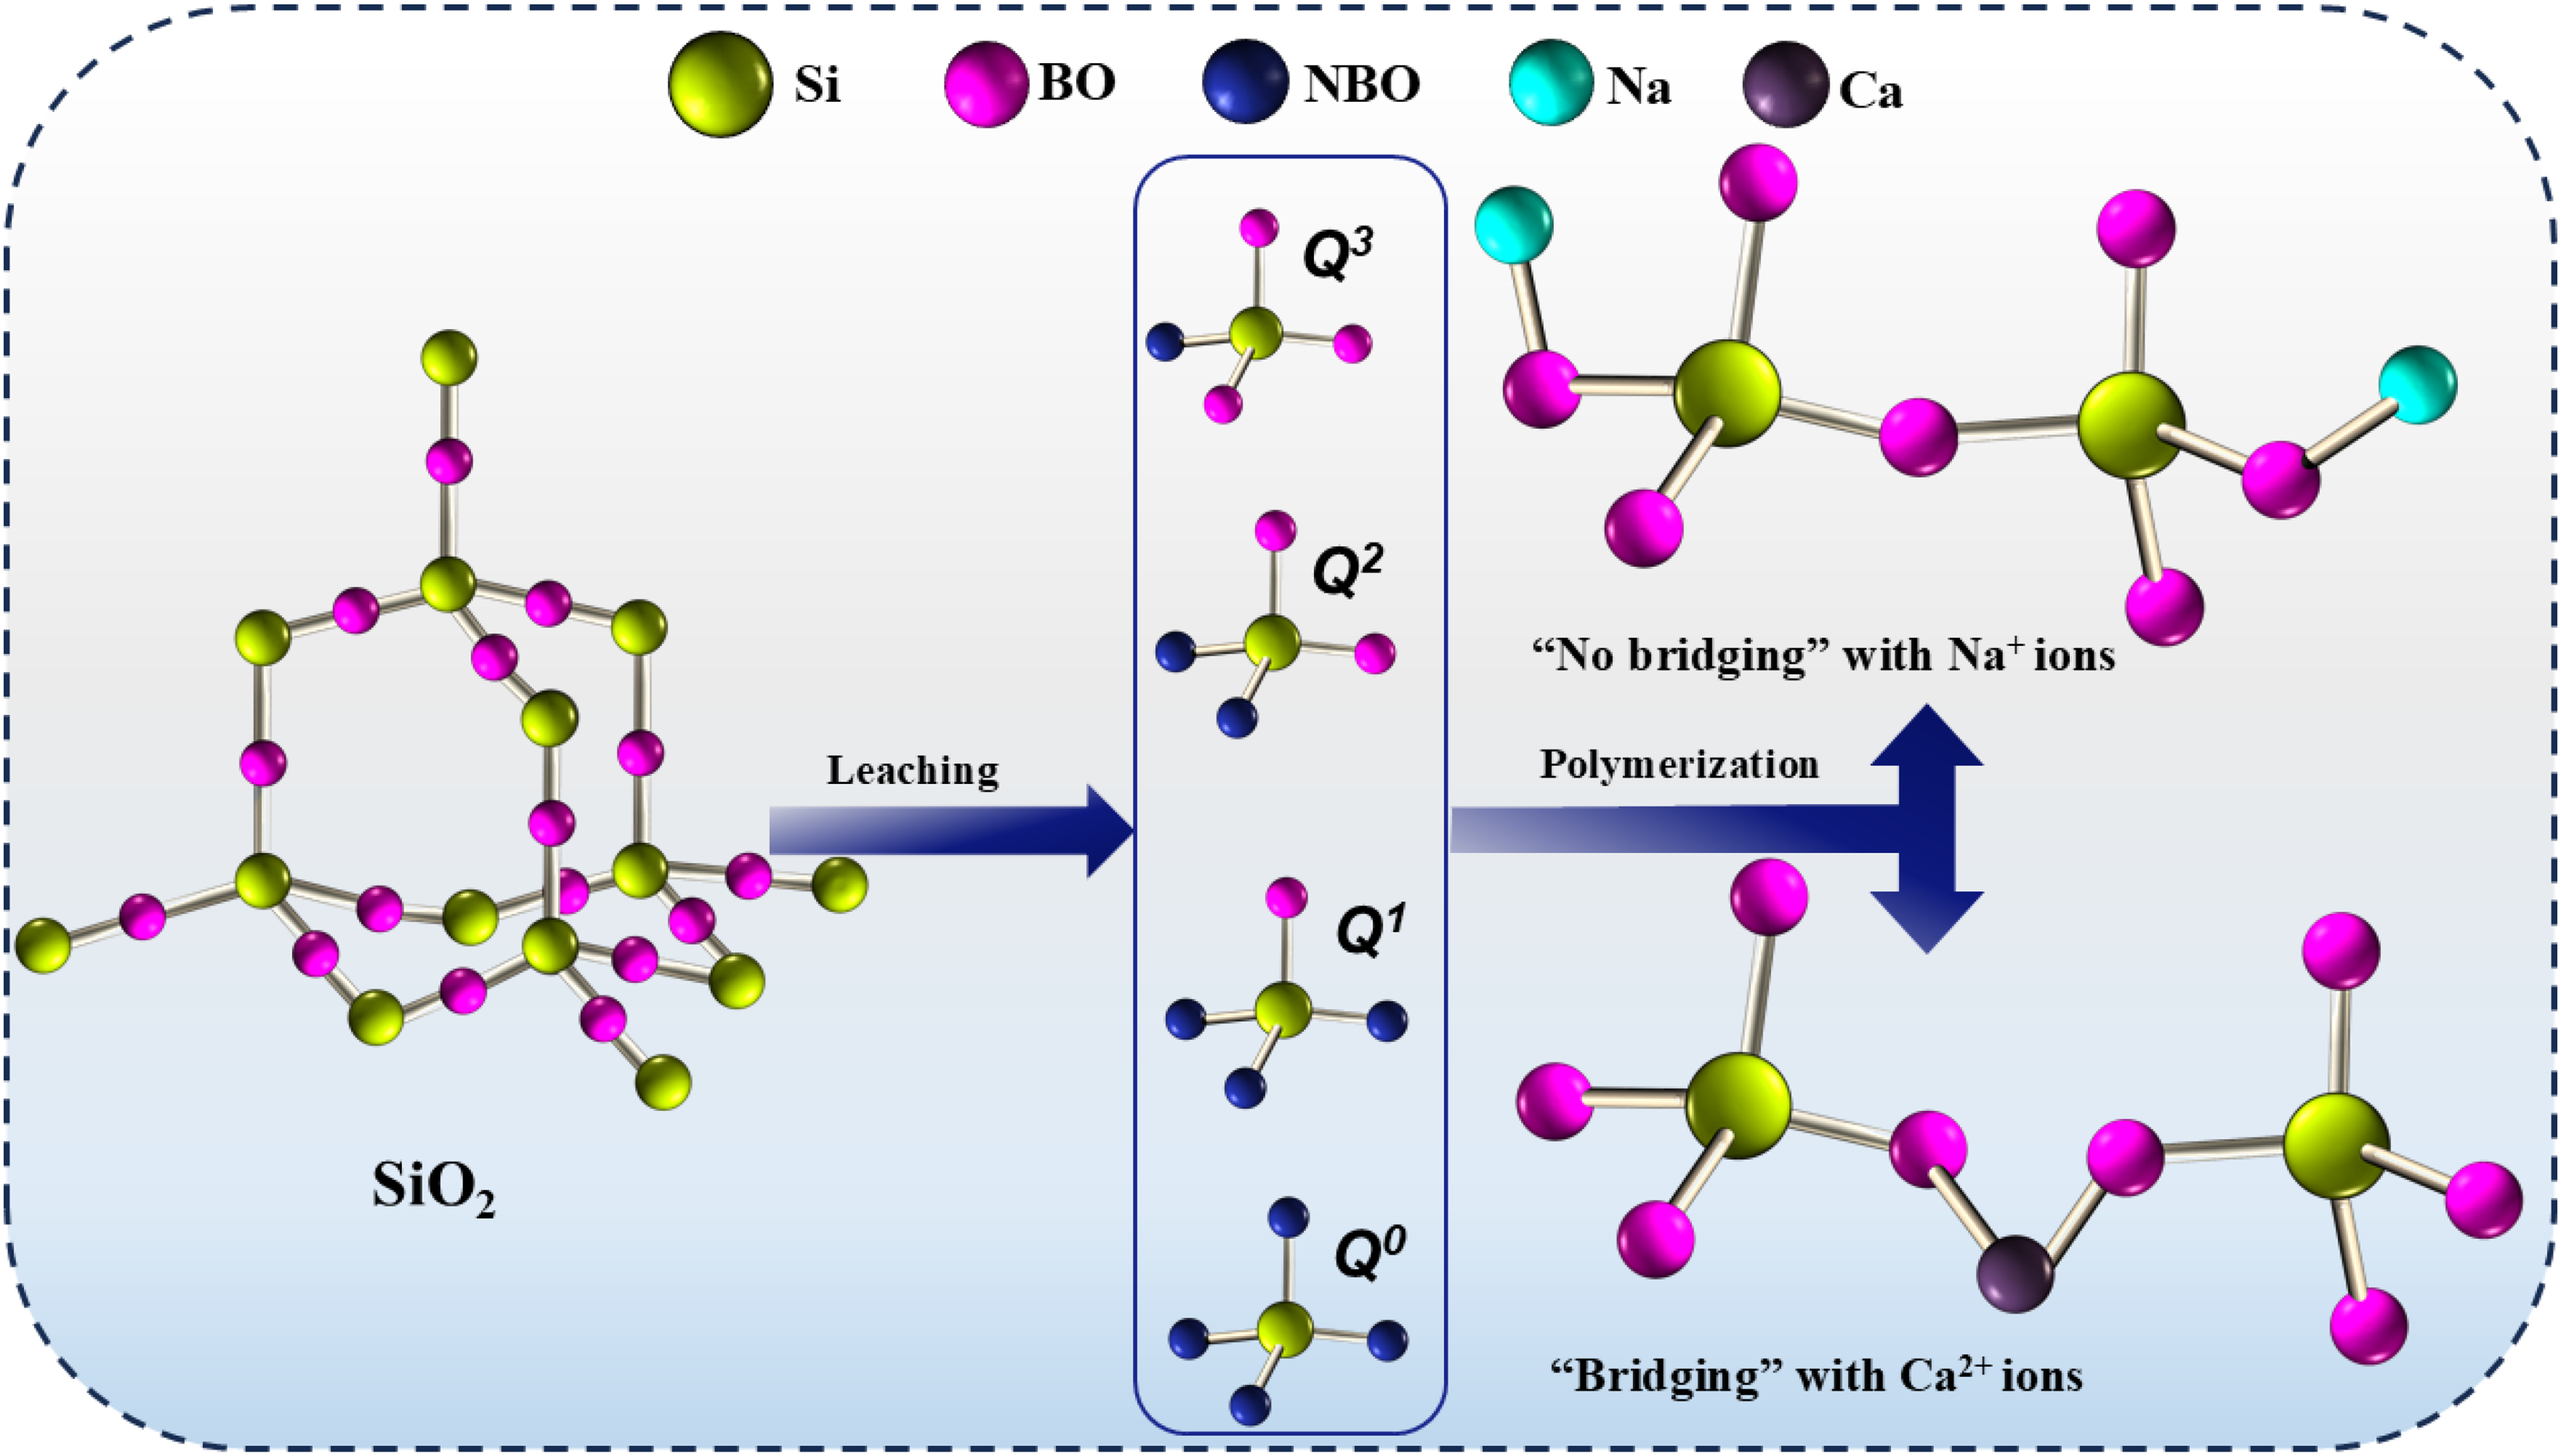
Schematic diagram of bridging with Ca2+ ions and Na+ ions.
Figure 8(c) and (d) presents the Raman spectrum and peak fitting calculation results of each residue after leaching. As the Na2O substitution in the glassy phase increased, the Raman peak near 920 cm−1 shifted further left. The silicate structure in the residues of glassy phases with 5% and 10% Na2O substitution still contained a significant proportion of
Effect of pH on dissolution behaviour of the glassy phase
To further investigate the effect of Al2O3 or Na2O modification, the dissolution behaviour of the glassy phase was examined under different pH. The C–S–F–3% Al and C–S–F–5% Na glasses were selected for the analysis. The dissolution ratios of the elements from the C–S–F–3% Al glass under different pH conditions are shown in Figure 10(a). When the pH increased to 6, the glasses were almost not dissolved, with the dissolution ratios of Ca and Si being <0.5%. The dissolution ratio of Fe was higher than that of other elements, reaching 2.96%. As the pH decreased, the H+ concentration in the solution increased, and the glass dissolved easily. The dissolution ratios of the elements reached about 30% at pH 4, among which Si has the highest dissolution ratio of 31.87%.
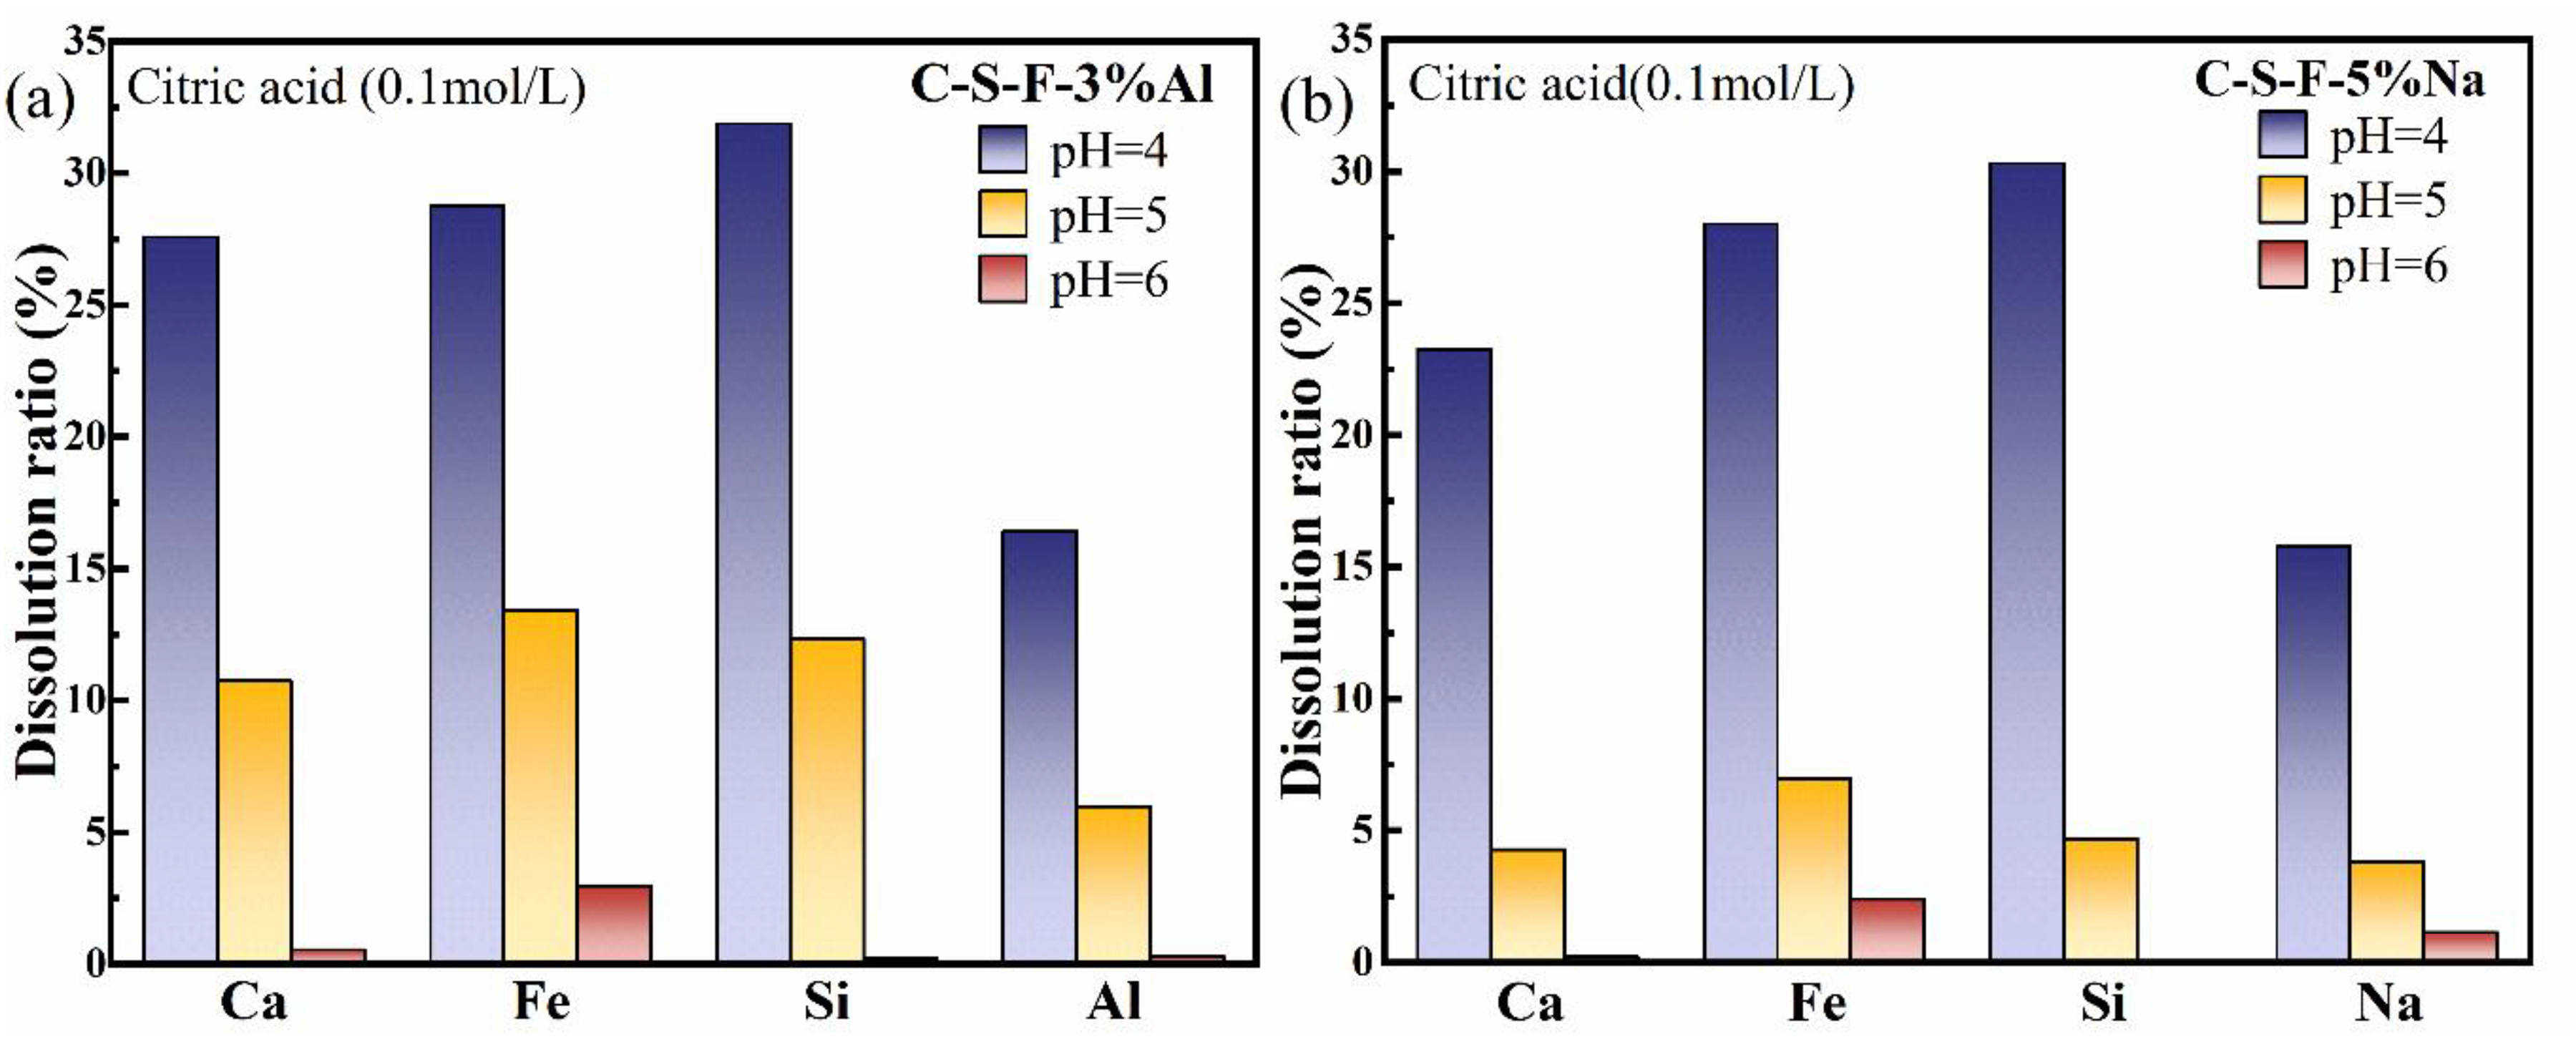
Dissolution behaviour of each element from glassy phases modified by (a) Al2O3 or (b) Na2O with different pH.
Similarly, a lower pH led to an increase in the dissolution ratio of each element in the C–S–F–5% Na glass, as shown in Figure 10(b). When the pH dropped from 5 to 4, the dissolution ratio increased by approximately 85%, slightly higher than that of the C–S–F–3% Al glass. Although the reduction in pH significantly enhanced the dissolution of glasses, the dissolution ratio of each element was still low. The incomplete dissolution of the glass was likely attributed to the polymerisation effect of Al2O3 and Na2O on the silicate structure in glass.
The Raman spectrum of the residue after leaching of the C–S–F–3% Al glass at different pH is shown in Figure 11(a). At pH 4, the spectrum of the residue was relatively smooth. Based on the structural unit ratios in Figure 11(b), the decreasing pH reduced the ratios of
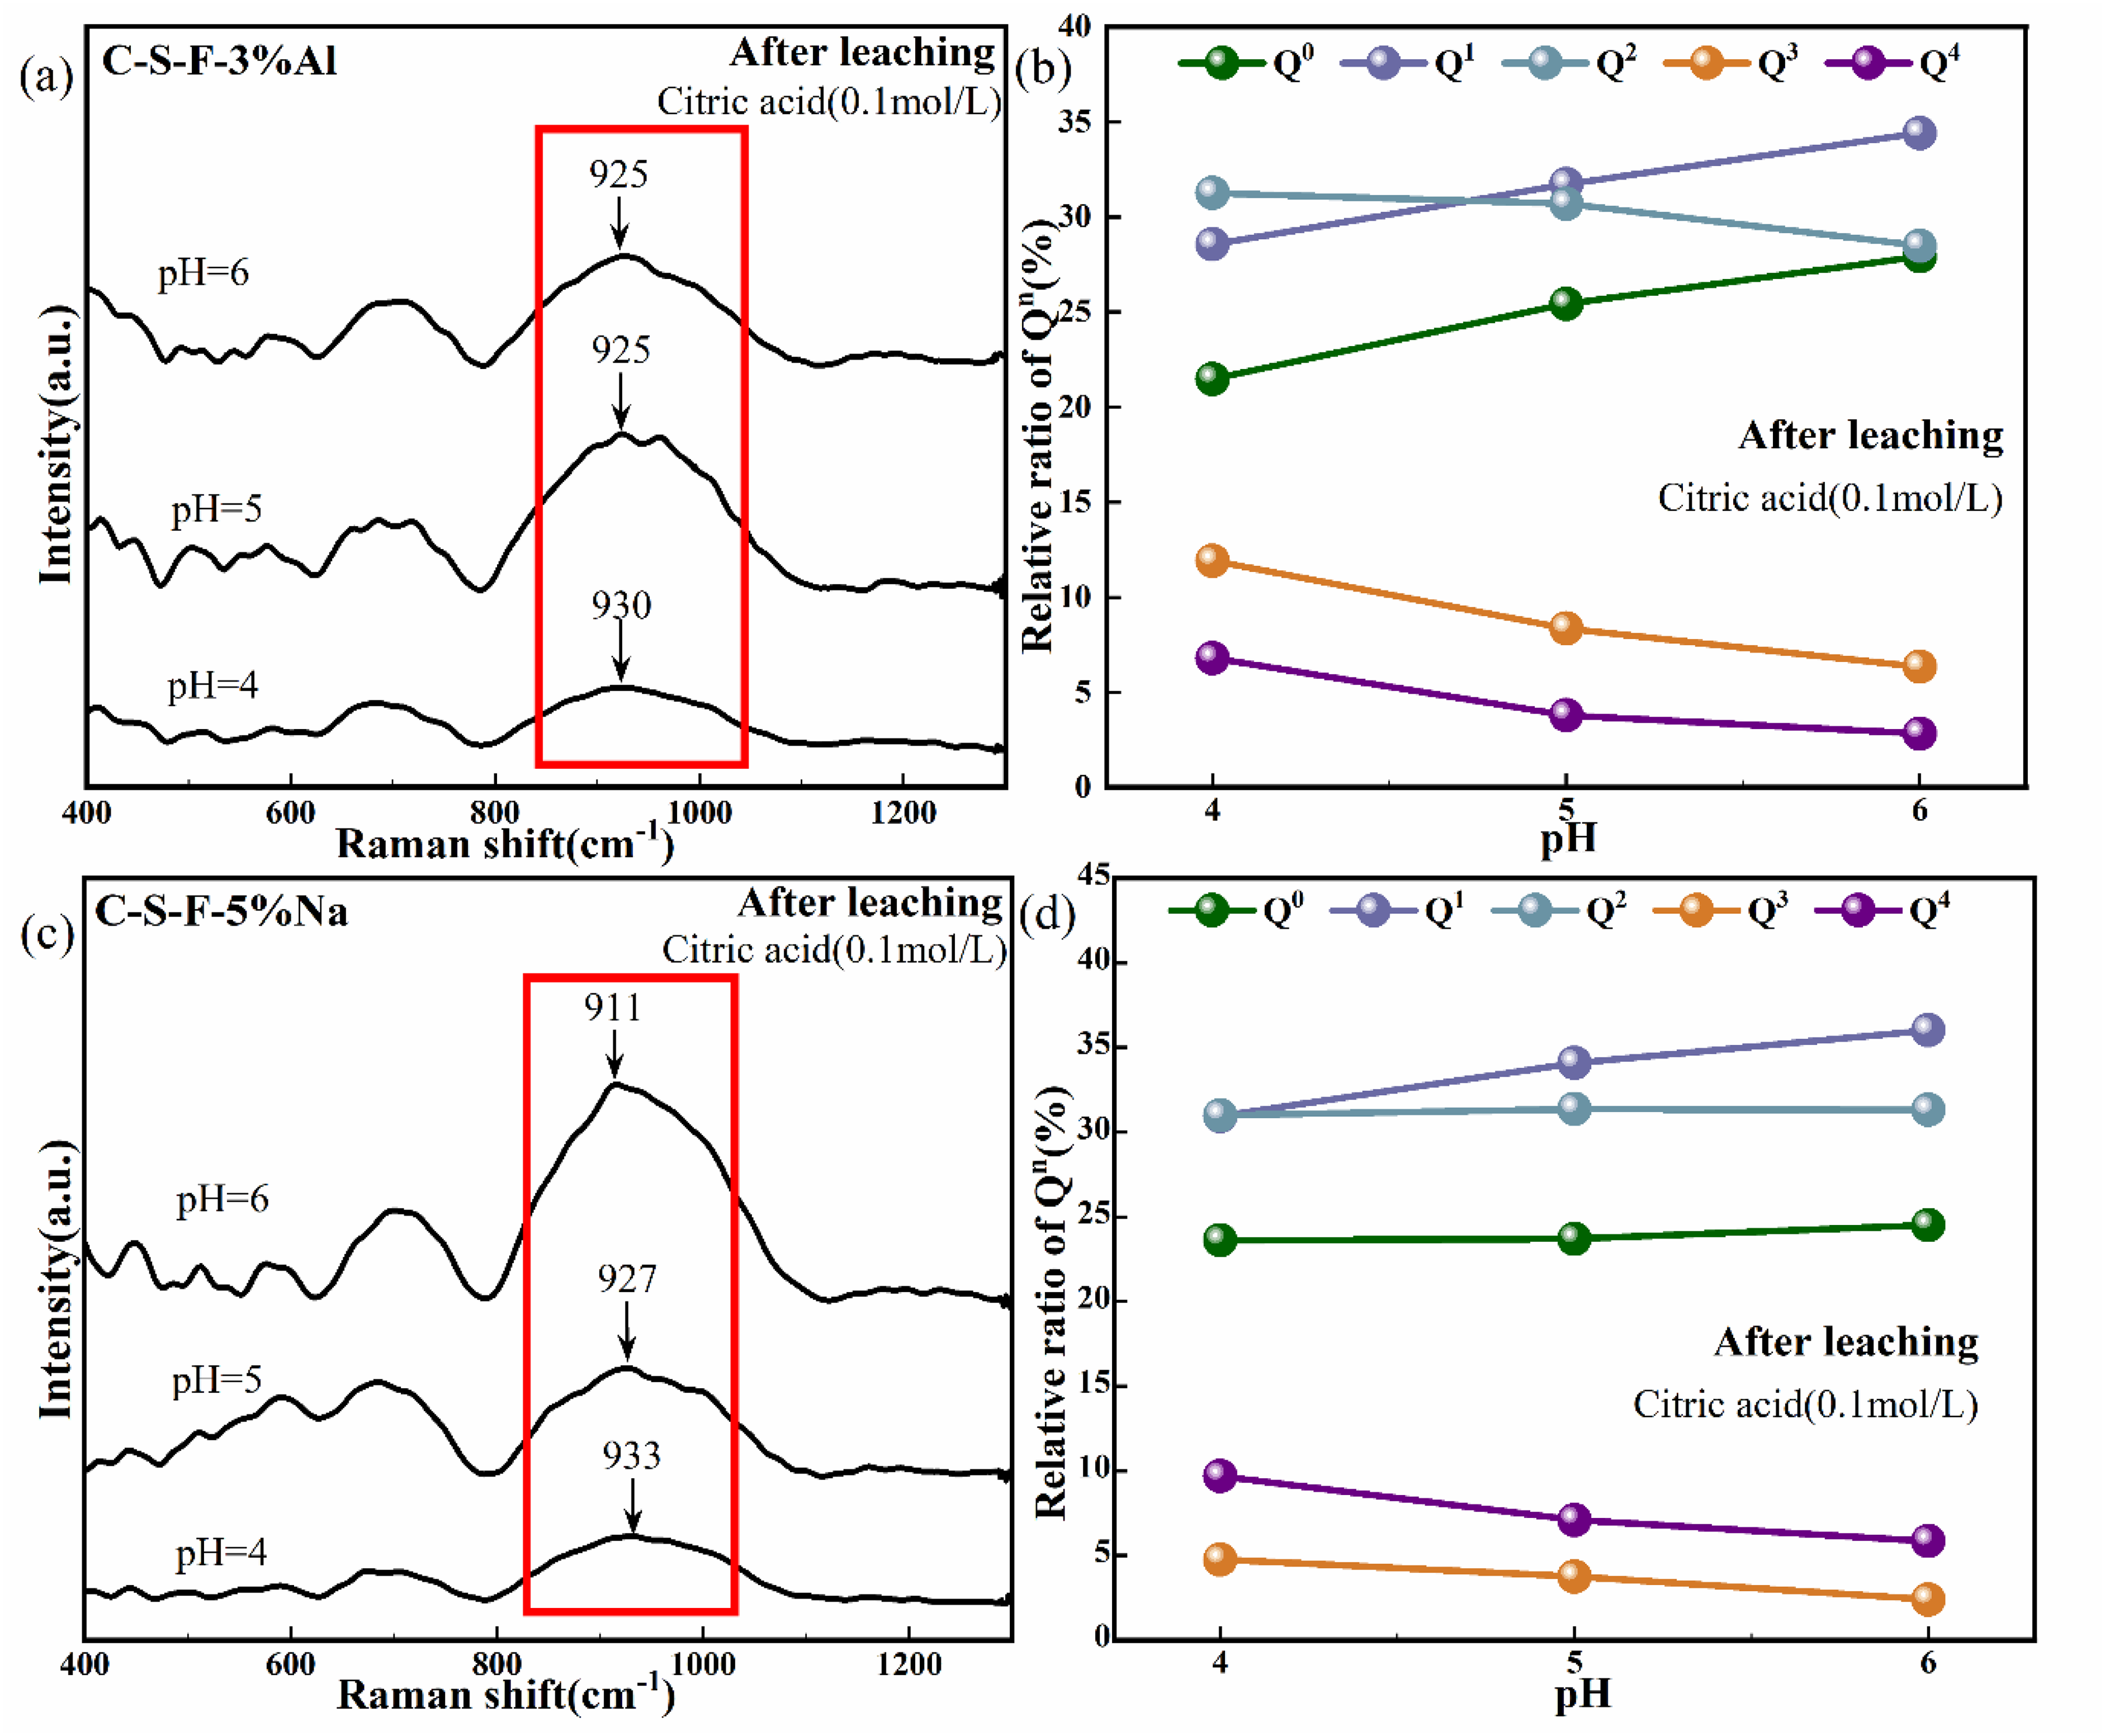
Raman spectra and unit structure ratios of SiO4 tetrahedra of residues from (a, b) C–S–F–3% Al and (c, d) C–S–F–5% Na glasses leached at different pH.
The Raman spectra of the residues obtained by dissolving the C–S–F–5% Na glass under different pH conditions are shown in Figure 11(c). Leaching at various pH values notably influences the vibrational spectra and the distribution of structural units. At pH 4, the central peak near 920 cm−1 shifted to 933 cm−1, with significantly lower intensity than other residues. The split-peak fitting results on the right side of Figure 11(d) reveal a clear decreasing trend in the ratios of
Assuming that only CaO acts as NWM in the Al2O3-modified glassy phases, while Fe2O3, SiO2, and Al2O3 all serve as NWF, the average number of bridging oxygens (BOs) was calculated based on equations (6) and (7) using the glass slag composition and Raman spectroscopy results, respectively. The calculated results are presented in Figure 12.

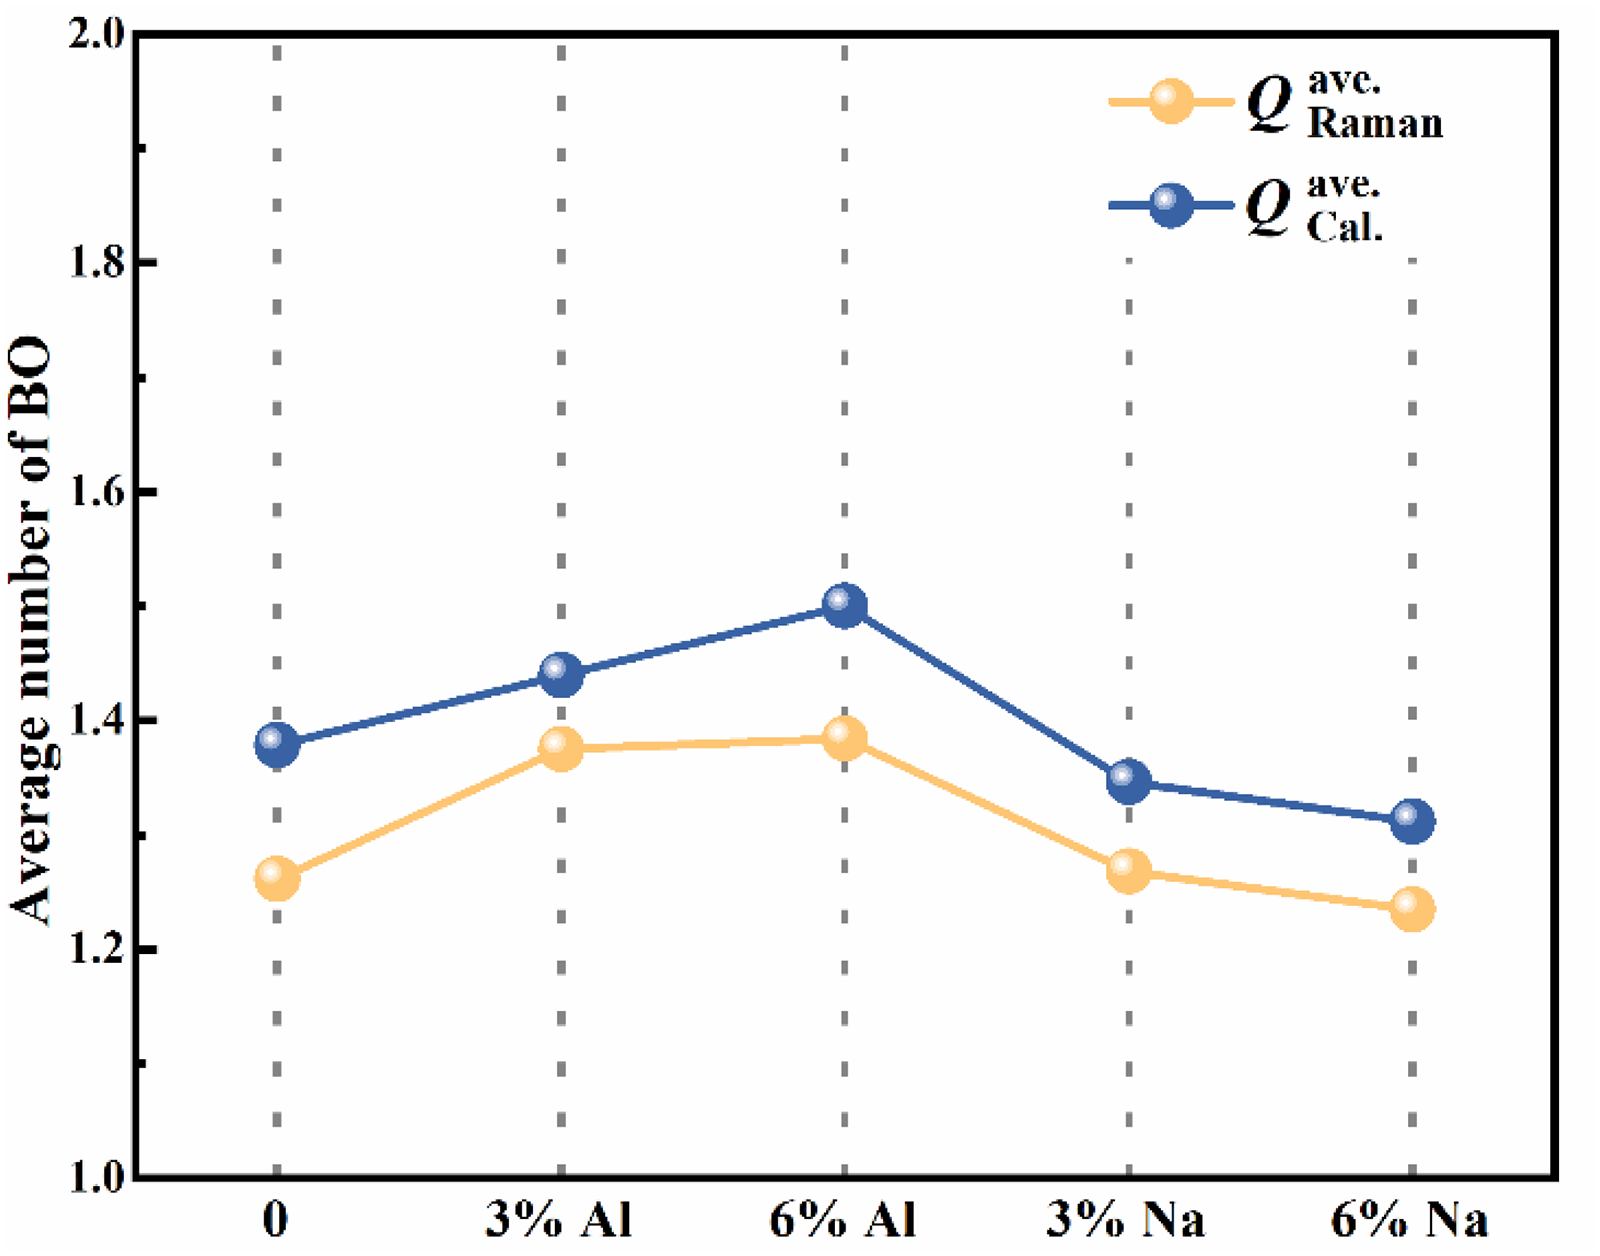
Relations between the average number of bridging oxygens in silicate tetrahedral and different Al2O3 or Na2O contents.
Although the calculated results of the two methods for BO numbers showed minor deviations, their overall trends were consistent, validating the previous hypothesis that Fe2O3 tends to act as NWF in the glassy phase structure, thereby further inhibiting dissolution behaviour. After Al2O3 modification, the number of BOs in the structure exhibited an upward trend, indicating enhanced structural stability and resulting in lower dissolution ratios, which aligns with the results in Figure 3. Additionally, the addition of Na2O did not significantly reduce the number of BOs in the structure, suggesting that Na2O modification cannot promote network depolymerisation.
Through the study of the dissolution behaviour of glassy phase samples with the addition of Na2O and Al2O3, it was found that the Al2O3 addition promoted the stability of the silicate structure in the glassy phase, thereby inhibiting its dissolution in dilute acid solutions. After adding a small amount (3%) of the Na2O content, the dissolution ratios of various elements in the glassy phase increased slightly. However, when the Na2O addition increased to 6%, the dissolution ratios decreased significantly. Whether adding Na2O while keeping the contents of other components constant or Na2O substitution for CaO would result in the formation of a more stable CaO–SiO2–Fe2O3–Na2O structure in the slag sample, which inhibited the dissolution reaction.
Conclusion
This study synthesised CaO–SiO2–Fe2O3 glassy phases with different Al2O3 and Na2O contents to explore their dissolution behaviour and structural mechanism, providing theoretical support for the high-value agricultural utilisation of dephosphorisation slag.
Al2O3 acts as an NWF in the glassy phase, which elevates the DOP of the silicate network and enhances the structural stability of the glassy phase; the dissolution ratios of Ca, Si, Fe and other elements decrease continuously with the increase of Al2O3 content. Na2O exerts a dual regulatory effect on the dissolution of the glassy phase: 3% Na2O addition moderately promotes the dissolution of each element, while further increasing Na2O content to 6% or substituting Na2O for CaO significantly inhibits dissolution. Na2O interacts with NBOs in silicate tetrahedra to form additional bonds, strengthening the glass network and reducing element leaching efficiency. Fe2O3 tends to act as an NWF in the glassy phase structure, which further inhibits the dissolution behaviour of the glassy phase; the calculation of the BO number verifies the structural stability regulation mechanism of Al2O3 and Na2O on the glassy phase. Solution pH is a key factor regulating the dissolution of modified glassy phases; the dissolution ratios of all elements increase significantly with the decrease of pH, and the dissolution is almost inhibited when pH rises to 6.
Footnotes

CRediT authorship contribution statement
Funding
The authors disclosed receipt of the following financial support for the research, authorship, and/or publication of this article: This work was supported by the National Natural Science Foundation of China (52474433) and the Liaoning Province Science and Technology Plan Joint Program (Key Research and Development Program Project) (2023JH2/101800058).
Declaration of conflicting interests
The authors declared no potential conflicts of interest with respect to the research, authorship, and/or publication of this article.
Data availability
The data that support the findings of this study are available from the corresponding author upon reasonable request.