
Abstract
Wind discomfort and the dangers that the wind may lead can be harmful in terms of comfort conditions of both indoor and outdoor environment of the building/buildings to be constructed or just completed. The extent of discomfort to pedestrian varies from inducing slightly unpleasant feeling to producing a falling down hazard. Typically, the cause of frequent occurrences of strong wind at pedestrian area is primary related to the configuration of building structures and/or topography in the vicinity of the pedestrian area. Depending on the characteristics of the wind including magnitude, uniformity, ambient temperature, and so on, the level of disturbance to users of pedestrian areas can be different. In this context, the regions where Necmettin Erbakan University temporary education buildings are located have a fairly intensive topography in terms of wind. Therefore, detailed analysis of the inside regions and the surrounding areas of education buildings in particular are performed in terms of microclimatic comfort and indoor energy recovery. Especially, the topography where university campus temporary educational buildings are located has very high wind climate conditions compared to the city of Konya climate conditions.
In this study, pedestrian-level wind conditions around N.E.U. campus buildings and in urban areas and the topography of campus settlements were analyzed through on-site measurement with Delta OHM microclimatic instruments.
The purpose of this study is to investigate the pedestrian-level comfort conditions around the project buildings suggested by concept architects together with microclimatic measurements of comfort conditions, in the light of current topographic and climatic conditions presented by the head architect. However, presentation of these topographic and microclimatic measurements around currently completed temporary classrooms of the university campus have not yet been completed. The topography of the university campus, which is at an altitude higher than that of Konya centrum, is exposed to an extremely high wind velocity. The pedestrian-level comfort conditions are measured using Delta OHM instrument. The study also aims to compare pedestrian-level comfort conditions at locations of various buildings.
In addition, outdoor comfort survey was also conducted in the campus area.
However, measurement results of the microclimatic measurement device, DeltaOHM, are evaluated in this study.
It can be observed from the results that pedestrian-level comfort of current campus settlements around the buildings reach very discomforting levels.
Since the university’s topography varies between very high and very low temperature levels and wind velocity values, climatic comfort problems are observed in the area.
Some reasons for the discomfort problems observed in current settlement are; incorrect use of climatic parameters, incorrect directions of buildings, thermal effects due incorrect selection of materials used in constructions of buildings.
In order to achieve thermal comfort, more studies are required on pedestrian-level comfort, use of passive design techniques such as correct direction of buildings and correct selection of materials utilized in the buildings based on their thermal effects.
This would help university campus buildings consume less energy and maximize people’s satisfaction.
Keywords
Introduction
In architectural practice, the subject of “Building Physics” department includes microclimate in buildings, events which affect climatic and thermal performance in outdoor environments of buildings and building envelopes.
For building physicists, outdoor environments of buildings are usually less interesting than climate events inside buildings.
Some of the fundamental purposes of building physics involve boundary conditions related to building interior climate and comfort studies, building envelope resistance and behaviour about heat and humidity. In order to obtain comfort conditions for pedestrians around the building environment, it is essential to know the exterior microclimate parameter behaviour very well and to analyze them thoroughly. Within the scope of this information, it is important to check the form of the building or buildings as well as the campus design which will be created by the building community.
Building geometry shows an intimate relationship with air temperature, and Oke (1976) states that the thermal climate at the canopy layer depends on the characteristics of the individual site and not on the temperature at boundary layer (Oke, 1976). The height-to-width (H/W) ratio and the street orientation with respect to solar radiation were found to have a great influence on the timing and magnitude of the energy regime of the individual urban surfaces (Nunez and Oke, 1977). Oke (1981) states that the rate of cooling at the street level depends on two parameters: the H/W ratio (street geometry) – the ratio of typical height of the buildings to typical width of the neighbouring streets and the sky view factor – the fraction of the sky hemisphere visible from a location at the street level in an infinitely long urban street canyon (Arnfield, 1990; Oke, 1981). Arnfield (1990) compared the effects of urban geometry and thermal properties of the construction materials and found that the canyon geometry is the predominant factor and the thermal properties of the materials enhance the differences in the cooling rates generated by different street geometries. The canyon radiative geometry contributes to a decrease in the long-wave radiation loss from within the street canyon due to the complex exchange between buildings and the screening of the skyline and decreases the effective albedo of the system, because of the multiple reflection of short-wave radiation between the canyon surfaces (Lilly Rose et al., 2014; Oke et al., 1991).
Campus physical development plan is an effective tool to shaping campuses’ life, especially among students to promote a sustainable living community. The importance of sustainable development can be observed on many campuses when many universities have established the “green campus” promoted its implementation and making sustainability a priority in the campus planning and development (Alfieri et al. 2009 and Ryan et al. 2010). This is because there are many benefits that can be achieved through the development of a sustainable campus (Arnfield, 1990) when there is a balance in the three aspects of economic, social and environment (Norton et al., 2007). However, there are still many who view sustainable development from the aspect of environmental alone (Nunez and Oke, 1977; Oke et al., 1991). From the view of physical development planning, a wide and disperse planning contrasts with the concept of sustainability since this increases distances between areas, dependency on vehicles, air pollution, creates accessibility problems, hinders infrastructure development and facility management, reduces energy efficiency, therefore resulting in poor social life, etc. (Salas-Olmedo, 2008). In terms of campus planning, Neuman (2004) stated that there are three (D’Amico and Brooks, 1968) aspects that should be emphasized: accessibility, safety and social engagement. Research on compact planning practices found that the approach providing a suitable environment to support all the three aspects. In addition, these planning approaches also provide various advantages in other aspect such as circulation, transportation, provision of facilities and other related aspects (Omidreza et al., 2013).
Building outdoor microclimate condition
The microclimatic parameters which create the comfort conditions at pedestrian level outside of the building can be thought as the environmental physical parameters which affect the climate comfort and the process of energy savings. These are solar radiation, ambient air temperature, ambient humidity and wind. Some precautions need to be taken related to design parameters in order to obtain interior climate comfort conditions.
For these precautions to be taken, it is essential that exterior environmental values be obtained and the data be compiled.
As a result, real values for exterior environment parameters such as solar radiation, ambient temperature, ambient humidity and wind, must be obtained for definition of characteristics of days and other time periods.
For any interior region which is surrounded by walls, in order to achieve climate comfort with minimum amount of additional energy systems, it is essential for the design parameters to have suitable values. In the building design for achieving good internal comfort conditions in the building, it is essential to not just focus on topics related to building envelope, but it is also essential to analyze conditions related to human comfort at the pedestrian level outside of the building and it is essential to incorporate all the microclimatic parameters as well during the design process.
The topographic properties which would be applied to the building which is being designed would definitely change the topographical content and the environment along with the comfort conditions at the interior level and at the pedestrian level. Especially if wind characteristics (which is among physical climate parameters) are not well known and taken into consideration during design; they can result in very dangerous environments and regions. Pollution caused by the miscalculation of wind speed and direction can result in very dangerous regions.
Proper settlement to the topography where the buildings are located depends on the variation of the other parameters like building’s form, openings on the size and the adaptation to the environment and also the relationship with the surrounding buildings and the right usage of the landscape elements.
If these parameters are evaluated and applied correctly, suitable comfortable conditions may be created. If these parameters are not evaluated correctly during design and application, this can result in unsuitable and uncomfortable environments.
Uncomfortable, inconvenient environment can appear as follows:
For the buildings:
High wind speeds that can reach uncomfortable or even dangerous cases for pedestrians around the buildings;
Low wind speeds that may cause unnecessary transport and the collection of traffic and industrial gases;
Uncontrolled reflection of sun beams or shading in front of the building;
View with varying visual pollution or blocked view;
Variables that may create acoustic problems versus high wind speed on the pedestrian level.
The number of studies carried out on the pedestrian comfort level around the buildings has been increasing in recent years. The buildings surrounding areas have been questioned due to the adverse comfort and safety conditions that can occur at pedestrian level (Wu, 1994). The wind action manifests itself at the pedestrian level basically in two ways: either it can be felt as a wind speed which affects the rate of heat exchange between people and the environment or as a force that comes from the sum of pressure field incident on human body (Bênia and Dolz, 2010). The wind flow has multiple effects, including heat transfer by convection, penetration of rain, the dilution of the pollutants, noise or dust removal. The most significant effects on pedestrian are the mechanical and thermodynamic effects. This article only addresses the mechanical effects; noting that according to Lopes et al. (2008), the threshold of thermal comfort corresponds to wind speeds of around 4.50 m/s.
The pedestrian comfort depends on several parameters. Standing out among these parameters are wind speed (and critical burst speed), local climate and the season, environmental temperature, rainfall, humidity, activity level on public areas, clothing and biological factors such as ages and psychological states of people. A preliminary evaluation of the wind behaviour at the ground level and around buildings can avoid the appearance of excessive wind-speeds. In this context, both buildings demolition and construction may change the optimum conditions of the wind flow. When evaluating the discomfort associated with pedestrian-level wind, it is necessary to study the phenomena occurring at heights below 2 m and the speed average obtained in the period between 10 min and 1 h. In fact, according to Bottema, pedestrian discomfort happens whenever the wind effects become so strong and frequent (periods less than 1 h) that people who are feeling these effects act to avoid them (Bottema, 2000).
Literature review
Microclimatic comfort conditions around buildings
The early comfort assessment methods applied outdoors have generally been adjusted from those originally conceived for indoors and are based on the assumption that the conventional theory of thermal comfort developed for indoor applications can be generalized to outdoor settings without modification. However, this approach has been proved inappropriate (Givoni et al., 2003; Nikolopoulou and Steemers, 2003; Spagnolo and De Dear, 2003). When outdoors, people expect different climatic conditions and usually dress differently, according to the prevailing weather conditions. In addition, people outdoors may be exposed to intense solar radiation and winds, which will modify greatly their response towards the environment (Stathopoulos, 2006; Stathopoulos and Baskaran, 1996; Wu and Kriksic, 2012). Due to the range of experiences and expectations of people outdoors, it is hypothesized that the acceptable comfort range of outdoor spaces should be wider than that of the indoor context (Paterson and Apelt, 1986; Shane, 2011; Stathopoulos et al., 2004). Outdoor thermal comfort has been receiving increasing attention and a diversity of studies including field surveys, wind tunnel experiments and computer simulations has been conducted in the past couple of decades (Arens and Bosselmann, 1989; Givoni et al., 2003; Jitkhajornwanich and Pitts, 2002).
Thermal comfort of a person is defined by three parameters:
(a) The body is in heat balance; (b) perspiration rate is within comfort limits; (c) mean skin temperature is within comfort limits. These three conditions cannot be met only by keeping the ambient air temperature within a certain range. In fact, according to Fanger (1970), the interaction of six fundamental factors defines the human thermal environment and its sensation of comfort (Fanger, 1970).
(a) Ambient air temperature (Ta); (b) radiant temperature (Tmrt ): in which a change of 1°C can be offset by a 1°C change in Ta; (c) wind speed: with a change rate of 0.1 m/s for each 0.5 °C change in Ta (up to 1.5 °C); (d) humidity: a 10% change in relative humidity (RH) can be offset by a 0.3°C change in Ta; (e) metabolic rate: in which an increase of 17.5 W (above resting level) is equivalent to a 1°C increase in Ta; (f) clothing insulation (clo): a change of 1 clo is equivalent to a Ta change of 5°C at rest and 10°C while exercising (Shapiro and Epstein, 1984).
Thermal comfort models can produce repeatable predictions on the level of thermal comfort under standard and constant conditions in climate chambers, but in dealing with the constantly changing conditions of real living and working spaces they show serious restrictions. De Dear et al. (1997) demonstrated that in their field surveys, the level of dissatisfaction expressed by users was lower than that predicted by the Predicted Percentage Dissatisfied (PPD) model (Givoni, 1976).
Theoretically, Tmrt applicable outdoors is given by the following formula (Fanger, 1970)
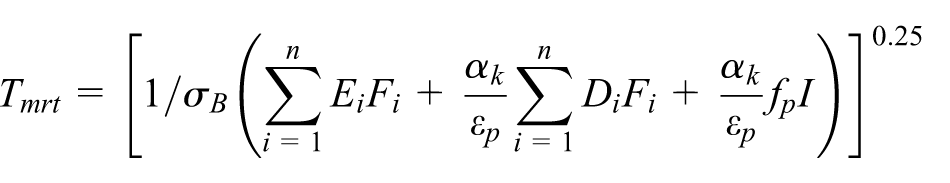
where the surroundings are divided into n isothermal surfaces, for each one E 1; W m2) is the long-wave radiation component
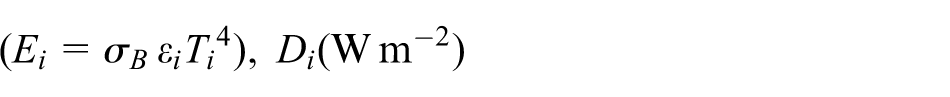
Is the diffuse and diffusely reflected short-wave radiation component F; is the angle weighting factor, I (W m2) is the direct solar radiation impinging normal to the surface, fp is the surface projection factor which is a function of the sun height and the body posture, ak is the absorption coefficient of the irradiated body surface for short-wave radiation (=0.7). εp is the emissivity of the human body (=0.97), and σβ is the Stefan–Boltzmann
The calculation of the angle factor Fi is the most problematic aspect when dividing the environment into several surfaces. A procedure for calculating the angle factors is given by Fanger (1970) for simple shapes, but the task becomes much more complicated for complex urban forms and simplifications are thus necessary. Several calculation procedures for Tmrt do exist, depending on whether it is modelled or measured. To avoid such difficulties, the most suitable method would be to use an integral radiation instrument. Such an instrument exists for indoor purposes, that is, a globe thermometer (e.g. ISO 7933:1989, 1989).The globe thermometer consists of a hollow sphere (usually 15 cm in diameter), with a flat black paint coating and a thermometer bulb at its centre. The temperature assumed by the globe at equilibrium results from a balance between the heat gained or lost by radiation and convection. Empirical formulas derive Tmrt from the globe temperature Tg, together with Ta and v (American Society of Heating, Refrigerating and Air-Conditioning Engineers (ASHRAE), 2001b; Givoni, 1976). Alternatively, a comfort index can be directly calculated, namely the wet bulb globe temperature (WBGT), usually used for assessing comfort in working spaces (ASHRAE, 2001a, 2001b). The globe thermometer gives a good approximation of Tmrt indoors, where the heat irradiated from the surroundings is rather uniform.
However, the globe thermometer is less suitable outdoors for several reasons, including the non-homogeneity of the radiant environment induced by the additional solar beam radiation. Moreover, because of its spherical shape, the globe thermometer may be well approximated for a seated person, as it averages the absorbed radiation equally from all directions, but not for a standing person for which the lateral fluxes are prevailing Tmrt , integrally obtained, assumes equal energy absorption from a human body in both long-wave and short-wave ranges, and the black colour overestimates the absorption of short-wave radiation, unless it is replaced by a grey globe more suitable to describe normal clothing (Nikolopoulou et al., 2001). Finally, the globe thermometer is not convenient because it needs a relatively long time to reach equilibrium (15–20 min). Alternatively, one can use a smaller and light-coloured sphere for faster response of the instrument (Brown and Gillespie, 1986). Despite these disadvantages, it has been implemented for outdoor issues, for example, for workspace outdoors (wet globe bulb temperature, WGBT) or even in social surveys (Nikolopoulou and Steemers, 2003; Rediscovering the Urban Realm and Open Spaces (RUROS), 2004). To date, there is no reliable instrument for integral measurement of Tmrt outdoors, even though some attempts have been made (Blocken and Carmeliet, 2004; Krys and Brown, 1990).
Wind effects around buildings and the wind environment
The approaching wind is partly directed over the building, partly around the vertical edges, but the largest part is deviated to the ground level, where a standing vortex develops that subsequently wraps around the corners and joins the overall flow around the building at ground level. The typical problem areas where high wind speed occurs are the standing vortex and the corner streams. Further upstream, a stagnation region with low wind speed is present. Downstream of the building facade, complex and strongly transient wind-velocity patterns develop, but these are generally associated with lower wind speed values and are of less concern (Gomes, 2003).
The wind action of immersed obstacles in the atmospheric boundary layer is also a function of the characteristics of the obstacle: geometry, sharp edges, its size relative to other obstacles or the spacing between them (Simiu and Scanlan, 1996). An important parameter to flow characterization is the Reynolds number (Re) that represents the ratio of the inertial forces to the viscous forces, defined as
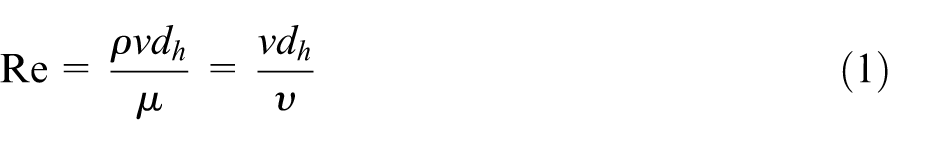
where v is the flow velocity, µ is the dynamic viscosity and ν is the kinematic viscosity
Figure 1 represents the flow streamlines around a plate edges. For Re ≈ 0.3 the viscous forces overcome the flow inertia forces, remaining adherent to the surface circumventing the windward and leeward faces. The flow separation (when the flow lines loose contact with the obstacle) starts with increasing speed, Re ≈ 10, when symmetrical vortices start in plate leeside. For Re > 100, the inertial forces prevail over the viscosity, thus causing, in the plate leeside a region with fully separated turbulent flow and well-defined vortices. Separation points are dependent on the geometry of the body, being very marked in the presence of surface discontinuities as in the case of edges. In general, it can be concluded that whenever a deceleration of the flow, caused by a positive pressure gradient (dp/dx > 0) and this is considerable for reversing the flow direction along the body walls (layer limit), separation occurs. The positive pressure gradient (adverse) may be observed in various situations by changing the direction of current lines (progressive – curved surfaces, or sudden – in sharp edges) or by the effect of the body viscosity causing a decrease in flow velocity close to the surface. This behaviour turns the flow independent of Re, making tests easier to keep similarity conditions. Figure 2 shows, for a relatively simple case, the flow around an isolated building a boundary layer flow, normal to one facade. Positive pressures are shown in the building front facade, while suctions, that is, negative pressures, are observed in lateral, rear and top regions, as a result of the phenomenon of flow separation on the edges. The vortexes at the bottom of the building facade are conveyed with high speed in the direction of the vertical edges of the building, bypassing them. At pedestrian level, these areas are often uncomfortable (ASHRAE, 1993).
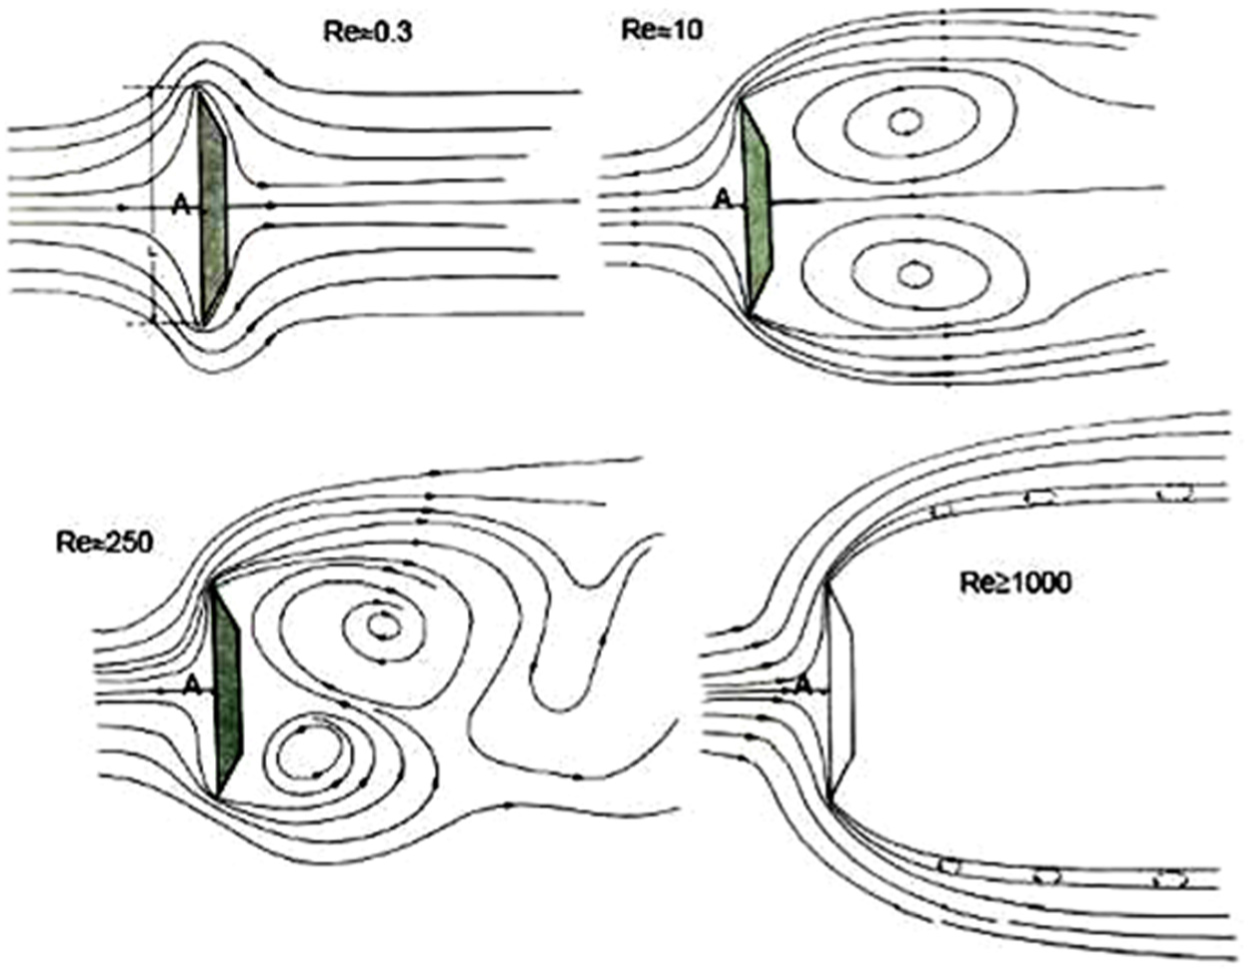
Streamlines with different Reynolds number (Silveira, 2012).
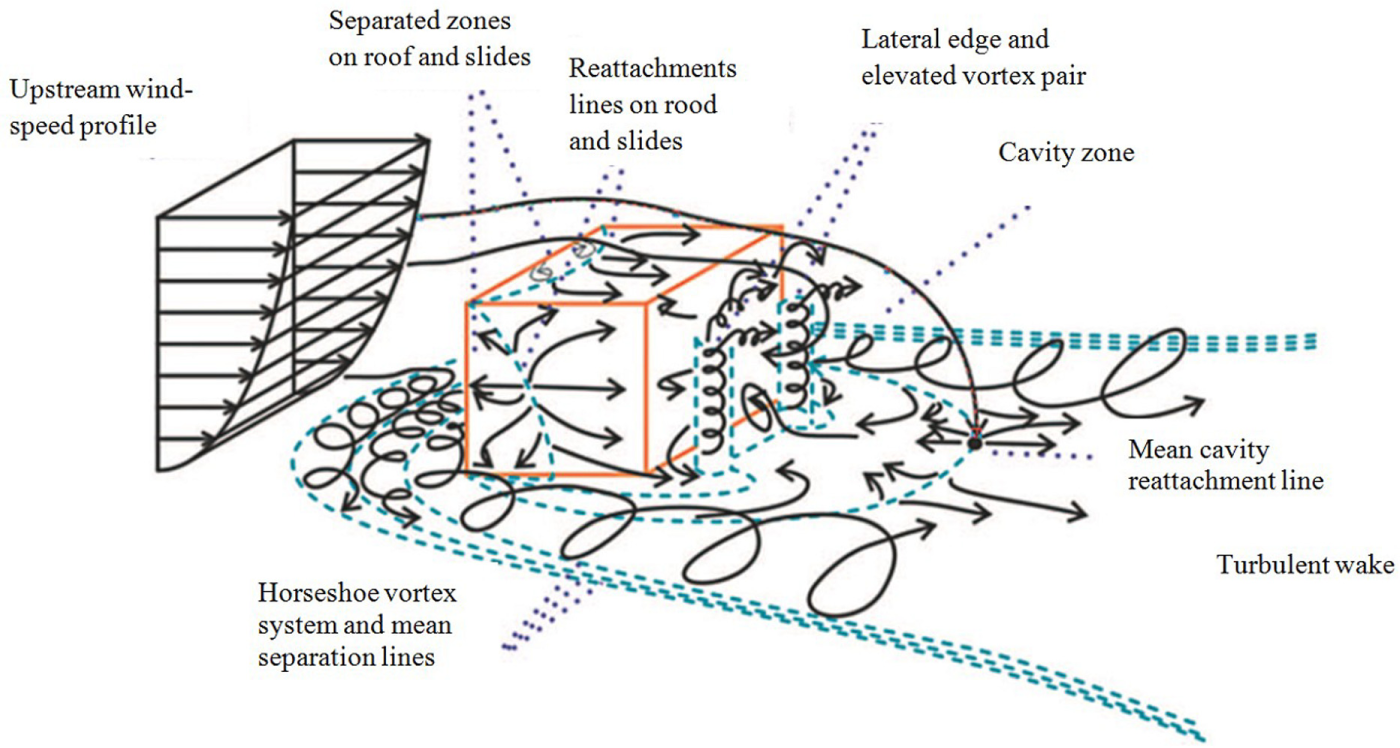
Regions of high surface wind flow characteristics around buildings (Fadl and Karadelis, 2013)
Pedestrian level comfort around buildings
The effect of wind around buildings depends not only on topography and roughness of the surface, but also on the building’s geometry, the layout of surrounding buildings and the wind direction. Consequently, there are some turbulence zones, sharp flow deflections on geometry changes (such as corners, edges, protrusions and recesses) and strong accelerations due to the flow confinement, whose effects are locally bounded and difficult to account for. Special attention should be given to these localized effects, especially when dealing with areas where comfort, that may reach pedestrian safety, may be compromised. These situations of potential pedestrian discomfort should be identified and corrected in the design phase. Pedestrian-level wind (micro)-conditions is one of the first microclimatic issues to be considered in modern city planning and building design (Stathopoulos, 2006). The construction of a new building alters the microclimate in its vicinity; hence, wind comfort and safety for pedestrians become important requirements in urban planning and design. Today, some city authorities request studies of pedestrian wind comfort and safety for new buildings and new urban developments.
In particular, near and around high-rise buildings, high wind velocities are often introduced at pedestrian level that can be experienced as uncomfortable, or sometimes even dangerous. Traditionally, wind flow at pedestrian level can be simulated in boundary-layer wind tunnels.
Pedestrian-level winds can be described quite adequately in terms of mean velocities in the presence and absence of a new building within a specific urban environment. Although it can be argued that pedestrians are mostly affected by gust effects and mean wind speeds may not be sufficient to cause results for concern, the fact remains that several major cities planners require only the fulfilment of certain mean (sustainable) speeds with a specified probability of exceedance (Stathopoulos and Baskaran, 1996). The process of comparison between computational and experimental results has already been challenged and appears problematic on its own. Computational fluid dynamics (CFD) modelling has been used by enviro-metrics to assess comfort levels with respect to wind climate, based on evaluating the wind flow fields around buildings, as well as the associated outdoor thermal comfort, air ventilation, snow accumulation, rain infiltration and other microclimatic conditions (Paterson and Apelt, 1986). Over the last two decades, along with the perfection of the CFD method, many researchers have concentrated on the numerical simulations of air flow past a single building. Their studies revealed some complicated flow phenomena, such as separation, vortex shedding, recirculation and reattachment and predicted some accurate numerical results (Bosch and Rodi, 1998; Lawson, 1990; Murakami, 1998).
Assessment of wind comfort and wind danger involves a more extensive methodology in which statistical meteorological data are combined with aerodynamic information and with a comfort criterion. The aerodynamic information is needed to transform the statistical meteorological data from the weather station to the location of interest at the building site, after which it is combined with a comfort criterion to evaluate local wind comfort. The aerodynamic information usually consists of two parts: the terrain- related contribution and the design-related contribution. The terrain-related contribution represents the change in wind statistics from the meteorological site to a reference location near the building site (Lawson, 1990).
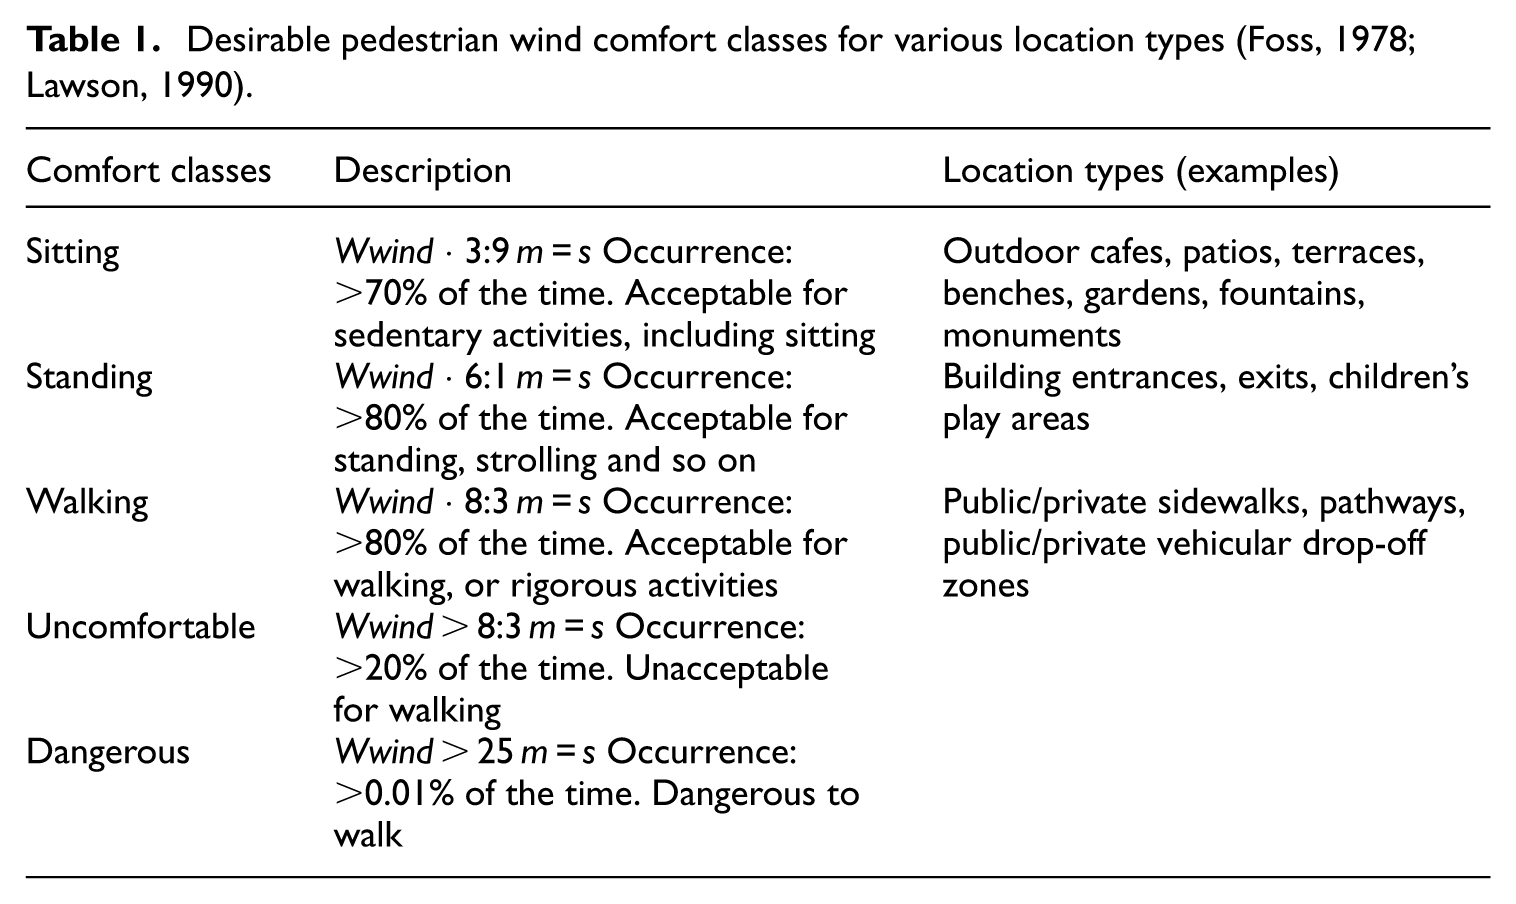
Pedestrian comfort criteria are based on mechanical wind effects without consideration of other meteorological conditions (temperature, RH). These criteria provide an assessment of comfort, assuming that pedestrians are appropriately dressed for a specified outdoor activity during any given season. Five pedestrian comfort classes and their corresponding gust wind and speed ranges are used to assess pedestrian comfort. More specifically, the comfort classes, associated wind speed ranges and limiting criteria, are summarized in Table 1 based on information from Lawson (1990) and Foss (1978).
Desirable pedestrian wind comfort classes for various location types (Foss, 1978; Lawson, 1990).
Lawson’s pedestrian comfort criteria
The acceptability of the wind conditions in an urban environment will always be, to some extent, subjective. The following methodology was developed by Lawson (1990). It has been widely accepted and adopted for the investigations of the wind environment associated with buildings in the UK. It has been widely accepted and adopted for the investigations of the wind environment associated with buildings in the United Kingdom. It compares well with international guidance. Locations in the areas of concern associated with the buildings must be assessed for both, comfort and safety. The first relates to the activity of the individual and the second to the level of distress experienced, based on information from Lawson (1990); the wind comfort criteria are summarized in Table 2 (Foss, 1978; Lawson, 1990).
Lawson pedestrian comfort criteria (Foss, 1978; Lawson, 1990).

Limitations and assumptions and boundary conditions
This article aims at investigating the influence of the built geometry, campus building form and its morphology on the outdoor thermal environment in an institutional campus building. Using the Computational Fluid Dynamics (CFD) analysis method included in the FloEFD software, annual averages from the 3rd climate region (according to TS 825) and regional heating and cooling degrees/days for Turkey are compared. In the light of real meteorological data on temporary education buildings of the university campus, following remarks can be made in relation to Konya climate region (which has mild and cool climate and where heating needs are higher than cooling needs); in the light of the real meteorological data of the temporary education buildings of the university campus, the following concepts are analyzed: pedestrian level comfort conditions indoor and around the building/buildings, comfort condition between the building layout plan suggested by the author (however unimplemented by the authorities) and the current finished design plans are analyzed. In the design of the suggested (but unimplemented) education buildings; the changes by the suggested wall structure by adding external flow into the buildings; and also how it affects the comfort conditions in an amphi determined indoor are considered. With this study, not only the external flow conditions of full wall, wall with apertures and without a wall are discussed, but also the indoor conditions are analyzed depending on the comfort angle in the indoor regions.
External flow analysis on temporary education buildings of the N.E.U campus includes below studies:
Examinations of existing building settlements designed by TOKI (The Housing Development Administration of Turkey) which includes sub-projects such as architectural application projects and mechanical-installation projects and a static project by university administration.
Building settlement plan with close wall model which was previously proposed by the project author,
Building settlement plan with open wall model which was previously proposed by the project author,
Site plan model, which is also the settlement plan proposed by the project author, but currently applied in different settlement options.
Pedestrian level comfort conditions analysis around the building/buildings were conducted during the heating period in January 21 and for the cooling period in July 21 between 13.00--16.00--19.00 hours; air flow analysis were also conducted at pedestrian level heights for the same days during 07.00--14.00--21.00 hours.
With the information obtained from the 2D architectural project and layout plans of the buildings, the solid model of the three buildings has been created. The 1.00 km × 1.00 km topography where the buildings are situated has been obtained from the Google Earth software (Figure 3)
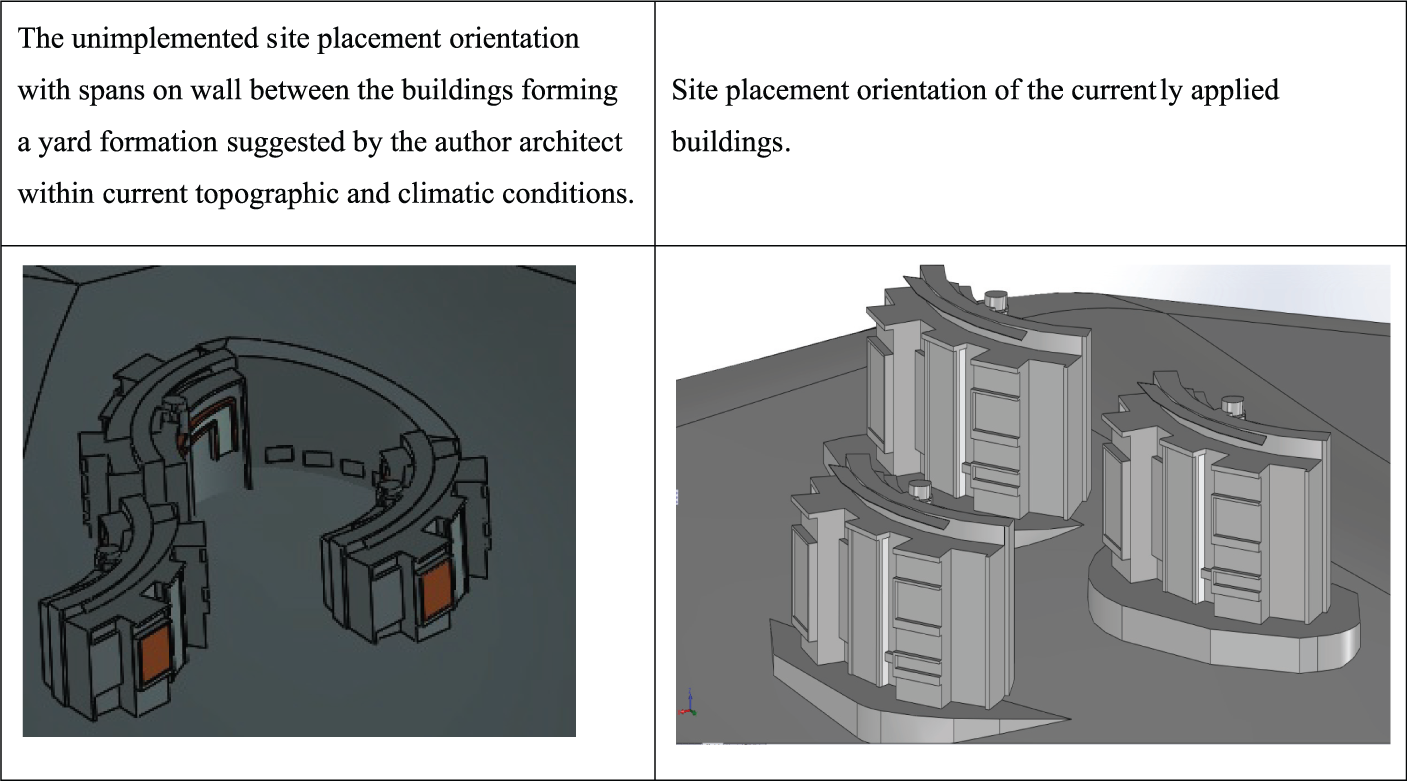
Site placement orientation suggested but not applied within the light of current climatic and topographic conditions by the author and the current applied building placement.
In the numerical analysis conducted, the finite element method has been used in the campus building models for the solution. The conservation equations for energy, mass and momentum (Favre-averaged Navier–Stokes/FloEFD Computational Fluid Dynamics Software) have been solved.
The quality of the grid has an effect on the precision when the results are compared with the experimental values. Due to this reason, in order for the atmospheric boundary layer to form correctly, a denser grid has been used in the regions where there are rapid changes in the geometry, as well as in the regions which are closer to the surface. In the other regions, a coarser grid has been used compared to other regions described above.
Grid tuning, which is one of the features of the software, has been used twice during the analysis. This way, the grid has become denser in the required locations, causing the flow solution to converge in the continuous flow regime. It has been automatically applied at every 300 iterations as depending on the average pressure changes at the predetermined surfaces on the buildings.
The design of buildings must account for wind loads, and these are affected by wind gradient. The respective gradient levels, usually assumed in the Building Codes, are 500 m for cities, 400 m for suburbs, and 300 m for flat open terrain (Foss, 1978).
One of the most important criteria in the external aerodynamics analysis around the building is the correct modelling of the atmospheric boundary layer. Using the Hellman approach for the wind profile, the wind boundary layer at open area regions has been defined with the following equations

To calculate α, profile uses the inverted equation as

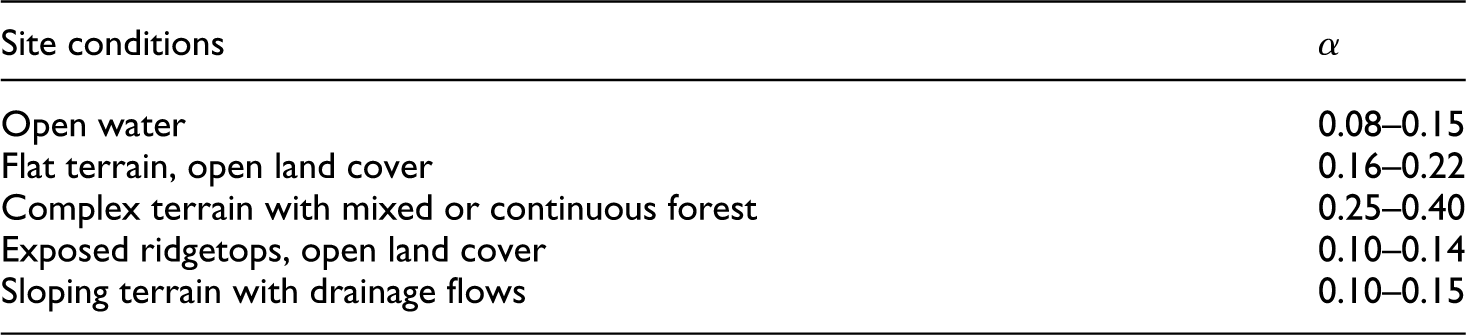
If the wind speed is only known for one height, α must be estimated alpha depends on various issues, including roughness and terrain of the site. Some empirical values for temperate climates are:
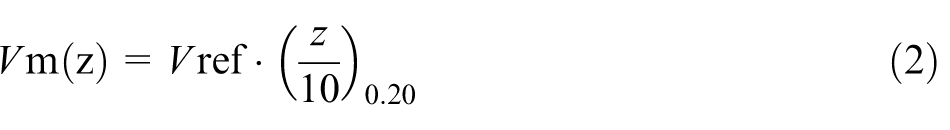
where z is the height where the wind velocity is calculated, Vz is the maximum velocity obtained, Vref is the station measurement height (10 m), α = 0.2 open field surface; Hellman coefficient.
While the reference height is taken as 10 m, the prevailing wind velocity at this height is 2.1 m/s and the direction is westward. Another important point is that many of the analysis software conduct flow analysis for materials with a low roughness coefficient; and thus, in the FloEFD software, the roughness coefficient is defined as 0. Depending upon the region that the building is located at, the roughness coefficient must also be defined. Since it is an open region surface, the surface roughness is defined as 0.2 m.
Prevailing wind: with the wind velocity input from 10 m height, it is defined to the flow volume as a boundary condition with 2.1 m/s magnitude;
For the winter season: 21 January; summer season: 21 July. Building site is selected with the latitude and the longitude of 37°51′, North latitude;
Ambient temperature: 30 °C, fully cloudless days;
Human face emissivity value is 0.93; absorption value is 0.2;
Building shell structure physical properties (ρ = 500 kg/m3, k = 0.18 W/m K, Cp = 840 J/kg K);
Heat production value for the residents in the amphitheatre is 70 W/m2;
All leaks inside the volume are neglected;
The average humidity amount is assigned with the initial condition as 50% average inside and outside of the amphi;
Solid model of the volume is prepared in 1/1 scale from the obtained site plan;
For metabolic velocity and mechanical efficiency: 1.2 met (1 met = 58.2 W/m2);
For the clothing insulation and moisture permeability: 0.57 clo (1 clo = 0.155 m2 K/W);
Reference temperature: 24°C;
Humidity ratio: 50%.
Microclimatic comfort measurements and computational analysis around campus buildings
Microclimatic measurements around campus buildings with DELTA OHM HD 32.1
Following values were measured from DELTA OHM microclimatic comfort device used for measuring the comfort values around the temporary building of the site placement orientation of the current buildings application plan (Figure 4).
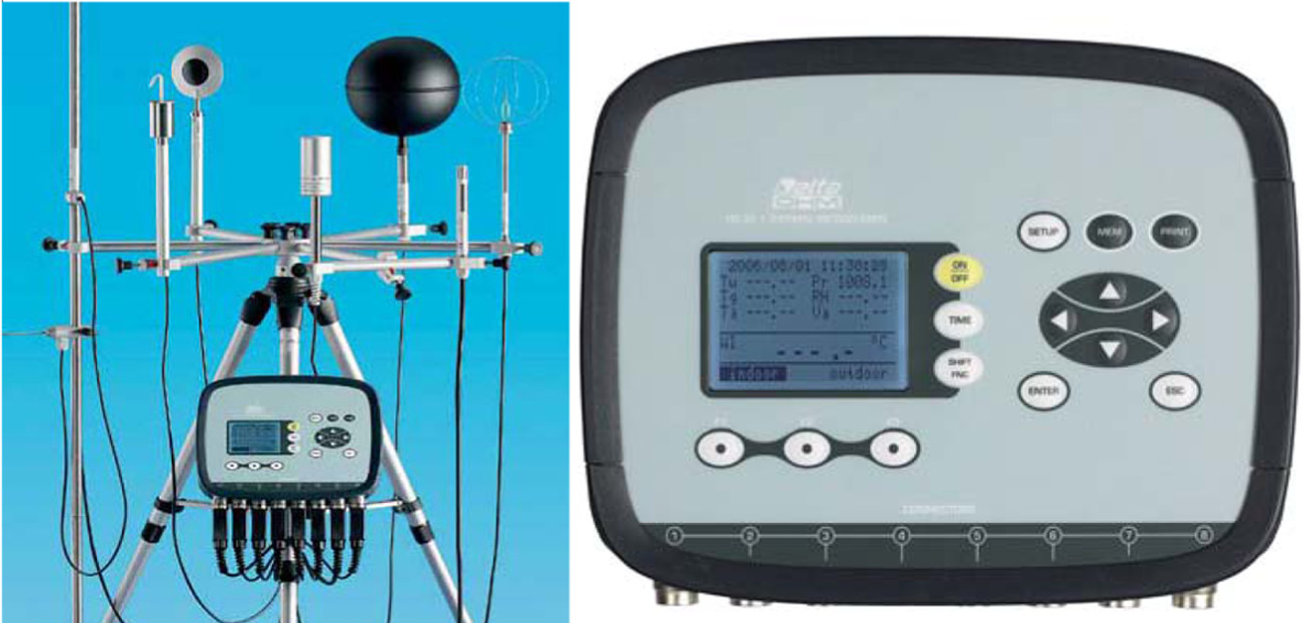
DELTA OHM HD 32.1 microclimatic comfort device used for measuring the comfort values around the temporary building of the site placement orientation of the currently applied buildings.
In this research project, following values were measured from DELTA OHM microclimatic comfort device (Fig.4) used for measuring the comfort values around the temporary campus buildings of the site placement orientation of the current buildings application plan. Measured values from DELTA OHM microclimatic comfort device are given below:
Globe temperature
Natural Wet Bulb temperature (WGBT)
Mean Dry Bulb Temperature
Mean radiant temperature (Tmrt),
Ambient temperature . Atmospheric pressure
Relative Humidity . Air velocity
Air temperature at the height of the head (1.7 m subject standing; 1.1m subject sitting).
Air temperature at the height of the abdomen (1.75 m subject standing; 1.1m subject sitting).
Net radiation temperature.
Net radiation.
PMV (Predicted Mean Vote),
PPD (Predicted Percentage Dissatisfied)
Tr (Radiant temperature)
For the measurements conducted around the campus buildings, it is observed that some sit while some does not, and some people work standing or sitting. There are usually summer and winter clothes in the work area and in general trousers, shirt and t-shirt have been taken into account. In the thermal pressure calculations, the workers who work in the construction are taken with undergarments, trousers, blouse, shoes and socks (0.75 clo) and the metabolic rate has been modelled as 100 W/m2 (1,72 met). The measurements have been conducted under normal working conditions in a 24 h period; the evaluation period has been taken for each point (A-B-C) at 1.75 m of height at working hours (Figure 5).
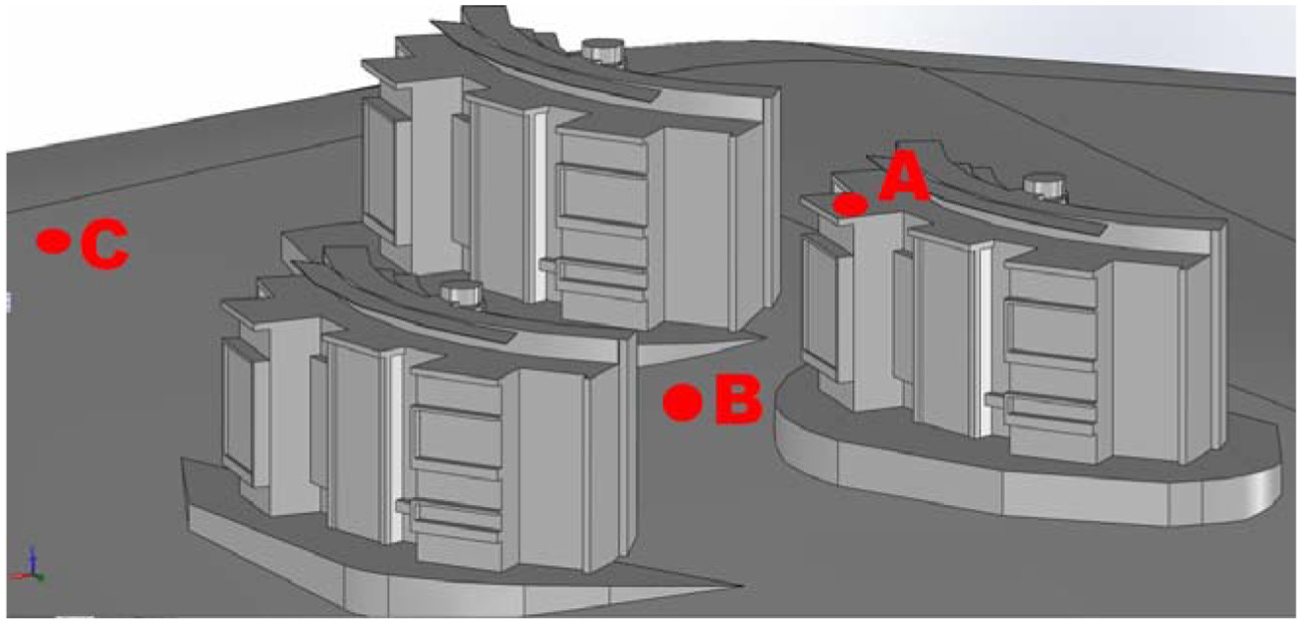
Points where outdoor pedestrian level microclimatic measurements are made using DELTA OHM HD 32.1 device.
Data collection related to the campus site area and working period
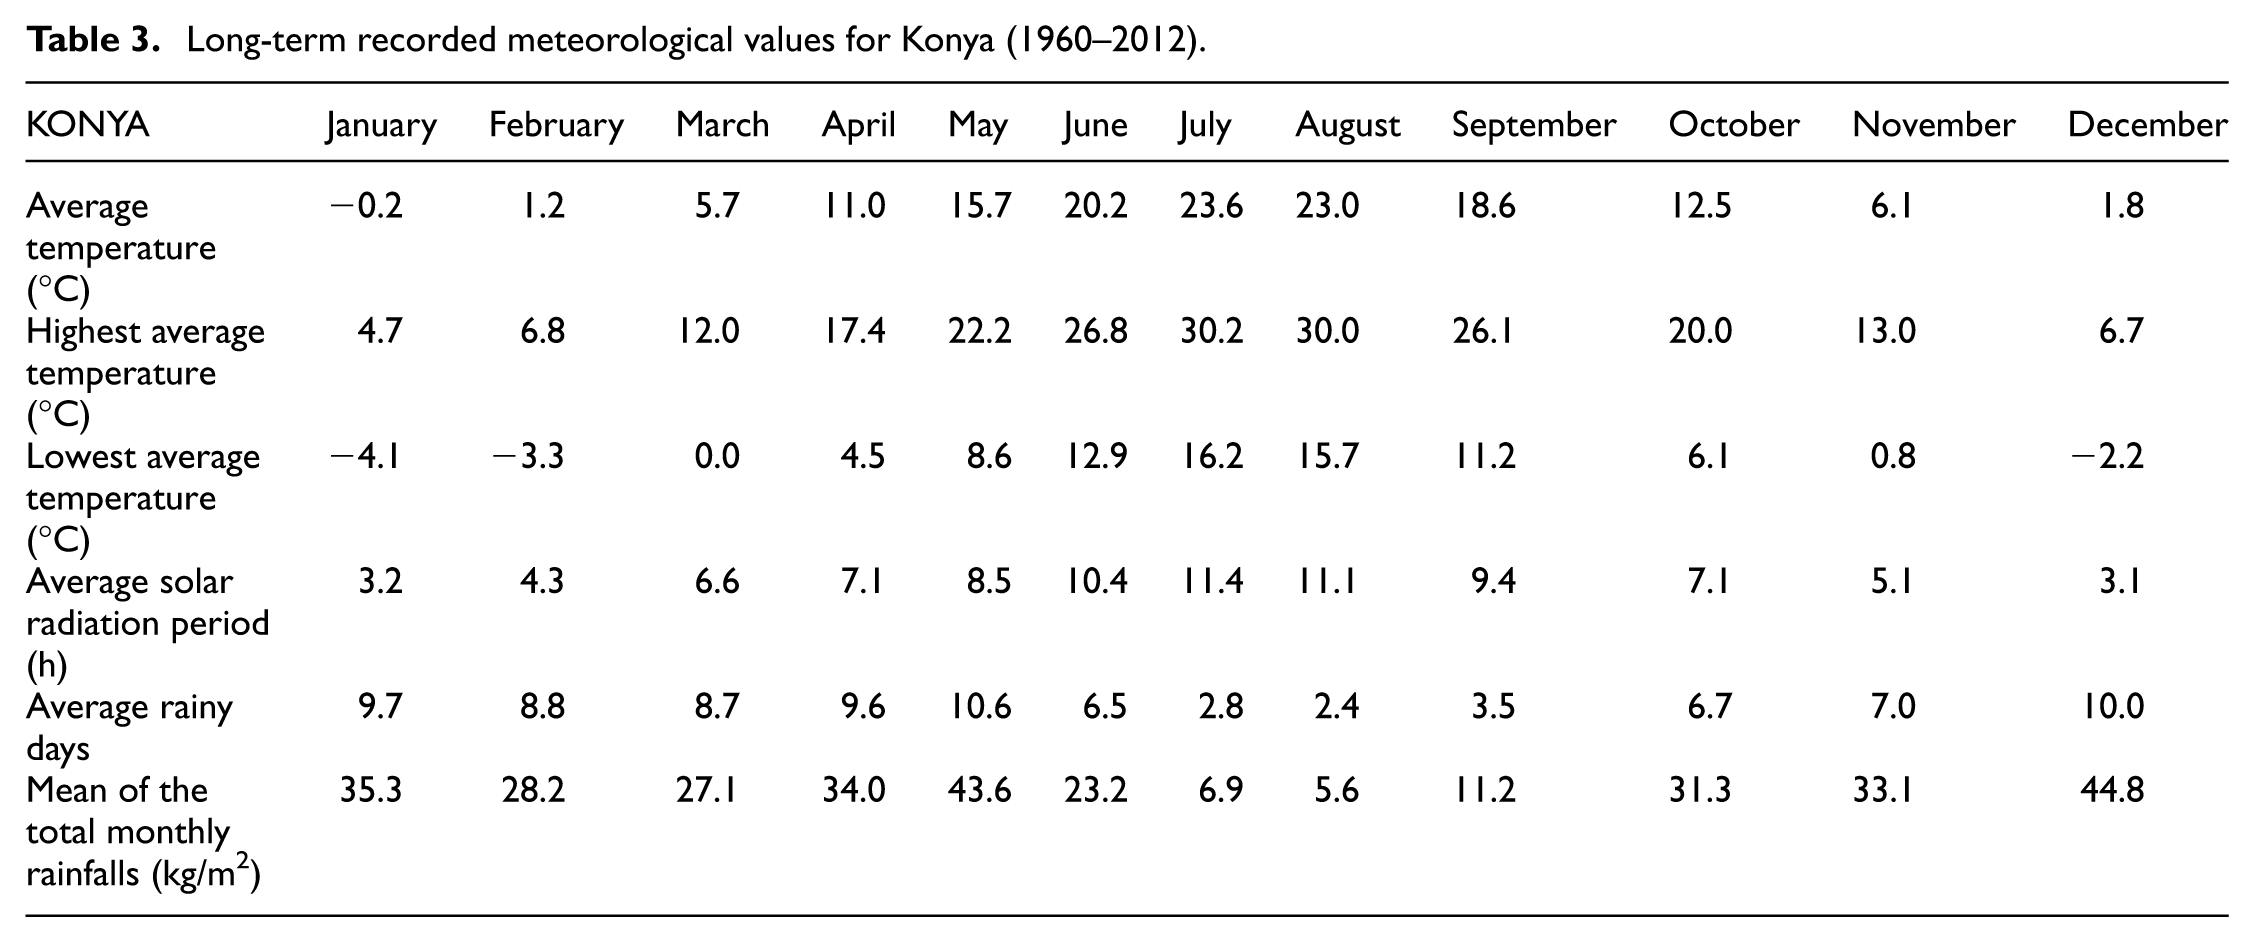
When we look at the overall Konya topography and at the campus topography where the temporary classroom buildings are located, we can see that the study is conducted in a region having a high slope and partial vertical areas. For this workspace, long-term meteorological data are requested. Konya Meteorological Station is located in 37°58′ North latitude and 32°33′ East longitude. In Meram district, where station garden houses are high, is located at 1031 m height. It reflects the changes depending on the urbanization rather than the industrialization affects because of the remote location from the industrial, station facilities. Water vapour pressure (e) observations in the station have started in 1969, and the RH observations have started in 1950. In Table 3, long-term recorded meteorological values from 1960 to 2012 of Konya city where the campus buildings are located are given.
Long-term recorded meteorological values for Konya (1960–2012).
Microclimatic physical measurements with DELTA OHM HD 32.1
A moveable mini-weather station named DELTA OHM data logger (HD 32.1 device) was positioned in 1.7 m above the ground in order to save the values of air temperature (Ta), clothing temperature (Tcl), RH, wind velocity (v) and mean radiant temperature (Tmrt ). The measurement procedure and the instrument were in agreement with ISO 7726 (International Standard ISO 7726, 1998) and it was set to record data at 10-min for all 24 H.
January and July, mid of the summer months, are chosen for the field measurements and survey studies. The measurements are made in three different days in three different points. The measurements are carried out in 24 h period on 21 January for point A, 22 January for point B, 23 January for point C, and 21 July for point A, 22 July for point B, 23 July for point C. Evaluations are conducted for the typical working hour’s process (Table 4).
Statistical summaries of measured physical thermal comfort parameters of indoor and outdoor climatic data.
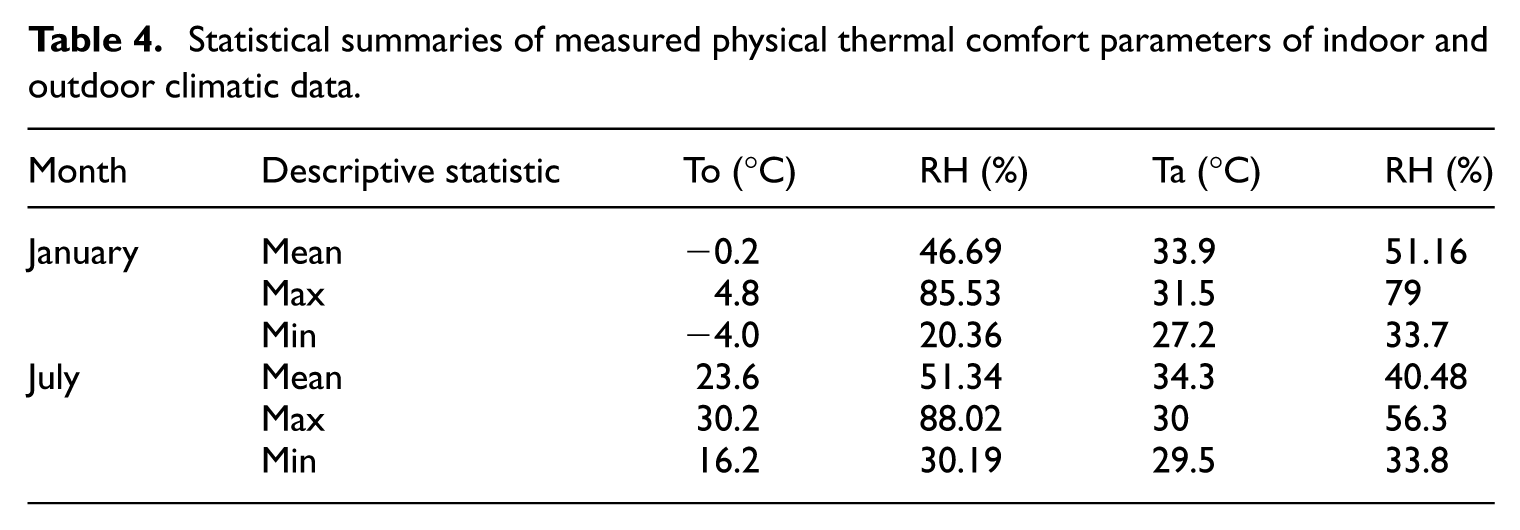
Campus building environmental conditions during the monitoring period of the field measurement, the weather conditions vary with time on different days of months. Statistical summaries of measured physical thermal comfort parameters of indoor and outdoor climatic data are provided in Table 3.
There are issues that need to consider due to the related standard in comfort measurement. For WBGT measurement, globe temperature, wet bulb temperature and temperature–humidity measurements should be made simultaneously and must be recorded. Similarly for the thermal comfort measurement, the parameters needed to be measured simultaneously are temperature–humidity, bulb temperature and air flow rate. While these parameters are the minimum requirements for thermal comfort measurement, all kinds of complementary measurement and values will also be useful.
In the situations where the homogeneity of the environment is obtained (situations where the thermal difference is more than 5% in the vertical plane), the measurements are conducted in the abdomen region of the body. In the situations where the homogeneity is not obtainable (in heterogeneous situations, the vertical thermal difference is more than 5%), the measurements are conducted at head, abdomen and ankle region and thus, external measurements under these conditions are taken as heterogeneous environment (Table 5).
Reference value chart of WBGT heat printing index.
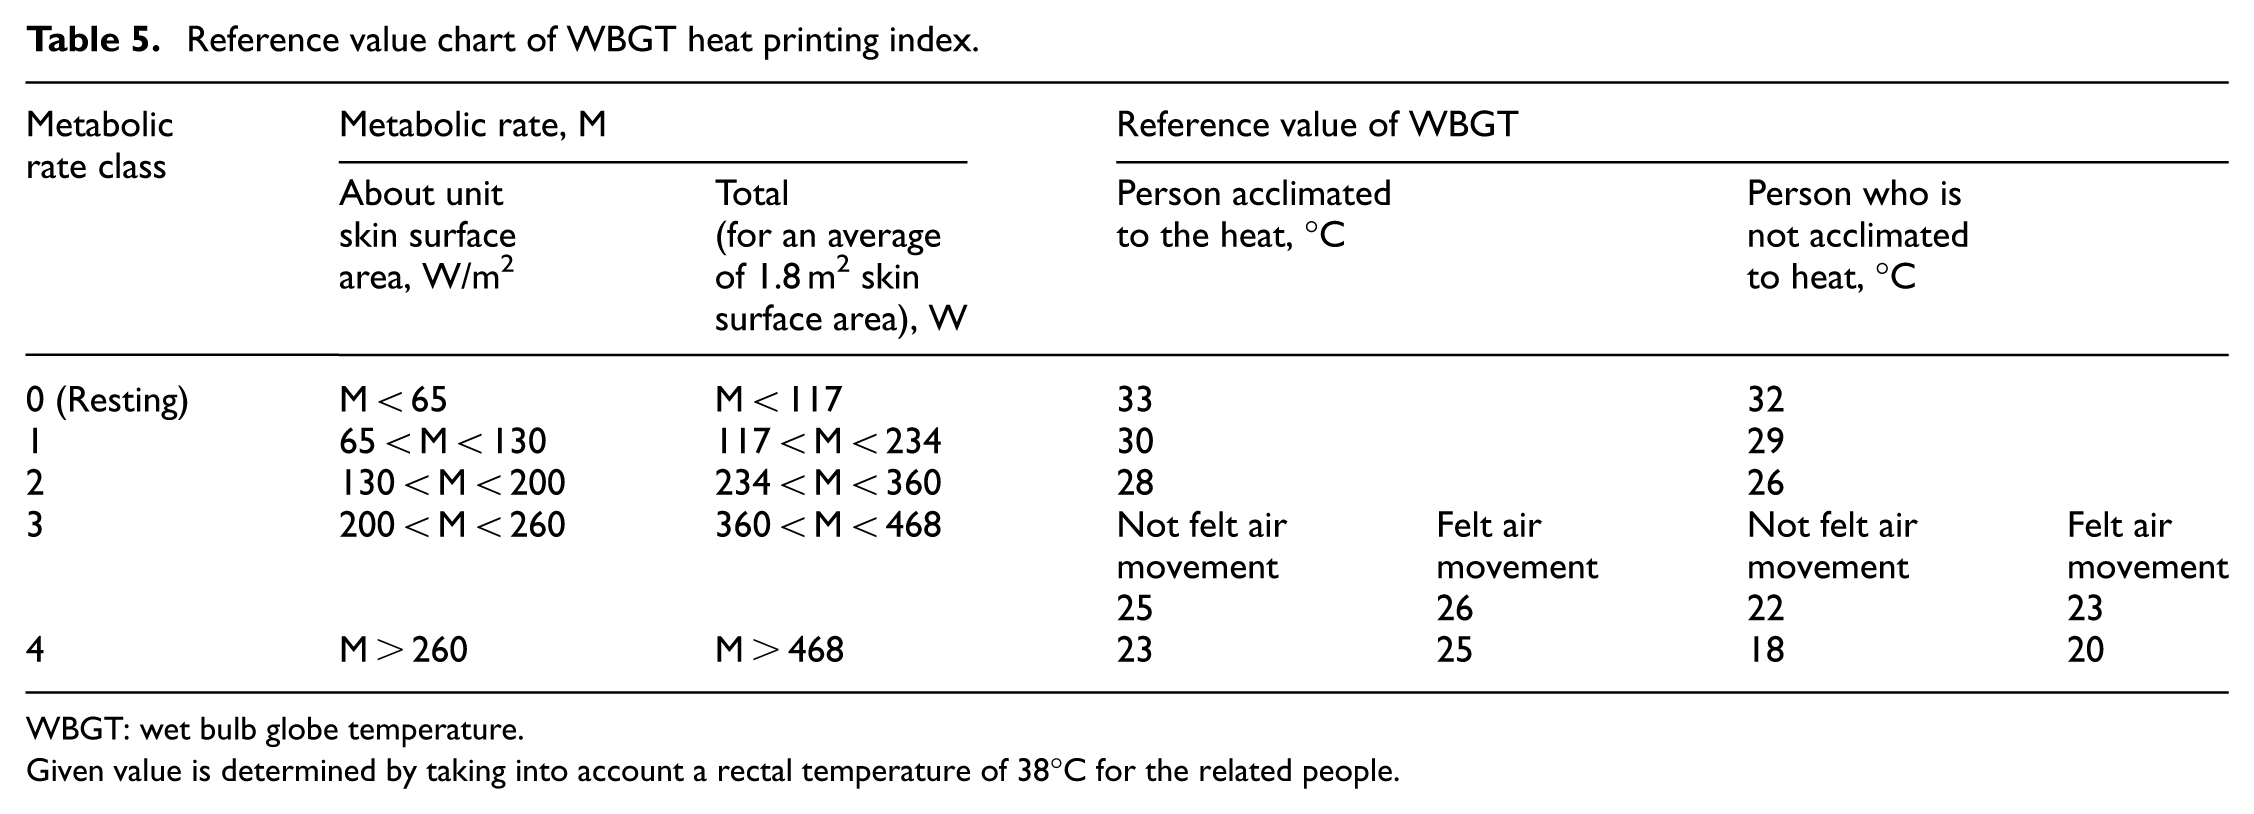
WBGT: wet bulb globe temperature.
Given value is determined by taking into account a rectal temperature of 38°C for the related people.
For a person who is working standing up, the measurement levels are 0.1 m height for ankle, 1.1 m for abdomen and 1.7 m for the head. For a person who is sitting down, these levels are 0.1 m, 0.6 m, and 1.1 m. This study has been conducted for a model with the human standing up along with the corresponding height levels.
The areas which are selected as measurement points should not be too near obstacles such as walls. In addition, equipment such as air conditioners, ventilation, radiator and other similar devices which can affect the measurement results must be kept as far as possible. Furthermore, the prevailing conditions in the environment during the measurements must be also checked and their contribution to the measurement results must be evaluated.
Thermal comfort measurement is not just the measurement of the temperature, rather it is a parameter directly related to heavy duty work performed around the campus building and the clothes worn by the employees. Thus, during the measurement or before the measurement, the general worker uniforms and the work conducted must also be analyzed.
For the measurements conducted around the campus buildings, it is observed that some people are in a sitting position, while some are in a standing position and furthermore some people work standing or sitting. There are usually summer and winter clothes in the work area and in general, trousers, shirt and t-shirt have been taken into account. In the thermal pressure calculations, the workers who work in the construction are taken with undergarments, trousers, blouse, shoes and socks (0.75 clo) and the metabolic rate has been modelled as 100 W/m2 (1,72 met). The measurements have been conducted under normal working conditions in a 24 h period; the evaluation period has been taken for each point at 1.1 m of height for working hours.
Results and discussions about microclimatic physical comfort measurements with DELTA OHM HD 32.1
Radiation exchange depends on the difference between the mean radiant temperature (Tmrt ) and clothing surface temperature (Tcl); the convection exchange depends on the difference between Tcl and the dry bulb temperature (Td) of air. During the day time, Tmrt was much higher than Tcl except for short periods around sunrise and sunset. Therefore, human’s body always experiences a positive heat radiation load (i.e. heat gain). During the night time, Tmrt was lower than Tcl causing a negative radiation heat load (released from the body). On the other hand, Tcl was relatively higher than Td during the day time, causing a negative convective heat released from the body. However, the convection exchange is minor during the night time. Radiation heat load has the prevailing effect because the temperature difference (Tmrt − Tcl) is much higher than (Td − Tcl) (Figure 6).
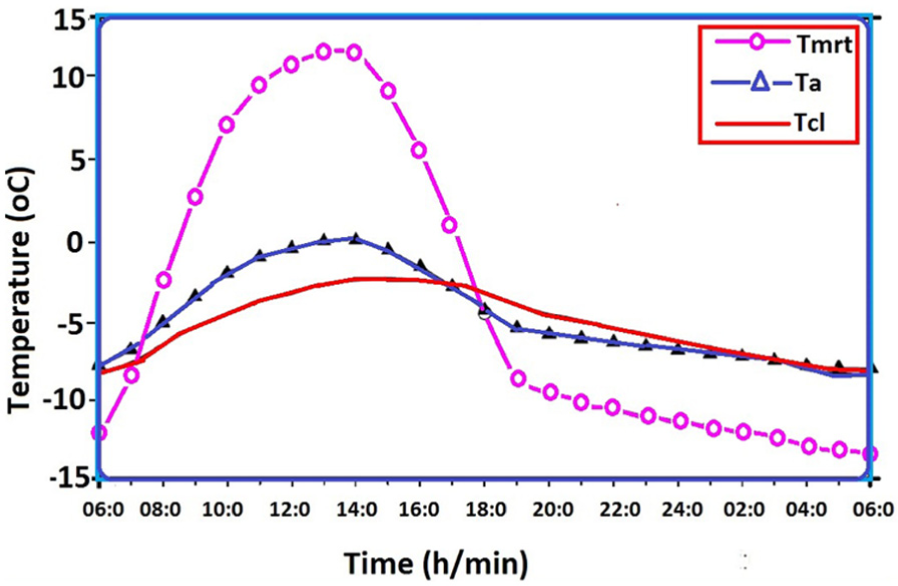
Time dependence of the mean dry bulb temperature of air (Td) and the corresponding mean radiant temperature (Tmrt ), and clothing temperature (Tcl) estimated in the outdoor campus environment conditions in 21 January 2014.
Relation of humidity and temperature in pedestrian level zone around the campus temporary education buildings
The measurement values which are recorded through DELTA OHM HD 32.3 Microclimatic device in the city centre region where the educational buildings are located have been compared with the long-term data obtained from Konya Meteorology Station. Especially, the temperature, RH, water vapour pressure values have been compared with the wind velocity values.
In order to obtain the change in the humidity, the data for the time periods of 07:00, 14:00, 21:00 and the data for daily average have been taken into consideration. As per the meteorological data, it has been observed that in all months for 07:00 and 21:00 as well as for daily average; the change has been negative and in noon hours, it has been observed as positive. The positive difference is due to the negative city heat island which is observed during noon hours in the city. The water vapour pressure differences are not as definite as the RH difference. Besides the noon hours, the city is more humid in the winter months, while it is drier in the summer season. For all the months, during noon time, the city region is more humid. The reason for more humidity in the city is due to the irrigation conducted for the parks in the Konya city centre and in the Meram region. The increasing concretization due to urbanization and the heat island value related to this decreases the RH amount in the Konya City centre.
When measurement results are compared with long-term temperature, relative humidity, and water vapor pressure values obtained from Konya meteorological station, and then when temperature difference (ΔT), water vapor pressure difference (Δe) and relative humidity difference (ΔRH) values are investigated, then it is clearly observed that in comparison to the rest of the year, more humidity is present during September and January April and August contains less moisture. Noon hours are the time where Δe and ΔT have the smallest values. Hidden and sensible heat transfer Δe and ΔT values developing good in noon hours are caused to decrease (results obtained as a result of the analysis made in CFD). Thus, urban area where the educational buildings are located becomes a little more humid whole year according to the topography properties where the campus is located.
Wind-comfort relationship in pedestrian level regions around the campus temporary education buildings
In the points A-B-C determined around the current settlement built beyond the author architect’s suggestion of the temporary education buildings of the university campus located in the topography exposed to very high wind velocity and density of the area and the surrounding land where the education buildings are located in a higher topography than Konya city centre, microclimatic meteorological measurements are conducted. The measurements are performed at these three points in three different days. The measurements are made on 21 January for point A, 22 January for point B, 23 January for point C; and on 21 July for point A, 22 July for point B and 23 July for points C for duration of 24 h. Comparisons and evaluations are conducted for 21 January and 21 July.
Accordingly, when Figure 7 graph values are compared for 21 January at 07:00, the wind velocity values at point A located at the roof point of the education building and point C which is an independent point outside the borders of three buildings are observed to be very high. Pedestrian level human comfort conditions at these wind velocity values according to Beaufort wind comfort scale suggest discomfort. These include dust on the floor, trees and their branches vibrating from left to right, hairs starting to get messy, skirt, dress and so on. This evokes a serious feeling of discomfort.
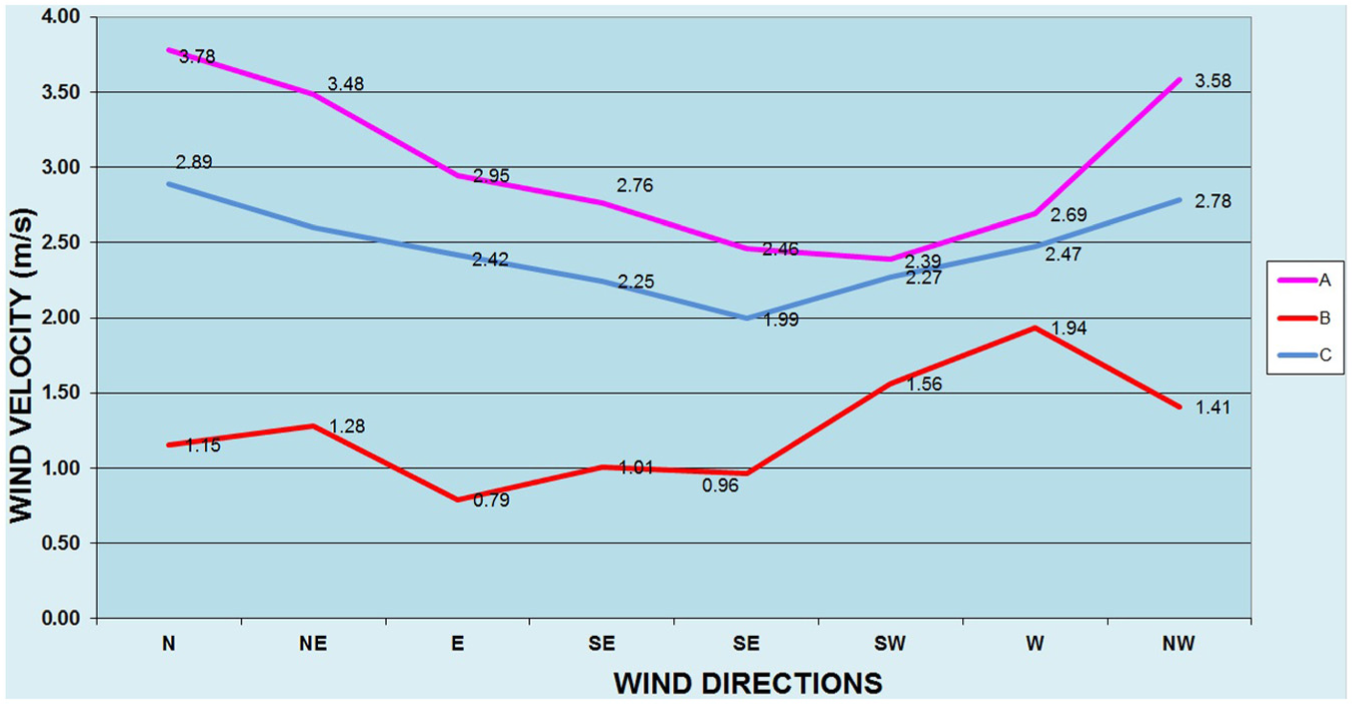
Wind velocity and wind direction on 21 January at 07:00 around the building for the current building placement application against the author architect’s recommendations.
The speeds of the north-directional winds in the prevailing wind direction reach to a magnitude of 3.8 m/s. Measurement values for Point B between two buildings are seen to partially decrease the wind flow velocity of both buildings located at the sides and the building in front, but west-directed wind flow velocity values are observed to increase at a time. The reason for this is because of the venture effect at the point between two buildings cause increases in the velocities. While the wind velocity value at point B is 1.2 m/s average when all directions are considered, west-directed wind velocity values are observed to increase with a 2.00 m/s value (Figure 7).
When Figure 8 values for January 21 at 14:00 are compared, wind velocity values of point A located at the roof point of the education building and point C which is an independent point beyond the border of three buildings are seen to have very high values. However, when this hour is compared with the wind velocity values at 07:00 and 21:00, it is observed to have lower wind velocity values. In addition, comparing the wind velocity values at 14:00 with 07:00 and 21:00, wind velocity value for point B reaches to higher values at 14:00 than the other hours.
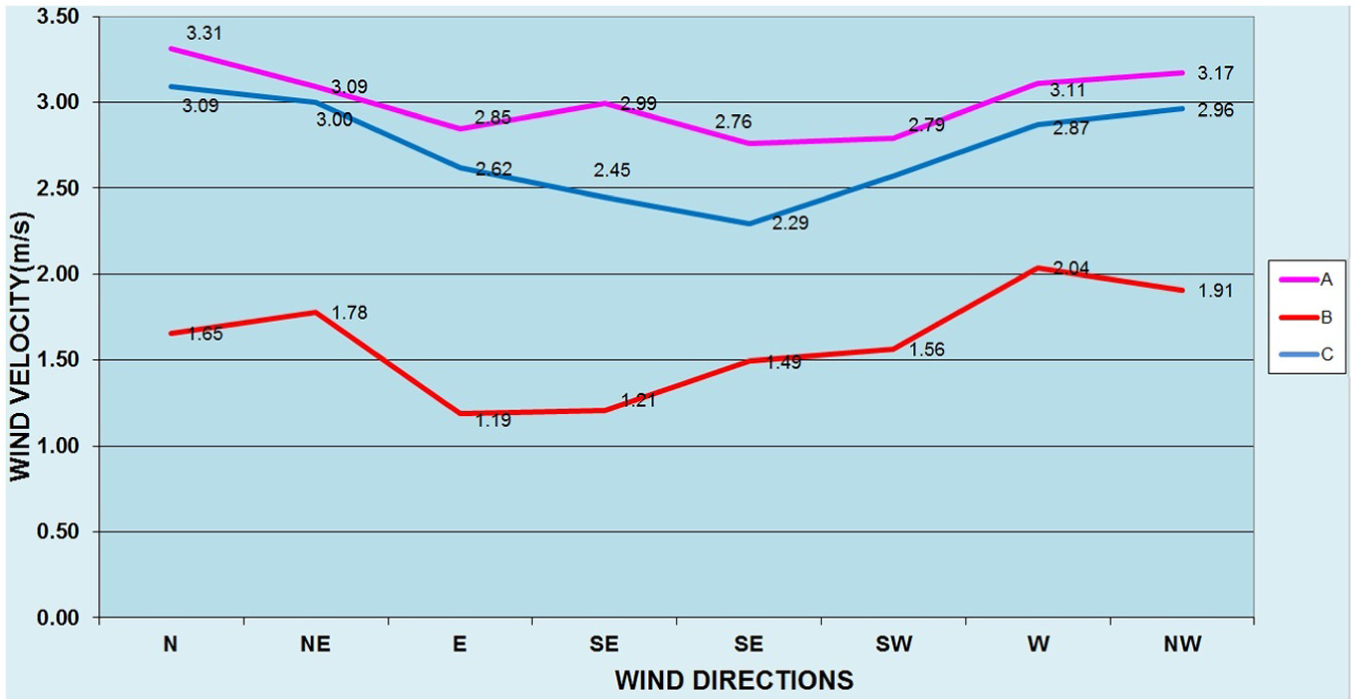
Wind velocity and wind directions around the buildings of current building settlement applied beyond the suggestion of the author architect for 21 January at 14:00.
Prevailing wind direction of north-directed wind velocities reaches to 3.80 m/s values. Measurement values at point B between two buildings partially decrease the wind flow velocity values of both buildings located at the sides and the building in front in particular; but west-directed wind flow velocity values are observed to show increment at a time, because of venture effect at the points between two buildings. While the wind velocity values at point B are seen to be about an average of 1.40 considering all the directions, west-directed wind velocity values are observed to increase 2.00 m/s value at a time (Figure 8).
According to this, when the graph values in Figure 9 for January 21 at 21:00 are found to be the highest values comparing to the velocity values at 07:00 and 14:00. Wind velocity value of North direction which is the prevailing wind direction at points A and C reaches to 3.90 m/s. Measurement values at point B between two buildings decrease partially the wind flow velocity values of both buildings, but wind flow velocity values in west-direction are observed to increase at a time because of the venture affect between two buildings. When all directions are considered, while wind velocity value at point B is 1.70 m/s average, west-directed wind velocity values are observed to become as high as 2.25 m/s (Figure 9).
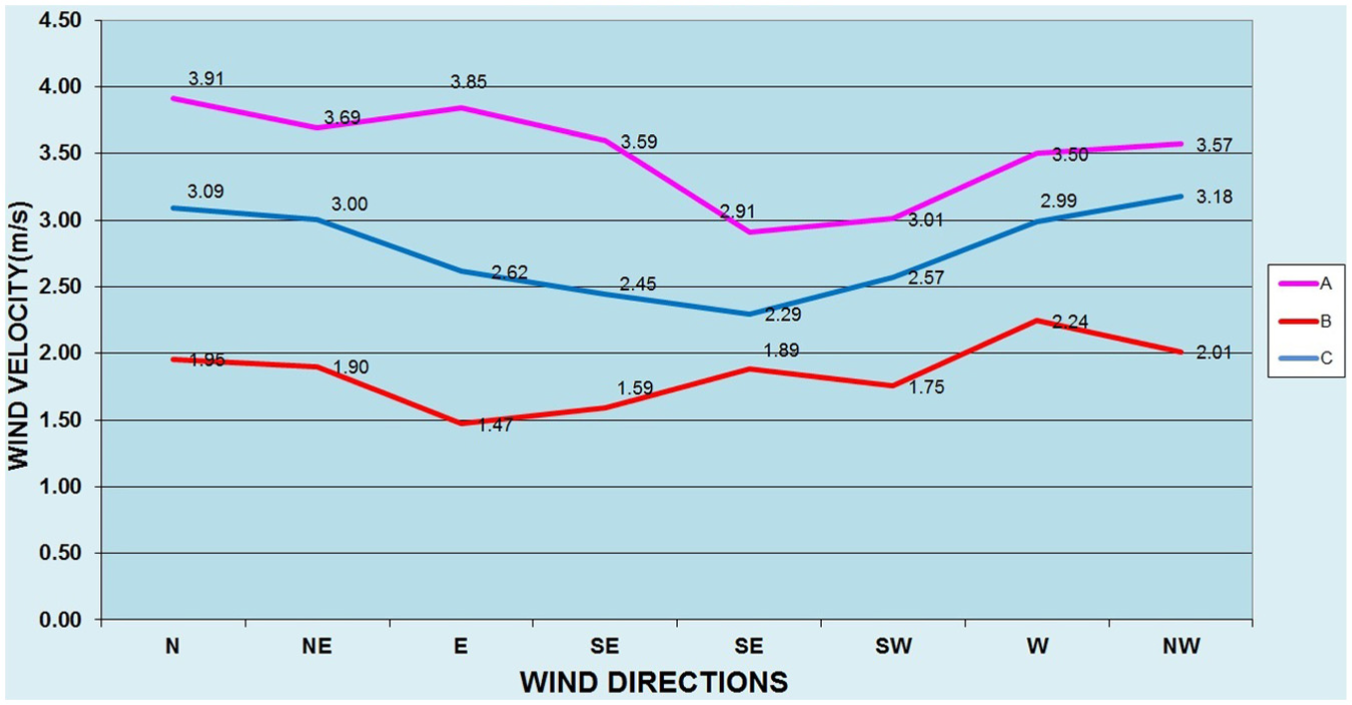
Wind velocity and wind direction on 21 January at 21:00 around the building of the current building settlement application against the author architect’s suggestion.
According to the Beaufort wind velocity comfort scale, winds which reach velocities between 0.20 and 2.30 m/s can create comfort in humans which can be felt clearly. Any wind velocity values which are above these values will start to give serious discomfort to humans.
Conclusion
In order to provide internal climatic conditions (climatic comfort conditions) with the help of current external climatic conditions in the design of campus building settlement, a number of measures should be taken concerning the design parameters. In order to take these necessary steps, first the values of the external climatic elements should be obtained and transformed to a usable format; in other words, the climatic data should be compiled. Therefore, the values of the external climatic elements such as solar radiation, outside air temperature, outside air humidity and wind of the region where the design takes place should be determined depending on the real atmospheric conditions. In order for the climatic comfort to be realized with minimum additional energy, design variables which are under control of the designer need to have appropriate values.
Especially since the topography where the university is located has a very high or very low outer temperature and wind velocity values; climatic comfort problems are observed to be formed. These are the discomfort problems occurring as a result of some reasons listed below:
Incorrect usage of the climatic parameters;
Incorrect direction of the buildings;
Faulty selection of thermal effects of the materials utilized in the buildings,
Because of the factors above, thermal discomfort is seen to occur in the current building settlement.
In the configuration in which collapsible openings on the walls proposed between the buildings in the campus building settlement architectural design by the author, thermal comfort values are extremely low since the wind flow inside the courtyard for 21 July reduces. However, the opposite case is observed when the values for 21 January are compared. This case, since a sheltered space is formed, outdoor comfort values are higher. When indoor comfort values for the same day are compared with the option in which all openings are left open, comfort values are seen to be weak in terms of PMV value. However, 21 July outdoor comfort values of the configuration in which all openings over the wall are open are observed to be higher comparing to the configuration in which all openings are open.
Since the current application of campus building placement is built by ignoring the climatic values and dense wind conditions in the land, wind flow in both 21 January and 21 July analysis is observed to cause the wind to enter even inside the buildings at the points where the buildings are separating. Velocity boundary condition given here is 2.1 m/s in 5.00 m height in the areas between the buildings, and the transformation of the separation point inside the courtyard increases the velocity level from 2.1 to 3.5 m/s strength. These values are seen to reach discomforting values particularly in the regions where the building heights exceed 5.00 m when they are evaluated according to Beaufort comfort scale. Thus, current campus settlement, around the buildings and amphitheatre, are seen to reach very discomforting levels in terms of in classroom comfort.
In the survey carried out for both outdoor microclimatic comfort conditions and the indoor comfort conditions of the current buildings in which the options suggested by the author is not applied, and where instead the layout settlement suggested by TOKI (Housing Development Administration of Turkey) is applied, in the microclimatic measurements and as a result of CFD analysis works, applied projects are found to be quite weak and disadvantaged as a microclimatic wind comfort compared to the proposed ones.
Footnotes
Declaration of Conflicting Interests
The author(s) declared no potential conflicts of interest with respect to the research, authorship, and/or publication of this article.
Funding
The author(s) disclosed receipt of the following financial support for the research, authorship, and/or publication of this article: This work was supported by Necmettin Erbakan University Scientific and Technological Research Projects Funding Program (Grant No. 131219001).