
Abstract
This article deals with the influence of both morphology and amount of Typha on hygrothermal behavior of a Typha–clay composite for building application. An agromaterial containing the fiber mix of Typha Australis and clay was made in three samples: three fiber mixtures were prepared with different amounts Typha and cut type (transversal or longitudinal). The physical properties of these materials were studied in terms of porosity, apparent and absolute density, thermal conductivity, and hygric properties. Results show a real impact of the Typha fraction type and its volume content on hygrothermal properties of the studied material due to the porosity. The transversal fraction of Typha (80% in volume weight) seems to be the optimal composition for a better hygrothermal behavior.
Keywords
Introduction
The use of bio-based composites as thermal insulating material is one of the solutions for reducing buildings energy consumption. Due to their low embodied energy, high availability, and performance, these resources (hemp, straw, starch, etc.) are more and more integrated in the building design (Bourdot et al., 2017; Collet and Pretot, 2014; Moussa et al., 2016).
Many studies have been conducted to investigate thermophysical and hygric behavior of such bio-based materials. New agromaterials based on hemp and starch have been tested (Moussa et al., 2016). Internal structure of the composite reveals a porous structure including mesopores and macropores. The measured thermal conductivity was 0.08 W m−1 K−1 and the heat capacity about 1.275 J g−1 K−1 at 23 C. The moisture buffering value (MBV) was also determined and the result shows that this material is an excellent humidity regulator (MBV of 3.39 g m−2 %RH−1).
The porosity of hemp concrete mix is evaluated (Gourlay et al., 2017) and the study shows the influence of the hemp concrete water content on thermal properties. In another study, hygric properties (isotherm, water vapor permeability, capillary water absorption, and moisture buffer capacity) of a new bio-based material “rape straw lime concrete” were presented (Rahim et al., 2016). Results showed that the composites, having a highly porous structure, unveil an excellent moisture buffer capacity (between 2.02 and 2.59 g m−2 %RH−1) and interesting hygric properties. In this article, authors deal with the study of a Typha–clay–based building material.
Typha Australis is an herbaceous, monocotyledonous semi aquatic plant with a very large availability in Senegal (140,000 ha with an annual growth rate of 10%). Its invasing presence constitutes a real threat to the ecosystem and socio-economic balance (PNUD, 2013). Therefore, valorizing Typha as a natural fiber source for building materials would turn this threat into an opportunity. The choice of the clay binder was based both on environmental and availability criteria in Senegal leading to a 100% natural and local resource building material, which use requires very little processing and for which techniques are very well mastered (Anger and Fontaine, 2011; Guillaud and Houben, 2006; Volhard, 2016).
In the literature, many studies concerned clay properties. McGregor et al. (2014) studied the hygric properties of unfired clay masonry. Results revealed that MBV of these materials varies between 1.13 and 3.73 g m−2 %RH−1, according to the Nordtest project method. The shape of the particles composing the soil has an important influence on the moisture capacity, sorption isotherms, and water vapor permeability. In a similar study, experimental analysis of Pressed Adobe Blocks reinforced with Hibiscus cannabinus fibers were carried out (Millogo et al., 2014). It was shown that thermal conductivity declined as amounts and lengths of fibers increase. A 0.8 wt% content of 60 mm long fibers led to the optimal thermal performance.
Concerning Typha fibers, previous investigations have been carried out to elaborate Typha–clay and Typha–cement mixtures (Diatta et al., 2011; Diaw et al., 2016; Dieye et al., 2017). Results show that thermal behavior of composite made of crushed fibers of Typha and clay (75 wt.%) has low thermal conductivity ranging from 0.117 to 0.153 W m−1 K−1 (Dieye et al., 2017). However, there is no information about hygric performance of such materials in the literature. The aim of the present work is to elaborate and study the hygrothermal properties of Typha and clay mixtures as a function of the ratio and morphology of two different types of Typha fiber: one obtained from a transversal cut (T) and the other obtained from a longitudinal cut (L). The raw materials’ physical characteristics are specified (bulk and absolute density, porosity). Then, experimental methods to determine the following properties are detailed: physical (apparent, absolute density, and porosity), thermal conductivity, and hygric properties (permeability, sorption isotherm, and MBV). Experimental results are presented and the impact of the type of Typha chips and ratio on the material’s properties are discussed.
Materials and methods
Typha
In our study, Typha plants (Figure 1) were harvested and transported from Senegal. This standard summarizes all the operations to be carried out to ensure the harvesting, transport, drying, and storage of Typha Australis to produce thermal insulation materials for buildings. The Typha plants are cut manually using a sickle. The cutting height is 20 cm above the water level to keep the plant alive (Dieng, 2002). Drying in the open air is carried out at the Typha cutting site for 7–10 days depending on climatic conditions. Storage is a very delicate operation. It must carried out very carefully to avoid the development of mildew. The Typha plants are then packaged in bales and transported by sea. The chips of Typha are produced by cutting the plant, separated from the spadix (upper part containing the seeds) and the roots (Samin, 2017). To evaluate the impact of the morphology of the Typha chips, two types of cuttings of the plant are chosen: a longitudinal cut (L) and a transversal cut (T). Figure 2 illustrates how the Typha chips are produced.
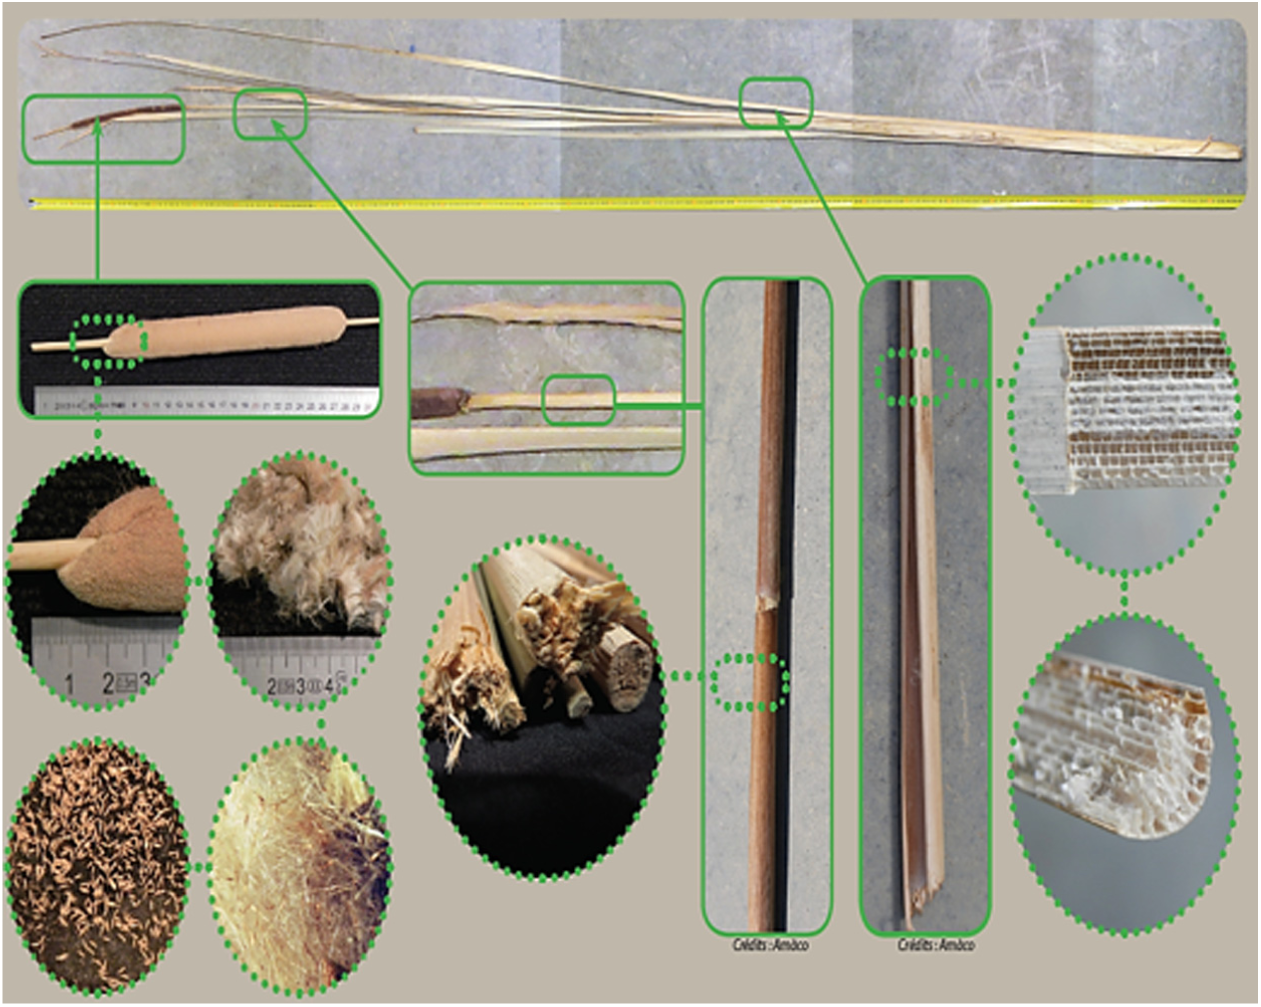
Typha plants (Samin, 2017).
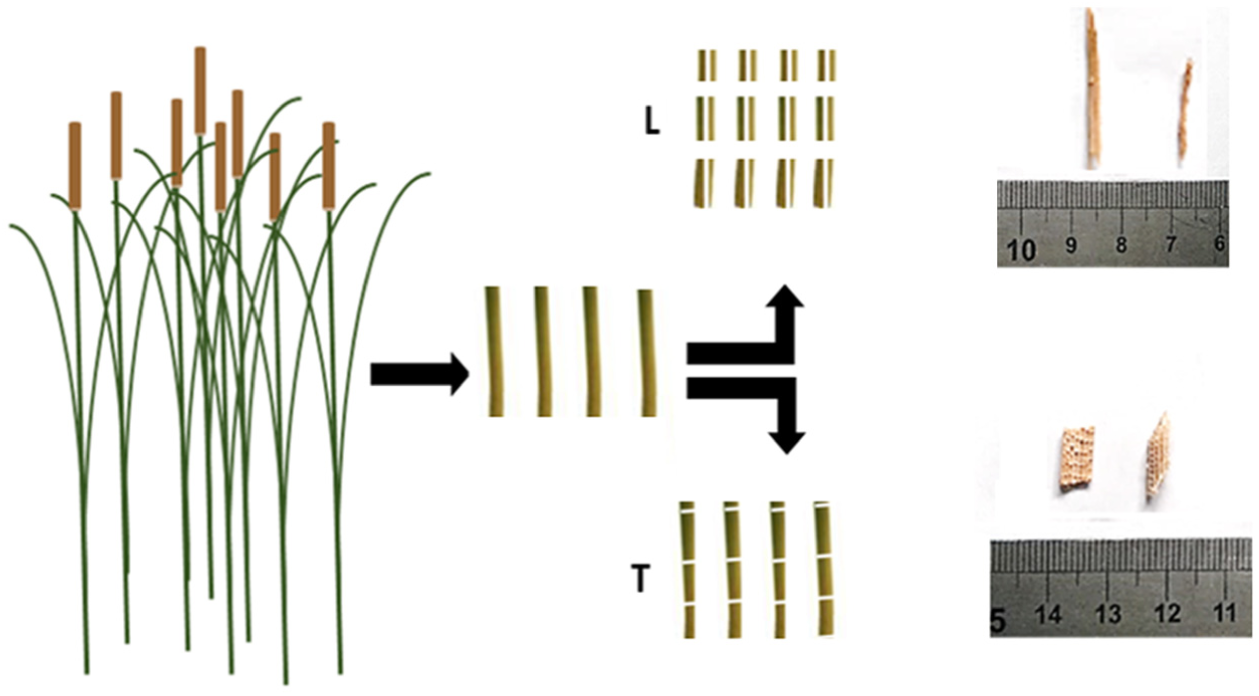
Methods for cutting Typha plant into longitudinal (L) and transversal (T) chips.
Physical characteristics of the particles obtained are the following: aggregates resulting from transversal cutting (Figure 2): this is a mode of splitting which permits to maintain the internal structure, characterized by a very high level of porosity. The outer boundary of the Typha fraction is rough. The bulk density of the fibers resulting from this splitting is around 51 ± 1.5 kg m−3. The fractions resulting from longitudinal cutting have a very low intra-particle porous structure and a very smooth external wall. The bulk density is 60 ± 1.2 kg m−3.
It can be noted that with the transversal cut, the particles show a lower bulk density. This is due to the slightly higher porosity level of these aggregates. Figure 3 shows that the transverse fraction is coarser than the longitudinal fraction. The latter is formed of thinner chips which do not contain visible macropores.
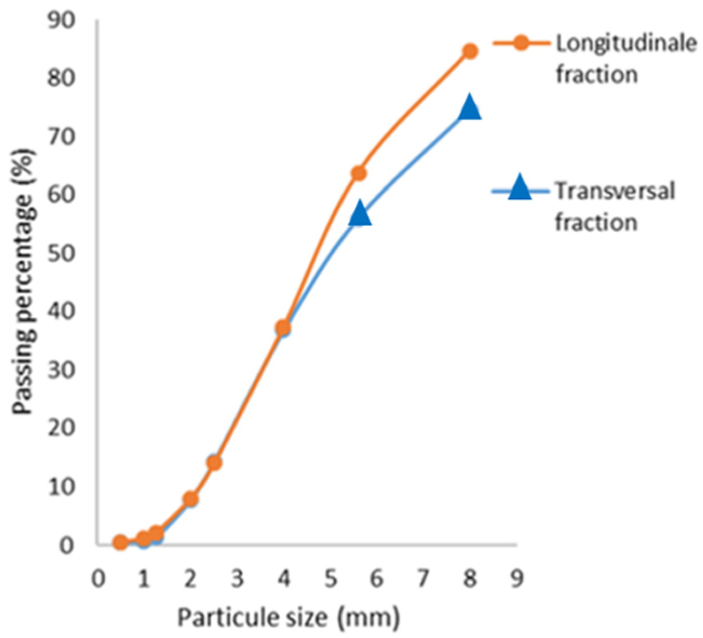
Grain size distribution curve of Typha chips.
Clay
In this work, clay soil from Thicky town in the region of Thiès (Senegal) is used. Preliminary experimental tests were carried out to select and characterize this soil (NF P 94-051, 1993; Riveros Olmos, 2016). The purpose of these tests was to examine whether this soil was suitable for use as a binder to produce building materials. Among its fundamental properties, this soil presents specific characteristics, such as granularity (texture of the grains constituting the soil) and plasticity (the ability of the soil to bind with water and texture of the resulting mix). Granulometric analysis of Thicky soil (dry bulk density of 1350 kg m−3) shown in Figure 4 (Riveros Olmos, 2016) reveals that this soil is clayish and contains more than 62% of millimeter size particles or smaller.
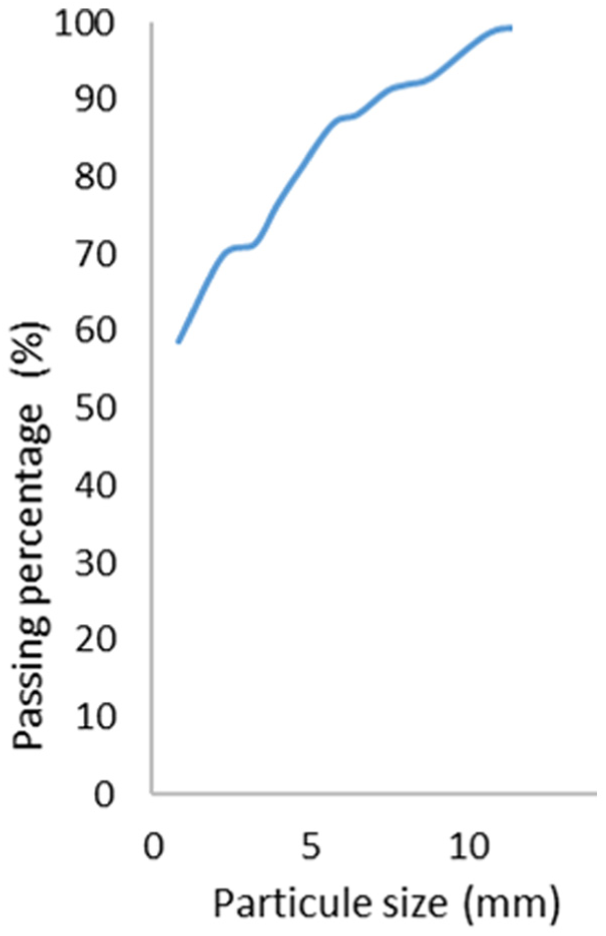
Grain size distribution curve of Thicky soil.
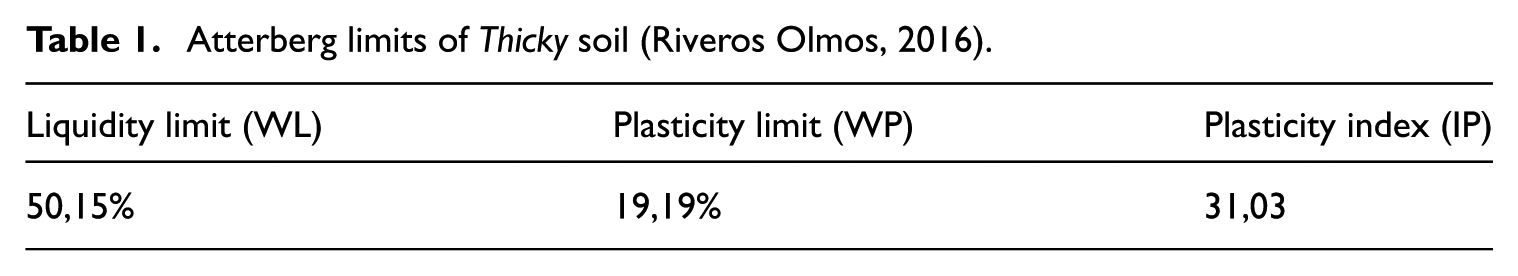
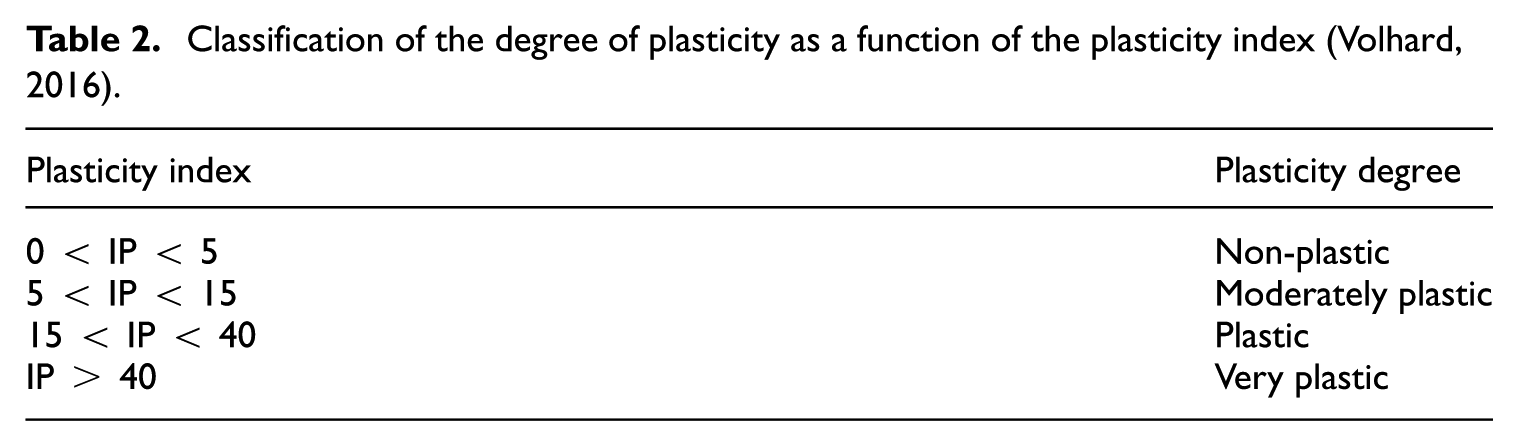
According to AFNOR standards (NF P 94-051, 1993), the limits of Atterberg are tests which make it possible to define indicators qualifying the plasticity of a soil, and more precisely to predict the behavior of the soil according to the water content variations. Three geotechnical parameters are determined: first, liquidity limit (WL) (the water content of a soil at the point of transition between the liquid and plastic states); then, plasticity limit (WP) (the water content of a soil at the point of transition between the plastic and solid states); and finally, the plasticity index (IP) that is the difference between the limits of liquidity and plasticity. This parameter allows to evaluate the range of water content in which the soil is in the plastic state. The results (Table 1; Riveros Olmos, 2016) show that the Thicky clay has a plasticity index between 15 and 40 and according to this classification (Table 2), it is considered a plastic soil.
Atterberg limits of Thicky soil (Riveros Olmos, 2016).
Classification of the degree of plasticity as a function of the plasticity index (Volhard, 2016).
Formulation of materials
The materials’ formulas were implemented to estimate the influence of the type and the amount of Typha chips on the composite behavior (Samin, 2017). Three formulations (Figure 6) were prepared. Both formulations (L-80/20 and T-80/20) produced by both L and T fractions. The measured bulk density varied between 300 and 330 kg m−3. The third formulation (T-66/33) was made from T granulates. The measured bulk density varied between 500 and 600 kg m−3. The data presented (Table 3; Samin, 2017) below describe mixtures composition.
Formulation of composites.
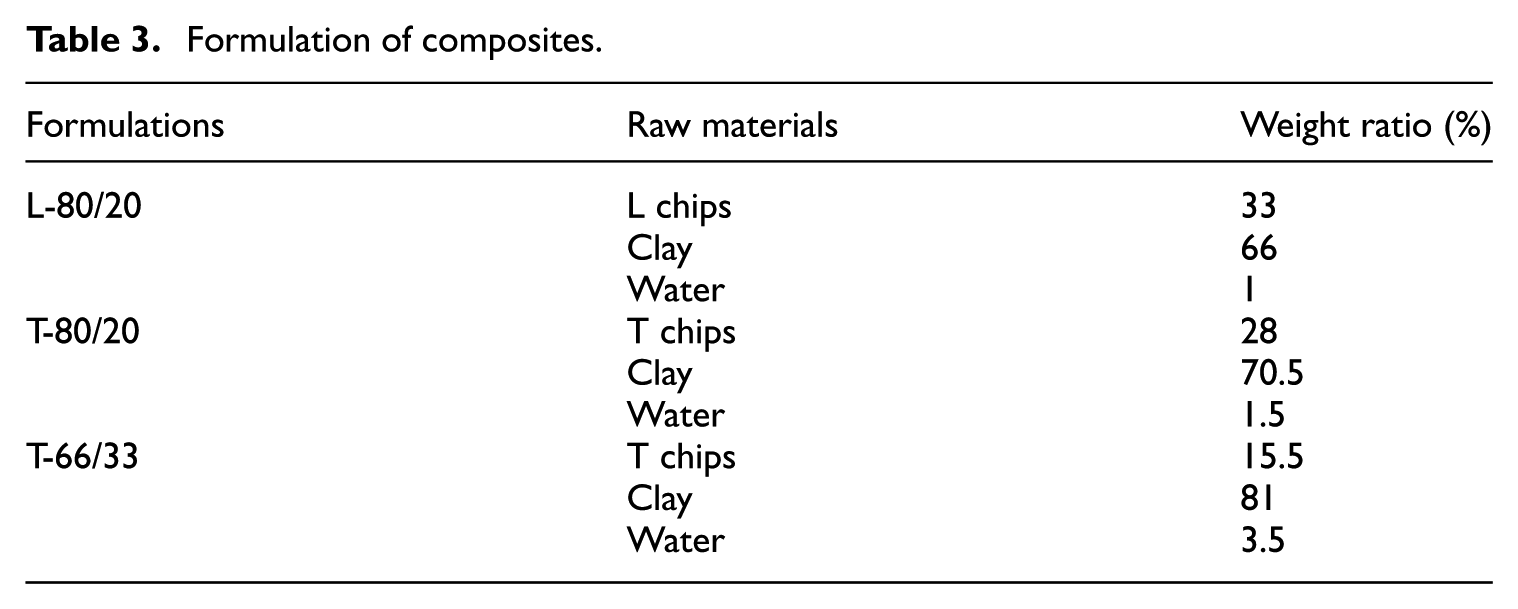
The L-80/20 and T-80/20 formulations had identical Typha–clay volume ratio (80%–20%). In the T-66/33 formulation, the Typha–clay volume ratio was 66%–33%. To avoid any water absorption competition between clay and Typha fibers during the mixture preparation, the clay/water binder was prepared separately. The sample production (Figure 5) of the materials was carried out in the following order: introduction of the fibers in a typical concrete mixer, addition of the binder, followed by 10 min mixing. Then, the mixture was placed in different molds according to the required characterization tests to be carried out. The formulations were compacted in the molds with a compaction ratio ranging from 1.75 to 2.25 for the L-80/20 and T-80/20 formulation, and from 1.3 to 1.7 for the T-66/33 formulation. The samples were then cured in a climatic room at 45°C and 5% relative humidity (RH) for 2 days in the case of the L-80/20 and T-80/20 formulation, and 7 days in the case of T-66/33 formulation. The measured apparent density of the dry composites obtained from the various formulations is summarized in Table 5.
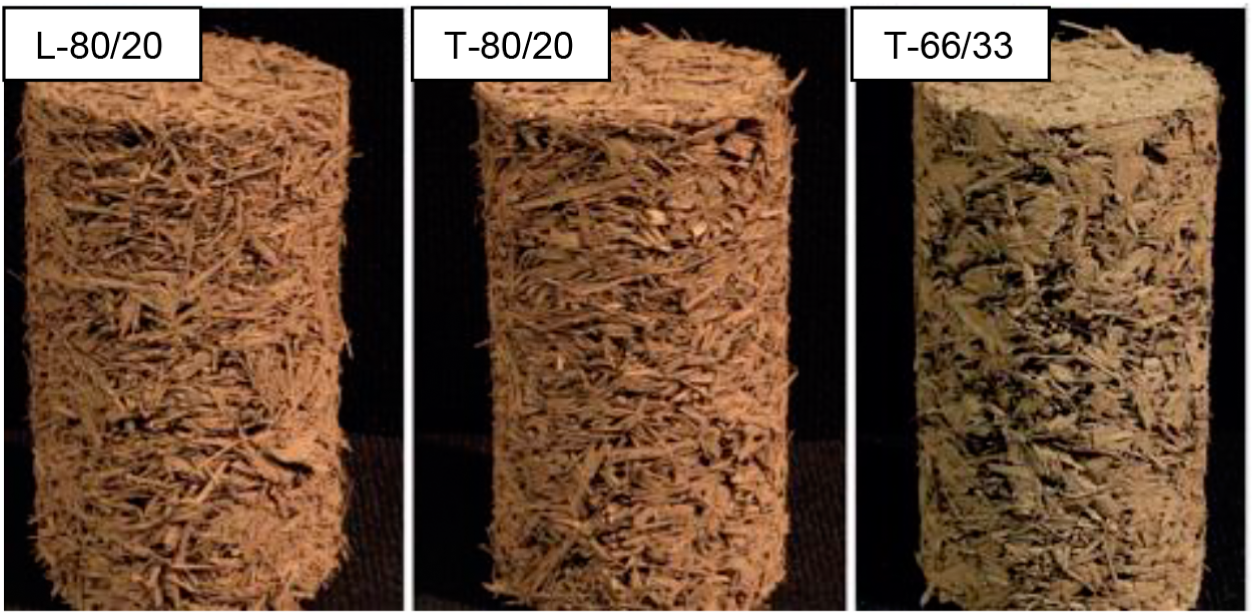
Composites samples obtained from the three formulations (Samin, 2017).
Bulk density, apparent density, absolute density, and porosity
To assess the influence of the incorporation of Typha fibers on the composite, the pore structure analysis was performed. For each formulation, three samples are tested to ensure the reproducibility of the measurements.
The bulk density ρbulk of the fiber mix was determined by the standard NF EN 1097-3 (1998). The absolute density ρabs was measured by a pycnometer using cyclohexane (Bourdot et al., 2017). This method begins with a drying phase (7 days at 50°C to remove absorbed water) of blender powdered samples. The samples were introduced in cyclohexane used as the immersion solvent and the occluded air was evacuated by a series of successive six boiling and cooling cycles (30 min at the boiling temperature of cyclohexane followed by 20 min cooling at room temperature). At the end of the last cycle, the system was filled with argon in order to prevent the introduction of air and moisture into the sample. Finally, the cyclohexane covered samples were weighed in the pycnometer at constant volume. The absolute density of the different composites was calculated using the following formula
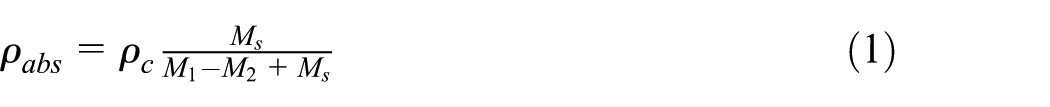
where ρabs is the absolute density (kg m−3), ρc is the cyclohexane density (0.778 kg m−3), Ms is the mass of the sample (kg), M1 is the mass of the pycnometer filled with cyclohexane (kg), and M2 is the mass of the pycnometer filled with the sample and cyclohexane (kg).
The porosity of Typha composite was studied by mercury intrusion porosimetry (MIP). Details can be found in Moussa et al. (2016). According to the method, the pore access radius ranges from 200 (0.003 MPa) to 0.003 μm (207 MPa). Thus, pores of larger access radius such as the 0.2 mm diameter macropores are not taken into account.
Thermal conductivity
For thermal conductivity, two methods are used: the heat flow meter and hot wire method. The standard heat flow meter equipment (ASTM C518) was used with mean temperature. Details are developed in Bourdot et al. (2017). For hot wire (ASTM C1113), more information are given in Collet and Pretot (2014).
Permeability
Water vapor permeability δv (kg m−1 s−1 Pa−1) of a material is defined as the ability to allow water vapor to pass through under a gradient of vapor pressure. The sample is put in a chamber where a solution of saturated salt is placed in a cup right underneath (potassium nitrate KNO3) for the wet cup protocol, or anhydrous salt (calcium chloride anhydrous CaCl2) for the dry cup protocol (NF EN ISO 12571 (2013)). The overall system is conserved into a climatic chamber set to 50% RH at 23°C. The water vapor resistance factor

Sorption isotherm
Sorption tests were carried out according to the standard NF EN ISO 12572 (2001). Five samples of size 10 × 10 × 10 cm per mixture were prepared. They were cured for 7 days at 50°C and 5% RH until they reach the dry state. They were then placed in a climatic chamber at 23°C and at various RH levels: 20%, 40%, 60%, 80%, and 97%. At each humidity level, measurements were carried out until mass variation for three successive weighs was less than 0.1% of the total mass. An additional measurement was performed in a hygrostat at 97% RH using a potassium sulfate saturated solution.
Experimental results were then fitted with analytical models. Three models were used: GAB (Anderson, 1946), Merakeb (Merakeb et al., 2009), and Van Genuchten (Van Genuchten, 1980) models. Table 4 shows the models’ equation and their parameters.
Models used for sorption isotherms.
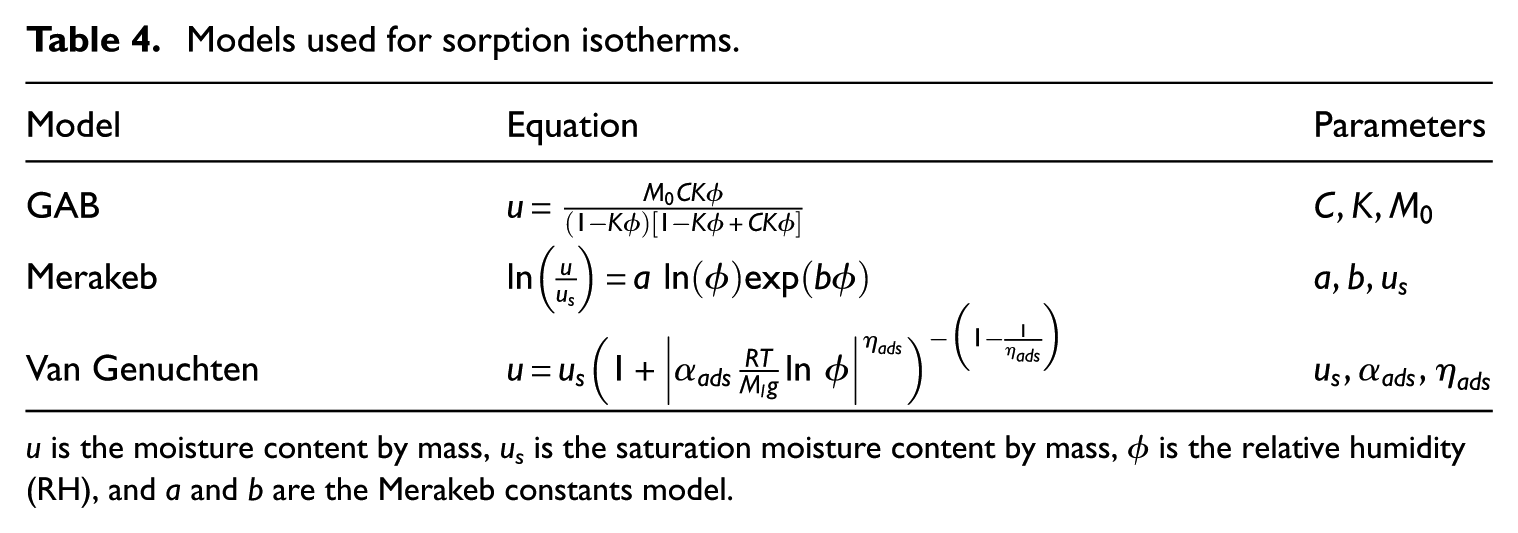
u is the moisture content by mass, us is the saturation moisture content by mass, ϕ is the relative humidity (RH), and a and b are the Merakeb constants model.
Experimental data were correlated with the least squares method. To estimate the variability attributed to the model, the coefficient of determination, R2, was calculated. The mean deviation, E, and the root mean square error, RMSE, were also calculated. These criteria allow to judge the quality of the adjustment of the experimental results with respect to the model. They are defined by the following relationships
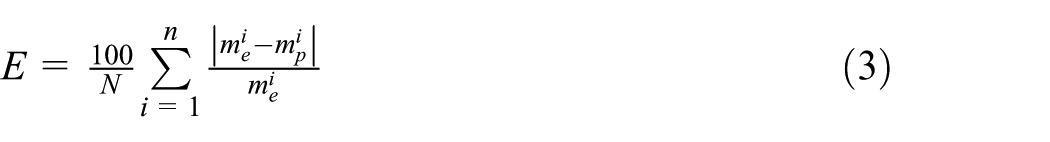
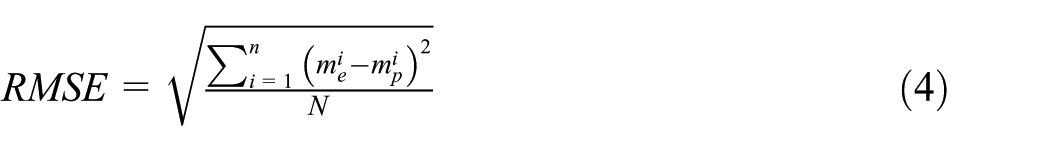
The experimental values noted me and mp are computed by the model and N is the total number of experimental values. The adjustment between the experimental and analytical values is considered correct if the mean relative deviation does not exceed 10%. The adjustment quality is inversely proportional to the E and RMSE values.
MBV
Moisture buffer value (g m−2 %RH−1) was analyzed according to the experimental protocol proposed by the Nordtest project (Rode, 2005). The protocol first requires the mass stabilization of the sample in a climatic room at under 23°C and 50% RH. Then a dynamic cycle of 24 h (16 h at 33% HR, and 8 h at 75%) is imposed to the sample and its mass is weighed five times during the adsorption phase and twice during the desorption phase. The experiment is stopped when the mass variations between three consecutive days are less than 5.
The practical MBV is computed for each sample according to the following formula

where Δm is the moisture uptake/release during the period, A is the exposed area of the specimen, RHhigh is the highest RH, and RHlow is the lowest.
Results and discussion
Porosity analysis
Table 5 summarizes the apparent density of the composites obtained for each formulation. At constant fiber volume, the T fraction leads to a lower bulk density due to the higher porosity of these chips. It should be noted that the L chips give the largest standard deviations. During the drying phase of the composite, a surface disaggregation of the samples was observed mainly for the L-80/20 formulation. This latter formulation undergoes shrinkage strains and swelling (less than 10%). The epidermis, the outer wall of the fiber, is a very smooth surface. This superficial layer is composed of aliphatic lipids which give the epidermis a hydrophobic feature (Leenhouts and Baker, 1982; Holloway et al., 2005). This characteristic may be an impediment to adhesion between the binder and the fiber.
Composite apparent density.
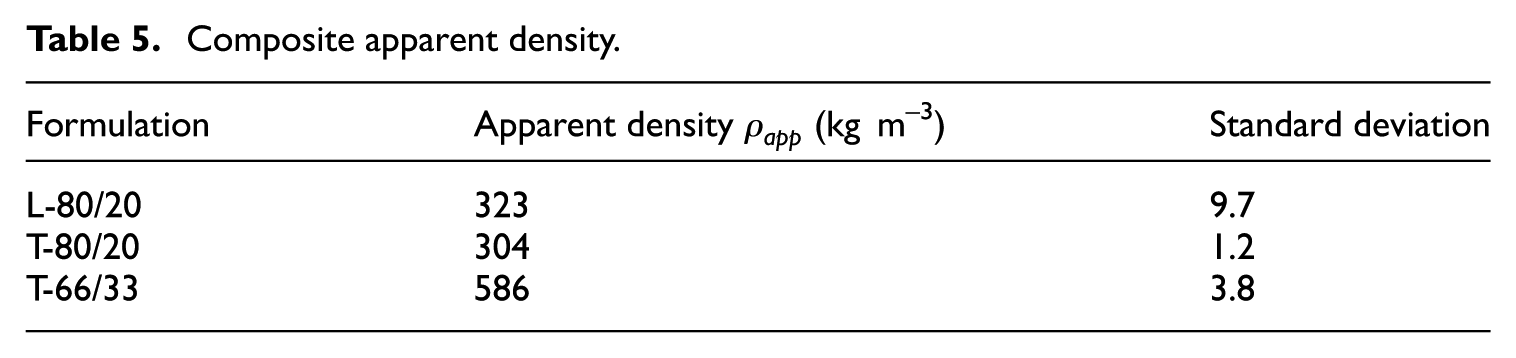
Table 6 shows the porosity analysis results evaluated by mercury porosimetry. The most porous formulation is the material T-80/20 with 62% of total porosity. The less one is the T-66/33 with 52% of total porosity and the L-80/20 is intermediate with 56% of porosity.
Porous properties.
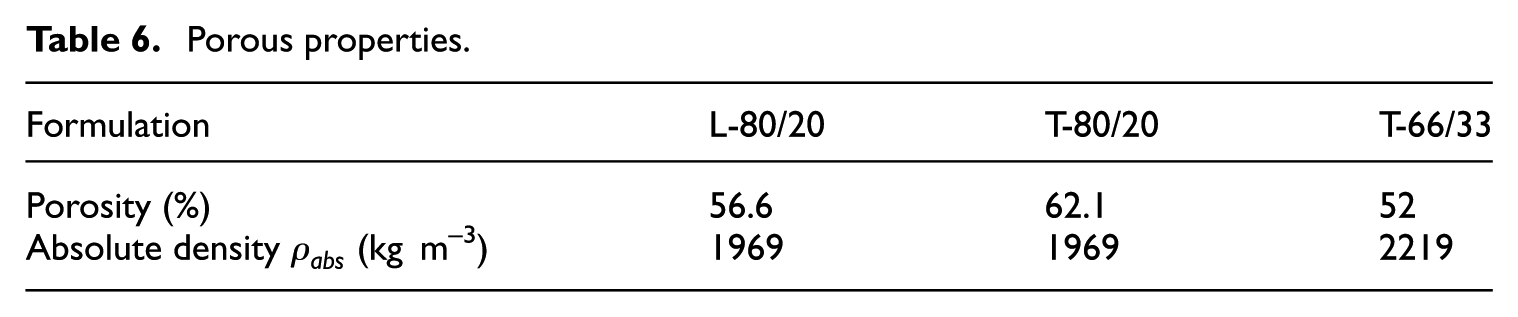
The total porosity depends on the chips type. The transversal fraction of Typha seems to be the most porous. The formulation T-80/20 has a level of porosity of 62.1% while the L-80/20 formulation is about 56.6%. The absolute density of both formulations is the same (1969 kg m−3). Decreasing the amount of Typha (T-66/33 composition) leads to a decrease of the total porosity of the material. The total porosity drops to 52%. The absolute density slightly increases to 2219 kg m−3.
The pore distribution of each composition is depicted in Figure 6. The mesopores amount is entirely due to the morphology of the aggregate. Indeed, the presence of Typha transverse fractions induces more macropores than the longitudinal fractions. These results confirm the hypothesis (see section “Typha”) that a transverse cutting of typha allows to maintain the internal structure of the plant which has a high level of porosity. Conversely, if the fiber production mode originates from a longitudinal fraction, the internal structure is damaged; only the mesopores remain.
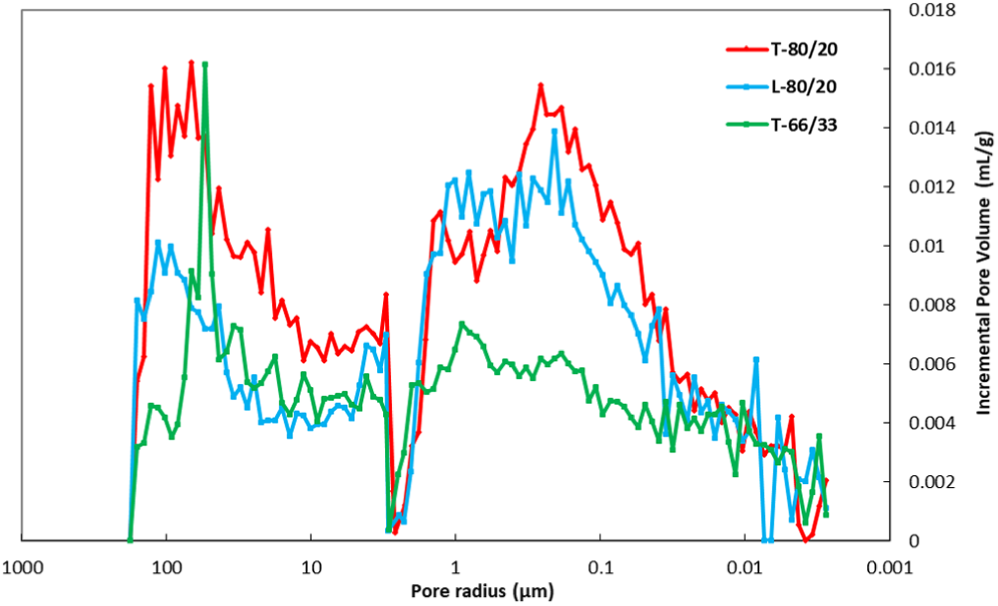
Pore distribution per composition.
A smaller amount of transverse Typha fraction (T-66/33) leads to a decrease in the entire range of access to the pores. In this case, the effect of clay on the pore size is more significant than the Typha fibers. Due to the size of the clay particles (1–4 µm), the pores corresponding to this range size are filled by the binder. The macropores are also affected because of the increased amount of clay soil.
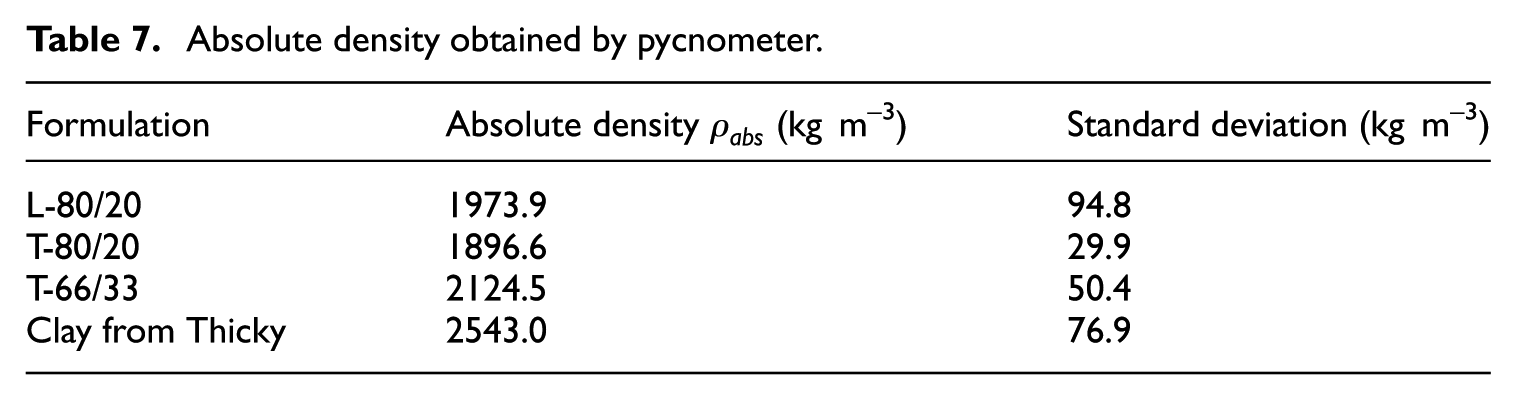
Table 7 recapitulates the absolute density value obtained by pycnometer method. Results are close to those determined by the porosimetry. This confirms that the shape of the Typha fiber has negligible effect on the density of the material. However, the clay/Typha proportion affects the absolute density of the composite.
Absolute density obtained by pycnometer.
Thermal conductivity
Heat flow meter method
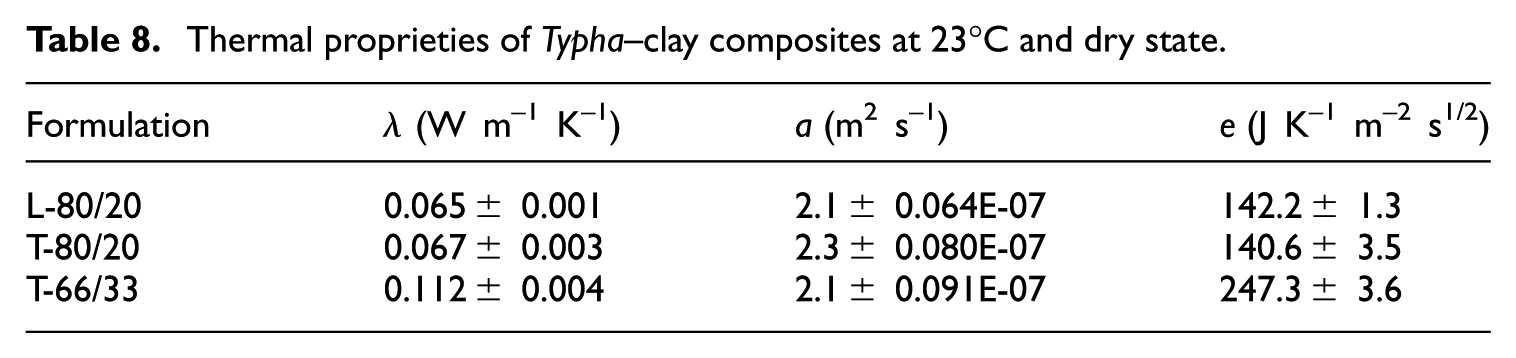
Table 8 presents the thermal properties of each mixture of Typha–clay composite. Results show that the T-80/20 formulation has a slightly higher thermal conductivity λ than the L-80/20 formulation despite a lower apparent density (see section “Porosity analysis”). This is probably due to the experimental conditions. Because of the opened structure of the material surface, the upper plate of the flux meter is not totally in contact with the entire sample surface. Resistances of contacts are thus created, which will partially prevent the propagation of heat in the composite. Hence, other types of experimental methods are needed to ensure the thermal proprieties of these composites.
Thermal proprieties of Typha–clay composites at 23°C and dry state.
The thermal diffusivity (m2 s−1) is a physical quantity which characterizes the transmission rate of a heat flux in a material. It is calculated using the following relation

where λ is the thermal conductivity (W m−1 K−1),
Thermal effusivity (J kg−1 K−1) of a material characterizes its ability to absorb heat, store it, and release it later on. It is defined by the formula

It is also noted that both thermal diffusivity and effusivity mainly depend on the Typha fiber proportion. Their shape impacts the thermal diffusivity. A greater amount of binder increases the material ability to store heat. Indeed, clay has a greater thermal inertia than Typha (Mounir et al., 2015).
The thermal conductivity values of Typha–clay material found in the literature vary from 0.117 to 0.153 W m−1 K−1 for 77%–85% in weight of clay, while thermal effusivity rises from 228.9 to 300 J m−2 °C−1 s−2 (Dieye et al., 2017).
Hot wire method
Figure 7 shows the temperature evolution as a function of logarithm of time. For each composition, the curve slope is determined to calculate the thermal conductivity. The summary (Table 9) shows that the thermal conductivity is proportional to the material apparent density.
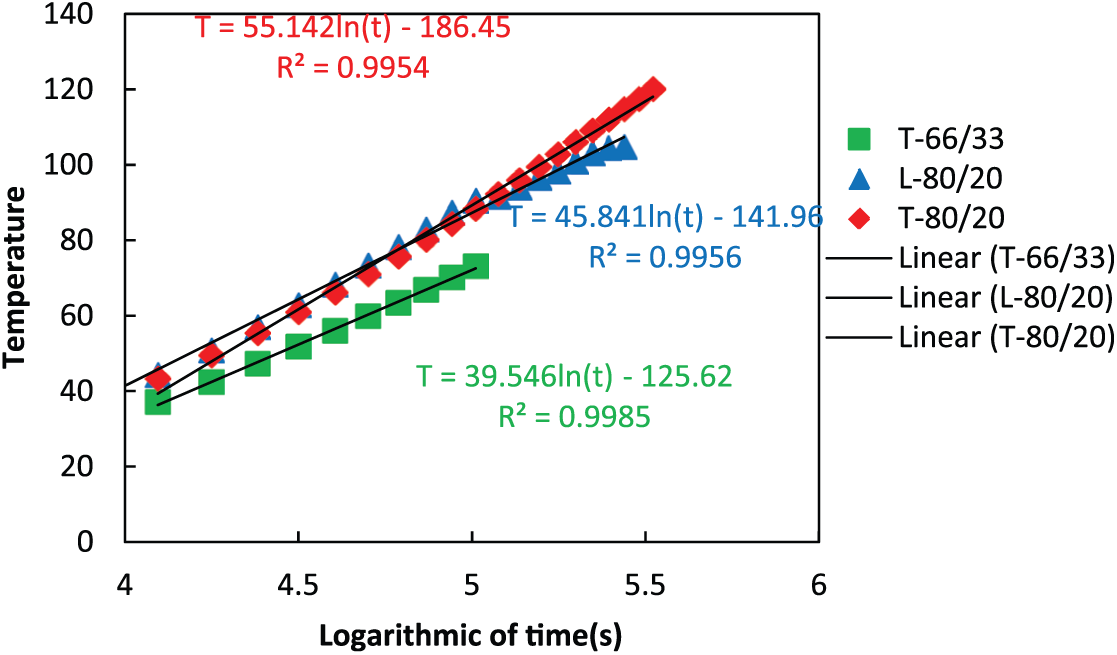
The evolution of the temperature as a function of the logarithm of time.
Thermal proprieties of Typha–clay composites at 23°C and dry state by the hot wire method.
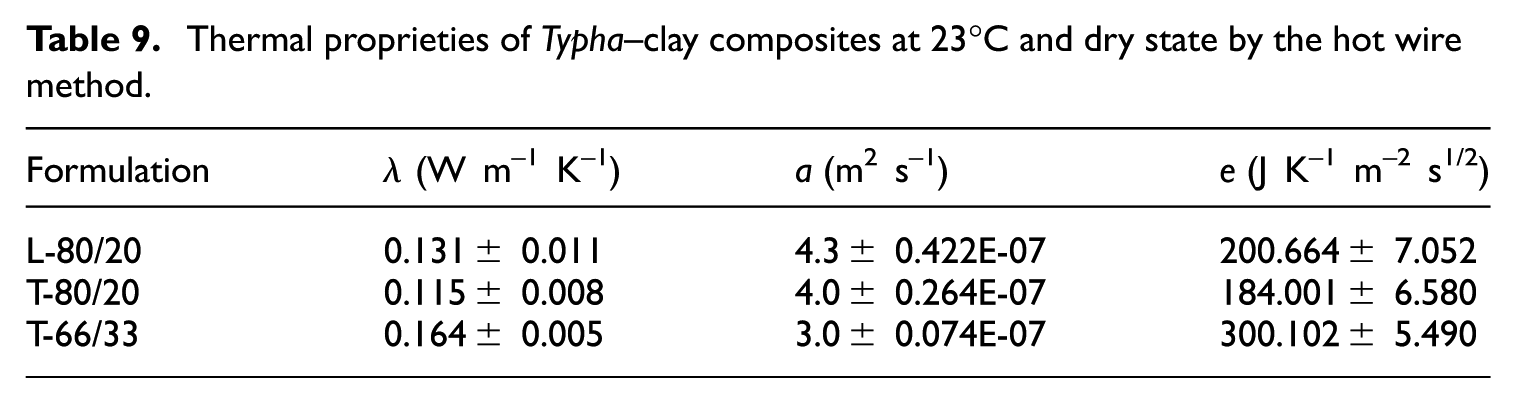
A considerable difference exists between the results obtained by dynamic and static methods. The thermal conductivity measured by the static method is lower, probably because of the difference in test conditions, material thickness, and thermal resistance contact between the plates and the specimen.
Permeability
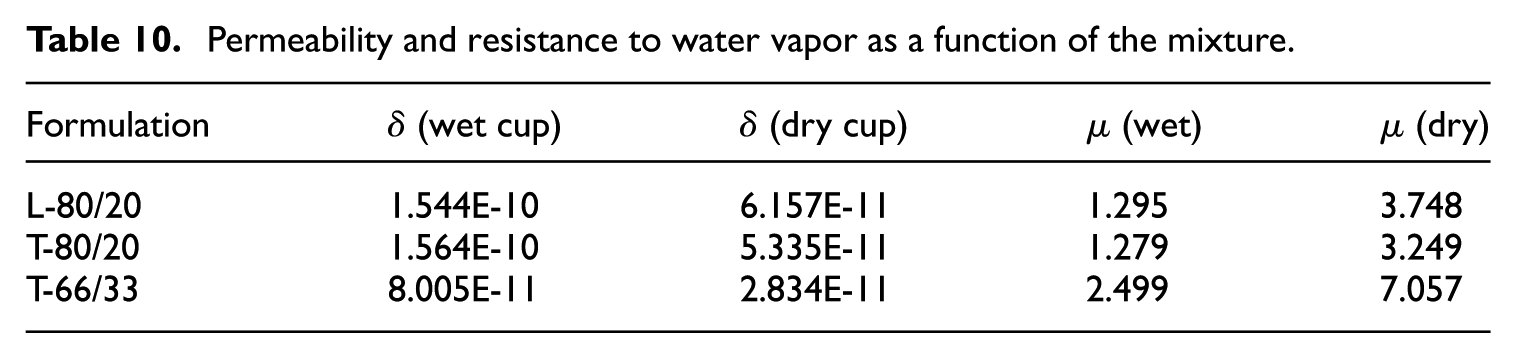
Table 10 recapitulates the water vapor permeability results. There is an important effect of the clay amount on the moisture transfer through the material. Indeed, results show that the water vapor resistance increases when the binder amount is greater (T-66/33). The difference in permeability level between these two mixtures resides in the fact that the T-80/20 composition contains a larger amount of macropores than in the L-80/20 composition.
Permeability and resistance to water vapor as a function of the mixture.
Sorption isotherm
Figure 8(a) shows the average adsorption curves of different samples from the three formulations tested. The shape of the curves obtained can be assimilated to a type 2 sigmoid according to the theory of Brunauer, Emmett, and Teller (BET). According to the IUPA classification (Sing et al., 1985), this is a typical behavior of cellulosic materials (Celino et al., 2014; Park, 1986). Results show that the ratio between water content and RH is a non-linear function. For example, the water content reaches 4% while RH is less than 60% for the T-80/20 formulation. For greater RH, the water content reaches 12.9%. The Typha amount has an effect on water adsorption of the composite. The Typha chips from a transverse cut of the plant increase the material water content. This can be explained by the porosity level (large quantity of mesopores), which enhances the adsorption and capillary condensation in the material (Gourlay et al., 2017). However, a greater clay amount (T-66/33 formulation) slows down the adsorption phenomenon.
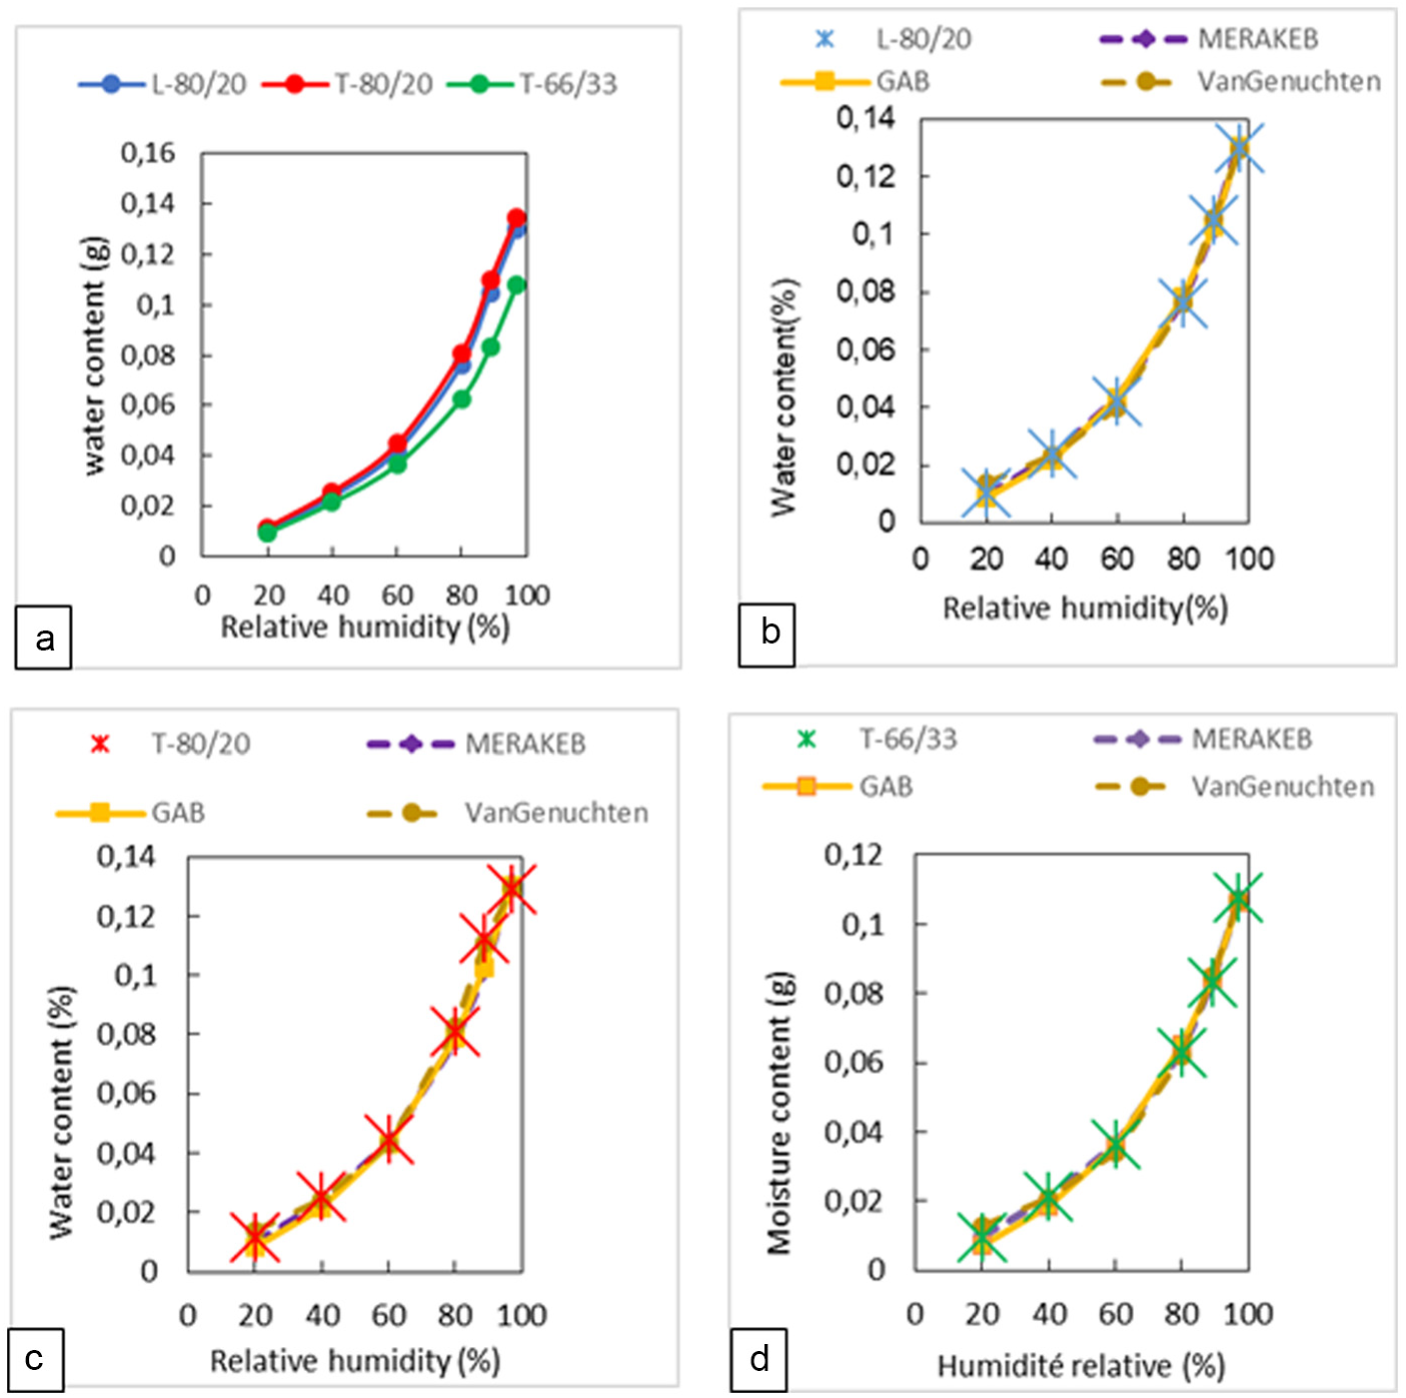
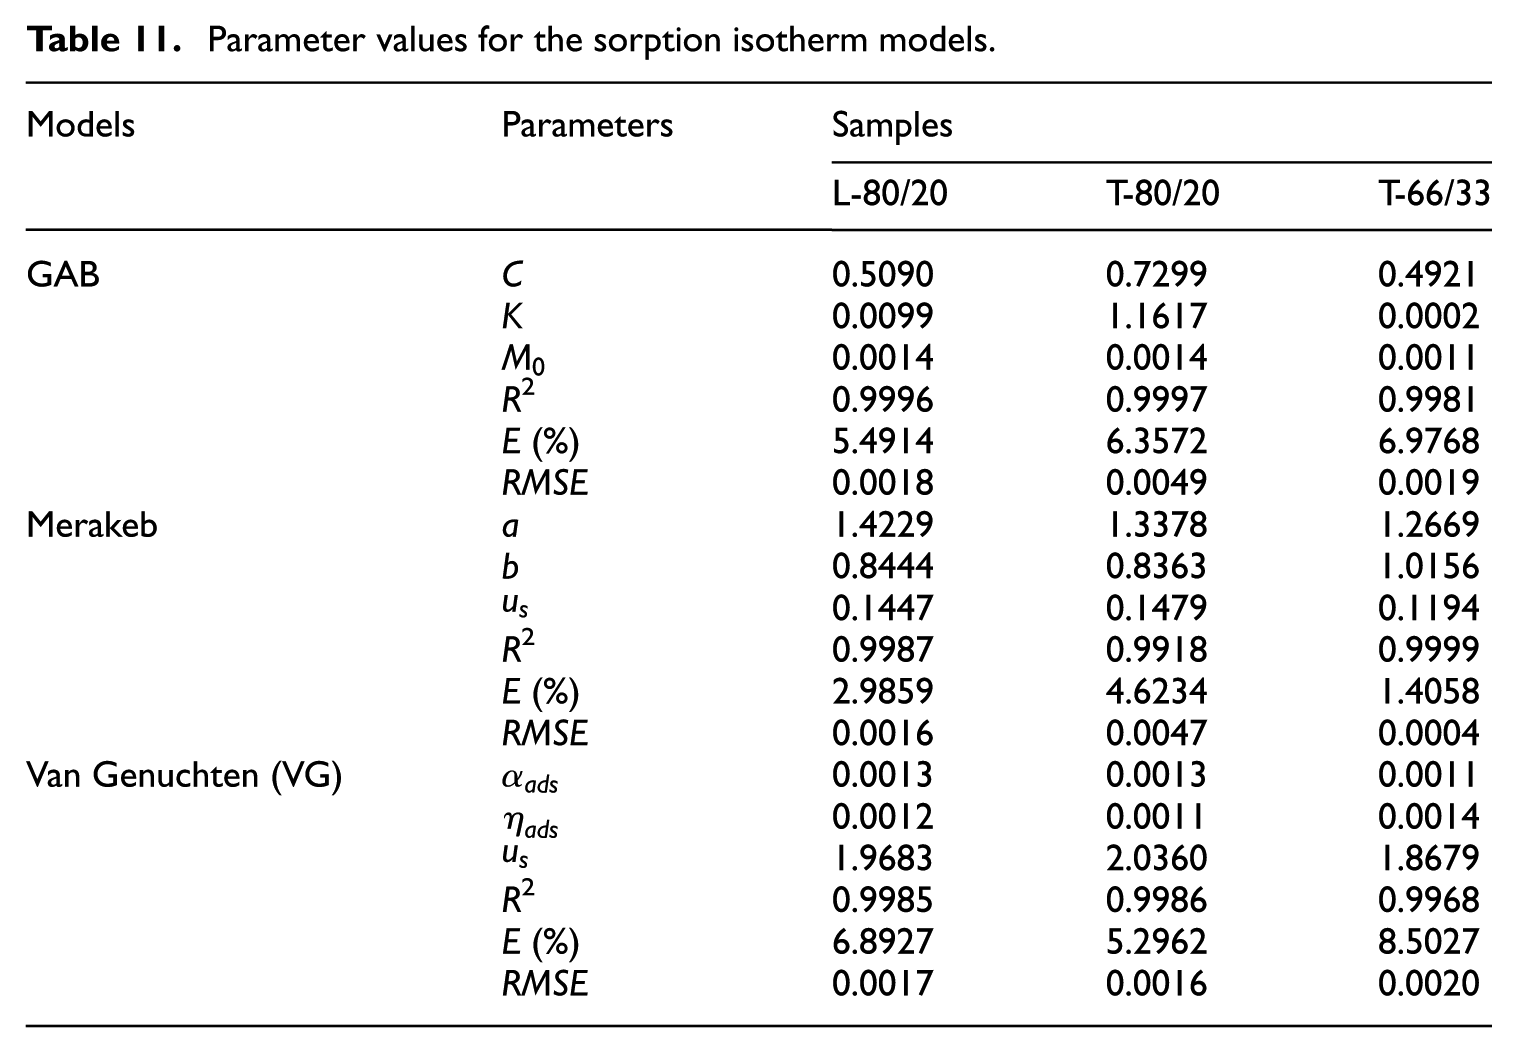
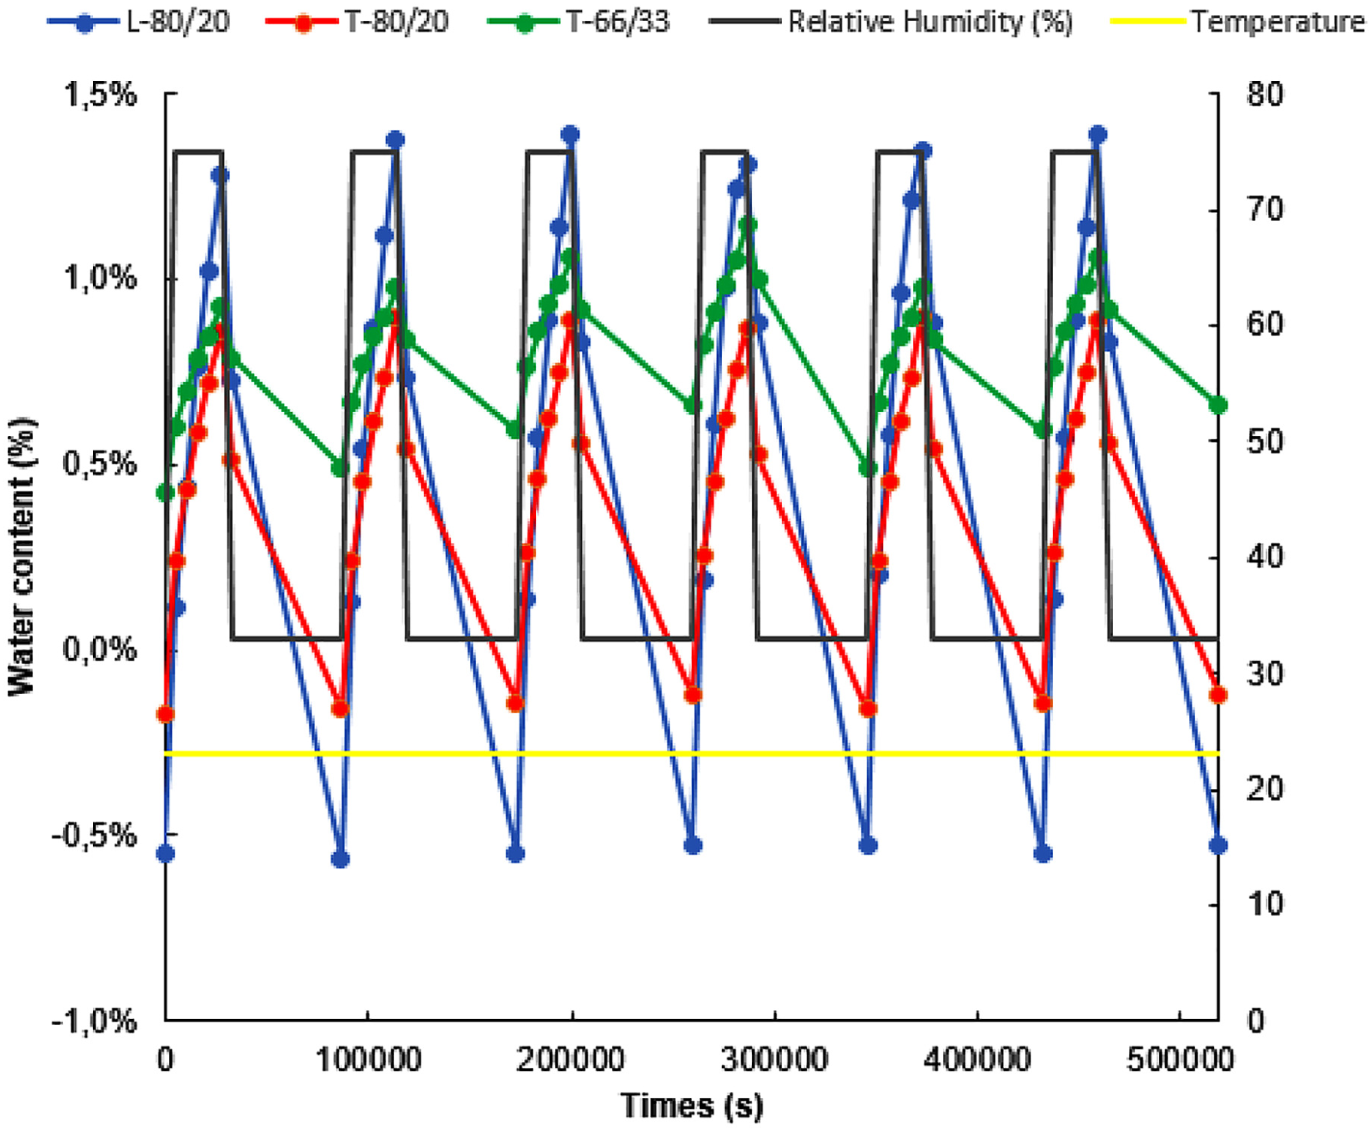
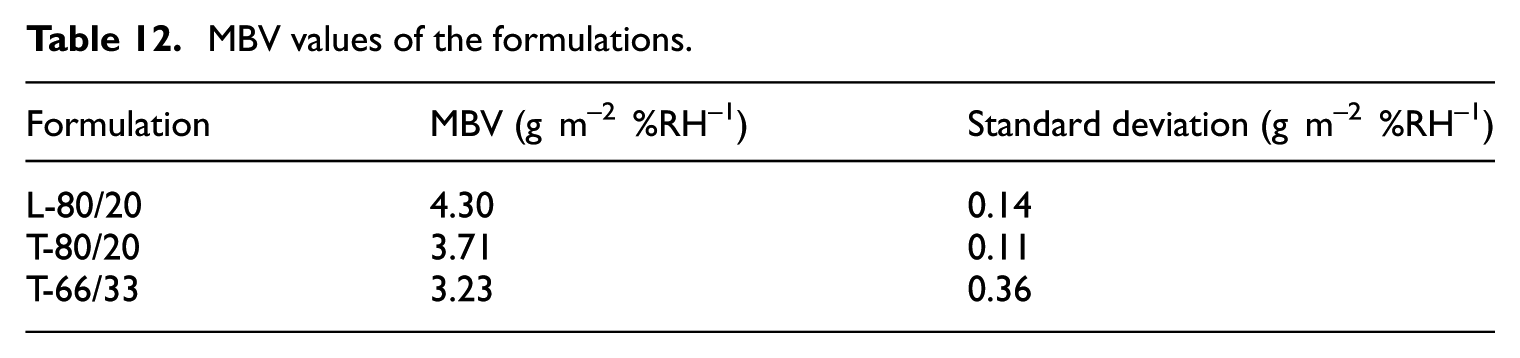
(a) Adsorption isotherms of Typha–clay materials and (b) comparison of the adsorption isotherms of the experimental data and the models of GAB. Merakeb and Van Genuchten for the three mixtures: L-80/20, (c) T-80/20, and (d) T-66/33.
Figure 8(b) to (d) shows the fitting of the experimental values according to GAB, Merakeb, and Van Genuchten models. Among these models, the Van Genuchten seems to be the one that least close to the experimental values for the humidity ranges from 20% to 60% HR.
The model parameters used to fit the sorption isotherm at 23°C of each formulation are given in Table 11. Since the standard deviations are low, these models allow to conjecture on the level of absorption of composites as a function of RH. Indeed, the E values are less than 10 and the correlation coefficients are close to 1. Therefore, these models are considered appropriate (Ayranci and Duman, 2005).
Parameter values for the sorption isotherm models.
MBV
Figure 9 shows the water content evolution in the composite during three cycles of variation of RH at isothermal conditions. The L-80/20 composition has the greater amplitude of uptaking and rejecting water content. That is to say that its sensitivity to ambient humidity is the most important of the three mixtures.
Mass monitoring during MBV test.
Table 12 shows the MBV, values are ranged from 3.24 to 5.08 g m−2 %RH−1. According to Rode’s (2005) classification, Typha–clay agromaterial can be classified as an excellent moisture regulator (MBV > 2 g m−2 %RH−1). Measurements show that at equivalent binder dosage, samples having chips from transverse cut present a lower MBV (3.75 g m−2 %RH−1) compared to those made by Typha fibers from longitudinal cut (5.08 g m−2 %RH−1). This could be explained by the porous structure of the longitudinal Typha fibers mainly composed of mesopores which are able to adsorb and desorb water more than macropores presented in transversal fraction. It should also be noted that for the same type of aggregate, an amount of additional binder amount leads to a decrease in the capacity of the moisture regulator material from 3.75 to 3. 24 g m−2 %RH−1.
MBV values of the formulations.
Conclusion
In this article, results concerning hygrothermal behavior of a composite based on Typha Australis reeds and clay soil are presented. Three mixtures were studied, two of which with the same percentage by volume (80%) of Typha fiber but whose cutting type differed (L-80/20: longitudinal cut, T-80/20: transverse cut). The third mixture is composed of 66% of Typha fibers by volume from a transverse cut (T-66/33).
Thermal conductivity of the mixtures was measured and thermal inertia (diffusivity and thermal effusivity) was computed. The samples from L-80/20 formulation present higher thermal conductivity (0.131 ± 0.011 W m−1 K−1) than the ones from T-80/20 formulation which varies between 0.115 ± 0.008 W m−1 K−1.
The transverse fraction of Typha enhances the water vapor transfer by 13% and increased the moisture storage in the material. By contrast, a 14% increase in clay binder volume slowed moisture transfer by up to 90% and reduced storage capacity. Finally, the results show that these materials are excellent moisture regulators due to their moisture capacity values which are higher than 2 g m−2 %RH−1.
Footnotes
Acknowledgements
The authors would like to acknowledge PNEEB/TYPHA project (Dakar, Senegal) for logistical and financial support; CRATerre (International Center for Earthen Construction, Grenoble, France) for their technical support and their production of the samples; Philippe Munoz (Arago Research and Development Center, Reims, France) for technical advice; AARMBN (Architectural and Research Agency Mbacké Niang, Dakar, Senegal) for financial support and technical advice; Bernard Boyeux (BIOBUILD Concept, Montacher Villegardin, France) for technical advice; Jean-François Henry and Hamze Karaky (GRESPI/Thermomécanique, University of Reims Champagne) for their technical support.
Declaration of conflicting interests
The author(s) declared no potential conflicts of interest with respect to the research, authorship, and/or publication of this article.
Funding
The author(s) received no financial support for the research, authorship, and/or publication of this article.