
Abstract
This contribution presents temperature and relative humidity data monitored over nearly two years for a case study building made of natural building materials. The case study building is a single-family house located in Denmark made of wood fiber insulation, wood fiber boards and indoor clay plaster without any membranes. Three different types of cladding systems have been tested: 1) mineral plaster rendering; 2) wood cladding applied directly over wood fiberboards; 3) wood cladding with a ventilated cavity. Monitored data is provided and compared with simulations performed with a commercial hygrothermal software. The moisture content and mold growth index are calculated from monitored data. The data indicates that the hygrothermal performance of the roof is excellent (RH < 70%); the hygrothermal performance of the walls with the three different cladding systems is good; one out of two sensor groups in the floor exhibits a moisture content up to 18% at the cold side of the insulation during summer and fall. Securing sufficient and evenly distributed crawlspace ventilation is recommended for eliminating concerns of eventual mold growth. Measurements show that materials employed in this house respond quickly to moisture changes, more quickly that simulated data. This work highlights the need for validating and adjusting WUFI simulation results with measured data to provide reliable results for building envelopes composed of highly hygroscopic plant-based materials. For these assemblies in these conditions, including a vapor retarder is not needed for achieving a satisfactory hygrothermal behavior.
Introduction
The building envelopes used today have significantly evolved over the last 100 years, from simple, uninsulated structures with a choice of a few materials (masonry, wood, stone, steel, lime, clay, organic fibers, and concrete) to layered insulated structures with numerous possible materials and combinations, enabling the improvement of the energy efficiency and comfort of buildings.
With these new possibilities, the industry is facing an overwhelming number of possibilities of material/construction choices. Many have the perception that heavily insulated envelopes face increased risks of moisture-related problems but we now know that if the only change is a thicker insulation layer, that does not necessarily correlate with increased moisture in the construction (Morelli et al., 2017). Retrofitting existing buildings with added insulation is challenging and must be well planned and executed; many publications are addressing this specific case Lisitano et al., 2021; Smegal and Lstiburek, 2013; Sørensen et al., 2021). Preventing moisture-related problems has been dealt with technically, practically and within building codes, where for the last 40–50 years vapor barriers were regarded as a key element essential for preventing moisture related problems in many countries. While it is known that air leakage is a much larger source of moisture, air tightness is often overlooked, with some countries like Canada still having no enforceable airtightness requirements as of 2022.
Today’s construction practices have not solved all moisture-related problems. We still hear about costly building damages caused by moisture and resulting mold (Douglas, 2009; Kielsgaard Hansen et al., 2016; Waldron, 1999). This happens despite today’s focus on damp-tightness, the use of vapor barriers and very often non enforceable air tightness goals motivated only by energy efficiency. At the same time, today’s construction practices do not encourage the use of organic building materials, since organic materials can indeed support mold growth and are thus often presented as more risky by manufacturers of inorganic building materials. Nevertheless, a subset of the building industry retains as common practice to construct building envelopes with natural and organic materials that are permeable to water vapor that have good drying potential.
Experience shows that natural building materials can be durable: the oldest known existing straw bale building is a house built in 1903 in Nebraska, United States (King, 2006). Natural building materials typically have lower environmental impacts than synthetic materials (Bribián et al., 2011; Melià et al., 2014; Salazar and Meil, 2009).
With an increasing current focus on decarbonization, natural building materials can store carbon matter for a very long time. Besides, they are often touted as a preferable option for improving Indoor Air Quality (IAQ) (Feigin and Magwood, 2013), but often these claims are not accompanied with empirical evidence (Cheng et al., 2020; Friar and Vittori, 2017; RealDania, 2019; Steinemann et al., 2017). It was shown that building materials labeled as “green” emit fewer volatile organic compounds (VOCs) than conventional materials (Cheng et al., 2015). An eventual IAQ improvement from natural materials may come in two ways: first, some natural material may emit less VOCs and other chemicals than their conventional counterpart; second, they may also absorb/adsorb chemicals. Clay and titanium oxide in particular have shown their capability of absorbing/adsorbing some chemicals and effectively improving the IAQ (Kibanova et al., 2009; Pinto and Silva, 2017; Ryhl-Svendsen, 2011). Our own research in twin test huts allowed us to collect data providing evidence that natural building materials can contribute to improve the IAQ, which ultimately contribute to improve human health. Indeed, when omitting a vapor barrier, not only water vapor but also other gases are able to diffuse through the building envelope, resulting in lower indoor concentrations for some substances. For buildings that operate with high ventilation rates, any potential IAQ improvement from building materials will be small (Niemelä et al., 2017), but for the many buildings that lack sufficient ventilation flow rates (Bekö et al., 2010), a significant IAQ improvement is possible.
By potentially improving IAQ and reducing environmental impacts, a greater use of natural building materials could be advantageous for both building occupants and the society in general. With many building codes recommending or mandating the use of a vapor barrier, it becomes often necessary to perform detailed hygrothermal simulations if a vapor barrier is not incorporated in a building assembly. This paper reports measured data over 21 months and hygrothermal simulations of a case study home made of a vapor permeable building envelope constructed of wood insulation and clay plaster, which may be helpful for understanding the hygrothermal behavior of similar building constructions in cold climates.
Hygrothermal conditions inside the building and its assemblies are simulated with WUFI® Plus 3.2.0.1, a whole energy simulation software that enables the calculation of coupled heat and moisture transfer. This tool has been validated through many studies (Antretter et al., 2011; Kunzel, 2005; Lengsfeld and Holm, 2007). This advanced commercially available software for hygrothermal simulation underwent several comprehensive validation tests (Straube and Schumacher, 2006). Compared to the EnergyPlus HAMT model, WUFI Pro was shown to provide a closer fit to measurements, especially when reducing the coarseness of the discretization (Barclay et al., 2014). Compared to other simulation software that have the capability of performing hygrothermal simulations like DELPHIN, hygIRC, and COMSOL, WUFI yielded consistent results and could be used for comparing the impact of different designs on building performance and for evaluating the relative changes in performance of walls subjected to changing climate (Defo et al., 2022). Hygrothermal performance simulations are dependent on inputs, and their datasets come with uncertainty (Defo et al., 2022). For instance, in regard to porous materials, the density, porosity, and specific heat could vary by 10% on average, and the moisture capacity, thermal conductivity, and vapor permeability could vary by 20% or more from different databases (Defo et al., 2022). The moisture and heat flow rate of a single layer wall fluctuated by approximately 10–40% (Yamamoto and Takada, 2022). A study of strawbales in a climatic chamber under steady conditions report that a long test duration is necessary (>15 days) in order to achieve equilibrium and highlight the fact that measuring the hygrothermal properties of natural and non-homogenous materials such as strawbale is challenging (Mesa and Arenghi, 2019).
In situ monitoring of hygrothermal parameters of buildings is a more direct approach which eliminates the influence of uncertainties in data sources, but the uncertainty that comes from measurements must be considered. In fact, for many research activities, combining measured and simulated data is a preferred approach (Fedorik et al., 2021; Wang and Ge, 2017). Measured data can be used to validate the accuracy of simulated results while the simulations can provide additional information which cannot be obtained from measurements.
The goal of this paper is to report the hygrothermal performance of a single-family home case study located in Denmark and built with a vapor permeable building assembly made of wood fiber insulation and indoor clay plaster. The hygrothermal conditions have been monitored for more than 2 years. A total of 31 temperature and relative humidity (T/RH) sensors have been installed in groups of three or four at various depths at five locations in walls, two locations in the roof and two locations in the floor. Detailed hygrothermal simulations have been performed with monitored weather data with a commercial hygrothermal software (WUFI Plus). Monitored and simulated data are compared and used for calculating the mold index and evaluating the durability of this case study building.
Methodology
Description of case study building
The case study building is a one-storey 187 m2 single-family wood frame house located in Holbæk, near Copenhagen, in Denmark. The wall, floor and roof assemblies are presented in Figures 1 to 3 with their material properties provided in Table 1. The material properties of boards and the water vapor diffusion factor of the mineral cement plaster were obtained from manufacturer data sheets Properties of the blown woodfiber, clay boards and clay plaster were determined experimentally by tests performed at the Fraunhofer Institute. Properties of other materials (wooden planks, pine boards) were determined from similar materials in the WUFI material database.
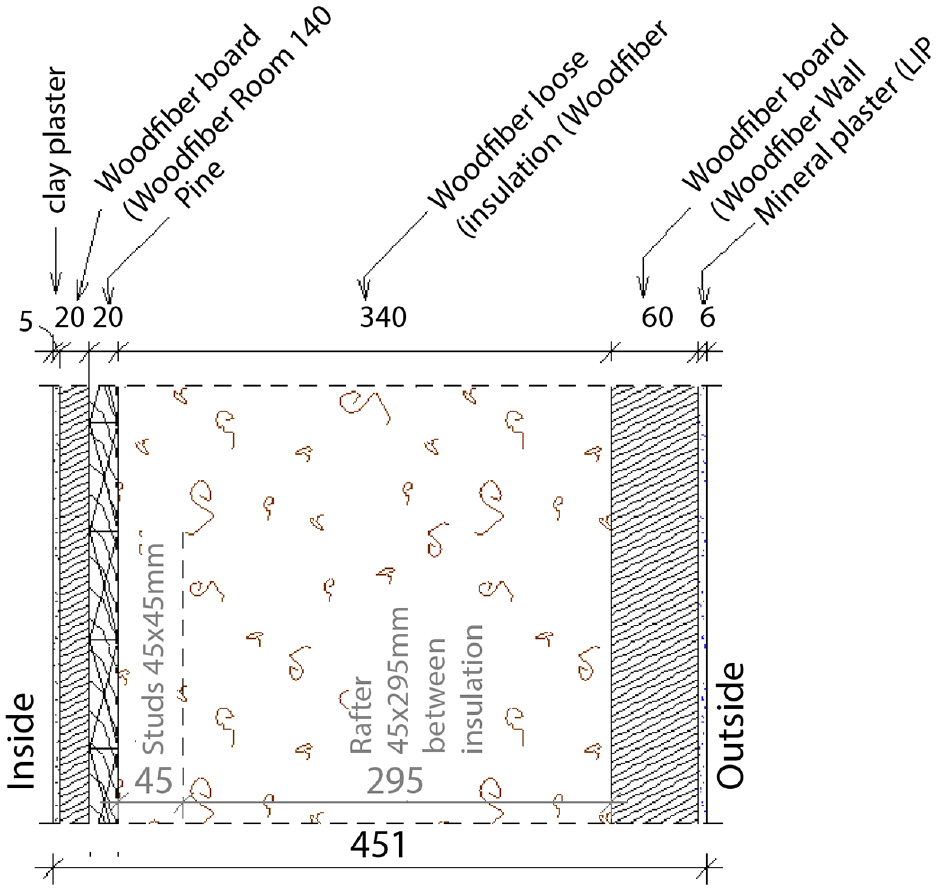
Typical wall assembly of the case study building. Dimensions in mm.
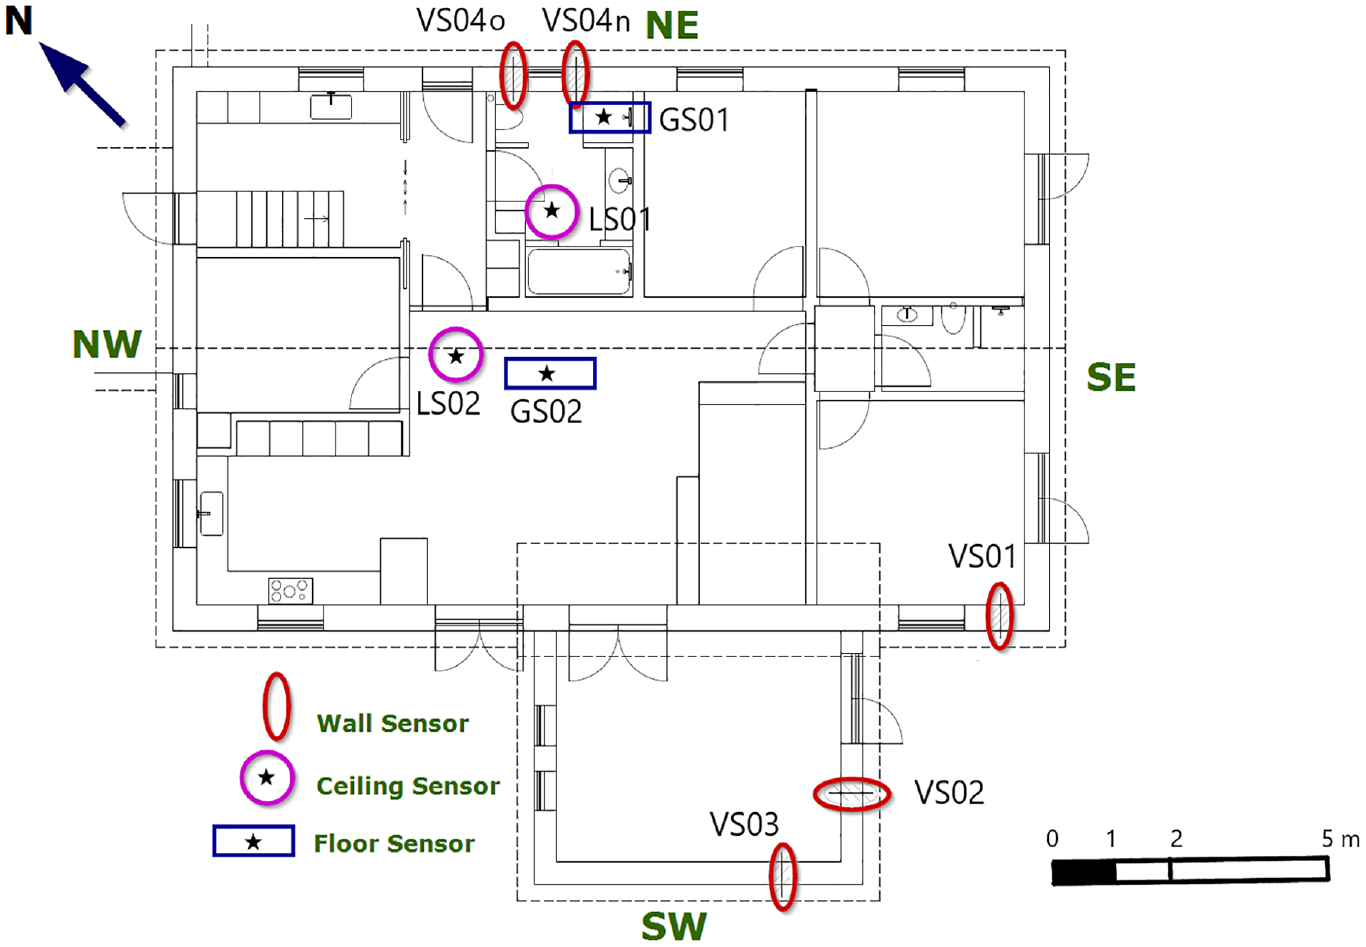
Floor plan indicating location of T/RH sensors. The living room where VSO2 and VSO3 sensors are installed is modelled as one zone and the rest of the building as a second zone.
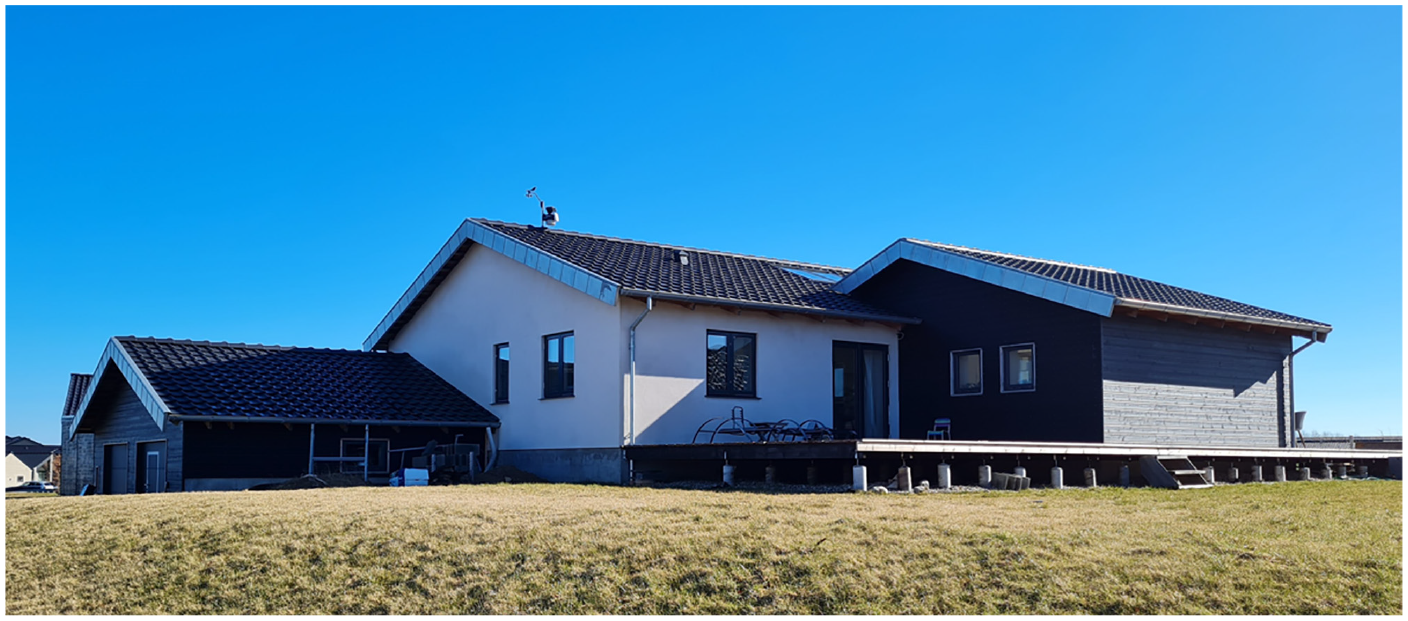
The case study building seen from west. The weather station can be seen on the roof top.
Material properties.
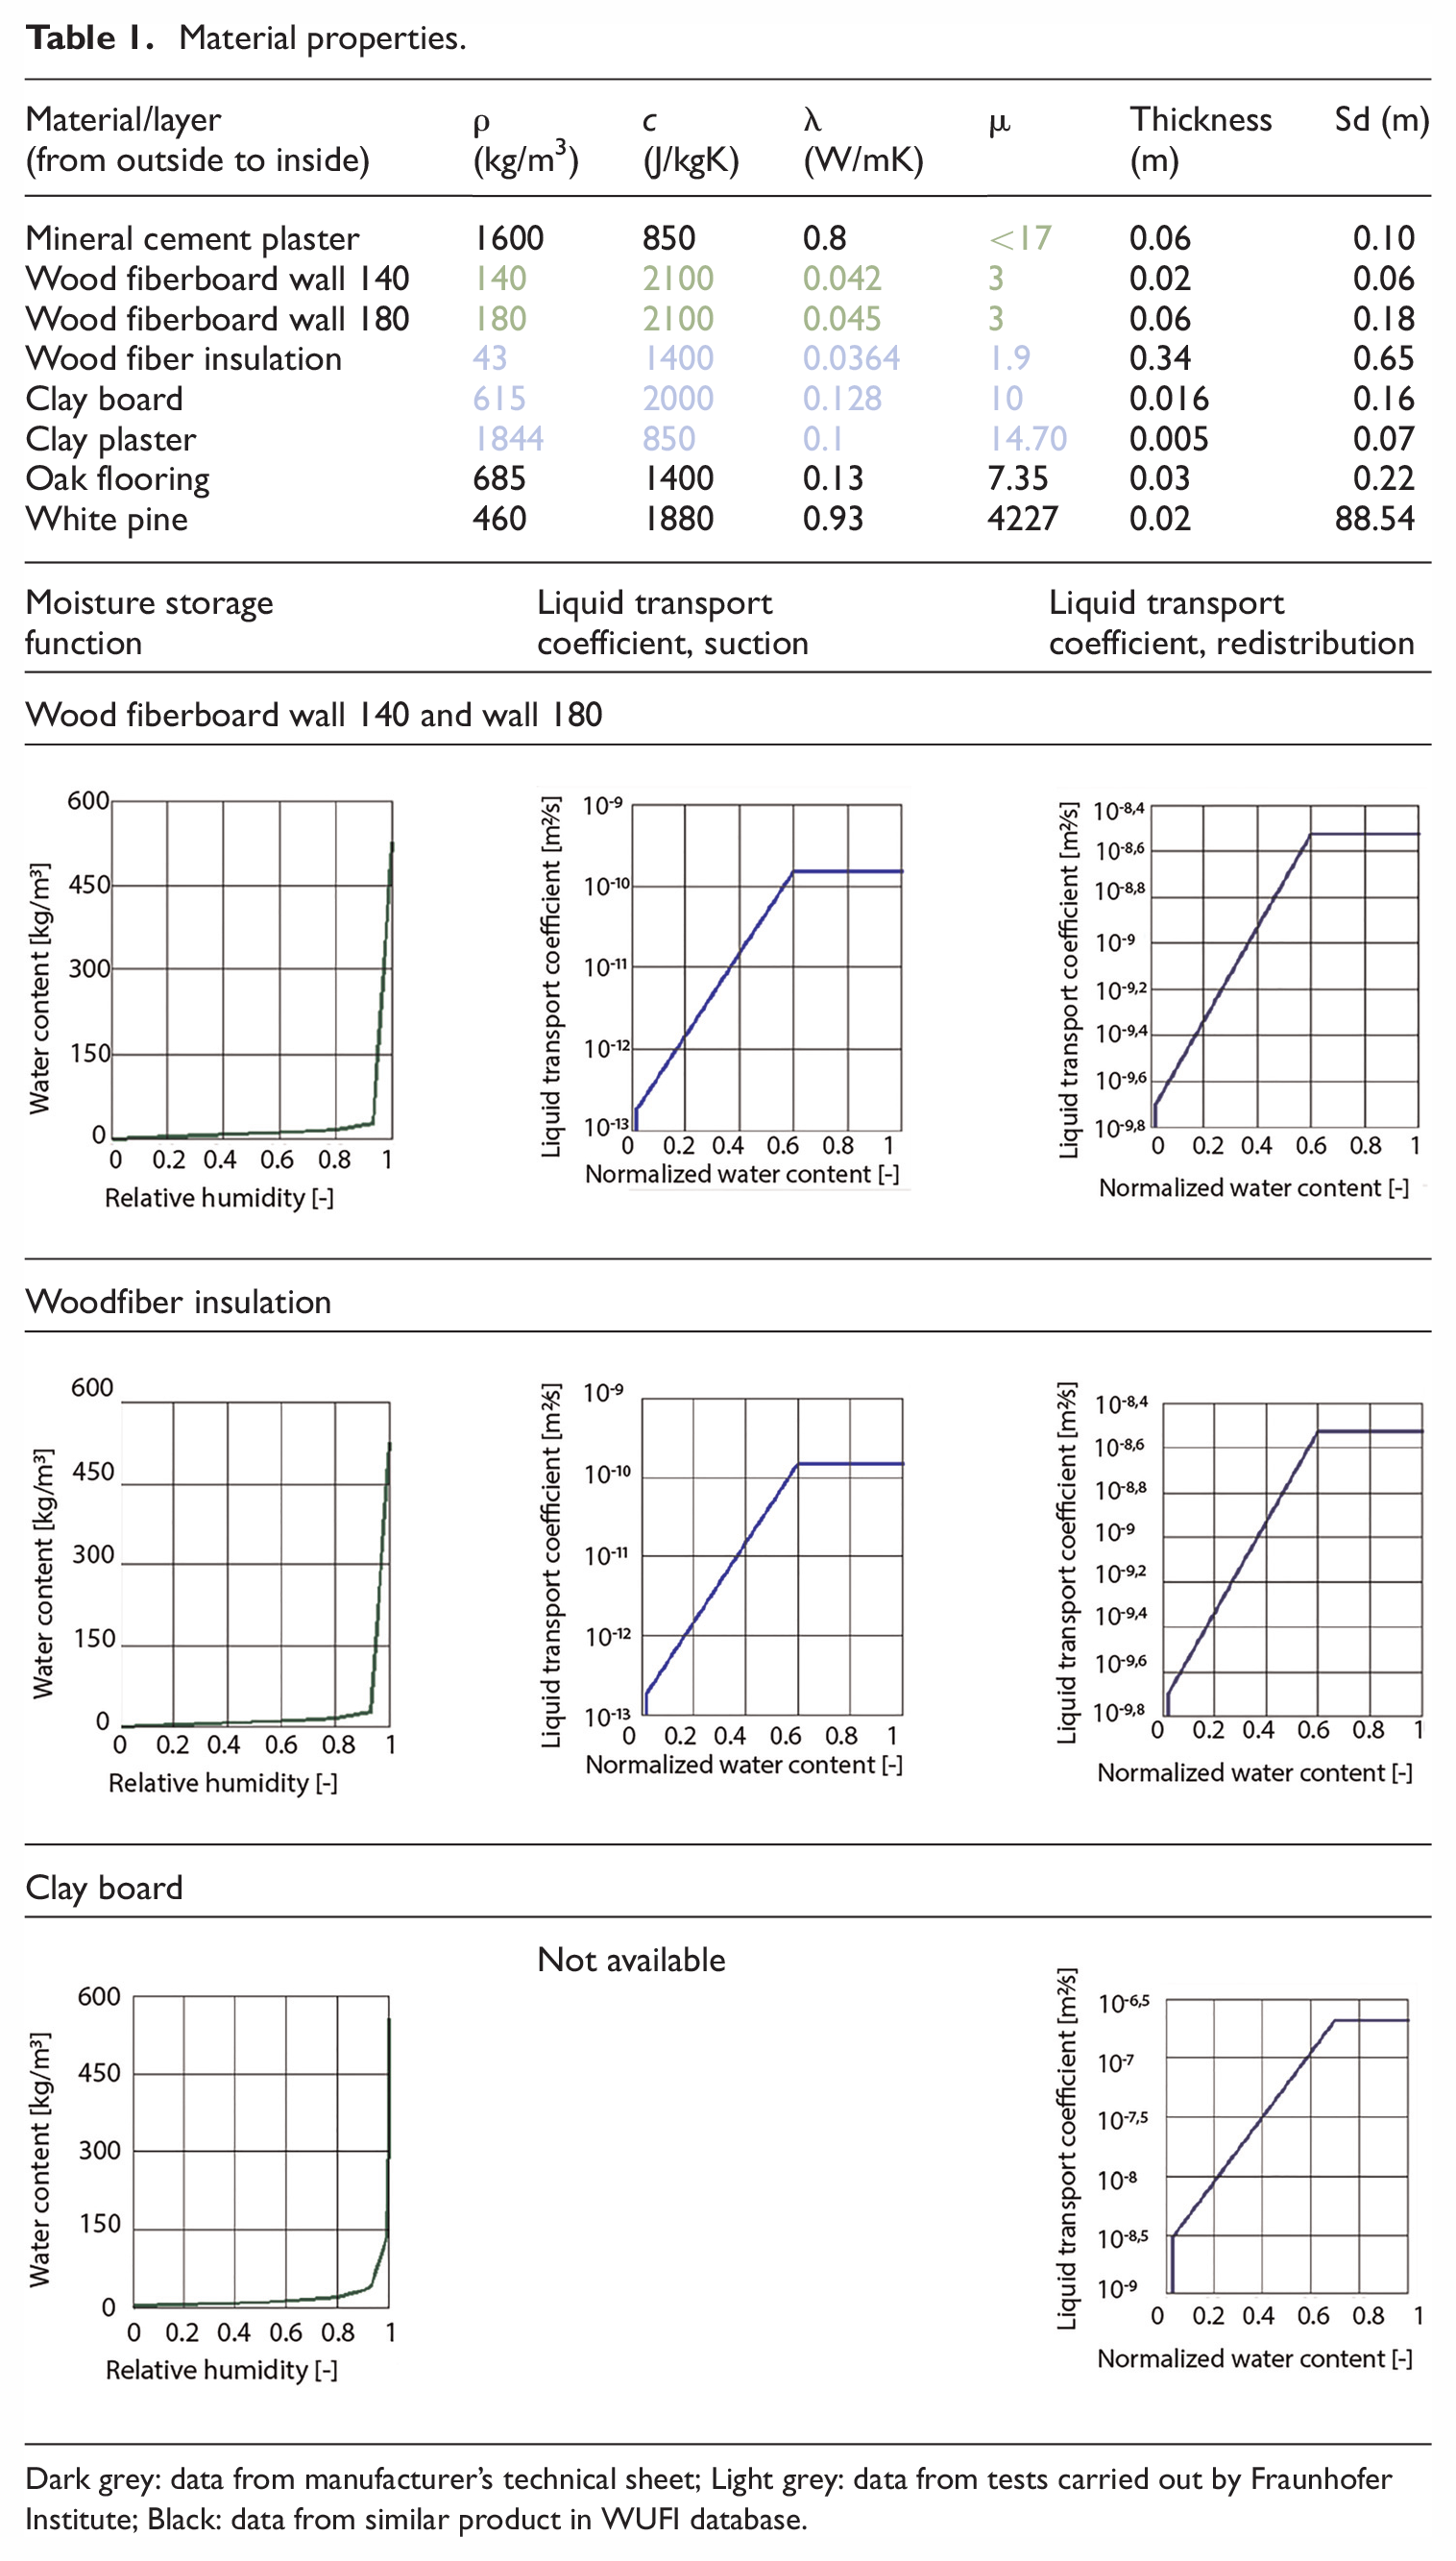
Dark grey: data from manufacturer’s technical sheet; Light grey: data from tests carried out by Fraunhofer Institute; Black: data from similar product in WUFI database.
Different variations of the wall assemblies were tested. Bedrooms were designed with a 16 mm clay board while other rooms were designed with a 20 mm woodfiber board, both of which were covered by two layer of clay plaster. Three different types of exterior wall cladding were tested: 1) mineral plaster; 2) wood cladding directly applied over the exterior woodfiber boards; 3) wood cladding with 25 mm air space/vertical framing members. The exterior woodfiber board can handle small amounts of water that could eventually leak behind the exterior wood cladding. The exterior pine wood cladding was painted with an acrylic paint for which a coating with a permeability of 10 perms (868 ng/(sm2Pa)) was assumed in the simulations. From outside to inside, the walls are made of exterior finish, external wood fiberboard, wood fiber insulation, pine planks, wood or clay boards and clay plaster. Some walls are finished on the outside with a mineral plaster directly applied over the exterior wood fiberboard (sensor groups VSO1 and VSO4) while other walls are finished with wood cladding, either directly installed on the exterior wood fiberboards (VSO2) or over battens creating a ventilated air gap (VSO3). The nominal U-values of the exterior walls, ceiling and floor are 0.09 W/(m2K), 0.07 W/(m2K) and 0.11 W/(m2K) respectively.
The wooden floor structure that sits over the concrete footings is slightly above ground level, over a ventilated crawl space. It is made of 300 mm of wood fiber insulation sandwiched between a wood fiberboard and a pine subfloor with oak flooring on top (c.f. Figure 5). The crawl space is naturally ventilated with passive vents in the foundation walls. The roof construction is made of a clay plaster ceiling applied over clay boards on pine planks and approximately 650 mm of wood fiber insulation installed in a ventilated attic with wooden truss construction and ceramic tiles on top of the roof.
The windows have a double-glazed insulated glass unit (IGU) in pine frame and an additional single pane on the inside, with a glass G-value of 0.55 and an overall U-value of 0.77 W/(m2K). These windows have the possibility to provide preheated fresh air by allowing air through openings in the window sill to flow between the single pane and the IGU and enter the room through an opening at the window head jamb. A detailed description of these ventilated windows and their performance is provided in (Bastien, 2019).
Experimental monitoring equipment
The floor plan and location of sensors are provided in Figure 2 and all the relevant details characterizing the assemblies of the nine sensor groups are presented in Table 2.
Complete description of wall, floor, and roof assemblies of the nine sensor groups.
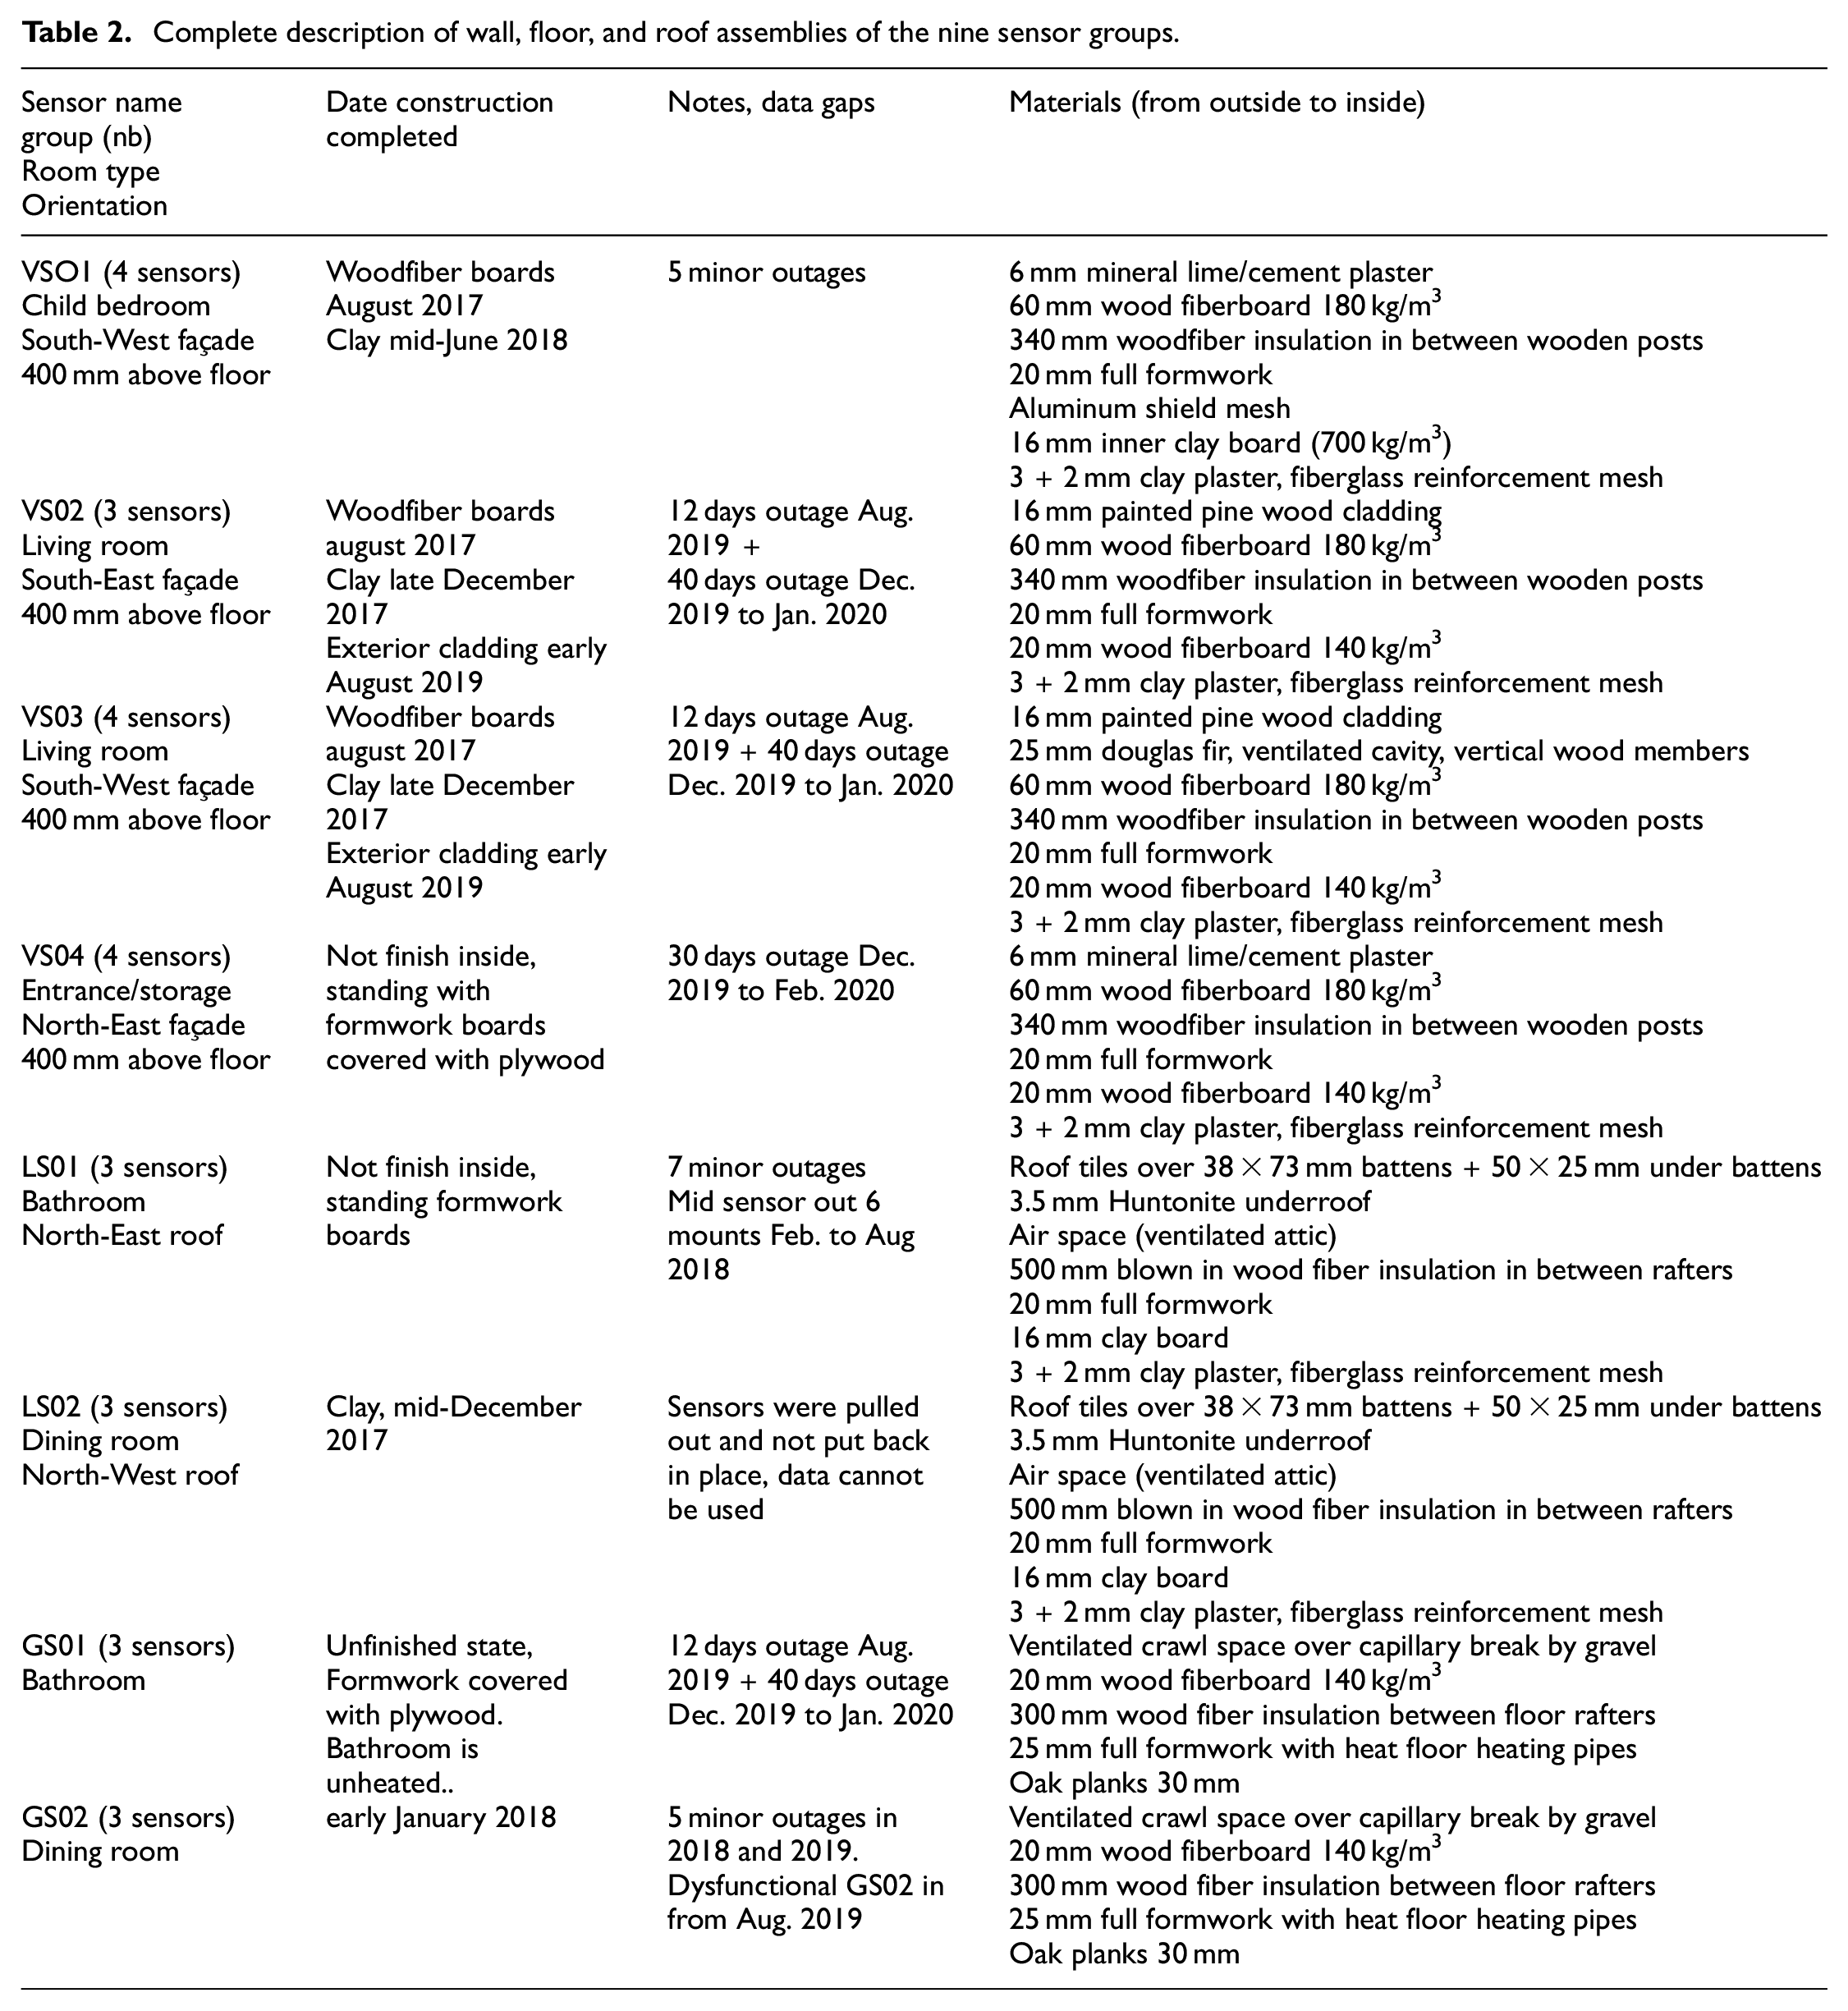
The data acquired with the wall, floor and ceiling sensors were exported for processing, generating a heavy file with more than 80,000 lines of data-points for the years 2019 and 2020, with irregular readings every 1 or 2 min, but also with gaps, erroneous or missing data-points. This data was condensed to precisely one dataset per hour, resulting in a dataset of 8760 data points per year.
Hourly temperature and relative humidity readings were obtained by averaging the minute-readings. In cases where data were missing for less than 6 h, the gap was filled with interpolated data. For larger data-gaps, a value of 0 was assigned.
The positions of the T/RH sensors in the walls, floor and roof are shown on Figures 4 and 5. All nine groups of sensors have a sensor approximately 10 mm behind the external face of the external wood fiberboard and a sensor 10 mm behind the internal face of the blown-in wood fiber insulation. For VSO2, a third sensor is installed 138 mm behind the external face of the blown-in wood fiber insulation. For VSO1, VSO3 and VSO4n, a third and fourth sensors are installed 75 mm and 200 mm behind the external face of the wood fiber insulation. For the floor, the sensors are embedded in the blown-in wood fiber at 16, 136 and 286 mm above the top face of the wood fiber board. In the ceilings, sensors were installed 60, 360 and 636 mm below the top of the wood fiber.
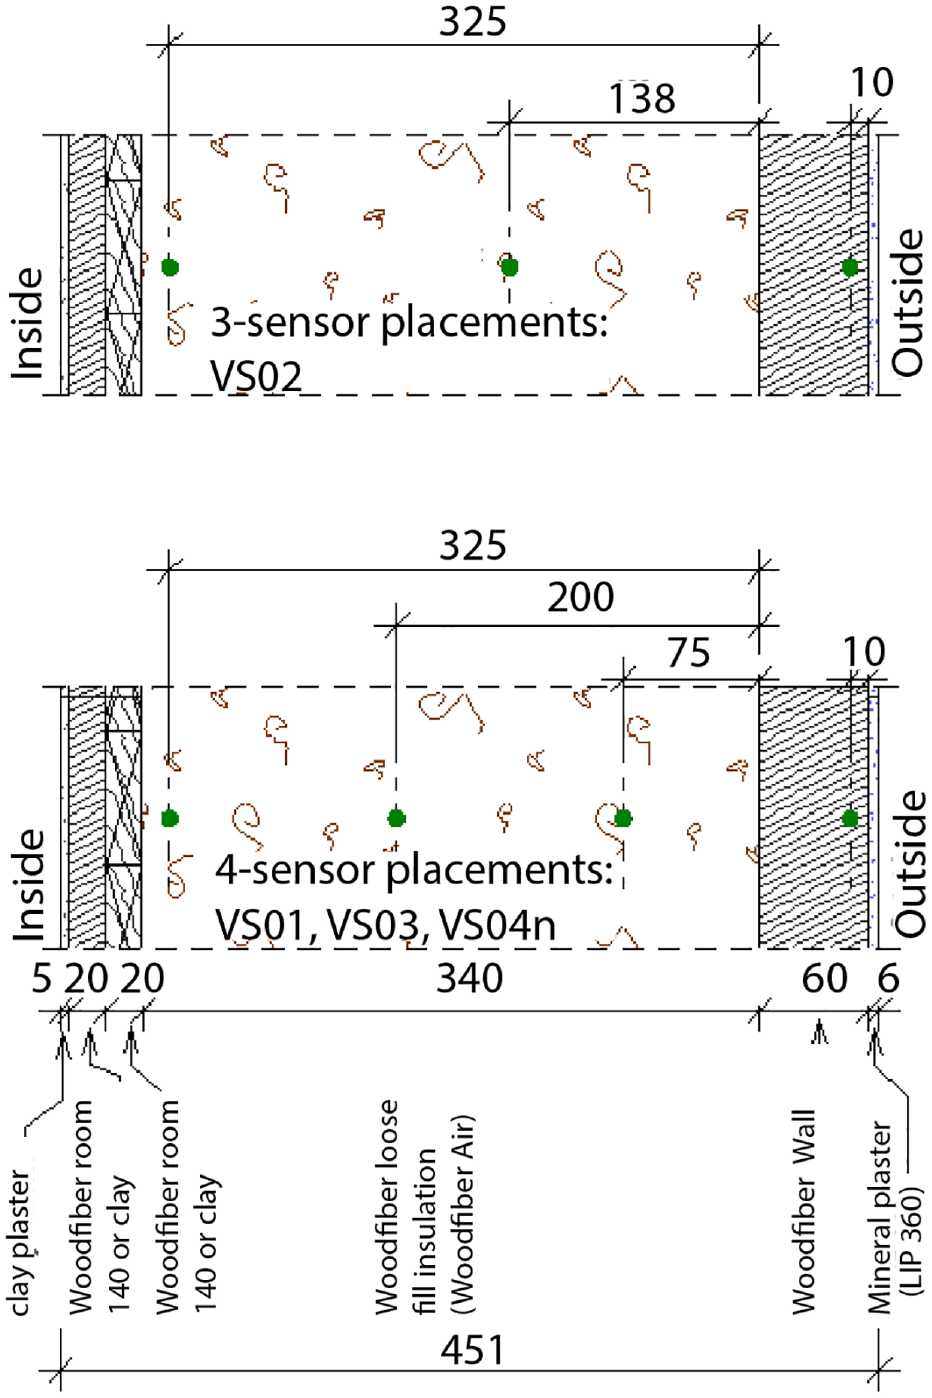
Sensor position (green dots) in walls. Dimensions in mm.
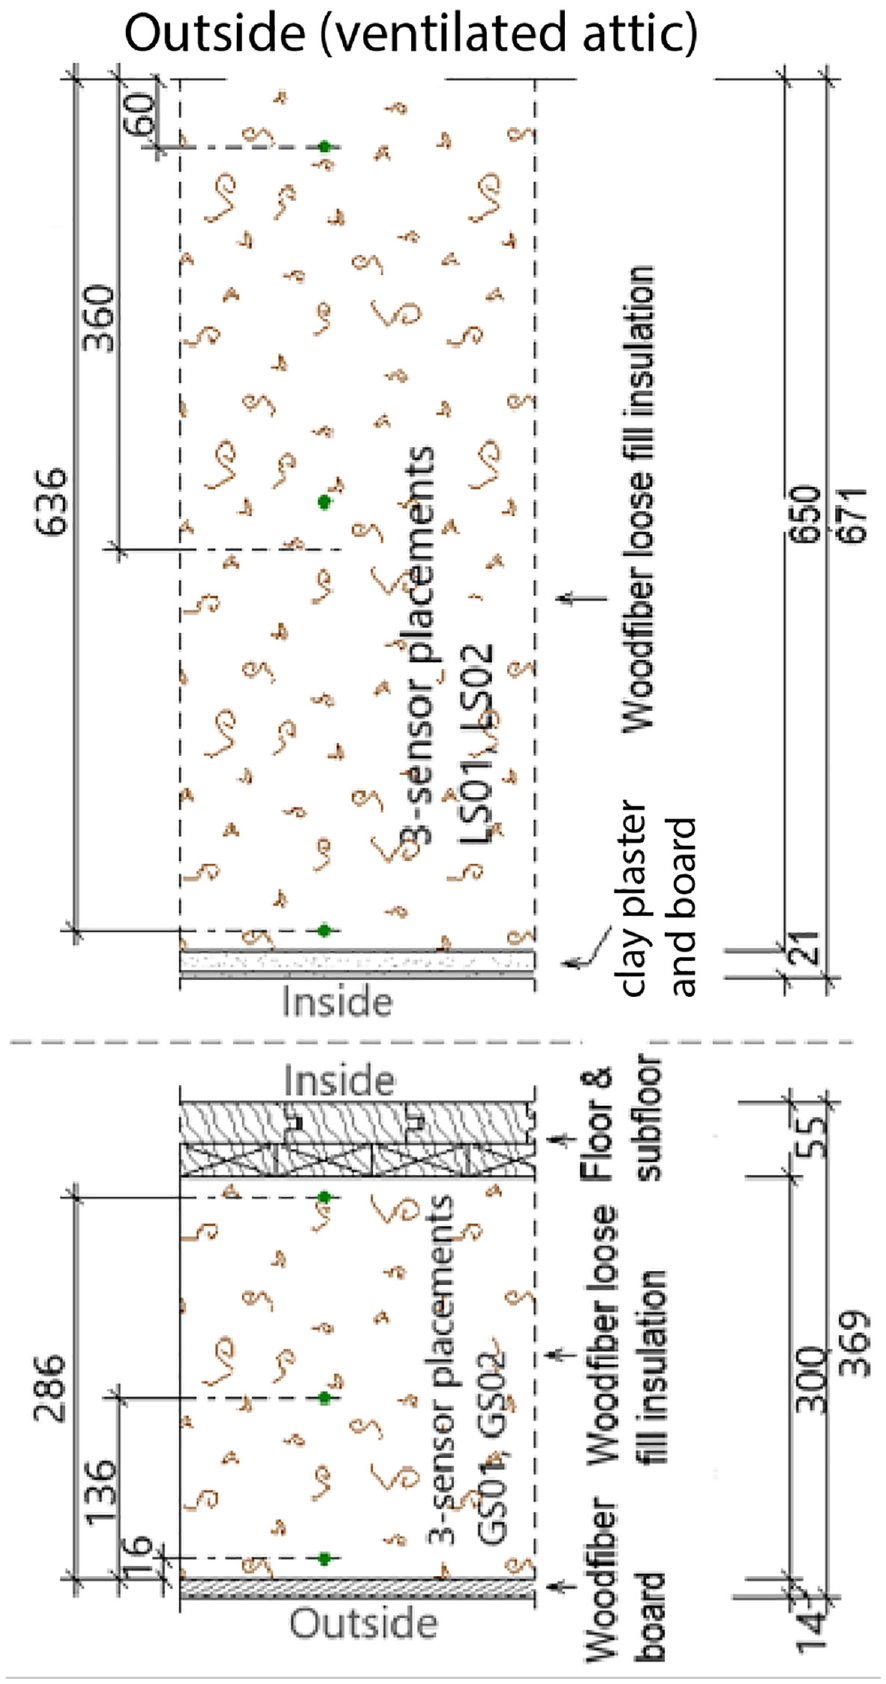
Sensor position (green dot) in roof (above) and floor (below). Dimensions in mm.
The three pictures illustrated in Figure 6 show the size of the sensors used and the technique used to secure the sensor in place. Prior to blowing in the insulation, a small piece of semi-rigid wood fiber insulation was secured against a wood member with a jute net. The sensors were securely embedded in this wood fiber insulation bat before the wall cavity was filled with wood fiber insulation. Since the density and properties of blown-in wood fiber insulation and the wood fiber insulation used to hold the sensor is very similar, in the simulations below it is assumed that the recorded data is representative of a assembly made only of blown-in wood fiber insulation.
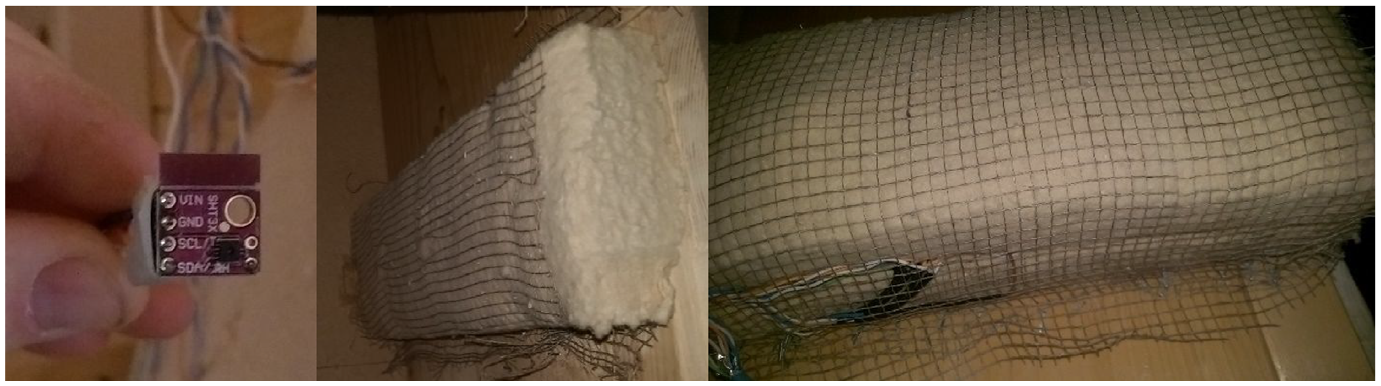
Temperature/RH sensor 12 × 12 mm (left), woodfiber attached with jute ready to host sensors (center), sensors embedded in the woodfiber before wood fiber insulation is blown-in (right).
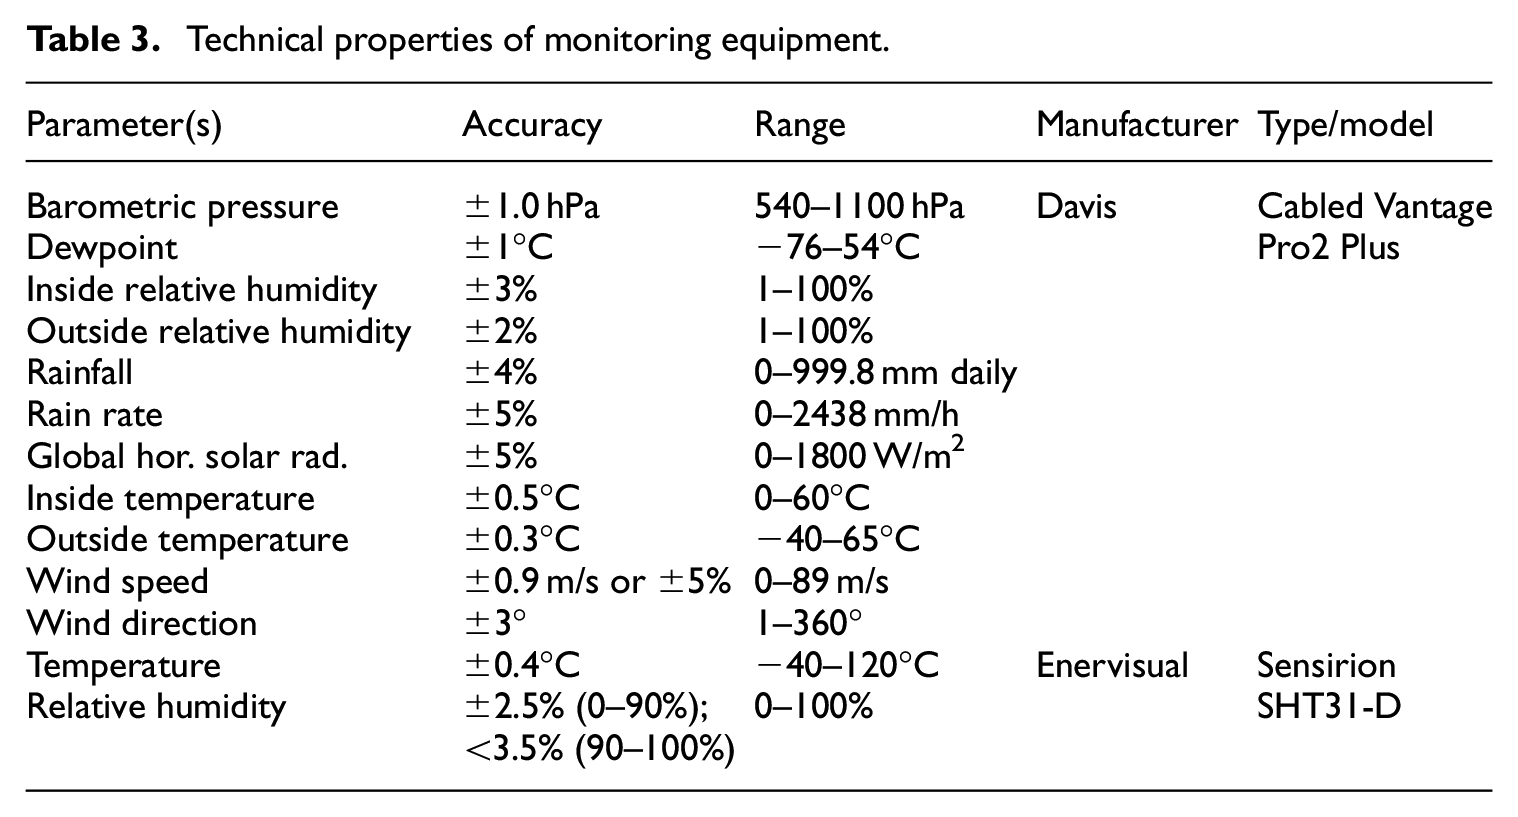
A weather station has been installed on the roof of the case study building. A total of 31 SHT31-D sensors have been installed in the wall, roof and floor assemblies. The technical specifications of the monitoring equipment are presented in Table 3.
Technical properties of monitoring equipment.
Hygrothermal simulations
WUFI Plus
This study employed WUFI Plus 3.2.0.1. WUFI considers moisture transfer as both vapor and liquid through capillary action, vapor diffusion, absorption, and desorption. Coupling effects between heat and moisture are accounted for such as the dependence of the thermal conductivity to moisture content and latent heat effects. For typical construction components, WUFI Plus allows the modelling of homogenous layers only through which one dimensional heat and moisture transfer is assumed, while also allowing users to define 3D objects if three-dimensional heat and moisture transfer is required for some construction details.
WUFI Plus does not model some physical processes such as the retarded sorption effect and sorption hysteresis (Evrard and De Herde, 2010). Furthermore WUFI does not consider eventual parallel moisture transport in the pores and cell walls, which may be relevant for plant-based materials which support significant moisture transport within their fibers, contrary to mineral materials.
Air exfiltration during cold weather can bring moisture in the assemblies and lead to accumulation of moisture. Point-source air leakage, cannot be modelled with WUFI Plus. However previous work with WUFI pro in the framework of the same project showed that air exfiltration had little effect on the hygrothermal performance of the assemblies (Bastien and Winther-Gaasvig, 2018).
Besides the limitations associated with WUFI Plus, there are significant uncertainty issues associated with the determination of material properties. Uncertainties associated with measurements data for the sorption isotherms and vapor permeability of building materials are high, which affect the reliability of simulations of hygroscopic buffering (Roels et al., 2010).
Simulation parameters
The following parameters were selected for the simulation model:
Two zones (living room with VSO2 and VSO3 and remaining rooms as second zone)
Living room: heating set point 20°C, cooling setpoint 27°C
Main zone: heating set point 20°C (7–20 h) with night setback (18°C), cooling setpoint 27°C
Occupancy pattern of a family of four
Infiltration 0.1 ACH, mechanical ventilation 0.4 ACH
Attic and ventilated wall cavity (VSO3) modelled as atmospheric conditions
Crawl space modeled as unconditioned zone with 40 m3/h ventilation, with an average ground temperature of 12.5°C at 99% RH
Interzone ventilation between the house and the living room at 10 m3/h
Local monitored weather data used for hygrothermal simulations.
The special ventilation windows were considered unvented in the simulation model and mechanical ventilation is used instead at 0.4 ACH with a heat recovery. A fictitious cooling set point of 27°C for both zones represent the window opening behavior of occupants for controlling summer overheating. As only one-dimensional simulations were performed, thermal, and hygric transfers through the structural lumber elements were neglected. This would likely not affect the heating load calculations significantly as there is a continuous layer of woodfiber insulation acting as a thermal break. The impact on hygric transfer is also not expected to be significant, as the woodfiber is contributing more dynamically to moisture transport than the structural timber.
The indoor moisture generation profile of the main zone was defined with a daily moisture generation of 5325 g/day. The other zone was assigned a living room profile with a moisture generation of 1448 g/day. The indoor relative humidity level is between 35% RH and 55% RH in winter and 50 and 65% in summer. In the living room the relative humidity level is similar to the main zone. These simulated indoor relative humidity levels are representative of the monitored indoor relative humidity.
Locally monitored weather data was used as weather input for the simulations. A wac weather file was created according to the following steps: 1) conversion from weather data txt file to csv; 2) data cleaning and harmonization for 1-h time interval (the data was most often logged as 1 mn interval); 3) translating the 16 cardinal directions for wind speed stored by the weather station to their corresponding degrees; 4) filling up data gaps with replacement values (January 1st to February 11th 2019 used 2020 weather); 5) in addition to the monitored global horizontal radiation (GHR), the Hottel clear sky model (Bastien and Athienitis, 2017; Hottel, 1976) was used to estimate the diffuse horizontal radiation (DHR) which was further calibrated to match monitored GHR. This was necessary for creating the wac file with the WAC file converter supplied by WUFI (WUFI/Fraunhofer Institute, 2020). The highest solar radiation and the highest driving rain are both on the southwest direction, reaching maximum values of 1088 kWh/m2 year and 1250 mm/year respectively.
Since the weather station was installed on February 12th 2019, a starting period ranging January 1st to February 11th 2019 using weather data from 2020 is used for model conditioning to ensure adequate initial moisture content by February 12th 2019. The two skylights in the dining room, the attached garage and the mechanical room in the basement leading to the garage have not been included in the model.
Mold index determination
The mold index has been calculated following the method described in ASHRAE Standard 160 (ASHRAE, 2016) for the exterior wood fiberboard in walls and wood fiber insulation in the floor and ceiling. This model, developed from experimental observations, uses temperature and relative humidity data to calculate the value of a mold index over time. In this model, mold growth is possible when the relative humidity levels is above 80% and the temperature is above 0°C. It also depends on the duration of conditions that supports mold growth. Mold growth is maximal between 15 and 30°C and is stopped below the freezing point. The mold index should remain below a value of 3, which corresponds to visible mold on the surface on less than 10% of the area or less than 50% of mold coverage under microscope. The wood fiberboard and wood fiber insulation were classified as a sensitive material for which a mold index decline coefficient of 0.1 was selected.
Regarding material durability, the critical humidity enabling decay is 95% (Viitanen et al., 2010).
Results and discussion
Monitored data
The temperature and relative humidity of the external sensors for VSO1, VSO2, VSO3 and VSO4 are shown in Figure 7 and a close up for VSO1 during 2 days in February is provided in Figure 8. Those figures also display the relative rain index for which 100% RH is set to 14 mm (there was no rain on February 13 and 14). On Figure 7, it can be seen that VSO1 and VSO4, both with plaster as an external layer, behave very similarly towards relative humidity. VSO1 (SW) experiences higher temperature than VSO4 (NE) because it has a higher solar exposure. For the four walls, the increase in temperature is simultaneous with an increase in relative humidity. This somewhat counterintuitive effect is discussed in the paragraph below.
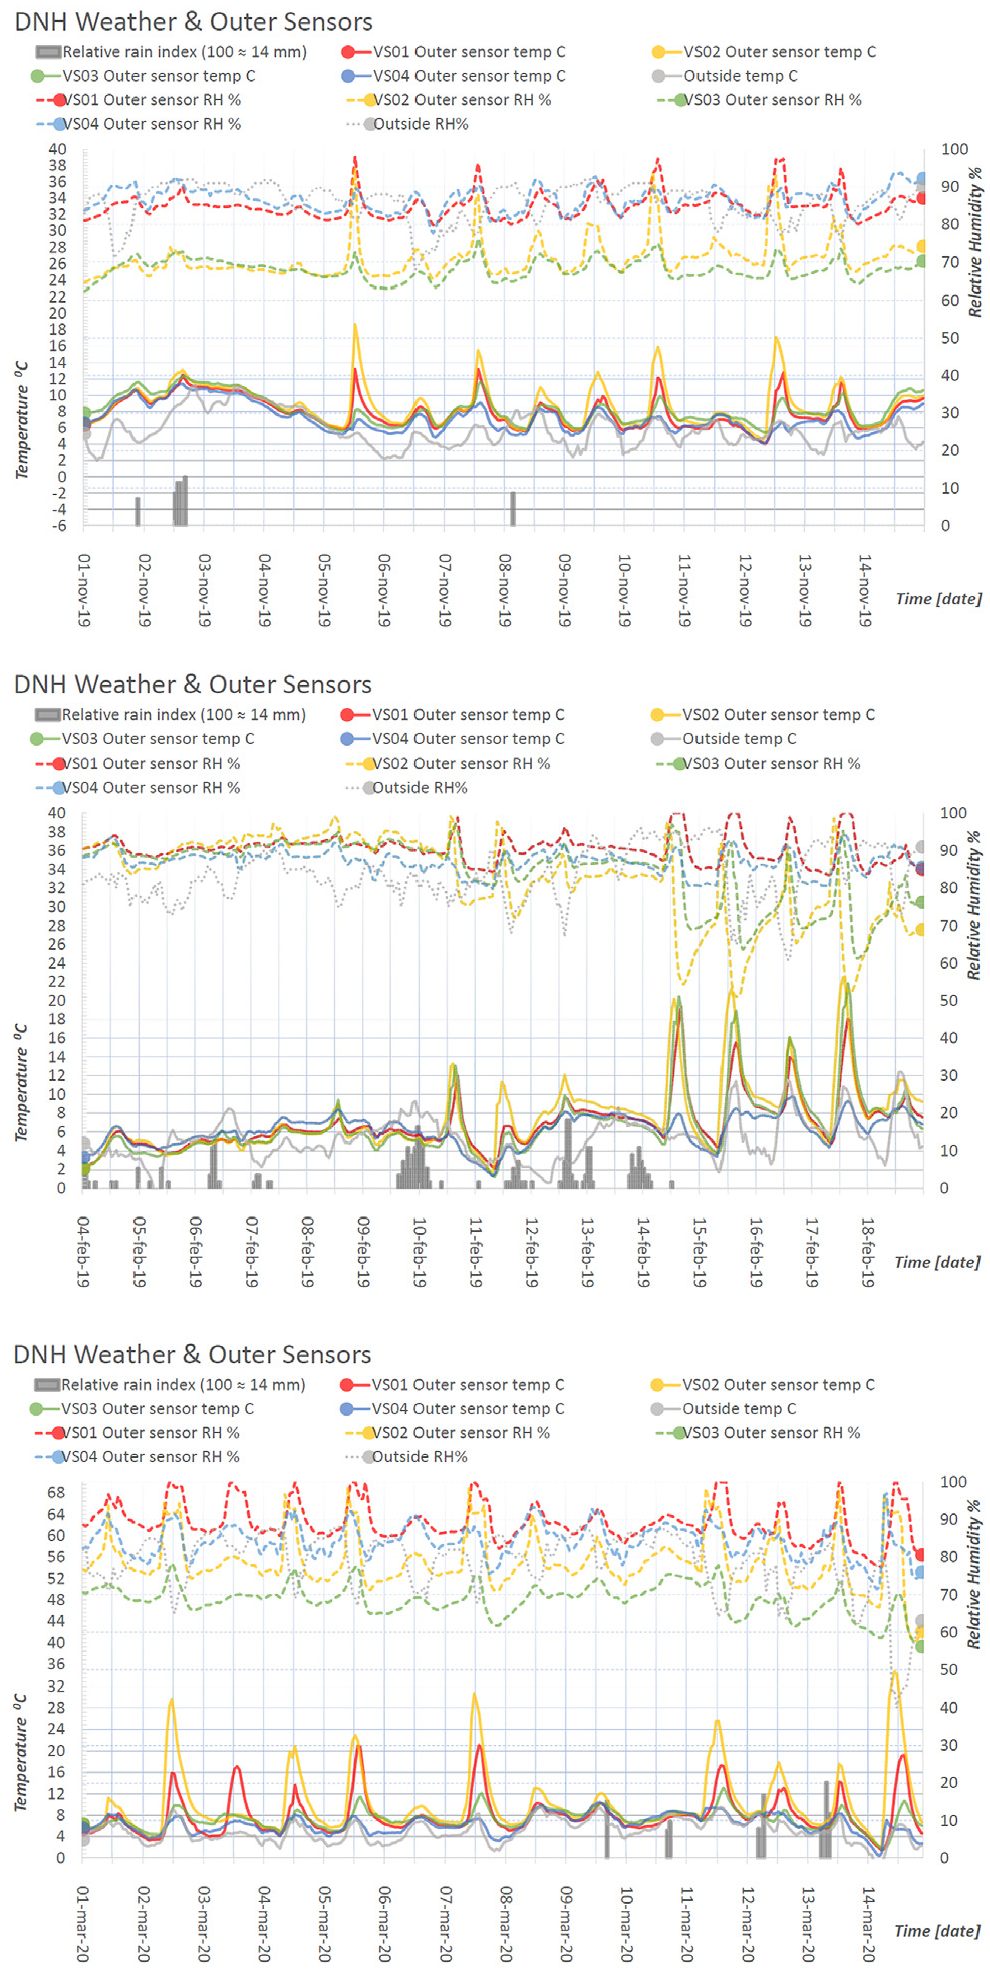
Temperature (solid lines) relative humidity (dashed lines) monitored by exterior sensors in November (top), February (middle) and March (bottom) for VSO1 (SW, plaster), VS02 (SE, unvented wood cladding), VS03 (SW, ventilated wood cladding), VS04 (NE, plaster).
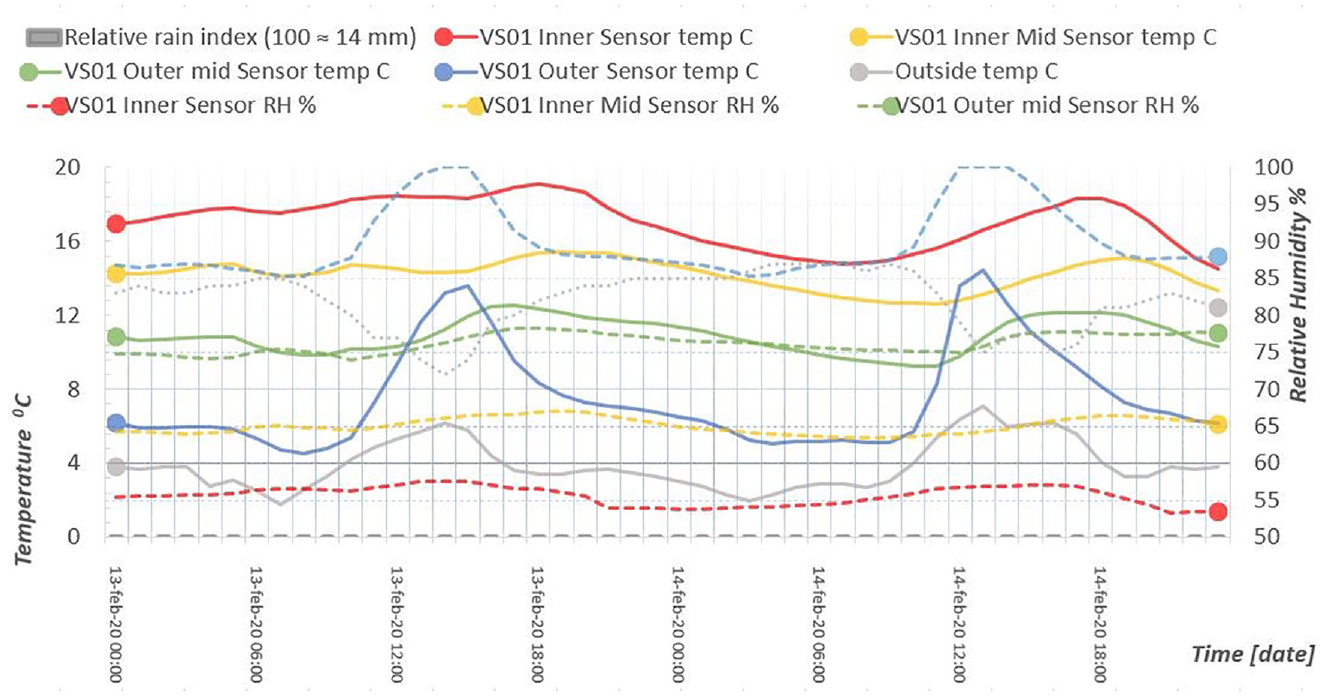
Temperature (solid lines) and relative humidity (dashed lines) monitored by four exterior sensors in wall VSO1 (SW, plaster) during February 13–14.
VSO2 and VSO3, both clad with wood, behave somewhat similarly, with VOS2 experiencing higher temperature and RH swings. The wall with the sensor group VSO2 is finished with a wood exterior cladding directly installed on the exterior woodfiber board, without any air gap. The wall with the sensor group VSO3 is finished with a wood exterior cladding directly on vertical battens, creating a 16 mm ventilated air gap. The baseline RH of VSO2 (SE) and VSO3 (SW) is about 70% in November, 80–90% in February and 70–80% in March. The sequence shown in February shows that RH levels are relatively insensitive to rain but react quickly to temperature rise. A rise in temperature initially coincides with a rise in RH; sometimes the RH drops only when the temperature drops too and at other times the RH drop precedes the temperature drop. Four days of sun in February have contributed to an approximate 15% RH drop. The RH of the external sensor of VSO2 and VSO3 is similar in November and February but the RH at VSO3 is about 10% lower in March. VSO2 (wood cladding, no air cavity) exhibits the highest RH and temperature fluctuations in winter because of the lack of a ventilated air cavity. In contrast VS03 (wood cladding, ventilated cavity) exhibits lower winter temperature because most of the absorbed solar gains are vented out.
Most of the driving rain is coming from the SW direction, which is also the orientation with the highest solar gains. Prolonged rain like the events on February 10 and 14 did not contribute to increase RH levels on any wall orientation. Rapid RH level changes are predominantly caused by a change in temperature. At night we observe a temperature drop shortly followed by RH increase.
Figure 8 reveals that for the four sensors across one wall assembly, their temperature and relative humidity behave mostly simultaneous. The exterior sensor shows strong variations in temperature which are followed by a very similar pattern for the RH. In a closed system, a temperature rise yields to a decrease in RH. In the monitored situation, the strong temperature elevation of the exterior cladding generates a moisture drive from the outside towards the inside, which is opposite to what is expected from moisture flow due to winter diffusion. This reverse vapor drive can be observed daily in winter and is more pronounced when a wall surface is exposed to direct sun.
Overall, the three tested exterior cladding systems (mineral plaster, wood cladding over a ventilated cavity and wood cladding applied directly over wood fiberboards) are shown to provide satisfactory hygrothermal conditions in this case study. The wall with wood cladding installed over a ventilated cavity has slightly lower moisture levels than the wall with the wood cladding directly installed on the wood fiberboards. Walls with wood cladding had lower moisture levels than walls rendered with a mineral plaster.
Figure 9 shows the temperature and RH of GSO1, GSO2 and LSO1 during 2 weeks in January, February and March. Both GSO1 and GSO2 in the floor have RH levels around 80% in January and GSO1 in the ceiling dropped slowly in February and March to reach approximatively 70% in March while GSO2 remained around 80%. The exterior sensor in the attic of the LSO2 group remains at around 50–60% RH and 10–18°C from January to March. These somewhat high temperatures for the exterior sensor in the attic could be caused by having more roof insulation than reported on the plans, making the sensor more protected from the heat. Another possibility is that this sensor’s position could have been altered during the blowing of the insulation and that the sensor might have ended up deeper than what was planned as indicated on Figure 5.

Temperature (solid lines) and relative humidity (dashed lines) monitored by exterior sensors for periods in January (top), February (middle) and March (bottom) for roof assembly LSO1, floors GSO1 and GSO2.
Comparison of monitored data with first-round WUFI Plus simulations
Initial simulation results
The Figure 10 below shows simulation results obtained from first trial with WUFI Plus for the sensor group VSO1 (SW, plaster). The simulated RH level at the outermost sensor follows very well the minimum monitored values, albeit with significantly less variations. The simulated RH levels of the two innermost sensors follow a pattern similar to measured data but simulated values are systematically about 15% RH lower. Simulated temperatures are in good agreement with measurements for the two outermost data points but the monitored temperatures of the two innermost sensors remain significantly colder in winter. Potential explanations for the observed discrepancies and model improvements are discussed in the following. The discrepancies between the monitored relative humidity and temperature are outlined in Table 4. Small discrepancies between values of MAE and RMSE indicate that large errors between the monitored and simulated data are unlikely to occur. Thus, in the subsequent analysis, only MAE were used.
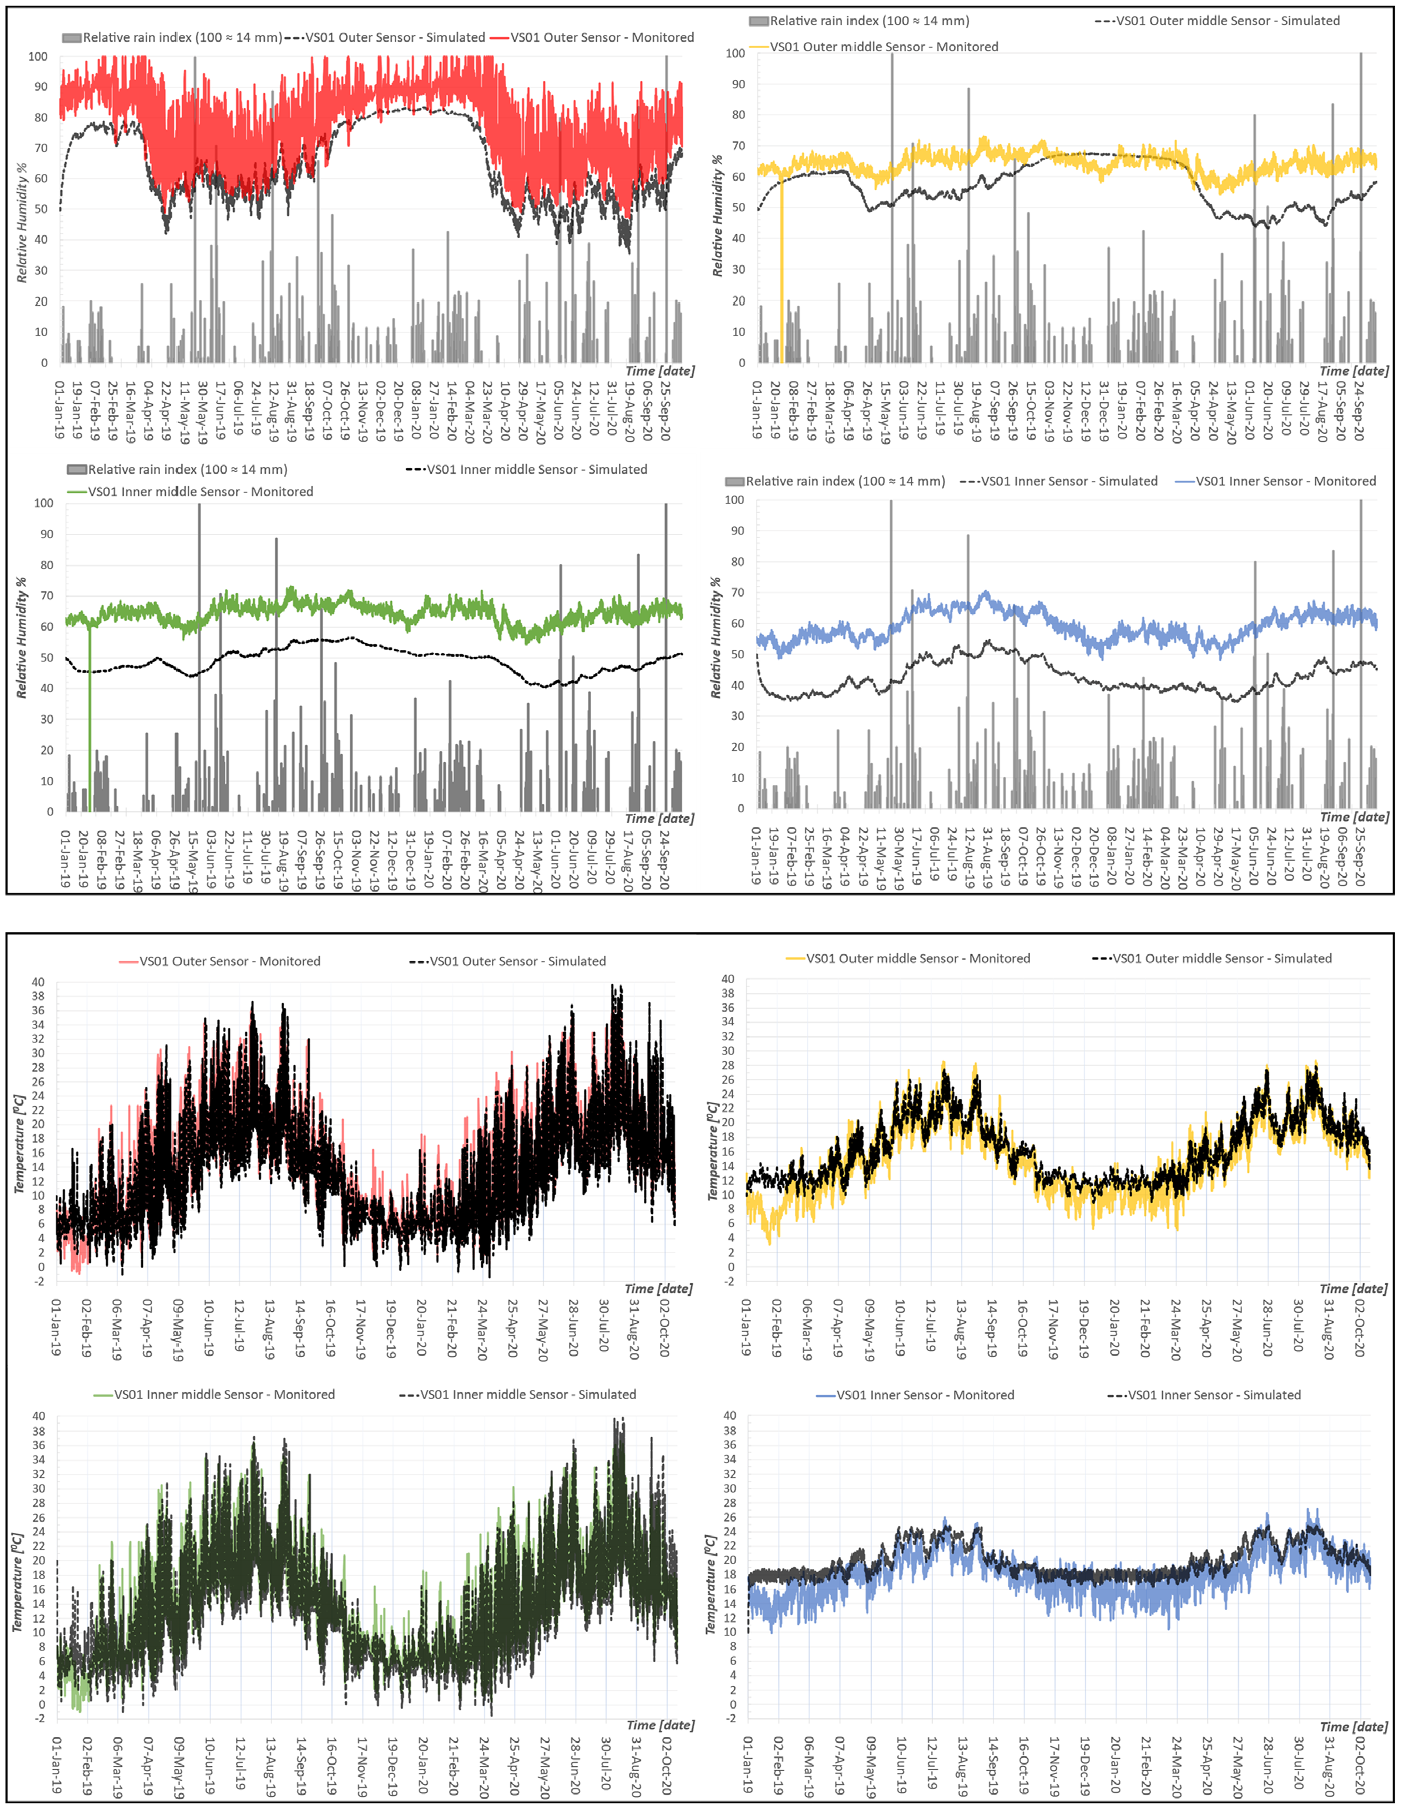
Relative humidity (above) and temperature (below) from first-round simulation results and monitored data for VSO1 sensors.
Errors between monitored data and initial simulations results.
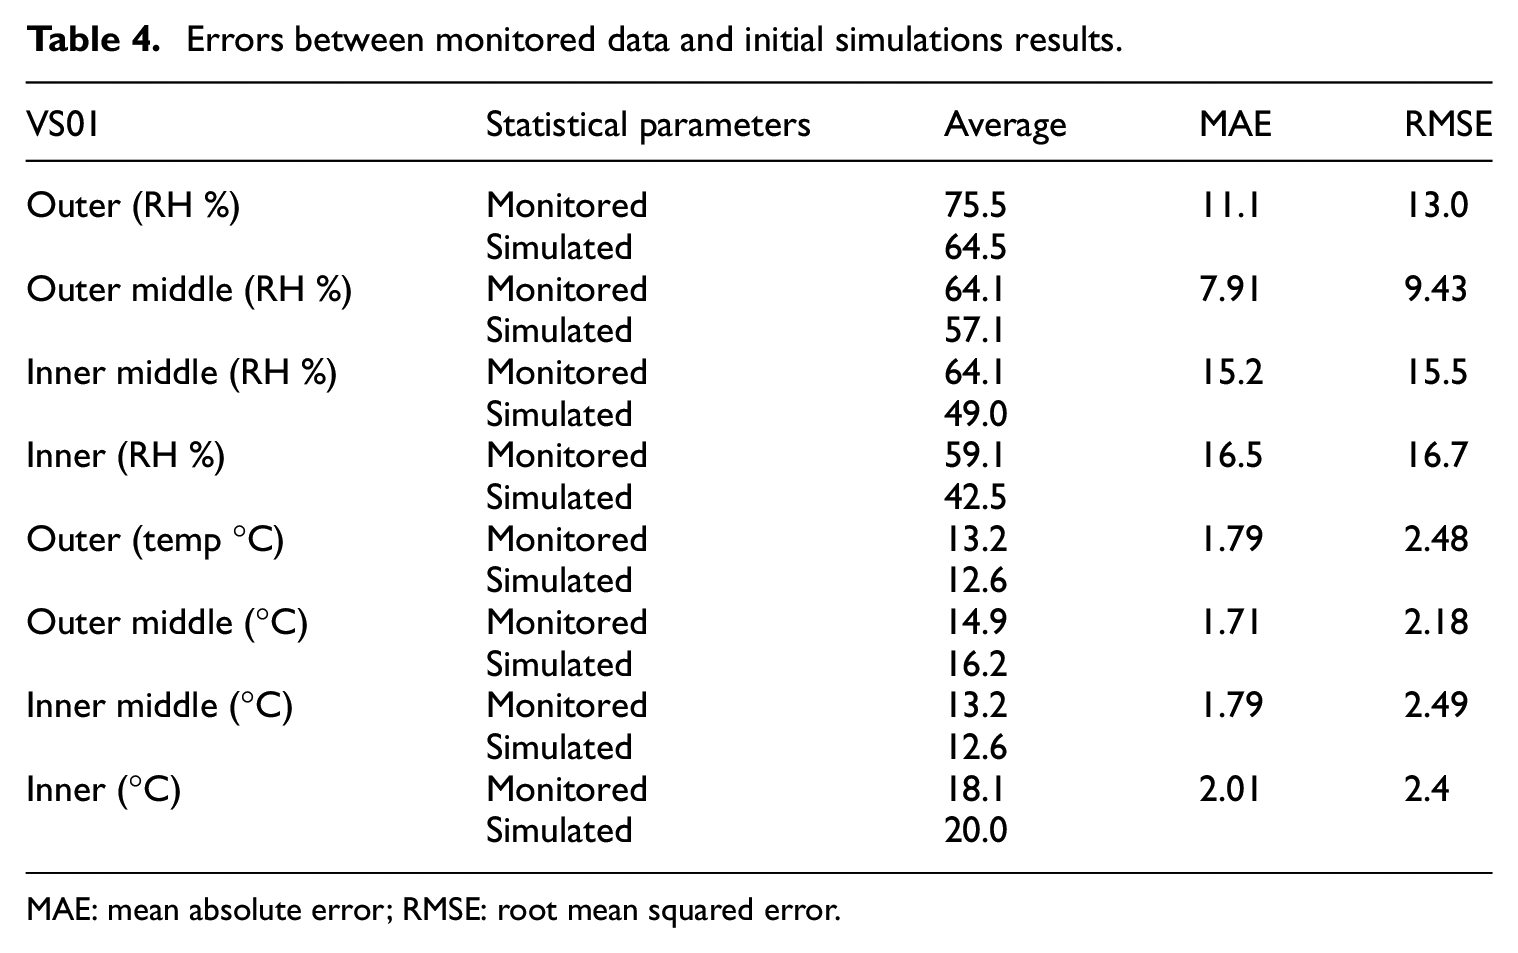
MAE: mean absolute error; RMSE: root mean squared error.
Cause of deviations in simulation results
The causes of the differences could be attributed to the four tri-dimensional issues, as discussed below, of which only one is actually retained.
In all assemblies, pine boards were installed with a gap of approximatively 4 mm in between, representing approximatively 95% coverage. Additionally, some holes were sawn to allow blowing in the woodfiber insulation. This layer is modelled as a homogenous layer in WUFI. This is the layer with the lowest sd value (88.5 m, c.f. Table 1) which corresponds to a class I vapor retarder when in a dry state (<20% RH) and as a class II vapor retarder in average RH levels in buildings (30–60%). However, the 5% air space is contributing to increased moisture transfer compared to the pine boards probably to a much more significant extent than what an area-weighted average would suggest. A sensitivity analysis was carried out and adjusted μ values are discussed in the next section.
The fiberglass mesh embedded in the base coat of clay plaster is not modelled in WUFI. Considering its very low coverage factor, this is not estimated to have a significant impact on hygrothermal transfer.
One of the wall assemblies (VSO3) has a ventilated cavity. This wall was modelled assuming that the ventilated air cavity temperature and relative humidity are equal to the exterior air temperature and relative humidity, while the rain and solar radiation loads turned off. This way of modelling the cavity provided a reasonable agreement with monitored data and therefore no attempts were made to improve the accuracy of the simulations. Measured RH values followed well the atmospheric RH profile but were generally about 10% lower.
The attic was also modelled by setting the attic air temperature and relative humidity equal to exterior air and relative humidity. This provided good agreement with monitored data in summer but not in winter, where monitored temperatures were about 10°C higher and had RH levels 10–20% lower. Modelling the attic as unheated zone would provide conditions that are closer to monitored values, while also significantly increasing the simulation running time and data export time. This was not performed here because the yearly moisture levels throughout the roof assembly of 35–75% are clearly out of the zone of concern for moisture damage and it was deemed more useful to allocate time and resources in a closer study of the behavior of the crawlspace.
Adjustment of input data
As shown in Figure 10, a preliminary comparison of monitored and simulated temperature and RH revealed relatively good agreement with data points on the outside of the building envelope but increasing discrepancies for inner data points.
Potential sources of discrepancies that were deemed possible were: mismatch between the real properties of blow-in wood fiber insulation and its properties in WUFI’s database; imperfect simulation of the effect of the inhomogeneous layer of pine planks et effective real μ-value; parallel moisture transport within wood fibers; uncertainty of the liquid transport coefficients for suction and redistribution; real depth of sensor versus planned position; solar and rain absorption coefficient of exterior cladding; unsatisfactory accuracy of crawlspace modelling assumptions (initially modelled at atmospheric conditions); hysteresis effect; measurement errors. The authors tried to improve some limitations or to quantify the potential impacts of these potential sources of inaccuracies starting with those that were deemed more likely to have a significant impact and which can be controlled or adjusted in the simulations.
As a source of discrepancy, the potential difference between the real properties of the blown-in wood fiber insulation and the properties initially chosen to represent this material in WUFI, which was based on a similar material found in the database, was considered. For inner data points, the temperature was originally 0–5°C lower and the RH was 0–20% higher. As data points further out in the wall assembly presented a better fit between simulation and experimental data, this was speculated to be caused by the increased thermal conductivity of the wood fiber with increasing moisture content or differences in its real moisture storage abilities. In the view of these preliminary results, it was decided to test the material properties of this material by the Fraunhofer Institute.
Upon testing the wood fiber according to EN 12667 (DS, 2001), the monitored thermal conductivity at 0 and 80% RH was determined as 0.0364 and 0.040 W/(mk). This variation of thermal conductivity with moisture content is likely too small to explain the observed deviation. All laboratory-measured material properties for wood fiber (as indicated in Light grey in Table 1) were then incorporated into the simulation model.
It is evident that values of relative humidity monitored by sensors located in outer layers were higher than those monitored by sensors located in inner layers. Values of relative humidity derived from simulations also have the same trend but with a greater change rate. As shown in Table 4, the differences of the averaged relative humidity between the outer layer and inner layer are 16.4 and 22 for monitored relative humidity and simulated relative humidity respectively. This observation indicated that the simulated materials performed better in preventing vapor in the air to be transported into inner layers of the wall assembly than those in the studied building. In addition, to compensate the effect of the inhomogeneous layer of pine planks, simulations were run by reducing the original water vapor resistance factor, μ value, of pine of 4247 down to 5. This change contributed to raise the RH of the innermost monitored position (325 mm) and smoother out fluctuations. It did not affect temperature values. After exploring results with different μ values, a value 5 was selected for pine boards installed with a gap for all assemblies in the simulations. It is also worthwhile to notice that the drastic changes in the μ values did not alter the values of RH considerably. The impact of the μ values on the RH is very limited. Considering that there were open gaps between wood planks where some convective air exchange takes place, this could be analogous to a thermal bridge, but for moisture transport.
The simulated relative humidity at the innermost monitored position remained 5–10% lower than monitored data after adjusting the μ value. After controlling for this source of uncertainty, it was evaluated that the discrepancy could also be caused by the significant moisture transport within the fiber of the material, effect which is not modelled with a high accuracy with WUFI since parallel moisture transport in the pores and within the fibers cannot be described correctly, which can be an issue for natural materials.
The moisture transport in non-porous materials like wood fiber is difficult to model because the properties of the material are not fully fixed. The wood fibers will swell when exposed to air with a high humidity content. Swelling may explain the retarded effect seen in moisture transport. The liquid coefficient provided by the Fraunhofer Institute have been determined by fitting them to measurements so they should technically capture all possible phenomena, but the complex behavior of hygroscopic non-porous materials may not be properly captured by the formalism of the transport properties used in WUFI.
The values for capillary transport coefficient for suction and redistribution estimated by the Fraunhofer Institute for the wood fiber insulation and clay are presented in Table 5 below. For the woodfiber concerned in this study and some other materials, these values were estimated from a three-parameter model (water content at 80 and 100% and water uptake coefficient) obtained from measurements of solid mineral materials (Krus and Holm, 1999).
Capillary transport coefficient for suction and redistribution for selected organic materials.
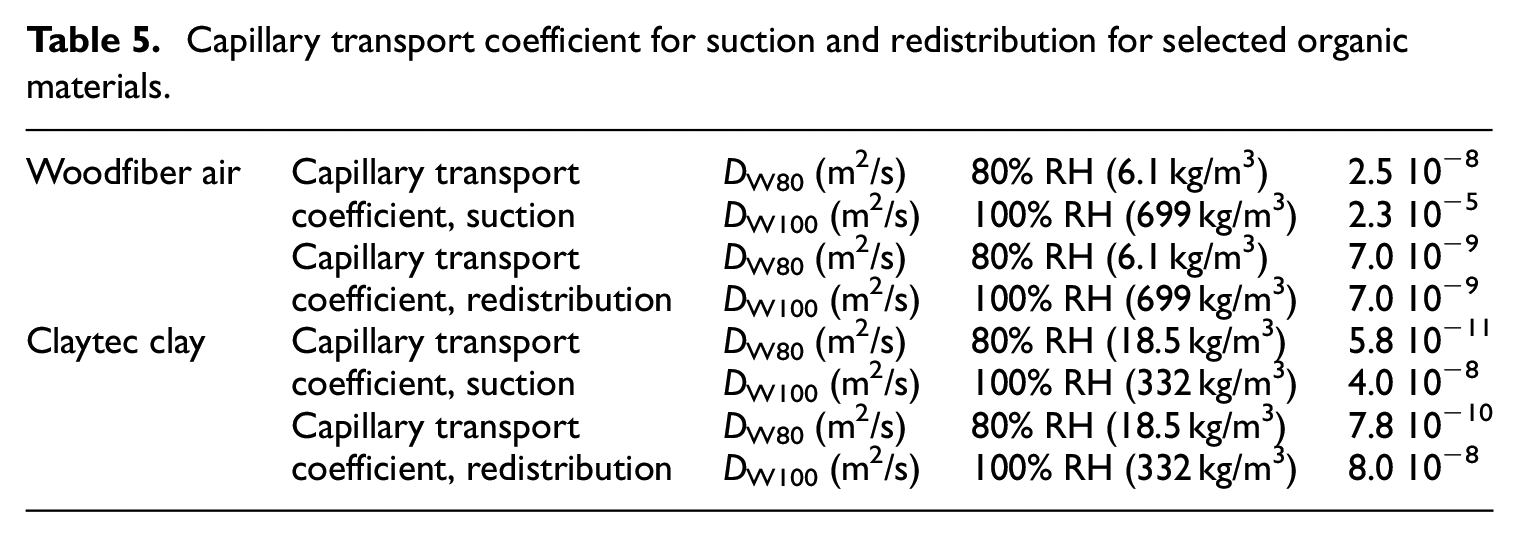
In Figure 10, the plot for the monitored relative humidity is much more fluctuating than that of the simulated relative humidity indicating that the transport properties at higher moisture content needed to be adjusted. During the test phase, it was found that the similarity of plots for monitored and simulated relative humidity improved significantly by increasing the value of both liquid transport coefficients of the wood fiber insulation by 10. In addition, by increasing the value of this material property, the fluctuation of the plot of the simulated relative humidity became more frequent which can also be considered as an improvement of the similarity between the monitored and the simulated data.
The innermost sensor was installed at a depth of approximatively 15 mm behind the pine boards. The sensor position could possibly have been altered during the blowing in of the woodfiber. The simulated temperature and humidity 30 mm behind do provide a slightly better fit with experimental data than at 15 mm, but the difference is rather marginal (data not shown) and thus cannot explain the observed temperature deviation.
The solar absorption coefficient of the exterior wood cladding painted dark blue was adjusted to 0.9 for providing a better fit with monitored data (assembly VSO2—unvented wood cladding). The simulated relative humidity at the outermost sensor for this assembly remained significantly higher than what was monitored. The rain absorption coefficient was reduced from 0.7 to 0.3. These changes improved the fitting of simulated data with experimental, but the overall agreement of RH levels remains imperfect for this wall assembly.
The crawlspace was initially modeled as assumed to be at atmospheric conditions. This provided a reasonable fit with monitored data in winter but a poor fit in summer, where monitored values were 10–20% higher than simulated. Therefore, the modelling of the crawl space was changed as being an unheated zone with a constant RH of 99%. A sensitivity analysis showed that a 40 m3/h ventilation flow rate and an average ground temperature of 12.5°C with an amplitude of 4.5°C would provide the best fit with monitored data.
In WUFI, the moisture storage functions of building materials are typically obtained from pressure plate measurements and are thus desorption curves. While it is possible to also enter an average sorption curve for a material, in any case it is not possible to model the hysteresis effect. Some of the remaining discrepancies can likely be attributed to the hysteresis effect. The transient dynamic effect caused by solar radiation cannot be captured by the program which rely on the instantaneous equilibrium assumption.
The family were also strong proponents of natural ventilation and always had many windows open in the house year-round, which may have contributed to colder temperatures monitored by the sensors on the inner building materials.
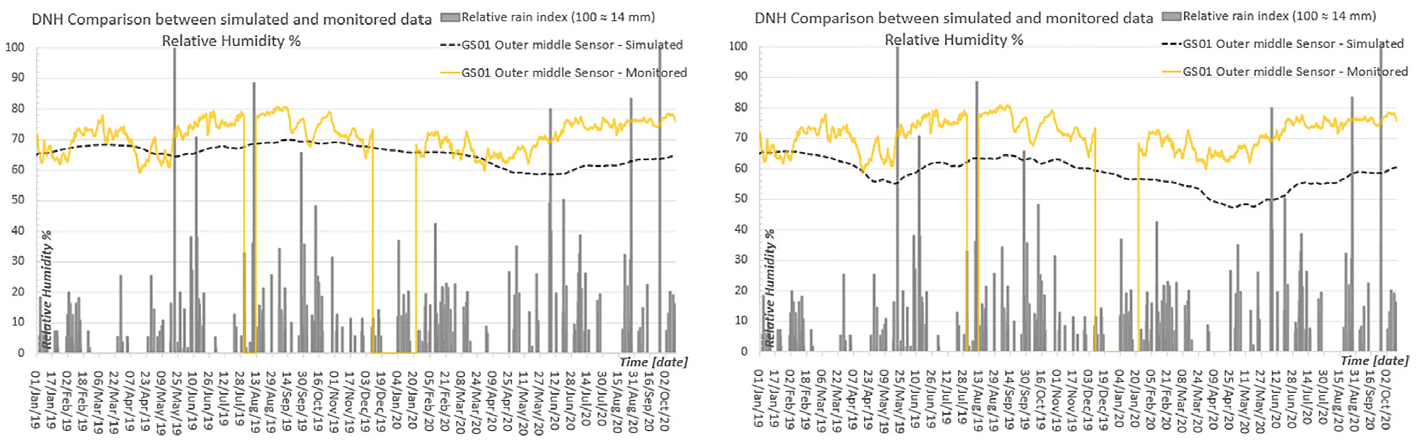
As shown in Figure 11, after adopting these modifications, the magnitude of errors between the monitored and simulated data was reduced significantly for relative humidity and moderately for temperature. The errors for relative humidity at inner layers of the wall assembly become almost the same as those at outer layers. The magnitude of errors between the monitored and simulated temperature was only reduced for those measured at middle layers of the wall assembly.
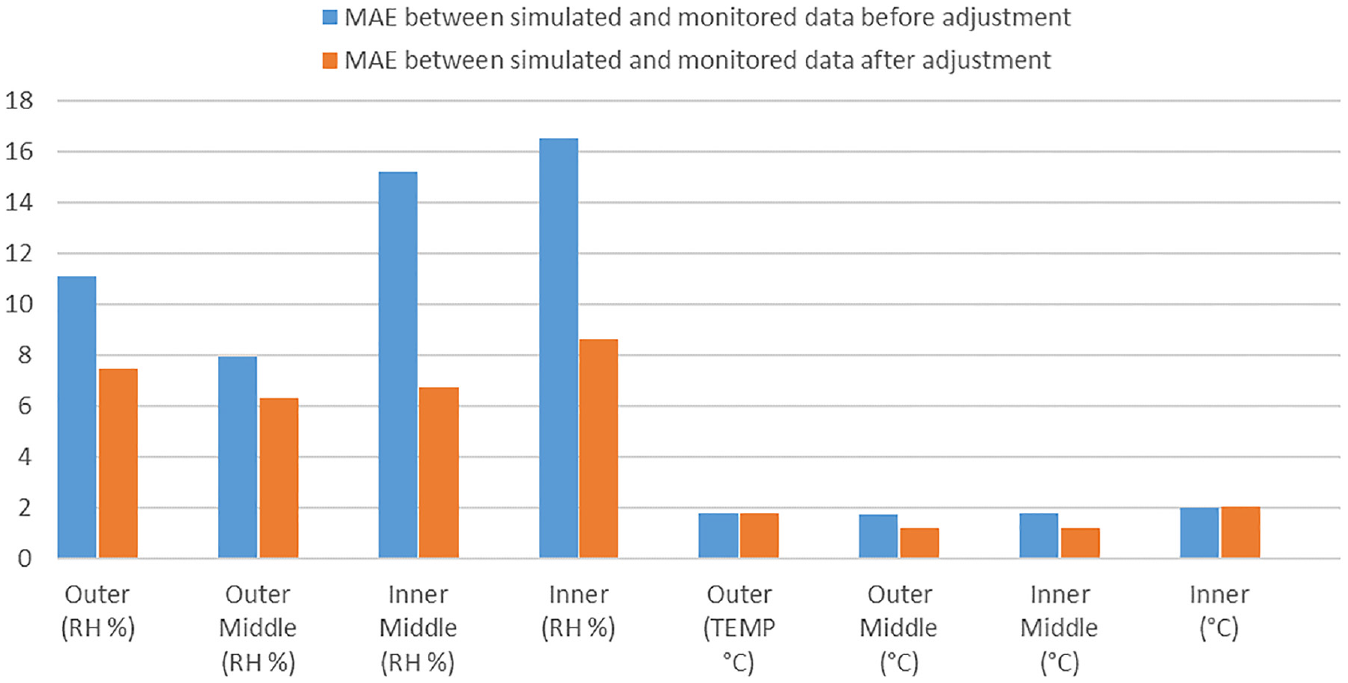
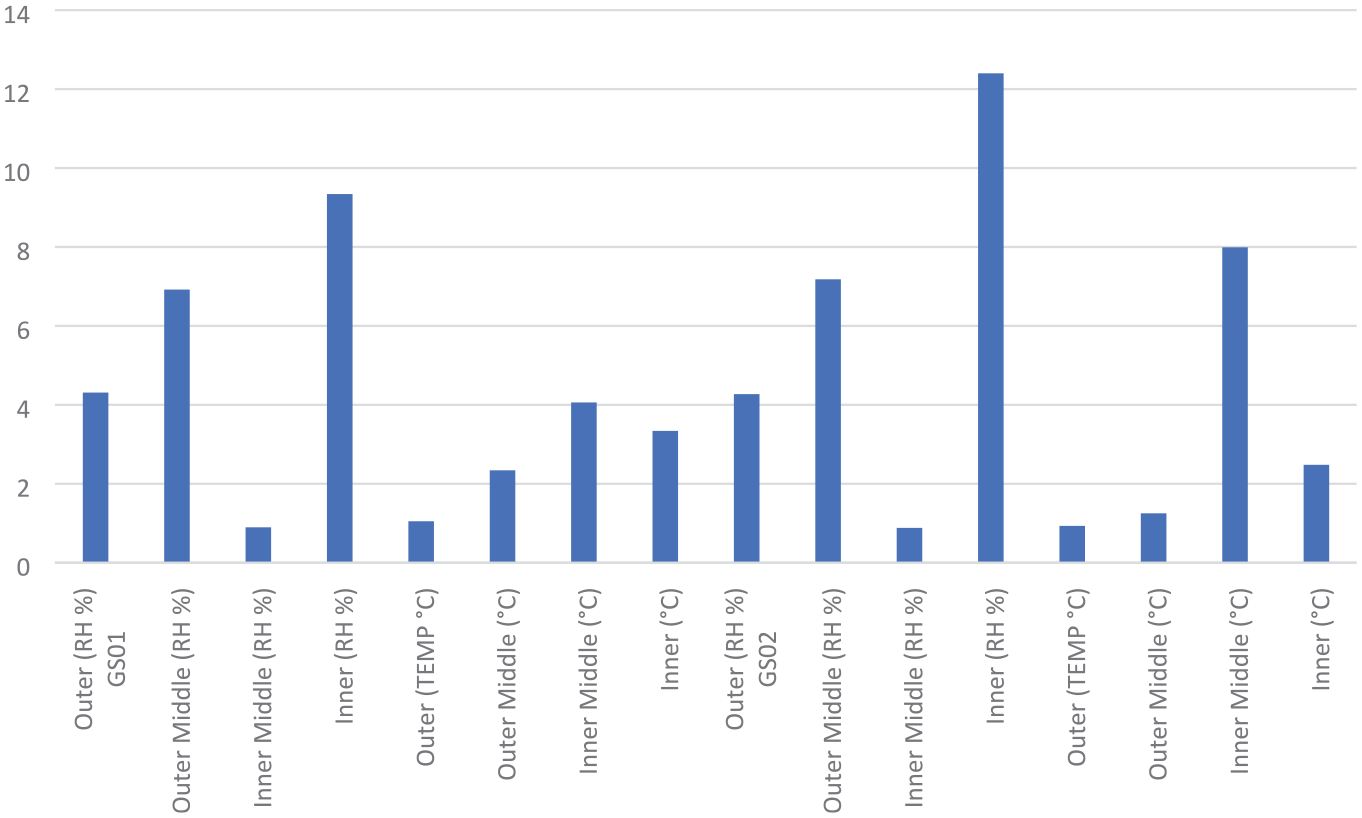
Errors between monitored data and simulations results for sensors in the wall before and after adjustment.
Agreement of improved simulation model with measurements
Walls
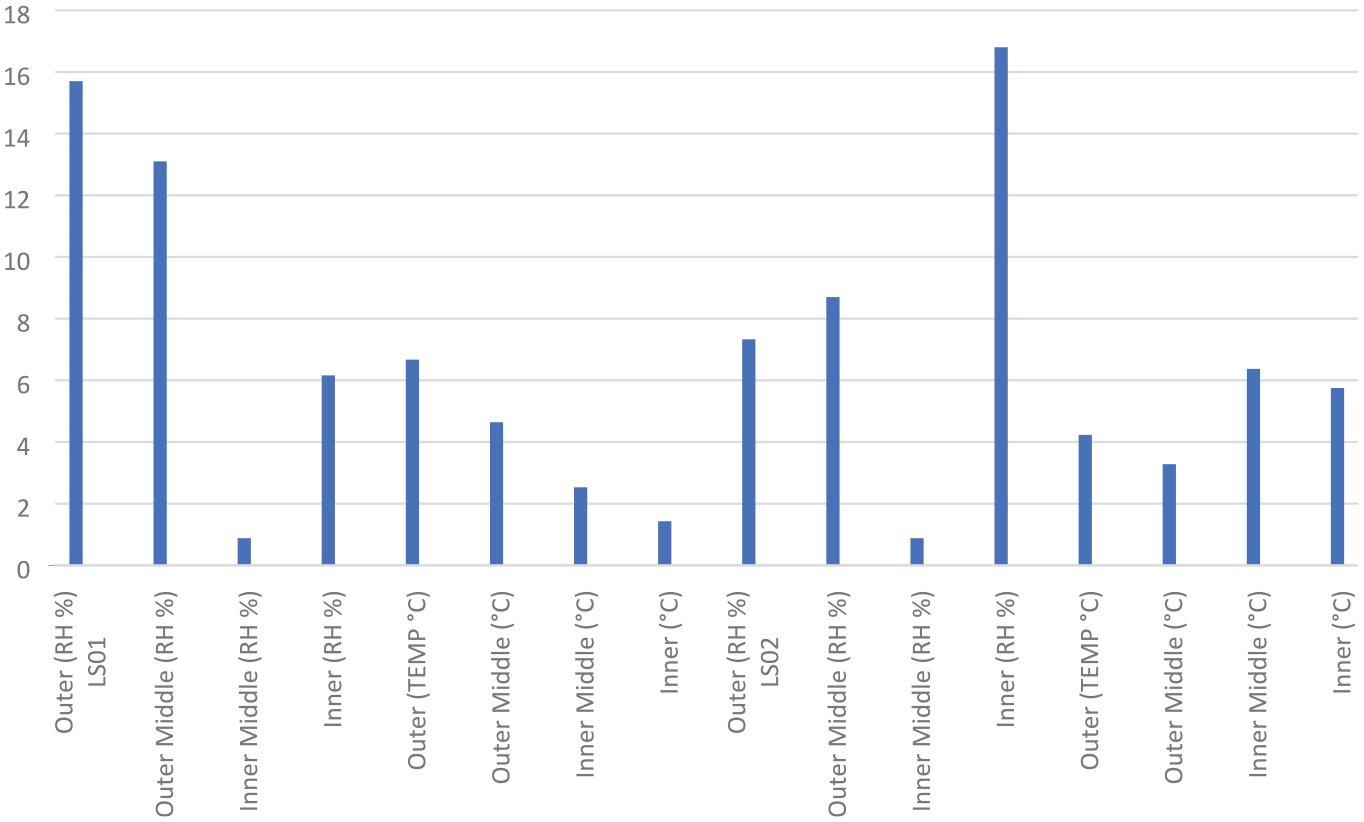
In general, plots of results obtained from the improved WUFI model show a relatively good agreement with those obtained from monitored data. Better agreements are observed for monitored and simulated temperature than those observed for monitored and simulated relative humidity. Statistical parameters shown in Figure 12 suggest that discrepancies between monitored and simulated temperature at VSO1 and VSO4 are smaller than those at VSO2 and VSO3. Relatively large errors are likely to occur to relative humidity at VSO2 and VSO3.
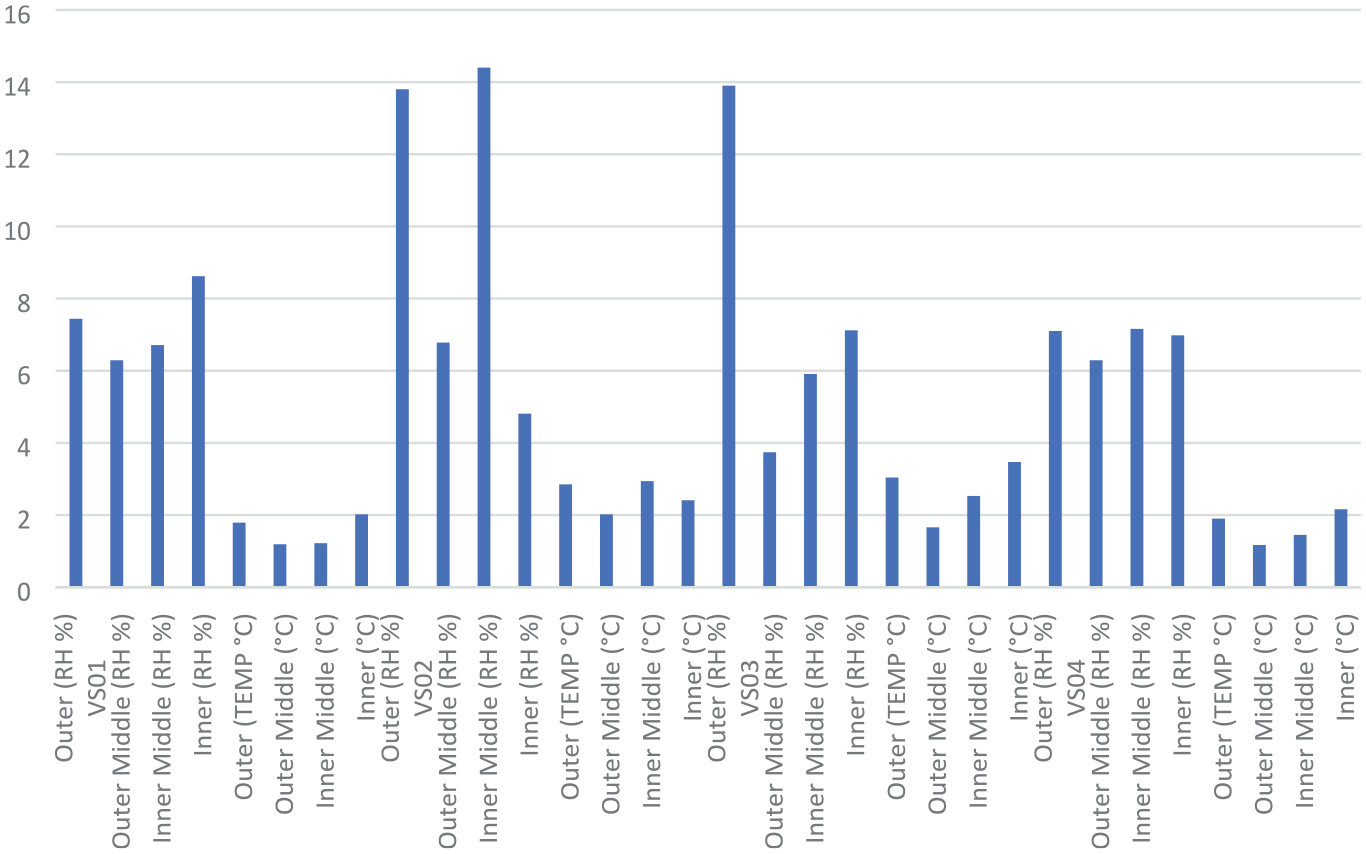
Errors between monitored data and simulations results for sensors in the wall.
For VSO1 and VSO4 (exterior plaster), the peak monitored RH values of the outermost sensor, as shown in Figure 13, are higher than the simulated one, indicating that the plaster is more reactive in reality than in the simulations. The same observations can be found for the inner data point in the wood fiber, for which the monitored values exhibit daily fluctuations not visible in the simulated data.
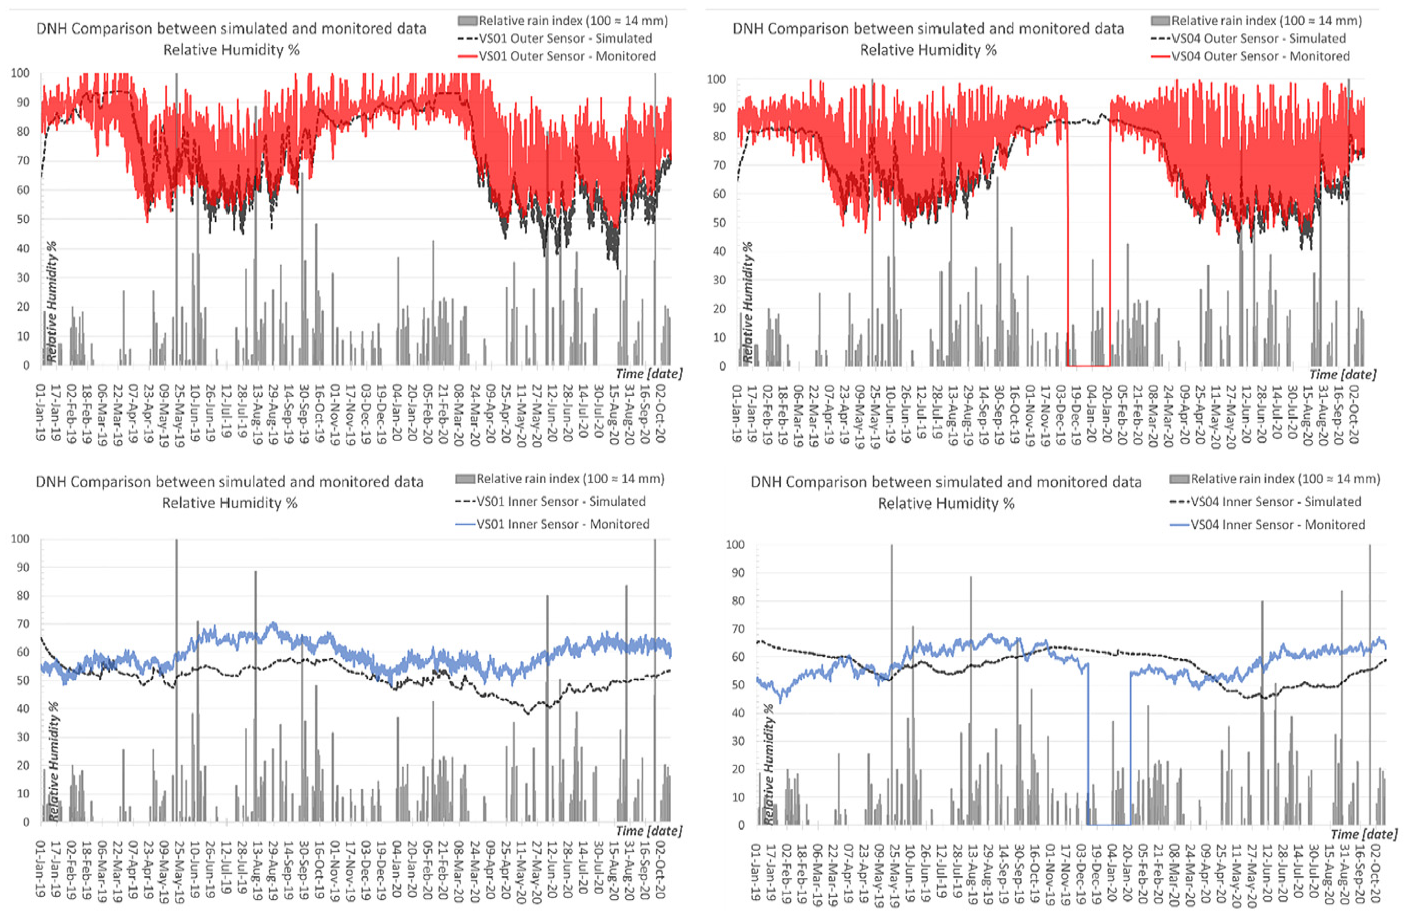
RH of monitored and simulated data for the outer and inner sensors at VSO1 and VSO4.
The monitored temperature of VSO3 sensors (SW, ventilated wood cladding) show a noticeable decrease of maximum values in august, which coincide with the moment when the wood cladding was installed. The exterior woodfiber board has been exposed to the solar radiation and rain for more than 1 year without inducing any damages or elevated relative humidity levels in the assembly. The assembly with the VSO3 sensor group was simulated assuming atmospheric conditions in the ventilated cavity and by switching off the solar and rain loads. This modeling assumption is realistic and both temperature and relative humidity of monitored and simulated values are in good agreement with each other. The largest discrepancy occurred in September to January when the monitored RH levels were approximately 10% lower than simulated values.
Two parameters needed adjustments for obtaining an acceptable fit for VSO2 (unvented wood cladding). The solar absorptance was raised to 0.9 and the rain absorption coefficient was reduced from 0.7 to 0.3. These changes improved the correspondence between monitored and simulated values, but the fit remains imperfect. In particular, the monitored values show large RH fluctuations, especially at the outer sensor location, which are not shown by simulated data. This is likely due to uncertainties of the material properties of the wood cladding selected for the simulations, which were obtained from a similar material in the WUFI database. Obtaining material properties for each material by direct measurements is ideal, but it is time consuming and expensive, therefore only limited measurements were possible for this study.
It should be noted that building occupants used natural ventilation year-round (assisted with mechanical exhaust in utility rooms feeding a heat pump) for controlling the IAQ. This factor plays a role in explaining why the temperature (and consequently also RH) fluctuations at the inner sensor are more pronounced in the measured data than in the simulation results.
Floor
The averaged values and MAEs for data at GSO1 and GSO2 are shown in Figure 14. Simulated results for the two locations are identical since this is the same floor assembly in the same zone. Monitored data show elevated moisture levels on the outside of the floor assembly throughout the year, showcasing a potential source of concerns. Monitored values are higher during the summer than winter, an effect which is more pronounced with GSO2. There is a floor heating system installed near GSO1 and GSO2 sensor groups, which is not modelled by WUFI.
Errors between monitored data and simulations results for sensors in the floor.
Simulating the crawlspace as an unheated zone with 40 m3/h of ventilation is reproducing relatively well the monitored data, although the inner monitored RH tends to be 10–20% higher in the warmer season. The monitored temperatures at the inner sensor of GSO1 are surprisingly cold (dropping as low as 12°C), considering the 286 cm of woodfiber below and the installed floor heating system (which is not modeled). Sudden temperature variations are visible at that location, which may be partly caused by air infiltration through the floor assembly, which does not have a continuous air barrier. The 14 mm woodfiber board at the bottom of the floor assembly act as a wind break and reduce air infiltration but is not airtight, especially at the numerous attachment points with staples. The hardwood floor is airtight but junctions between planks are vulnerable locations for air infiltration, an effect that winter shrinking due to lower humidities contributes to exacerbate. Eventual air infiltration through the floor could also bring in moist air from the crawlspace, which would then condensate in the cold parts of the insulation.
Typical solutions recommended for reducing the humidity levels in floor assemblies above crawl spaces include 1) closing the ventilation opening during the warm season; 2) filling the crawl space with insulation, such as expanded clay aggregate.
The relative humidity in Denmark is relatively high, with a yearly average of 79% that reaches 85% in January. July is the warmest month with an average temperature of 22°C. In the simulation model, temperatures in the crawlspace oscillate between 7°C in winter and 17°C in summer with humidity between 75 and 88%. Our simulations show that reducing the ventilation rate at a minimum of 5 m3/h raises humidity levels to approximatively 85–90% throughout the year, worsening the situation (data not shown). During the summer, depending on the conditions, introducing warm and humid air in the colder crawlspace can at times introduce significant amount of moisture instead of contributing to dehumidify it. It is expected that most of the moisture incoming in the crawlspace is coming from ventilation, although evaporation from the ground is also taking place to some extent. Increasing the airflow rate to 90 m3/h helps to reduce RH levels at certain times in the crawlspace (now between 60 and 88%) while not affecting the temperature, though even higher flow rates would be desirable to eliminate all concerns of eventual mold growth.
The effect of adding a small solar thermal system (1.4 m2) with a flow rate of 110 m3/h and an average daily heating capacity of 2000 W to the crawlspace on RH levels is shown in the figure 15 below. Simulations show a reduction of RH levels by approximatively 5–10%, enough to avoid exceeding 80% at the outermost sensor, thereby eliminating favorable conditions to mold growth.
RH levels before (left) and after (right) adding the small solar thermal system.
Ceiling
Figure 16 shows averaged simulated and monitored data for the roof at location LSO1. Since in the simulation the attic was simulated as atmospheric conditions, it is not surprising to see that simulated temperatures are colder than monitored values in winter. Monitored humidity levels are around 40-50% during the summer and a rise to 60–70% during the winter, thereby eliminating concerns for mold growth. Simulating the attic as an unheated zone with some ventilation would provide simulation results that are closer to monitored values.
Errors between monitored data and simulations results for sensors in the ceiling. There are relative high levels of moisture in VS01 at the outer sensor in the SW façade. This is the façade that is most exposed to rain and wind pressure. A Crack have been spotted in finished exterior plasterwork where VS01 is positioned. Driven rain can intrude the plasterwork through the crack with low possibilities to get out again through the relative tight lime cement plaster.
Mold index
The mold index from measured data (outermost sensor for all assemblies) in the year 2019 and 2020 is shown in the Figure 17 below. It can be seen that the sensor VS01 located on the SW façade has a larger mold growth potential, which is likely due to a high exposure to rain and wind. The tightness of the plaster should be inspected and eventual observed cracks be sealed. As seen from Figure 17, the moisture levels decreased after April 2020, so there is no ongoing concerns.
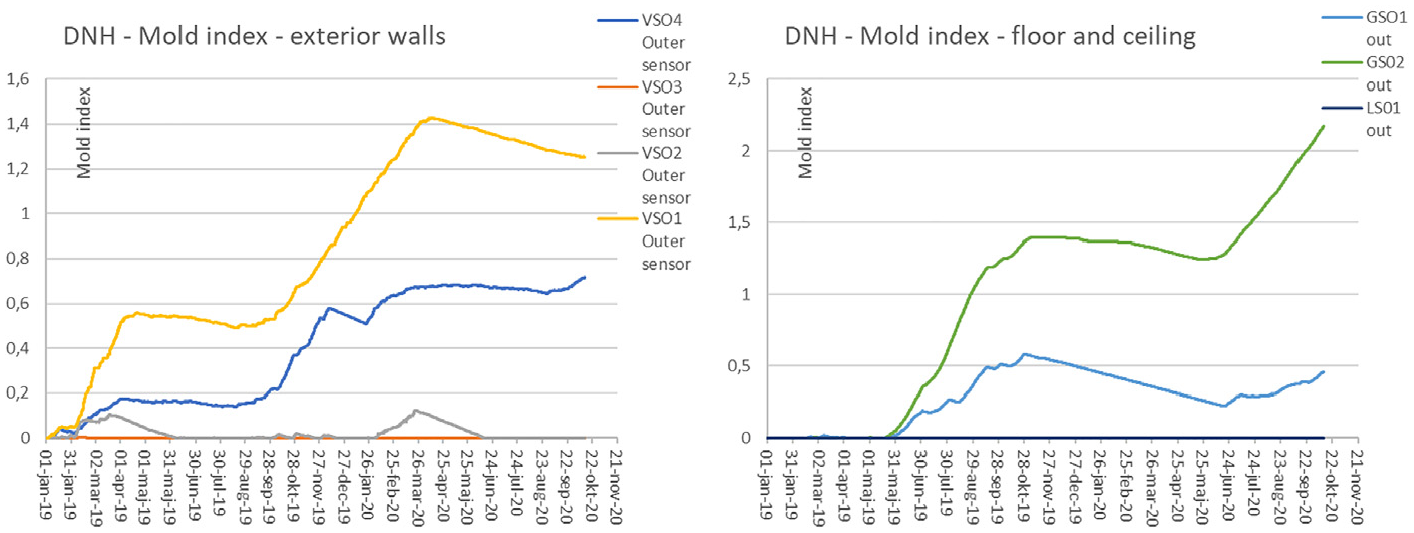
Mold index 2019 and 2020 in the exterior part of the building envelope in different locations.
The mold index for VSO3, which has a ventilated cavity behind the wood cladding, remains at 0 after nearly 2 years. VSO2, with wood cladding directly applied over the exterior wood fiberboard, shows a slight increase of the mold index in spring but goes down to 0 again.
The mold index for VS04 does not seem to be a source of concern.
The mold index of especially GS02 keeps rising. Humid warm air in summer gets in the colder space in the crawl space and condensates. The level of ventilation in the crawl space is not sufficient. By looking at pictures of the crawl space it seems that there is low level of cross ventilation through the crawl space. The space under GS01 has a longer unhindered façade where there is a better possibility for ventilation.
Criteria applies to all materials and surfaces except exterior surface of the building envelope. The calculations have been made from sensor results inside a material.
No visible nor olfactive signs of moisture damage to materials was observed on site, at any locations.
Conclusion
The analysis of nearly 2 years of monitored data and hygrothermal simulations allow us to draw the following conclusions:
Measurements show that materials employed in this house (wood fiberboards, blow-in wood fiber insulation, clay plaster) respond quickly to moisture changes, more quickly that simulated data. This work highlights the need for validating and adjusting WUFI simulation results with measured data to provide reliable results for building envelopes composed of highly hygroscopic plant-based materials.
As designed and installed, these materials exhibit satisfactory hygrothermal performance without the need for a vapor barrier in a wet moderate cold climate like Denmark. Regardless of material considerations, rainwater management remains one of the most important design parameter to handle for ensuring building envelope durability. Moreover, airtightness is also important, not only for energy efficiency and comfort but also for preventing localized moisture accumulation.
This study validates that mineral plaster, wood cladding over a ventilated cavity and wood cladding applied directly over wood fiberboards are three different cladding systems that are shown to provide satisfactory hygrothermal conditions in this case study. The wall with wood cladding installed over a ventilated cavity has slightly lower moisture levels than the wall with the wood cladding directly installed on the wood fiberboards. Walls with wood cladding had lower moisture levels than walls rendered with a mineral plaster.
The monitored temperature and RH at a location are strongly correlated—in most instances, a temperature rise yields to a rise in RH, and their decrease are also simultaneous. This correlation is very strong under direct solar radiation. This effect is visible year-round and is somewhat counterintuitive to the common thought: solar radiation promotes drying. In principle, it does, but in reality, it also generates a reverse moisture drive, pushing water molecules into the assembly daily at all times of the year, complicating the analysis.
For this particular study, selected parameters were adjusted to provide a better match between the simulated and the monitored data. Specifically, reducing the μ values resulted in a better fit between the simulated and monitored relative humidity; increasing liquid transport coefficients increased the fluctuation in the simulated relative humidity which became more similar to the monitored data; the solar absorption coefficient of the exterior wood cladding painted dark blue was adjusted to 0.9 for providing a better fit with monitored data at VSO2; the rain absorption coefficient was reduced from 0.7 to 0.3 to improve the agreement of relative humidity; ventilation flow rate and an average ground temperature were adjusted to improve the fit for monitored data. Values of these changes were determined by sensitivity analysis. Liquid transport along the fibers of organic materials is important and that more research about modelling this phenomenon would desirable. Uncertainties associated with the hysteresis effect is an important source of discrepancies between measures and simulated data.
WUFI is a useful tool that is highly reliable for comparing different design alternatives and identifying the safest solutions. However, predicting with a high level of accuracy actual RH and temperature levels remains a challenge for highly hygroscopic materials. The determination of material properties experimentally in a laboratory is an important factor affecting the accuracy of the simulation, which requires significant resources.
For this floor assembly, moisture levels are higher during summer and fall. One of the two monitored locations indicates potential for mold growth at the cold side of the insulation. Increased crawlspace ventilation is recommended and that should be sufficient to eliminate concerns.
The monitored hygrothermal performance of the ceiling is excellent. For the walls, the monitored data shows that whether having a ventilated cavity or not having a cavity at all, the hygrothermal performance of those wall is satisfactory. Having a ventilated cavity resulted in slightly reduced moisture levels at some periods of the year, but both assemblies do not pose concerns for mold growth. The wall sections with a mineral based plaster performs satisfactorily, where proper protection from rainwater seems more important than for a wood cladding exterior finish.
Overall, the monitored data from this case study shows that in a northern European climate such as Denmark, the natural materials employed for this building envelope show a good hygrothermal performance. For these assemblies in these conditions, the use of a vapour retarder is not needed for achieving a satisfactory hygrothermal behavior. Careful planning and analysis is recommended when using building materials and methods that are not mainstream. Planning for redundancy (e.g. like having a primary and secondary rain barrier separated by a drained ventilated cavity) can reduce risks when exploring new design alternatives. Adequate crawlspace and attic ventilation as well as proper rainwater management are basic requirements that all buildings should pay attention to, regardless of the type of materials employed.
Supplemental Material
sj-docx-1-jen-10.1177_17442591231195639 – Supplemental material for Hygrothermal performance of natural building materials: Simulations and field monitoring of a case study home made of wood fiber insulation and clay
Supplemental material, sj-docx-1-jen-10.1177_17442591231195639 for Hygrothermal performance of natural building materials: Simulations and field monitoring of a case study home made of wood fiber insulation and clay by Diane Bastien, Martin Winther-Gaasvig, Jeppe Zhang Andersson, Zhe Xiao and Hua Ge in Journal of Building Physics
Footnotes
Acknowledgements
Jesper Thomsen and Christian Barnechow from Enervisual are warmly thanked for their involvement in designing and installing the sensors. Collaboration with Christian Gudiksen and his family is greatly appreciated for providing access to the case study building.
Declaration of conflicting interests
The author(s) declared no potential conflicts of interest with respect to the research, authorship, and/or publication of this article.
Funding
The author(s) received no financial support for the research, authorship, and/or publication of this article.
Supplemental material
Supplemental material for this article is available online.
References
Supplementary Material
Please find the following supplemental material available below.
For Open Access articles published under a Creative Commons License, all supplemental material carries the same license as the article it is associated with.
For non-Open Access articles published, all supplemental material carries a non-exclusive license, and permission requests for re-use of supplemental material or any part of supplemental material shall be sent directly to the copyright owner as specified in the copyright notice associated with the article.