






Abstract
Integrating flexible photovoltaics with building roofs is a promising solution for sustainable urban development, yet temperature-induced efficiency degradation and structural loading considerations remain critical challenges, especially in tropical climates. To address these issues, this study proposes a novel Roof Integrated Flexible Photovoltaic-Phase Change Material (RIFPV-PCM) system to enhance thermal regulation and energy efficiency. A computationally efficient theoretical thermal model is developed based on energy balance approach to evaluate system performance. Based on this model, a computational program is implemented to conduct simulations, with specific analyses performed under tropical weather conditions in Sanya, China. Key parameters, including PCM thickness and phase change temperature (PCT), are optimized to maximize energy efficiency. Results demonstrate that for effective thermal management, 40 mm PCM layer with a PCT of 45°C prove to be efficient during summer months, enabling superior heat absorption and nighttime recovery. Furthermore, a thickness of 60 mm and a PCT of 35°C achieve optimal performance, yielding a 5.10% increase in annual energy generation. From the material optimization perspective, the ideal PCT varies depending on PCM thickness, with higher PCTs being advantageous when balancing material usage and structural load constraints. These findings not only validate the model’s practicality but also highlight its dual role in advancing carbon-neutral building design and PV durability.
Introduction
Building Integrated Photovoltaic (BIPV) systems is a promising solution to reduce energy consumption and enhance building sustainability (Taşer et al., 2023). These systems offer the dual advantage of generating electricity while functioning as building components (Kuhn et al., 2021), which makes BIPV a key technology in the sustainable urban development (Chen et al., 2024). Among various BIPV applications, Roof Integrated Photovoltaic (RIPV) have gained particular prominence due to their economic viability, ease of installation, and maintenance efficiency (Jung et al., 2021). Compared to other BIPV installations such as walls and windows, RIPV demonstrate superior power generation efficiency owing to their optimal exposure to solar radiation (Panagiotidou et al., 2021). In China, the carbon mitigation potential of rooftop PV is estimated to reach 3–4 billion tons (Zhang et al., 2023). RIPV are increasingly adopted across various sectors, including both residential (Cuesta-Fernández et al., 2023; Wang et al., 2022) and commercial buildings (Ghaleb and Asif, 2022a, 2022b), contribute to global carbon reduction goals (Kapsalis et al., 2024).
In the context of RIPV, flexible PV panels offer distinct advantages particularly in terms of weight reduction and installation flexibility. Conventional rigid PV systems exhibit several limitations in BIPV applications despite their widespread adoption (Dai et al., 2019). One of the most significant challenges lies in their substantial weight, with glass crystalline silicon PV modules typically exhibiting self-weight of up to 11
Temperature-induced efficiency degradation represents a ubiquitous challenge across various PV systems, wherein the power conversion efficiency can decrease by around 0.40%–0.50%/°C (Ebhota and Tabakov, 2023) against temperature rise (Sun et al., 2022). This issue is particularly pronounced in RIPV systems due to their integration with building surfaces (Gok et al., 2020), which results in poorer heat dissipation compared to traditional rooftop PV systems. Especially in hot climate, the roof integration can reduce the annual energy production by more than 5%, and the high temperature could cause accelerated degradation of PV panels (Poulek et al., 2018). To address this, various cooling methods in terms of active and passive techniques have been proposed (Maleki et al., 2020). Active cooling involves the installation of mechanical devices such as blowers or pumped water systems (Elminshawy et al., 2019), which tends to increase system complexity despite their potential for heat energy reuse (Siecker et al., 2017; Sun et al., 2024; Wang and You, 2023). In contrast, passive cooling technology offers an effective alternative of cooling PV modules without consuming additional energy (Mahdavi et al., 2022). As a result, passive cooling methods are a key research area for improving BIPV performance and is potential in real engineering applications.
Phase Change Materials (PCMs) represent one promising passive cooling solution (Dwivedi et al., 2020) since it can absorb substantial amounts of heat while maintaining a constant temperature during phase transition (Luo et al., 2022). Therefore, it has certain applications in temperature regulation of photovoltaic cells (Ma et al., 2019; Michael Joseph Stalin et al., 2022) and building thermal performance control (Huluka and Muthulingam, 2025; Staszczuk and Kuczyński, 2021). However, current research on its application in the BIPV field remains relatively limited, where weight and thermal management constraints are stricter. Key parameters such as phase transition temperature (PCT) and PCM layer thickness significantly influence system performance, with studies emphasizing climate-specific optimization (Karthick et al., 2018, 2020; Park et al., 2014) in specific climatic region.
Numerical modeling plays a vital role in evaluating PCM behavior (Souayfane et al., 2018), when conducting long-term simulations, simplified mathematical models such as energy balance model can be a more computationally efficient approach (Kant et al., 2020). While numerical methods like Computational Fluid Dynamics (CFD) can achieve high accuracy in temperature distribution analysis (Malvi et al., 2011), they are often impractical for long-term simulations due to high computational costs. In contrast, simplified models are more suitable and thus ideal for simulating annual performance of PV-PCM systems (Zhao et al., 2019). Román et al. (2024) assessed the importance of thermal conductivity and the shape of the enthalpy-temperature relationship when modeling the performance of latent heat storage units. Taqi Al-Najjar and Mahdi (2022) proposed a mathematical model based on an exact five-parameter photovoltaic model coupled with a well-established photovoltaic/thermal network. Elarga et al. (2016) developed a physical-mathematical model to simulate the dynamic thermal behavior of a double skin façade integrated PV layer and PCM layer. The most suitable materials and configurations to optimize system efficiency can be identified in varying environmental conditions.
This study aims to (1) establish a computationally efficient thermal model for Roof Integrated Flexible Photovoltaic systems with Phase Change Materials (RIFPV-PCMs) systems, (2) identify optimal PCM parameters for tropical climates, and (3) demonstrate how PCM integration mitigates efficiency loss while extending PV lifespan. The composition of this paper is organized as follows. Section 2 introduces the mathematical framework, detailing the development of the thermal model based on a thermal balance approach. Section 3 presents the results of the numerical simulations, focusing on the temperature and energy performance of the RIFPV-PCM systems. Section 4 provides an in-depth performance analysis, evaluating the thermal behavior and energy-saving potential of the systems under the specific climatic conditions of Sanya. Finally, key findings and useful values are summarized in the Conclusion. By providing insights into thermal behavior of RIFPV-PCM systems, this work introduces a computational framework that bridges the gap between theoretical accuracy and practical feasibility. By coupling energy balance modeling with climatic adaptability analysis, our approach not only optimizes PCM selection but also aligns with broader sustainability goals.
Mathematical modeling
The mathematical modeling of the RIFPV-PCM assembly is presented, focusing on its structural configuration, heat transfer mechanisms, and material properties. Figure 1 illustrates the cross-sectional configuration of the RIFPV assembly installed on a concrete substrate, with heat transfer pathway annotated. Given the negligible impact of horizontal heat transfer on the overall thermal performance, this study exclusively focuses on the vertical heat transfer mechanism. The structure comprises three functional strata from top to bottom: (1) a 3.2 mm flexible PV layer with ethylene-vinyl acetate copolymer (EVA) and polyethylene terephthalate (PET) encapsulation instead of glass, (2) a PCM layer, whose thickness is treated as one of the key variables in the simulation and (3) a 120 mm concrete roof. The properties of the materials are summarized in Table 1.
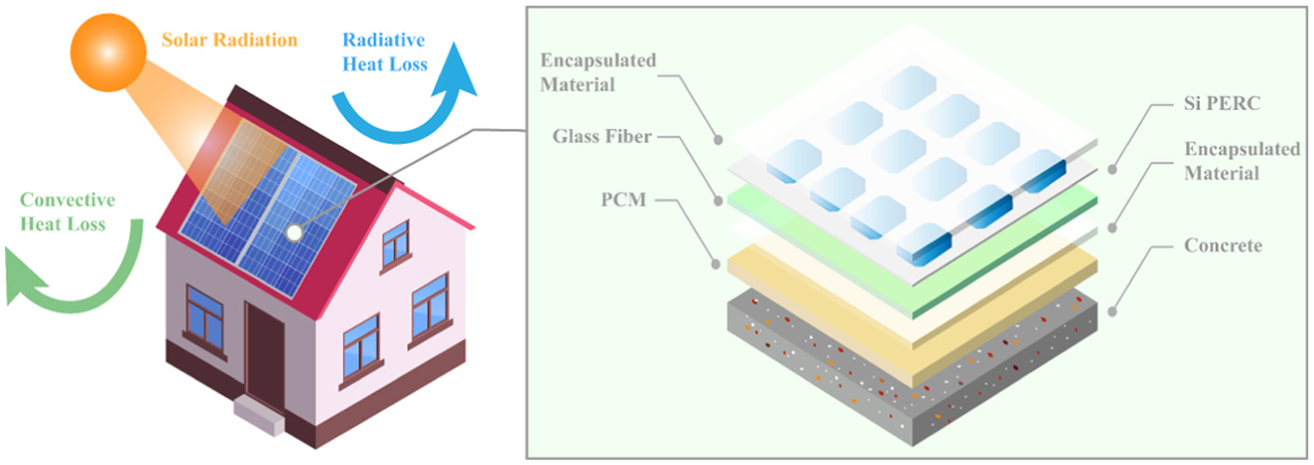
RIFPV-PCM configuration and heat transfer pathway.
Material properties of flexible high-efficiency PV compositions.

This RIFPV-PCM assembly is designed for integration into various concrete structures such as residential buildings, educational facilities, and commercial establishments. This system aims to contribute to renewable energy adoption and enhance energy resilience in urban and suburban areas. Compared to traditional rooftop PV systems, the RIFPV assembly eliminates the requirement for steel support structures, which could reduce the roof load and create space for PCM integration. The incorporated PCM is intended to serve dual functions: (1) regulating the PV module temperature to potentially enhance power generation efficiency and slow aging processes, (2) mitigating indoor thermal fluctuations by absorbing excess heat.
Thermal model
Heat transfer process
The modeling concept is based on heat balance. The reference PV systems used are mainly based on the temperature model (Jones and Underwood, 2001) and the BIPV thermal model (Anderson et al., 2009). At the system’s boundary, the heat exchange between the PV-PCM system and the external environment can be expressed as equation (1). The system absorbs solar radiation and converts a portion into electricity, while the majority is turned into thermal energy. Additionally, the system exchanges heat with the environment through long-wave radiation and convection.
where
Thermal exchange associated to the sky longwave radiation can be related to an effective sky temperature and energy simulations use models able to estimate the temperature of the sky (Evangelisti et al., 2019). The radiative heat exchange can be expressed as a function of the effective sky temperature given as equation (2), and the sky temperature can be calculated as equation (3).
where σ is the Stefan–Boltzmann constant,
where
Only heat transfer on the front and rear surfaces of the system is considered in the thermal model since the heat transfer in the rest of the area has a negligible impact on the overall calculation. At the front surface, both forced and natural convection should be taken into account. However, at the rear surface, only free convection is a significant factor, given that it is at the interior of the building (Remund et al., 2020).
where
Most of the equations used to calculate the forced convection coefficient currently are empirical equations of the general form:
where V is the wind speed. In this model, the parameter values proposed by Watmuff (a = 2.8, b = 3.0) are adopted, which represent one of the most widely used formulations in the field. These values were derived as a refinement of Jurges’ equations, addressing the potential overestimation caused by the inclusion of free convection and radiation effects.
An approximation is used to calculate the free convection coefficient:
The overall value of h taking into account the combined forced and free convection is estimated using the equation proposed by Churchill as it is valid for inclined surfaces (Kaplani and Kaplanis, 2014):
Power generation
The power generated by PV can be calculated as:
where η is the efficiency of PV cell, is usually considered to be approximately linear with the temperature:
where
Phase change process
For the phase change process, the enthalpy method is used for simulation in this model. The enthalpy method uses enthalpy as the dependent variable and the mathematical description is as follows:
where H is the total enthalpy of the sum of specific and latent heat.
Instead of tracing the liquid-solid front explicitly, this method introduces the concept of liquid fraction, which allows to solve the temperature by iterating between the enthalpy change and the liquid fraction. The general form of the liquid fraction
where
The change in physical properties of PCM during the phase change process can also be expressed in terms of liquid fractions, for instance, the thermal conductivity can be expressed as:
One of the most important properties of the PCM in enthalpy method is the enthalpy-temperature relationship. The actual relationship is often nonlinear, and in order to simplify the iterative process, it can be approximately simplified into isothermal, linear, piecewise functions, etc. In this model, the simplification to piecewise function based on actual measurements is chosen (Figure 2).

Enthalpy-temperature relationship curve of PCM.
PCM selection criteria
In this simulation, the environmental conditions of Sanya were selected to evaluate the applicability of PCMs in tropical climates, as defined by the Köppen climate classification system. Sanya (18°15′ N, 109°30′ E), located on the southern tip of Hainan Island, is characterized by distinctive climatic features, including consistent year-round warmth with minimal temperature fluctuations and substantial solar radiation throughout the year. As a coastal city, Sanya experiences high humidity levels throughout the year. The region also features significant topographic diversity, with an average elevation of 168 m and local elevation differences exceeding 1000 m.
The necessary environmental parameters for the simulation, comprising wind velocity, ambient temperature and solar radiation, were obtained from the Meteonorm global climatological database (Remund et al., 2020). As illustrated in Figure 3, Sanya maintains a relatively constant temperature of around 20°C even in winter. The solar radiation profile reveals abundant sunlight, offering a strong resource for RIPV systems. However, the period from August to November exhibits fluctuations in daily maximum solar radiation intensity, primarily attributable to the rainy season in Sanya, which may affect the power generation capacity of RIPV systems during this period.

Environmental conditions for simulation.
The high levels of solar irradiance in Sanya result in substantial photovoltaic energy generation potential, but also lead to substantial temperature-related efficiency losses in PV systems. These conditions present an optimal scenario for assessing PCM’s capability in mitigating temperature-induced efficiency losses and optimizing energy performance in tropical environments.
For the reference PV system without PCM, simulations were conducted during two consecutive clear days in each season, with the resulting battery temperature profiles presented in Figure 4. The data reveal that PV panel temperatures frequently exceed 60°C during spring and summer seasons, demonstrating the critical need for effective thermal management strategies. Even during winter months, maximum panel temperatures can reach 40°C, indicating the persistent relevance of temperature regulation throughout the year in this tropical climate.

Simulated PV temperature without PCM.
Taking the summer situation as the control condition, the selection of PCM PCT (25°C, 30°C, 35°C, and 40°C) for simulation was based on comprehensive thermal performance considerations specific to Sanya’s climate. The lower threshold of 25°C was determined by the temperature coefficient characteristics of photovoltaic cells, below which efficiency impacts are negligible. The upper limit of 40°C was established through thermal analysis of PCM performance under tropical conditions, beyond which the PCM may not be able to absorb and store heat effectively, thus failing to provide the desired cooling effect for the PV system. Within this temperature range, the study aims to identify the optimal PCT for PCM implementation in the Sanya region.
When selecting PCMs, key properties to consider include latent heat, specific heat capacity, and thermal conductivity (Abass and Muthulingam, 2025; Bhamare et al., 2020). In this study, paraffin wax was chosen due to its widespread application, broad PCT range, and high latent heat value (210 J/g). Other relevant thermal properties are summarized in Table 1. Paraffin wax exhibits both high latent heat and specific heat capacity, making it particularly suitable for temperature regulation under mass constraints, a critical factor given the limited load capacity of rooftops.
Numerical solution
The thermal model for the RIFPV-PCM system was solved numerically in MATLAB using a stepwise iterative approach, and the flowchart of the solution process is depicted in Figure 5. The required parameters for the solution include material properties of the RIFPV-PCM system, as well as environmental conditions, among others. Subsequently, the nodes are discretized based on the different material layers. The solution procedure proceeds with time-stepping, and at each node, the temperature

Flow chart of the solution process.
The efficiency of the model lies in its systematic and iterative approach, which facilitates rapid and accurate computation of temperature distributions within the RIFPV-PCM system over a specified time period.
Results and discussions
Seasonal temperature performance
Two consecutive sunny days in all seasons were selected for simulation in order to comprehensively analyze the temperature regulation effect of PCM on PV systems, as well as the subsequent recovery of the system during nighttime. The simulated temperature profiles for varying PCM thicknesses and PCT under summer conditions in Sanya are presented in Figures 6 and 7.
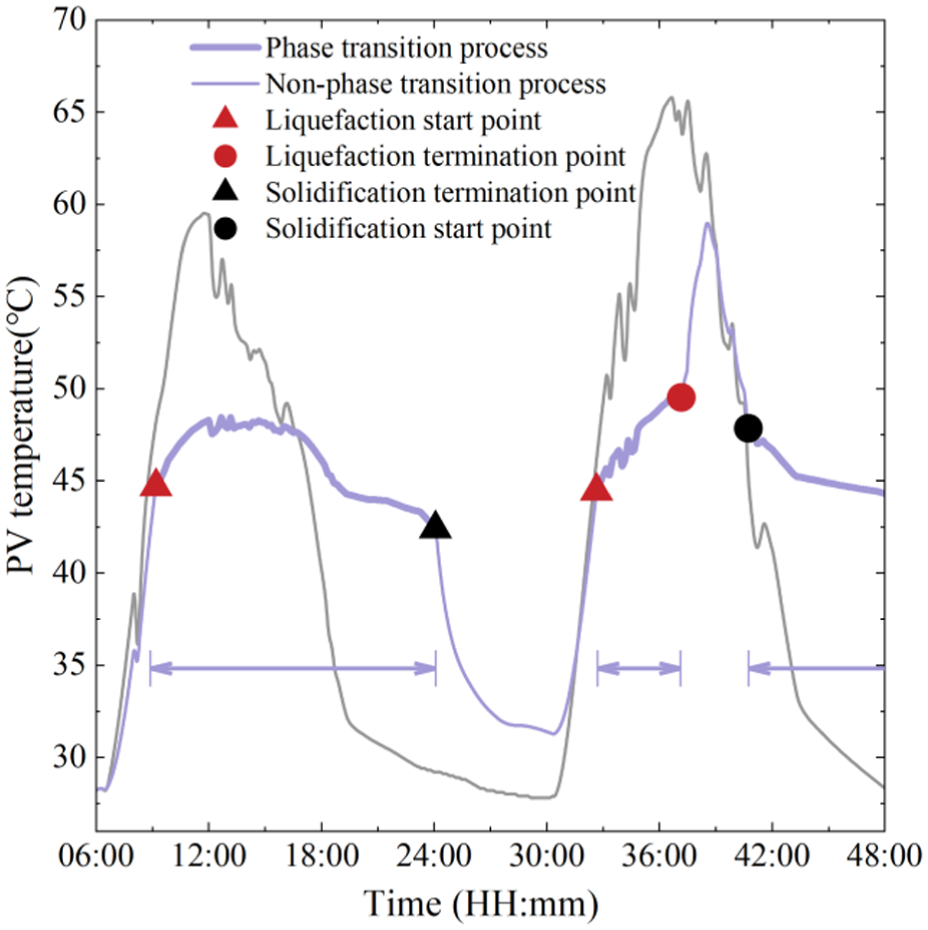
Simulated PV temperature with PCT of 45°C in summer in Sanya with PCM thickness d = 20 mm.

Simulated PV temperature with different PCT in summer in Sanya with PCM thickness d = (a) 40 mm, (b) 60 mm, (c) 100 mm.
A layer thickness of 20 mm and a PCT of 45°C is used as an example in Figure 6, where the labels used in the temperature curve are explained in detail, and the starting and ending points of the phase transition process are identified. Under the given weather conditions, the PCM begins to melt around 9:00 AM on the first day, providing temperature regulation throughout the day. By around 1:00 AM, the PCM fully solidifies, regaining its regulating capacity. On the second day, melting resumes around 9:00 AM, but by around 1:00 PM, the absorbed heat exceeds the material’s latent heat capacity, resulting in complete melting. The temperature rises rapidly, and by around 5:00 PM, the PCM begins to solidify again.
The summer ambient temperature exceeding 28°C leads to the complete melting of the PCM with a PCT of 25°C. The temperature curve for this PCM configuration shows only a slight reduction in slope compared to the reference PV system, mainly due to the PCM’s relatively high specific heat capacity. This observation highlights that its temperature regulation capability is significantly reduced when the PCM is fully melted and its phase transition is no longer active. It is worth noting that the PCM system’s temperature during the afternoon exceeds that of the reference PV system due to the thermal lag caused by latent heat absorption.
A critical finding of this study is that the PCT of the PCM plays a crucial role in its temperature regulation effectiveness. Higher PCT reduces the heat absorption required to maintain the PV system’s temperature within the phase change range, enabling the use of thinner PCM layer. For instance, under the 2-day simulation conditions, PCMs with PCT of 45°C, 40°C, and 35°C required thickness of 40, 60, and 100 mm, respectively, to achieve effective temperature control. This suggested that selecting a PCM with a higher PCT can minimize material usage. However, this strategy must be balanced against the potential underutilization of the PCM’s latent heat capacity, which could lead to suboptimal thermoregulation performance. Specifically, higher PCT may prevent the PCM from fully exploiting its latent heat storage potential, thereby reducing its overall thermal energy management efficiency.
Furthermore, the system’s thermal dissipation design is critical to PCM’s recovery performance. In the current configuration, a thick concrete layer behind the PCM significantly hinder heat dissipation with relatively low thermal conductivity. This contrasts with systems where the PCM layer is exposed to ambient air or integrated with water circulation systems, which facilitate more effective cooling. The limited heat dissipation capacity has a significant impact particularly in hot climates, where incomplete recovery can degrade system performance and reduce overall efficiency.
When the PCM layer thickness is 100 mm (Figure 7(c)), a PCM with a PCT of 30°C demonstrates effective temperature regulation on the first day but struggles to recover heat during the night. This is due to the PCM’s PCT being close to the ambient temperature, resulting in a limited heat dissipation rate and thereby hindering the solidification process. By the afternoon of the second day, the PCM has absorbed more heat than its latent heat capacity, leading to a rapid temperature increase. This underscores the limitations of using PCs with PCT too close to the ambient temperature, as they may fail to provide adequate temperature regulation. Conversely, PCMs with PCT of 35°C and 40°C can maintain effective temperature regulation over 2 days. However, in these cases, the system does not fully cool and solidify during the night, which may reduce their effectiveness under prolonged heat exposure.
For PCM with a PCT of 45°C, a 40 mm thickness provides optimal performance, enabling sufficient latent heat storage for two consecutive days of temperature regulation. The PCM layer fully solidifies by around 2:00 AM, ensuring readiness for the next cycle. However, increasing the thickness beyond this point diminishes returns in recovery performance. Despite the increased PCM mass, the solidification time does not decrease substantially, as the total amount of absorbed heat remains constant. This indicates that beyond a certain thickness, additional PCM material offers limited improvements in recovery time, and system performance may plateau.
In other seasons in Sanya, the highest temperatures and duration of PCM-based temperature regulation are summarized in Table 2. During spring and autumn, the daily maximum solar radiation remains high, and PV panel temperatures can reach levels comparable to summer under clear skies, necessitating temperature regulation. However, shorter daylight hours in these seasons allow for thinner layers to achieve effective regulation. Additionally, lower ambient temperatures significantly reduce the PCM’s nighttime recovery time, enhancing its sustainability compared to summer performance.
Temperature regulation effect of different PCM.

HT: highest temperature; DR: duration of regulation.
In winter, both solar radiation and ambient temperature are lower, with PV panel temperatures reaching around 40°C under clear skies. Although energy losses due to temperature rise are reduced, PCMs still plays a role in temperature regulation. PCMs with PCT of 40°C or higher are nearly ineffective, while those with lower transition temperatures requires minimal thicknesses. For example, a PCM with a PCT of 25°C requires a thickness of 4 mm, whereas others need only 2 mm.
These findings emphasize the need for an optimal balance between PCM thickness, PCT, and heat dissipation capacity to achieve efficient temperature regulation and recovery. Further research into advanced PCM configurations, such as multilayered systems or enhanced heat dissipation mechanisms, could improve the long-term performance under diverse climatic conditions.
Seasonal energy performance
The temperature regulation effects of PCM on the PV system directly influence power generation efficiency. By examining the energy output curves over the 2-day period, the significant role of PCM in mitigating temperature fluctuations and enhancing the efficiency becomes evident.
The simulated PV power output during summer in Sanya is shown in Figure 8(a). For the reference PV system without PCM, peak outputs of 143 and 132 W occurred at 1:14 PM and 1:00 PM on the first and second days, respectively. In contrast, the PCM-integrated system achieved higher outputs, with the 30°C PCM reaching 168 W at 12:40 PM on the first day and the 40°C PCM achieving 156 W at 12:40 PM on the second day. Figure 8(b) demonstrates the power output increase due to PCM regulation. The maximum increases over the 2 days were 27.4 and 24.4 W. On the first day, all PCM materials except the 25°C PCM, which fully liquefied under ambient conditions, effectively regulated temperature. Lower PCT materials (e.g. 30°C and 35°C) contributed to higher power increases during the morning, with a 5°C reduction in PCT yielding an additional 5 W of power at 12:00 PM. For the 30°C PCM, while it fully liquefied around 4:00 PM, the lower solar radiation during this period reduced its impact on overall power regulation.
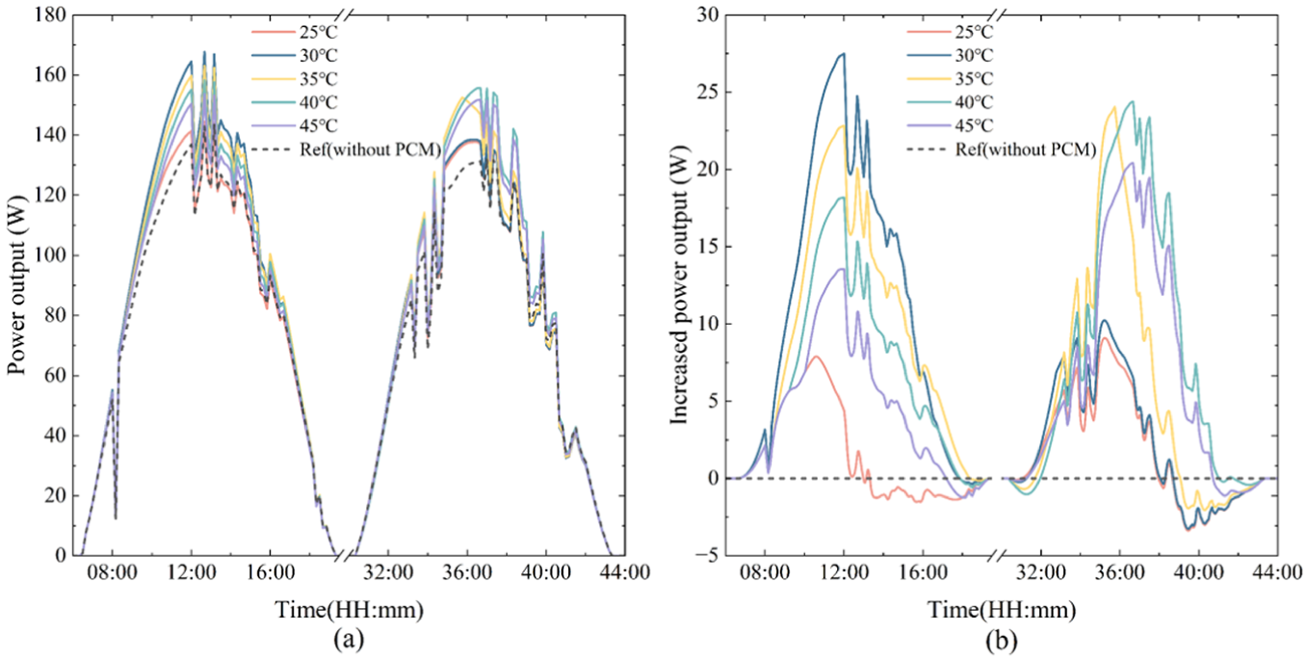
(a) Simulated power output (W; summer, d = 60 mm) and (b) increased power output (W) compared with reference PV system.
On the second day, materials with lower PCT began to fail, highlighting the superior sustainability of higher PCT PCMs. For instance, the 35°C PCM fully liquefied around 12:00 and losing its regulating effect during the critical midday period. This contrasts with the 30°C PCM, which failed around 16:00 on the first day, underscoring the importance of maintaining temperature regulation during midday for optimal performance.
Negative power increases were observed during certain periods, primarily due to the increased specific heat capacity of the PCM-integrated system, which caused a lag in the temperature curve. Fully liquefied PCMs acted as a high-specific-heat-capacity substance, reducing power output in the afternoon. In contrast partially liquefied PCMs shifted higher temperatures to the evening when PV panels were inactive, resulting in only minor negative impacts near sunset and sunrise.
Figure 8(b) also reveals a dynamic relationship between PCT and power regulation. Lower PCT materials contribute more to morning power increases but were limited by early liquefaction in the afternoon. Conversely, higher PCT materials, though slower to activate, provide more consistent regulation during the critical midday period, particularly on the second day. This emphasizes the importance of selecting PCMs with appropriate PCT to balance early activation with sustained performance.
The total energy output increase over 2 days, influenced by different PCMs, is shown in Figure 9(a). For thin PCM layers, higher PCT contribute more significantly to energy output. However, as thickness increased, the rate of energy output growth slowed down substantially after reaching a critical value, corresponding to the full utilization of the PCM’s regulation. In simplified calculations that neglect the effect of specific heat, this value can be approximately regarded as the maximum energy output increment achievable at the given PCT.
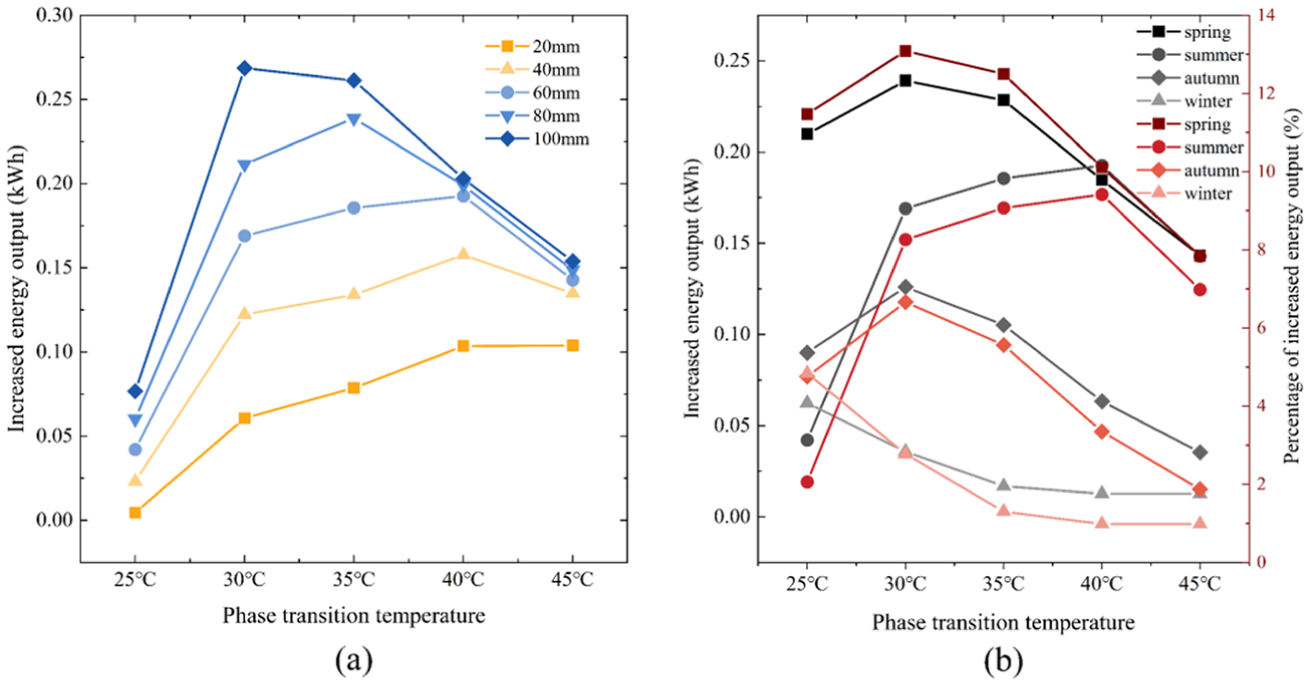
(a) Increased energy output (kWh) in 2 days compared with reference PV system in summer and (b) increased energy output (kWh) in different seasons with d = 60 mm.
Thus, with increasing PCM thickness, materials with higher PCT reach their maximum potential first, while materials with lower temperatures continue to grow until they also reach their maximum. The reference PV system’s total energy output over 2 days is approximately 2.05 kWh. For a PCM layer with 20 mm thickness, the highest energy output increase is achieved with the 45°C PCM of 0.10 kWh, while a 40 mm layer reached a maximum increment of 0.14 kWh, representing a 6.8% efficiency improvement. Similarly, a 60 mm layer with a 40°C PCM achieves its maximum increment of 0.20 kWh, corresponding to a 9.8% efficiency improvement. These results suggest that under conditions where PCM thickness is unrestricted, the lowest PCT slightly above ambient conditions is theoretically optimal. However, in practical applications, economic factors and roof load capacity must also be considered, necessitating certain limitations on PCM thickness.
Figure 9(b) compares energy output increments across seasons for a 60 mm (the basis for this thickness selection will be discussed in detail in Section 4) PCM layer. In summer, the 40°C PCM achieved the highest energy output increment, with a 9.4% efficiency improvement. During spring and autumn, the optimal PCT decreased to 30°C, reflecting moderate ambient temperatures and comparable solar radiation. In winter, the optimal PCT further decreases to 25°C, with a relatively low efficiency improvement of 4.8%. Despite smaller increments in winter, appropriate PCM selection still enhanced system performance. Seasonal variations in energy output reflect the critical role of PCMs in year-round applications. In summer, higher PCT are required to adapt to the hot environment, while spring and autumn benefit from moderate climatic conditions, resulting in relatively superior thermal regulation effects. Even in winter, well-chosen PCMs contribute to thermal regulation, albeit with smaller efficiency gains.
In summary, the optimal PCT varies seasonally, depending on ambient temperature and solar radiation. For year-round BIPV system designs, regional climate characteristics should be considered. PCM selection should balance summer’s high-temperature performance with the efficiency of spring and autumn, while adjustments to PCM thickness ensure adequate thermal regulation in winter, ultimately optimizing annual energy efficiency.
Annual energy performance
In preceding analyses, which focused on specific 2-day periods, provided detailed insights into the temperature regulation effects of PCMs under controlled conditions. To further generalize these findings and enhance their applicability, the investigation has been extended to a year-round simulation. This approach enables a comprehensive evaluation of PCM performance across seasonal variations and PCT, with a particular emphasis on Sanya as a representative low-latitude region.
The seasonal analysis reveals that Sanya exhibits the most significant energy increment attributable to PCMs, with a peak of 2.20 kWh in May (Figure 10). Sanya maintains a relatively stable energy-saving effect throughout the year, with a notable persistence of PCM efficacy even during winter months. The minimal energy increment observed in October, at 0.76 kWh, still underscores the substantial benefits of PCMs in this region.
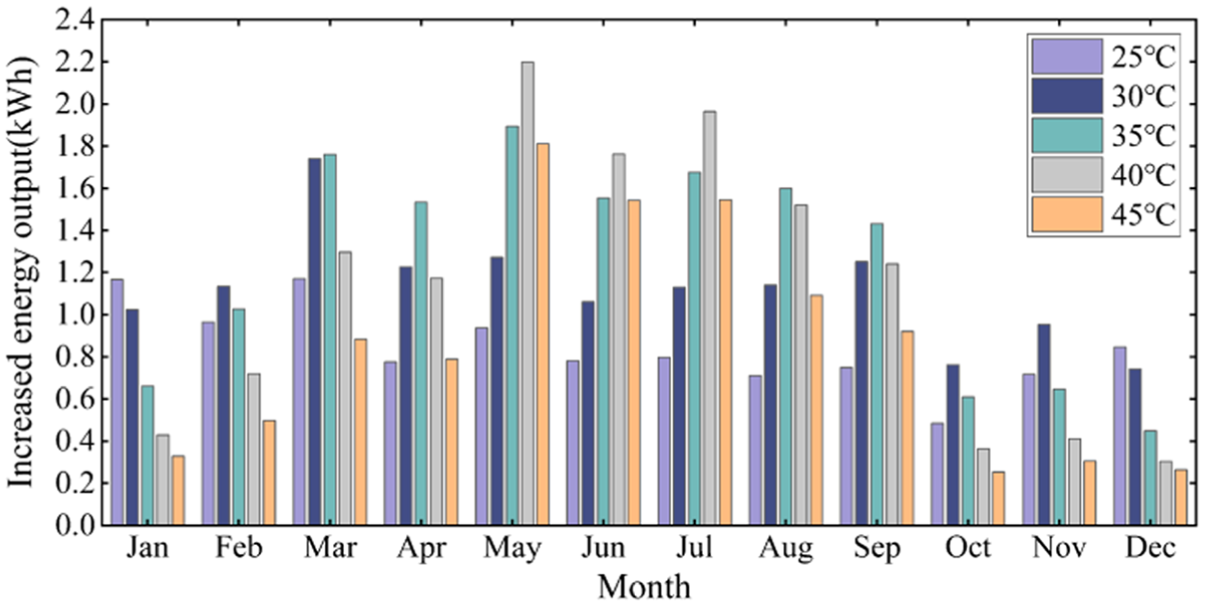
Monthly increased energy output (kWh) over a year with different PCT.
Regarding optimal PCT, PCMs with a 45°C PCT demonstrates limited effectiveness due to their constrained upper control threshold, making them unsuitable for any month in this RIFPV system. In Sanya, high temperatures and abundant sunlight allow materials with PCT of 35°C and 40°C to fully exert their thermal management effects, resulting in the highest energy gains in the seven hottest months. Conversely, lower PCT PCMs (25°C and 30°C) show better performance during cooler months; however, their overall annual effectiveness is reduced due to lower solar resource availability during these periods.
Performance analysis
Optimization analysis
The integration of PCMs into photovoltaic systems deployed in Sanya has demonstrated significant potential for enhancing temperature regulation and energy production. By analyzing simulation results in the context of local climatic conditions and operational requirements, the PCT and thickness of PCMs can be optimized to maximize system performance.
The simulation results indicate that the annual electricity generation is 291.3 kW with temperature-induced energy losses amounting to 44.7 kWh. If the temperature of the photovoltaic cells could be effectively maintained below 25°C, completely mitigating the losses attributable to temperature rise, the energy yield would increase by 15.3%. These findings underscore the critical role of efficient temperature control in enhancing photovoltaic energy conversion and reducing energy losses, with PCMs serving as a key component in achieving these improvements.
As the thickness of the PCM increases, the simulation results (see Figure 11) reveal a progressive enhancement in energy output. It is critical to note that while thicker PCMs improve thermal regulation, excessively thick materials may reduce thermal conductivity due to increased specific heat capacity, potentially compromising temperature regulation efficiency. Nonetheless, in the studied systems, which feature relatively thick concrete backplates rather than air gaps, the heat dissipation capability is inherently limited. Consequently, further increasing PCM thickness does not lead to substantial negative effects, but the performance gain diminishes with further increases in thickness. For instance, the energy output increase from 20 to 60 mm is substantially greater than the increase from 60 to 100 mm, suggesting diminishing returns with respect to material thickness. Hence, the selection of PCM thickness should strike a balance between performance gains and associated costs.
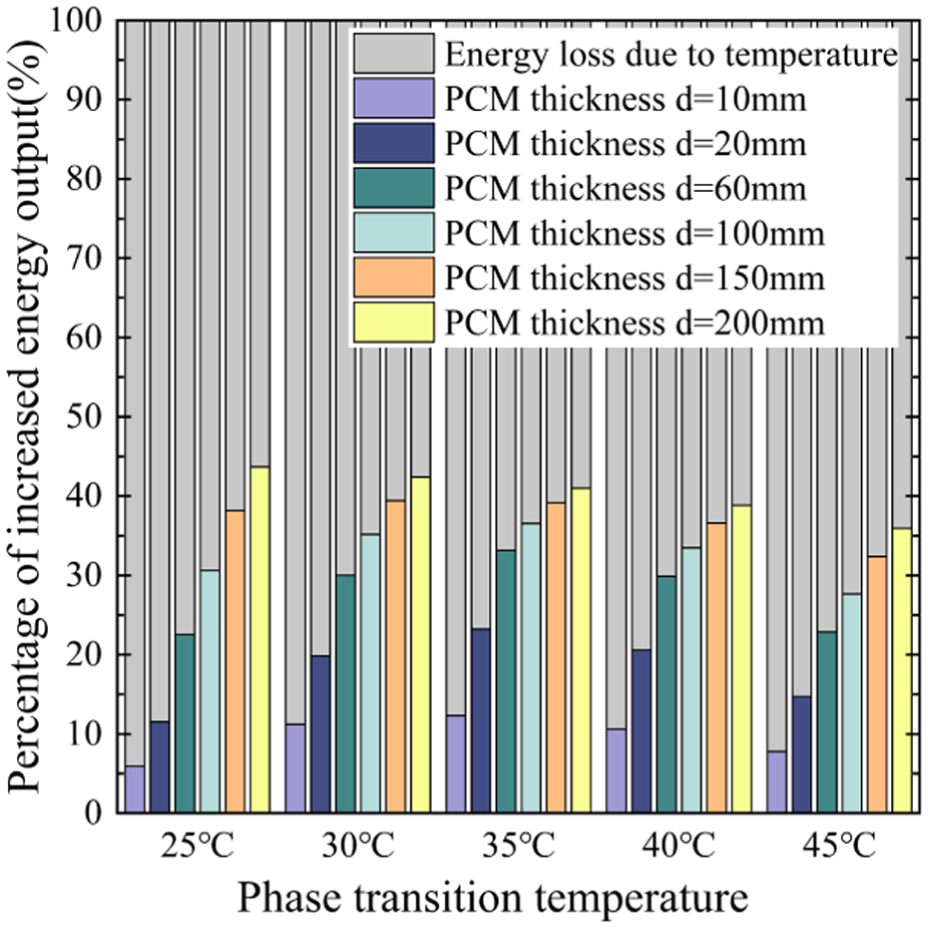
Increased energy output compared with reference PV system’s energy loss due to temperature per year.
Moreover, for non-occupiable rooftop photovoltaic systems, the standard load design is typically 0.5 kN/m2. Based on these parameters, it is determined that PCM thickness should be capped at 60 mm. This constraint not only satisfies the load-bearing requirements for buildings but also ensures optimal system performance while avoiding the added structural burden of excessively thick materials. Therefore, a PCM thickness of approximately 60 mm strikes an effective balance between enhanced thermal regulation, structural integrity, and economic feasibility.
In addition to thickness, the PCT plays a crucial role in improving the system’s efficiency. As illustrated in Figure 11, the optimal PCT varies with different thicknesses. Specifically, for a substantial thickness of 200 mm, the optimal PCT is determined to be 25°C. However, under the previously identified optimal thickness condition of 60 mm, a PCT of approximately 35°C proves to be most effective in minimizing generation losses induced by temperature elevation. This particular configuration enhances energy production efficiency by effectively mitigating overheating issues.
In conclusion, the careful selection of PCM properties—both PCT and thickness—can greatly enhance the energy output and adaptability of photovoltaic systems. In tropical regions like Sanya, where temperature-induced energy losses are more pronounced, PCMs significantly boost energy yields. By considering both regional climatic characteristics and system-specific requirements, an optimized PCM configuration can maximize photovoltaic system efficiency while minimizing unnecessary costs and resource consumption.
Economic analysis
The Static Payback Period (SPP) is a commonly used capital budgeting metric that estimates the time required to recover an initial investment, starting from the project’s construction. Due to its simplicity, the SPP is widely used in both technical and economic analyses. For Phase Change Material (PCM) applications, the SPP can be calculated using the following equation (Mi et al., 2016):
where SPP represents the static payback period,
The SPP calculation process for PCM integration is shown in Table 3. In Sanya, the cost of electricity for residential consumption at voltages above 1 kV is 0.5883 yuan per kWh. The market price of paraffin wax, the PCM used in this study, is approximately 30 yuan per kg. It is important to note that this economic analysis is a basic assessment. Other factors, such as maintenance costs, potential PCM leakage, and degradation of PCM performance over time, have been excluded from the analysis.
Cost and economic characteristics of PCM integration.

The calculations reveal that, due to the relatively high cost of PCM, the investment cannot be recouped within the typical lifespan of the system. Additionally, the use of thinner PCM layers offers a more economically viable option. However, it is essential to consider that the price of materials is expected to decrease as technology advances, which could improve the economic feasibility of PCM applications in the future.
Moreover, while the SPP indicates a long payback period, it is crucial to highlight the potential long-term benefits of PCM integration beyond just the financial aspect. One such advantage is the ability of PCM to regulate temperature more efficiently, which not only increases the energy output of the PV system but could also contribute to the extended lifespan of the solar panels. By preventing excessive temperature fluctuations, PCM can help reduce thermal stress, thereby improving the overall durability and performance of photovoltaic panels over time.
As the adoption of green energy technologies continues to grow, the environmental and operational benefits—such as enhanced panel longevity and increased energy output—should be weighed alongside the initial financial investment. With advancements in material science and economies of scale, the cost-effectiveness of PCM applications is likely to improve in the coming years, making it a promising option for sustainable energy solutions.
Conclusions
This study investigates temperature mitigation and energy improvement using phase change materials for building roof integrated flexible photovoltaic in tropical weather condition. A theoretical thermal model is proposed on the basis of the general thermal balance that can simultaneously ensure the computational efficiency and suitable accuracy. The significant factors are taken into consideration to evaluate thermal and electrical performance of building roof integrated flexible photovoltaics with PCMs. Numerical simulations were conducted with new computational program under actual environmental conditions, initially focusing on two consecutive sunny days across all seasons to analyze the performance of the RIFPV system, followed by an assessment of annual energy-saving potential. Some typical observations and useful conclusions are summarized as follows.
For thermal regulation, PCMs with higher phase transition temperatures demonstrate effective daily temperature control at reduced thicknesses. A PCM thickness of 40 mm with a PCT of 45°C achieves optimal performance in summer, ensuring effective heat absorption and nighttime recovery.
For annual energy performance, the simulation results under Sanya’s climatic conditions reveal that a PCM thickness of 60 mm with a phase transition temperature of 35°C achieves optimal performance, resulting in a 5.10% increase in annual energy generation.
For material optimization, the optimal phase transition temperature varies with different PCM thicknesses, the utilization of PCMs with higher phase transition temperatures is recommended when considering the constraints of material usage and structural loading.
Generally, this study can provide valuable insights for the design and optimization of RIPV systems via PCMs, particularly the mitigation of temperature-induced efficiency losses in PV systems and energy enhancement performance in tropical climates. Although the current cost of PCM materials may prevent the full recovery of initial investments within the system’s operational lifespan, the future potential of these technologies remains promising. Future research could build upon the findings of this study to explore the broader impacts of RIFPV-PCM systems on buildings. As energy efficiency and sustainability become increasingly critical in building design, RIFPV-PCM systems may play a crucial role not only in enhancing solar energy generation but also in reducing overall building energy demands, leading to more sustainable and cost-effective solutions for the built environment.
Footnotes
Acknowledgements
The authors are grateful to the editors and anonymous reviewers for the professional comments and suggestions in improving the quality of the paper.

Author Contributions
Jinghang Zhou: Methodology, Validation, Formal analysis, Investigation, Writing-Original Draft. Jianhui Hu: Conceptualization, Methodology, Validation, Formal analysis, Investigation, Funding acquisition. Wujun Chen: Project administration, Writing-Review. Chengjun Gao: Data Curation, Investigation. Saishuai Huang: Investigation, analysis. Yi Xu: Investigation, analysis. Wanwu Guo: Investigation, analysis. Yu Liu: Investigation, analysis. Jian Lu: Investigation, analysis.
Funding
The authors disclosed receipt of the following financial support for the research, authorship, and/or publication of this article: The work was supported by National Natural Science Foundation of China (No. 52278193, 51608320, 52208489), Japan Society for the Promotion of Science BRIDGE FELLOW (No. JSPS/IP/24001), and Shanghai Municipal Administrative Committee of Housing and Urban-Rural Development (No. 2023-002-046).
Declaration of Conflicting Interests
The authors declared no potential conflicts of interest with respect to the research, authorship, and/or publication of this article.
Data Availability Statement
Some or all data, models, or code generated or used during the study are available from corresponding author by request (for research and teaching).