





Abstract
The service life of cement-based composites is significantly influenced by their internal pore structure and moisture migration behavior. This study employed low-field nuclear magnetic resonance (LF-NMR), nitrogen physisorption, and mercury intrusion porosimetry (MIP) to systematically investigate the effects of silica aerogel content (0%, 5%, 7%, and 10%) on pore size distribution, inter-pore water content, and internal moisture migration [NE1] [RC: Reviewer 1Point7] in aerogel-incorporated cementitious composites (AICs). The results show that increasing aerogel content creates extensive interfacial defects and microcracks between the hydrophobic aerogel and the hydrophilic cement matrix, forming an interconnected macropore network. Compared to the aerogel-free reference (AIC0), the porosity of AIC10 (10% aerogel) increases by 12%, accompanied by a higher proportion of macropores and enhanced pore connectivity. Despite the intrinsic hydrophobicity of aerogel, the percolating macropore network provides fast capillary pathways, leading to accelerated water transport. During water absorption, water preferentially wets the hydrophilic cement matrix and the connected macropores, whereas the aerogel particles and their surrounding hydrophobic interfacial regions remain poorly wetted. This mixed wettability results in a heterogeneous internal moisture distribution, with low-water-content areas appearing as cold tones in spatial images.
Introduction
Currently, with the increasing emphasis on energy consumption and environmental protection, the construction industry is facing the dual challenges of improving energy efficiency and reducing environmental impact (Du et al., 2022; Fu et al., 2023; Heravi et al., 2020; Liu et al., 2021a; Zoure and Genovese, 2023). As one of the effective ways to solve this problem, silica aerogel incorporated cementitious composites (AICs) formed by incorporating silica aerogel into cement-based materials have received extensive attention due to their excellent properties (Abd Halim et al., 2022; Adhikary et al., 2021; Ibrahim et al., 2014; Zhou et al., 2021). Owing to the extremely low thermal conductivity and density of silica aerogels (Duan et al., 2023; Lakatos and Csarnovics, 2020; Wang et al., 2023; Yang et al., 2023), the addition of cement-based AICs composites can significantly improve the thermal insulation performance of buildings (Hu et al., 2023; Ismail et al., 2021; Li et al., 2024a, 2024b; Liu et al., 2023; Tian et al., 2022), and help reduce the overall structural burden (Alyne et al., 2021). These advantages ensure that AICs composites play an important role in improving building energy efficiency. In particular, the application prospects of AIC materials are excellent in the context of increasingly stringent energy conservation and emission reduction policies (Shah et al., 2021a; Zhao et al., 2018).
However, although AICs have shown great potential in architecture, their durability in practical applications remains a concern (Ślosarczyk et al., 2022; Yan et al., 2021). Durability is directly related to the service life and maintenance cost of materials, which is crucial for ensuring the long-term safety and performance of buildings (Chal et al., 2018). Among the many factors affecting the durability of AICs, the pore structure and internal water transport behavior are two key factors (He et al., 2022a; Li et al., 2017a; Poyet, 2021; Xue et al., 2021; Yoon et al., 2020; Zhao et al., 2021). The pore structure not only determines the physical and mechanical properties of the material (Lagouin et al., 2019; Liu et al., 2021b), such as density (Kucharek and Yang, 2020; Subramaniam et al., 2021), compressive strength (Kim et al., 2021; Li et al., 2024b; Yue et al., 2020), and thermal stability (Chen et al., 2021; Subramaniam et al., 2021), but also affects the water transport rate inside the material (Shah et al., 2021b), thereby affecting its durability in different environments (Liu et al., 2020, 2023; Shanbin et al., 2021). Therefore, an in-depth study of the pore structure distribution and internal water transport behavior of AICs is of great significance for optimizing the design of AICs composites and improving their performance in practical applications.
In previous studies, it is common to use either nitrogen physisorption (Liang et al., 2022; Tang et al., 2022), mercury intrusion porosity (MIP; Bostanci, 2020; Cui et al., 2023), and/or low-field nuclear magnetic resonance (LF-NMR) to study the pore structure of the materials and the water transport inside the materials (Ji et al., 2017; Wang et al., 2017; Zhao et al., 2019). For example, when Liang and Yao (2023). used low-field nuclear magnetic resonance (NMR) to monitor the dynamics of water molecules in AAS pastes. They determined the pore size distribution and cumulative pore volume in the material using the MIP method and found that there were two distinct peaks between 5 and 100 nm, as well as the state and relative amount of water during the geopolymer reaction by N2 physisorption, and found that as the amount of silicate increased, the cumulative pore volume of the material decreased (Liang et al., 2023a). He et al. (2022b) investigated the pore structure of cement-based materials using LF-NMR and found that the addition of an ion-chelating agent increased the proportion of small pores and decreased the proportion of large pores in cement-based materials. In addition, it increased pore complexity and delayed water diffusion. At the same time, Xiong et al. (2019) used NMR to study the water absorption characteristics of thermal insulation composites and found that the smaller the pore size, the greater the water absorption and the faster the water absorption rate. Chen et al. (2019) studied the pore size distribution of Portland cement using MIP combined with NMR and found that the width of the pore size distribution was related to the permeability of Portland cement.
The main purpose of this study is to provide detailed information on the pore structure at different scales by combining the advantages of N2 physisorption, MIP, and LF-NMR, and to further explore the water transport process inside AICs by combining pore structure analysis with the distribution of internal water in one- and two-dimensional spaces (Babaee and Castel, 2018; Henrique Novotny et al., 2023). This comprehensive analysis method not only helps reveal the microscopic mechanism of moisture migration in AICs but also provides more direct guidance for material design and performance optimization (Kéri et al., 2020). The research results not only enrich the basic theory of AICs but also provide strong technical support for their performance optimization in practical applications. In particular, under complex conditions such as fire rescue, the results of this study are expected to provide important reference values for the application of AICs and further promote their wide application and development of AICs composites in the construction industry (Tian et al., 2022).
Experiment and methods
Experiment
Four samples of silica-aerogel-incorporated cementitious composites (AICs) with different proportions were designed to study the moisture migration behavior of AICs with different aerogel contents. The mass percentages of the aerogel were 0%, 5%, 7%, and 10%, and the corresponding samples were denoted as AIC0, AIC5, AIC7, and AIC10, respectively.
Hollow glass beads and hydrophobic silica aerogels were the raw materials used as lightweight aggregates for the AICs. Silicate cement and silica sol were used as the binders for the AICs. Silica aerogel was obtained from Ellison High-Tech Co. Ltd. (Guangdong Province, China). Hollow glass beads were supplied by Henan Sheng Cast Materials Co. Ltd. (Henan, China), whose main components included silica, alumina, zirconia, magnesium oxide, and sodium silicate, was used. Silicate cement (p.c. 42.5, following the ASTM standard C150) was obtained from Jilin Bai Shui Cement Co. Ltd. (Jiangxi, China) and a neutral silica sol (30%) from Dezhou Jinghuo Technical Glass Co. Ltd. (Shandong, China).
The details of the sample preparation of the AICs are outlined in our previous study (Yang et al., 2023). The experimental process is shown in Figure 1.
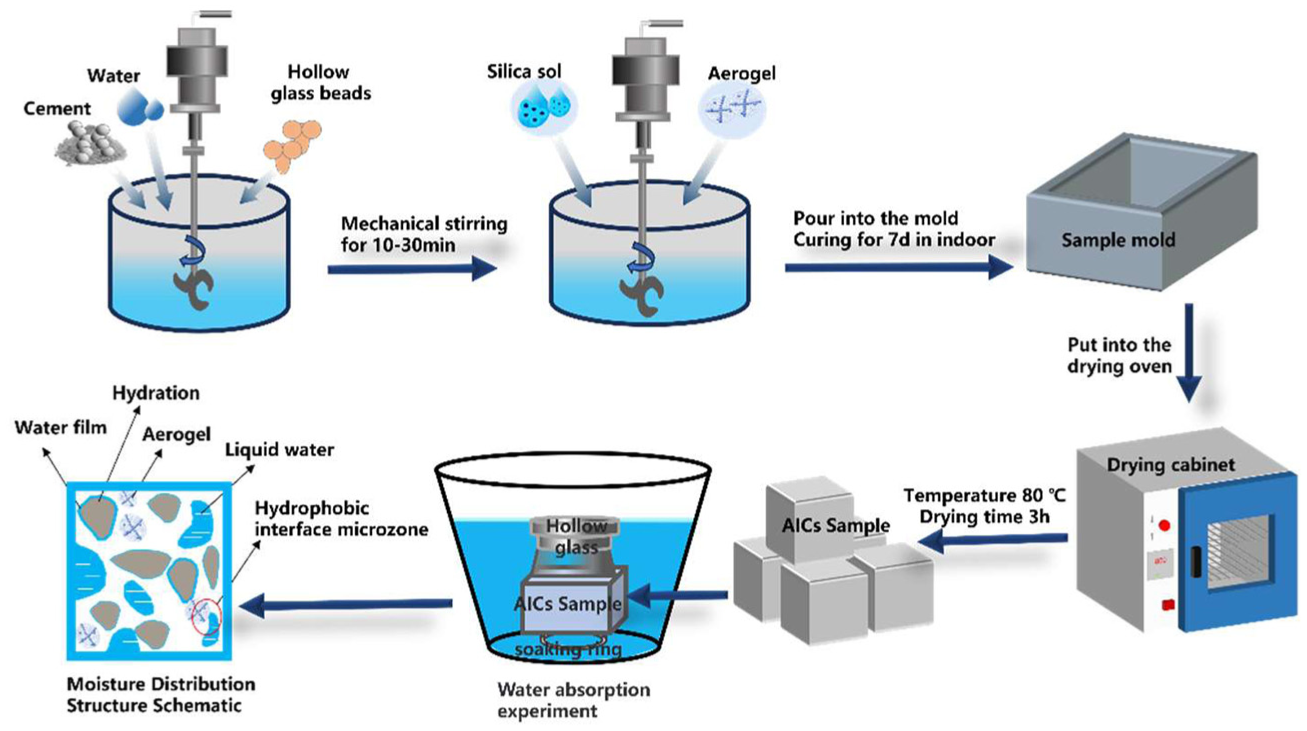
Experimental process for preparing AICs.
Testing methods
N2 physisorption
To analyze the microscale pore structure of the AICs, the nitrogen adsorption/desorption isotherms, specific surface area, average pore size, and pore size distribution of the microporous and mesoporous structures of the AICs were characterized using a Mack 2460/Kantar IQ3 automatic specific surface and porosity analyzer (Liu et al., 2021b; Tang et al., 2022). Prior to analysis, the samples were outgassed at 300°C for 8 hours.
MIP testing
Mercury intrusion porosimetry (MIP) was used to characterize the macropores in the AIC materials (Lu et al., 2020). The various AICs were dried in an oven at 105°C for 2 hours, and then the porosity, pore size, and pore size distribution of the AICs in the dry state were measured using a Micromeritics mercury porosimeter (model AutoPore IV 9500). The test ambient temperature was 26°C, and the pore size was characterized in the range of 5 nm–350 μm.
LF-NMR testing
Low-field nuclear magnetic resonance testing (LF-NMR, MesoMR23-060H-1 New York) was used to examine the porosity and pore size distribution of the samples based on their longitudinal and transverse relaxation times.
Methodological note on sample preparation temperatures
The three pore-characterization methods employed in this study require fundamentally different sample preparation protocols, dictated by their respective measurement principles rather than an arbitrary choice. For N2 physisorption, degassing at 300°C under vacuum is a standard procedure to remove physisorbed water and volatile contaminants from the pore surface; lower temperatures often yield irreproducible BET surface area results due to incomplete outgassing. For MIP, drying at 105°C in a conventional oven is a widely accepted protocol for cementitious materials, ensuring that free water is removed without causing significant microstructural alteration. For LF-NMR, by contrast, no drying is applied because the technique relies on measuring the hydrogen-proton signal of water molecules within the pore network; drying would eliminate the very signal being measured. This fundamental difference – dry-state measurement (N2 physisorption/MIP) versus saturated-state measurement (LF-NMR) – provides valuable cross-validation of the pore-structure trends, as discussed in Section 3.1.4.
One-dimensional spatial moisture distribution test
One-dimensional profile imaging technology was used to obtain the moisture content information of 512 different profiles in the specimen simultaneously, facilitating the real-time monitoring of changes in the one-dimensional spatial distribution of moisture content. To study moisture migration within AICs in one-dimensional space, aerogel doping was used to monitor the leading edge of water uptake during capillary absorption by AICs using one-dimensional imaging. MesoMR23-060H-1 and an imaging system were used to monitor the water absorption signal at different heights along the sample during capillary rise.
Two-dimensional spatial moisture distribution test
To study the effect of aerogel doping on the moisture migration process and moisture distribution of the AIC, magnetic resonance two-dimensional spectroscopy (MRI) was used to characterize the moisture distribution of the different structural layers of the AIC0 and AIC10 specimens after water absorption for 1 and 30 minutes. In this test, the specimens were divided into five layers, phase-coded using a thickness of 5 mm as the test cell, and the T2 spectra of each layer were measured separately using a magnetic resonance imaging (MRl) instrument and LF-NMR spectrometer (NMR).
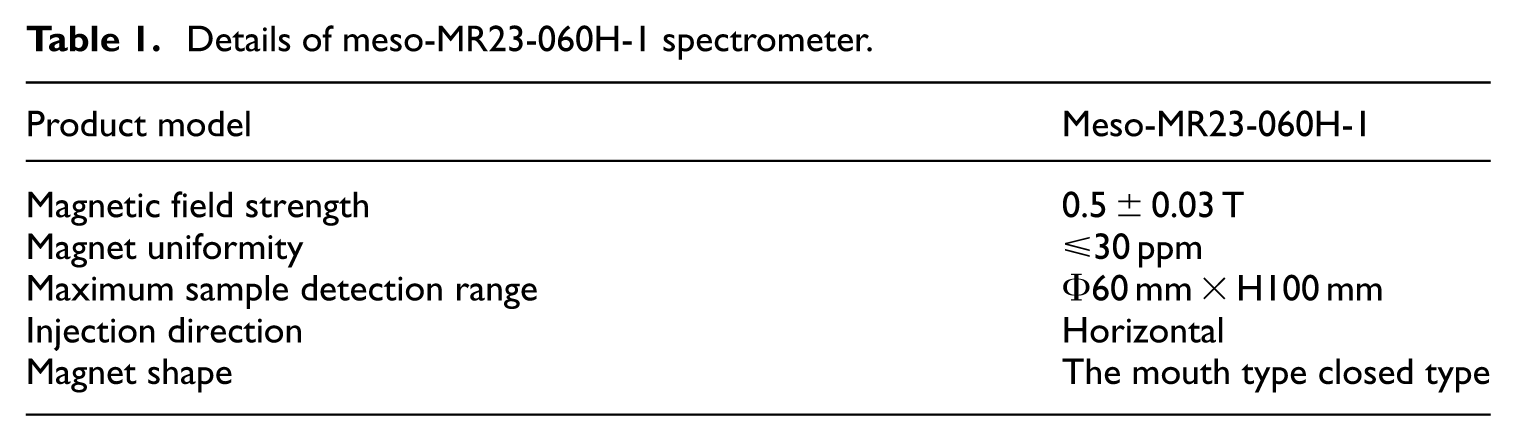
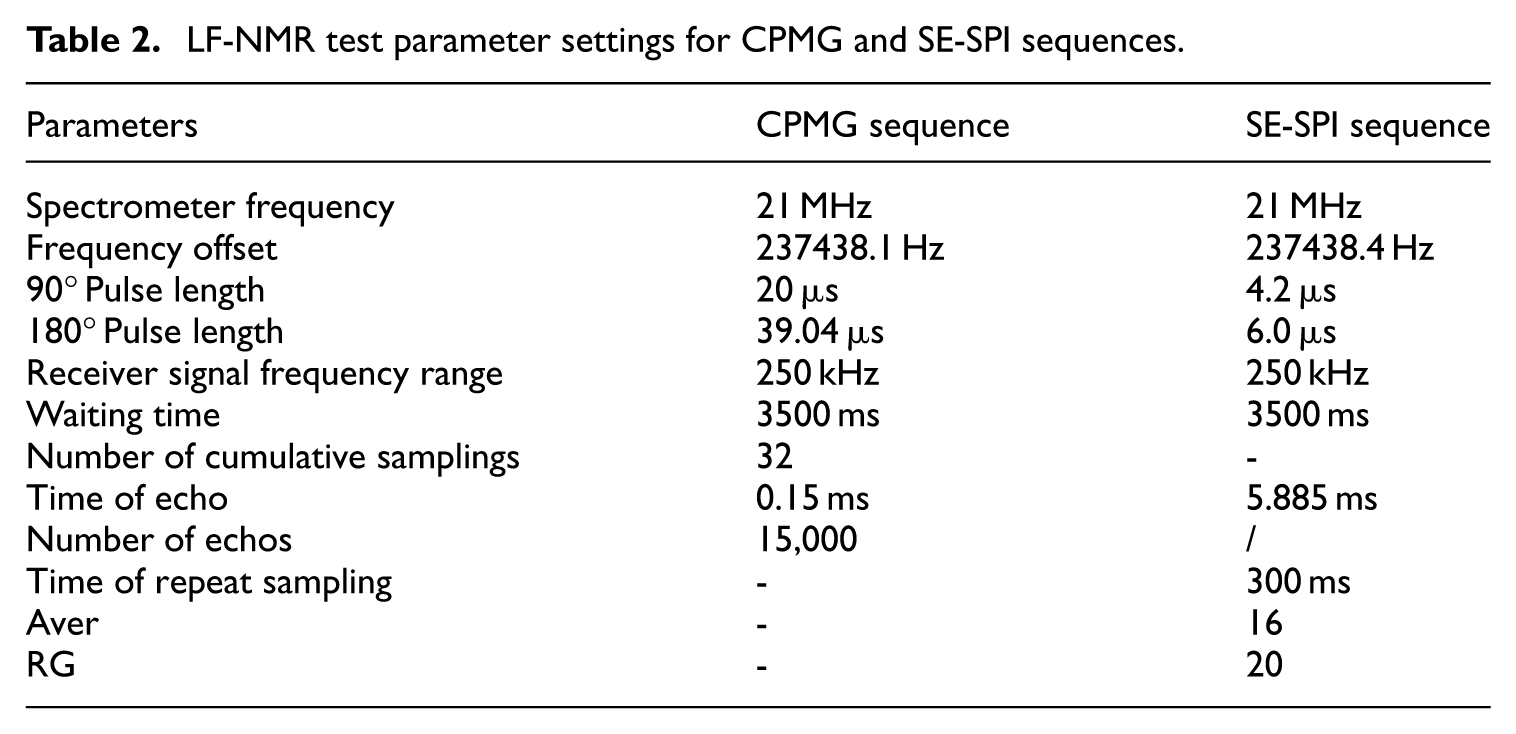
One-dimensional imaging and two-dimensional spectra of the AIC samples under different working conditions were tested. Detailed information on the Meso-MR23-060H-1 spectrometer is provided in Table 1. Detailed information on the parameter settings for the LF-NMR testing of the CPMG and SE-SPI sequences is listed in Table 2.
Details of meso-MR23-060H-1 spectrometer.
LF-NMR test parameter settings for CPMG and SE-SPI sequences.
Results and discussion
Pore size distribution test methods
N2 physisorption
The density functional theory (DFT) method, which is more accurate for measuring micro-mesopores, was used to analyze the pore size distribution, as shown in Figure 2. The mesopores of the AICs were mainly distributed at 20–50 nm. Compared with AIC0, the porosities of AICs after incorporating aerogels show an overall increasing trend, indicating that the number of micro-mesopores increases after the addition of aerogels (Liang et al., 2022). The increase in the microscale pore structure was mainly due to the porous structure of the aerogel. However, the large number of hydrophobic groups on the surface of the aerogel reduced its compatibility with the cement matrix, introducing more interfacial defects between the two phases and thus increasing the number of micropores (Kéri et al., 2020; Shah et al., 2021b; Zaidi et al., 2019).
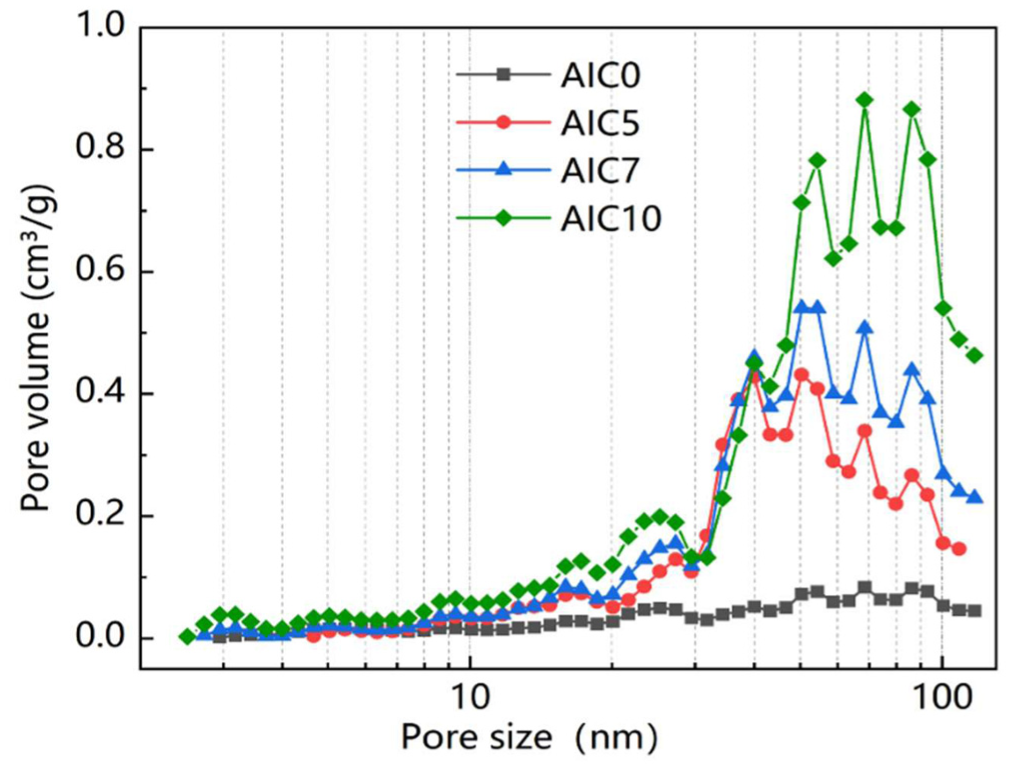
Pore size distribution curves of AICs with different aerogel incorporation amounts.
MIP method
The pore structure parameters of the AICs were also explored using MIP (Abd Elrahman et al., 2019; Figure 3). The average pore size and porosity of the AICs measured using the MIP method increased with the amount of aerogel incorporated, where the average pore size of the AICs ranged from 44 to 99 μm, the total pore surface area ranged from 124 to 71 m2/g, and the porosity ranged from 74% to 78%. In addition, the mercury removal rate initially increased and then decreased, with the mercury removal rate of AIC10 being slightly higher than that of AIC7. The increase in the mercury removal rate indicates that the incorporation of the aerogel enhanced the pore connectivity of the AICs, and the cracks and larger pores enhanced the water absorption characteristics of the AICs, thus affecting the moisture migration inside the material (Lu et al., 2020).
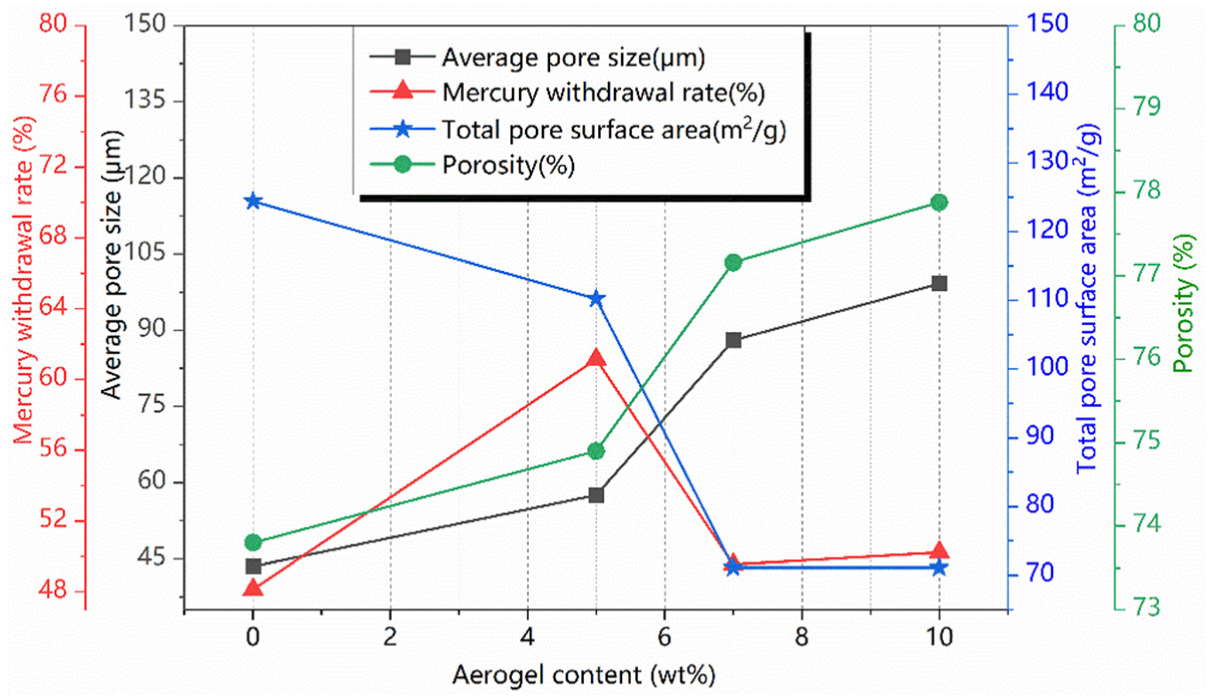
Trend of MIP pore structure parameters with aerogel incorporation amounts.
LF-NMR method
To analyze the effect of AIC micropores with different aerogel incorporations on water transport more accurately, LF-NMR was used to test the water distribution of water-saturated samples. The total volume, total mass, total pore volume, and vacuum saturation porosity of the AICs were obtained, and the results are presented in Table 3. With increasing aerogel content, the porosities of AIC5, AIC7, and AIC10 decreased, indicating that the incorporation of aerogels promoted the formation of pores inside the AICs (Yang et al., 2023). This is consistent with the average pore size and porosity results of the MIP tests. Table 3 presents the porosity of AICs after water absorption. As aerogel content increases, the measured post-absorption porosity decreases. This seemingly counterintuitive result does not contradict the finding that aerogel promotes pore formation (dry MIP in Figure 3). Instead, it reflects two effects:
(i) Air entrapment – during capillary uptake, air is trapped within the pore network, especially in AICs with higher aerogel content where hydrophobic surfaces hinder smooth water penetration.
(ii) Partial saturation – hydrophobic aerogel particles and their surrounding interfacial zones remain poorly wetted (cold tones spots in Figure 7(b)), contributing to lower water-filled porosity.
Porosity in AICs determined via LF-NMR.
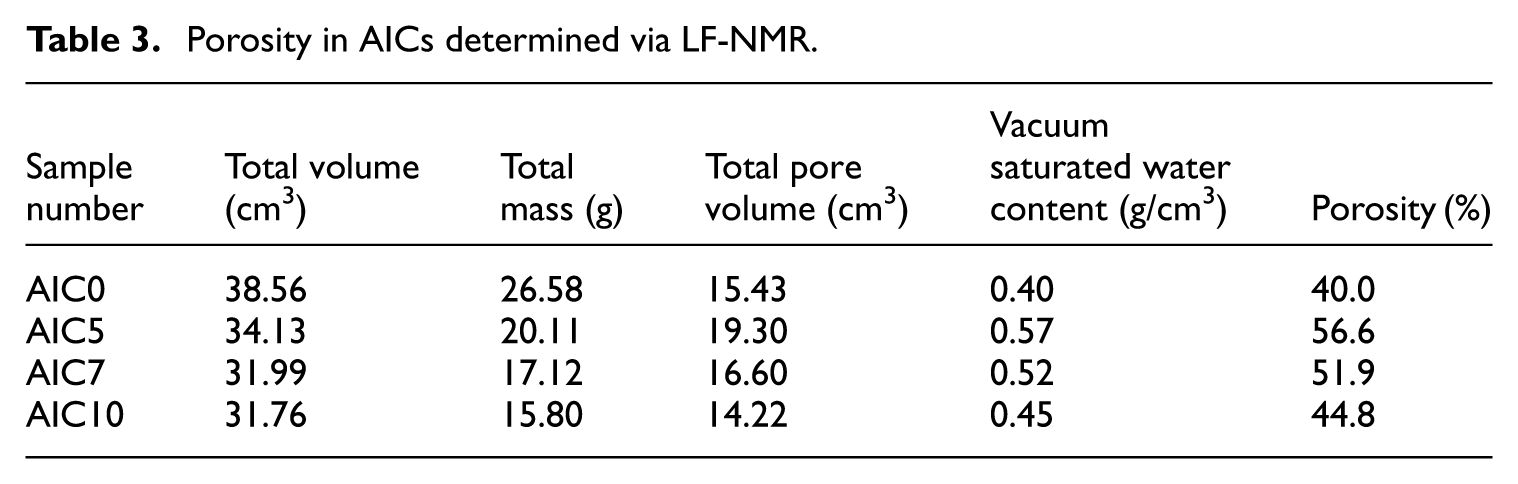
Thus, aerogel incorporation increases total dry porosity (MIP, Figure 3) but reduces the effective water-accessible pore volume after capillary absorption (Table 3). This distinction is critical for understanding water transport in AICs.
In addition, the proportions of the different pores in the AICs were calculated from the LF-NMR data, as shown in Figure 4. The proportions of gel and transition pores increased with increasing aerogel content. However, the percentages of small capillary pores, large capillary pores, and macropores did not change linearly with the amount of aerogel incorporated into the resin. This is related to the hydrophobicity of the aerogel itself (Li et al., 2024b), which will be further explained in the moisture transport mechanism in Section 3.3.
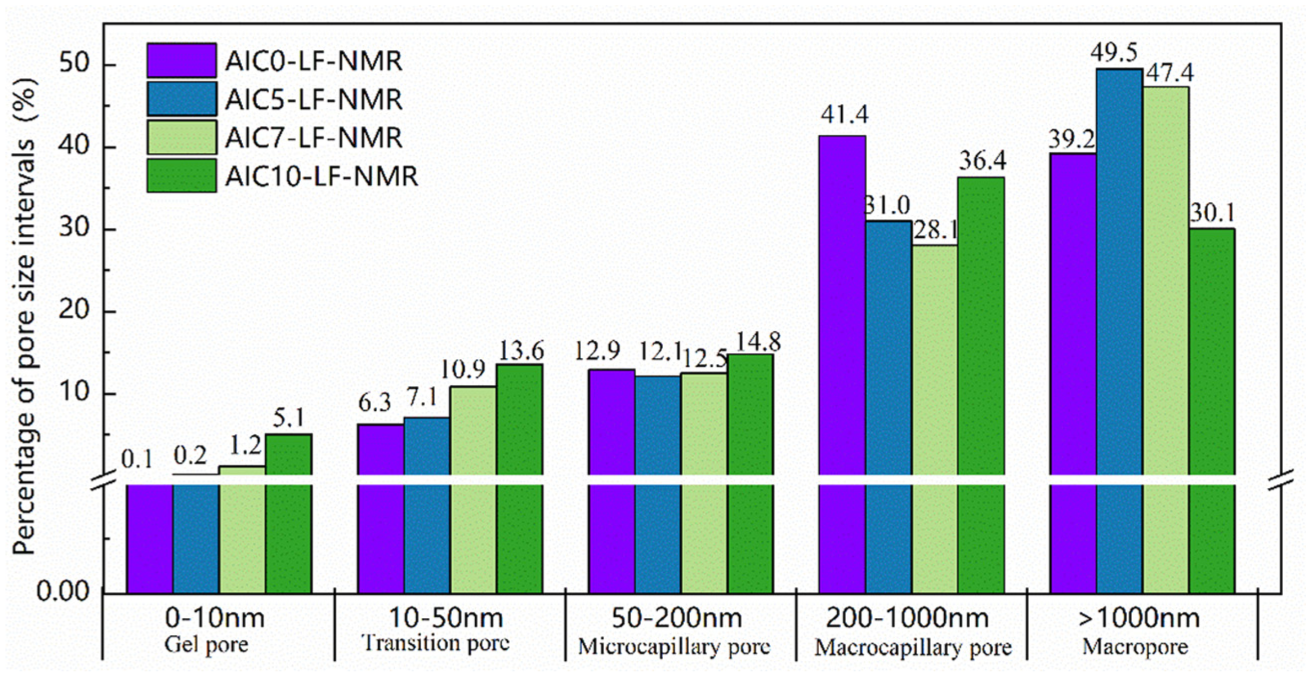
Statistical plot of the percentage of different pore structures of AICs from LF-NMR data.
Comparison of correlation between N2 physisorption/MIP and LF-NMR methods
To further verify the reliability of the pore size distribution data of the AICs obtained by different testing methods, the pore size distribution of the saturated water samples of the AICs measured using the LF-NMR method was compared with that of the corresponding dry samples obtained by N2 physisorption and MIP. The results are presented in Figure 5. In comparison, when the pore size was less than 200 nm, the results of the combined N2 physisorption-MIP characterization of the AIC porosity were significantly greater than those of the corresponding LF-NMR characterization results. This is attributed either to the drying pretreatment of the pore structure measured by N2 physisorption and MIP before measurement (Alnaief and Smirnova, 2010; Amer et al., 2021; Zhou et al., 2023), and/or to the different pore networks being probed by the two experimental techniques (Lagouin et al., 2019; Wu et al., 2022; Zhao et al., 2020).
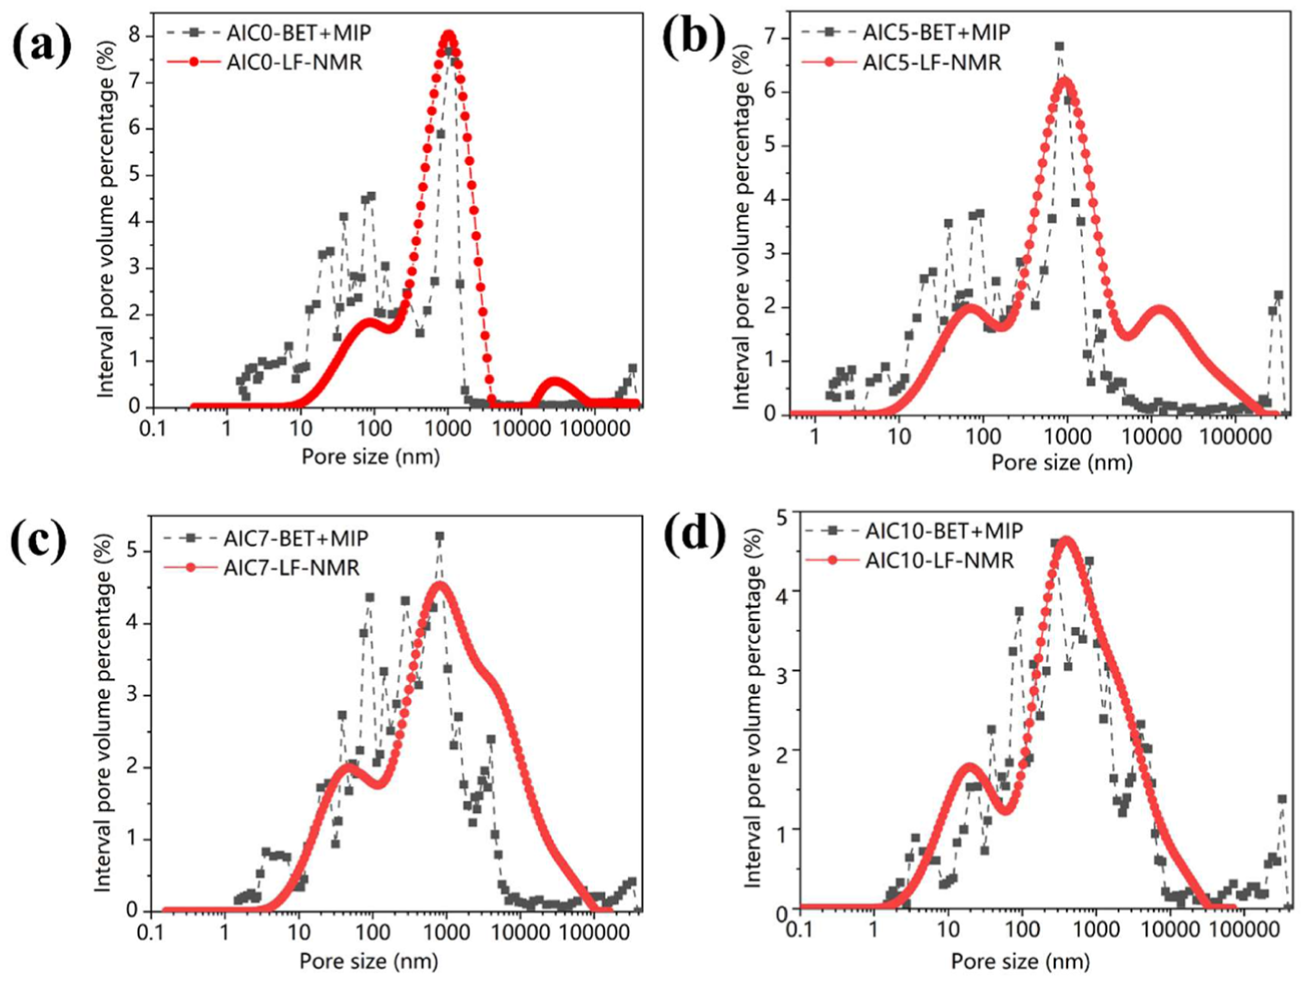
Comparison of pore size distributions determined by different methods.
Figure 5 shows that the results of N2 physisorption/MIP and LF-NMR characterization showed that the incorporation of aerogels could fill the pores inside AICs, increase the volume of mesopores with lower permeability, and improve the pore microstructure of cement-based materials (Yang et al., 2024). Owing to the hydrophobicity of the aerogel, the interface transition zone between the aerogel and cement matrix is expanded, and the pore size range of the cement-based material is increased, thereby increasing the pore volume fraction of the AICs and decreasing the durability of the cement-based material (Ślosarczyk et al., 2022).
Critical discussion of methodological assumptions and artifacts
The pore structure characterization in this study relies on three complementary methods, each with specific assumptions and limitations that must be acknowledged.
Pore shape assumption. For N2 physisorption, the DFT kernel assumes cylindrical pore geometry, which is a simplification for cementitious composites containing irregular mesopores and aerogel internal pores. For MIP, the Washburn equation also assumes cylindrical pores and a fixed mercury contact angle (130°); deviations from cylindrical shape lead to systematic errors in pore size estimation. For LF-NMR, the fast-diffusion model relating T2 to pore size assumes spherical or cylindrical pores; the presence of paramagnetic ions or complex pore shapes can introduce additional uncertainty.
Ink-bottle effect in MIP. Mercury intrusion porosimetry is known to suffer from the ink-bottle artifact, where a narrow pore neck controls the intrusion pressure, causing the volume of a large cavity to be assigned to a smaller pore size In AICs, the aerogel-cement interfacial zone can produce such ink-bottle structures. The discrepancy between MIP and LF-NMR observed in Figure 5 for pores < 200 nm (where MIP gives higher apparent pore volume) is partly attributable to this effect. LF-NMR is less affected by ink-bottle artifacts because it measures water-filled pores in a saturated state without requiring mercury intrusion.
Effect of drying temperature. The drying pretreatment significantly influences measured pore structure. N2 physisorption samples were outgassed at 300°C for 8 h, which may cause partial sintering of silica aerogel nanoparticles and dehydration of C-S-H phases. MIP samples were dried at 105°C for 2 hours, a temperature known to induce microcracking in cement pastes due to removal of interlayer water from C-S-H. Consequently, the absolute porosity values (e.g. the 12% increase for AIC10 compared to AIC0) may be overestimated. However, the relative trends across samples (AIC0 → AIC10) are consistent among all three methods, supporting our conclusion that aerogel incorporation increases macroporosity and pore connectivity. Future work employing cryo- or freeze-drying would help preserve the native pore structure.
Despite these limitations, the combined use of N2 physisorption, MIP and LF-NMR provides a robust cross-validation of pore structure evolution in AICs. Importantly, all three methods show the same trend (increasing macroporosity with aerogel content), confirming the robustness of our conclusions.and the conclusions on moisture migration are supported by direct one- and two-dimensional water distribution imaging.
Visual analysis of moisture distribution
One-dimensional spatial moisture distribution
Profile imaging of water distribution in one-dimensional space can enable the real-time change in the rising water profile at the edge of the material to be investigated (Zhao et al., 2021). Therefore, one-dimensional profile imaging was used to obtain the water content information of AICs with aerogel content of 0 wt %, 5 wt % and 10 wt % at different depths after unidirectional water absorption for 0, 1, 16, 36, 64, and 480 seconds, to analyze the changing water distribution in one-dimensional space within the AICs. As shown in Figure 6(d)–(f), each data point represents the average water content per 5 mm thickness of the sample.
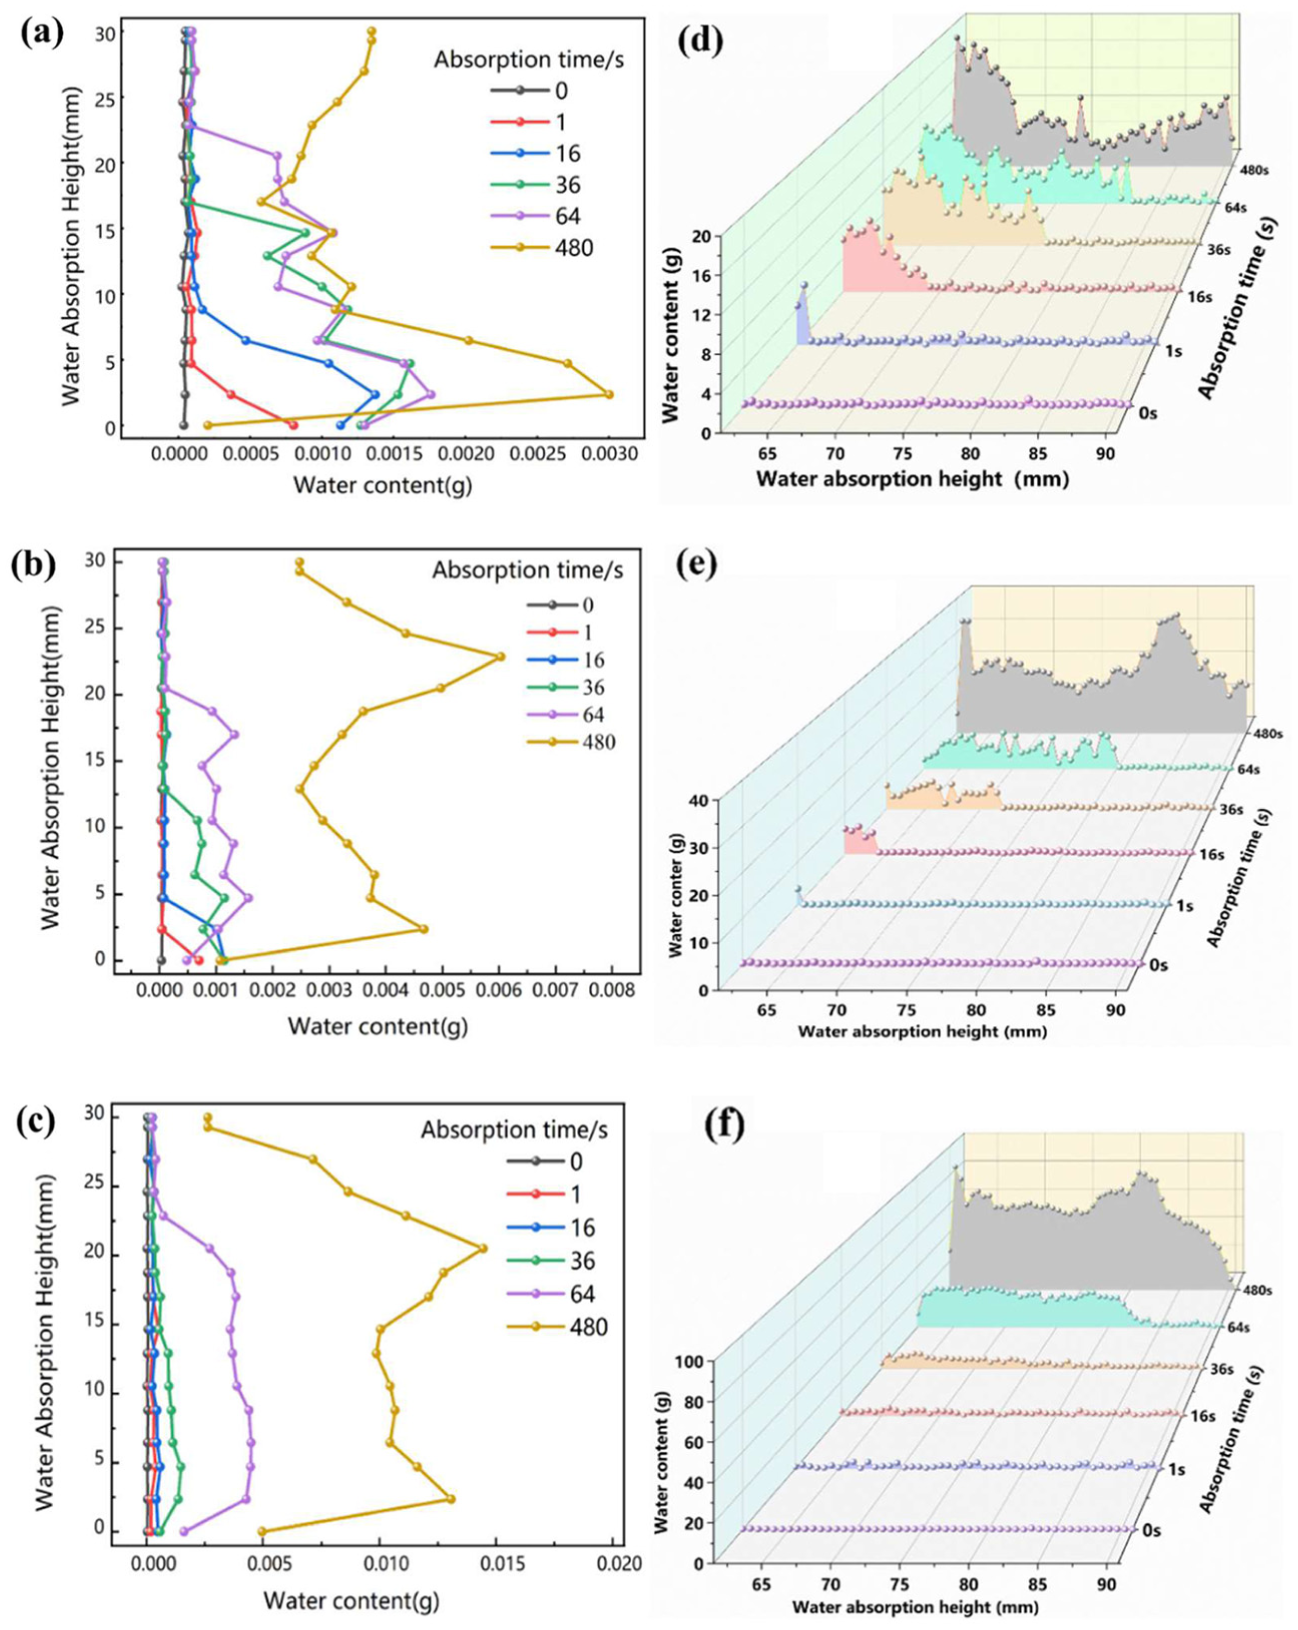
One-dimensional space water distribution curve and water diffusion frequency coding diagram of AICs with different aerogel content: (a and d) AIC0, (b and e) AIC5, and (c and f) AIC10.
As shown in Figure 6(a)–(c), the distribution of the water content of each sample at different water absorption times was not uniform, and the water absorption from bottom to top along the depth profile exhibited a downward trend. With the extension of the water absorption time, the distribution of water content at different depth profiles showed uneven changes in the water content. During the test, the bottom of the sample was in full contact with water, and capillary action caused the water to migrate gradually from the bottom to the top of the sample. The leading edge of the one-dimensional moisture migration profile gradually moved upward, and finally, the water content reached a stable state, that is, the state of saturated water.
The one-dimensional spatial moisture distribution is based on a one-dimensional frequency coding technique, and the moisture distribution information in different parts of the AICs samples is imaged intuitively using a single MRI technique. Combined with the one-dimensional frequency coding technique, the moisture in AICs composites with different silica aerogel doping levels was more intuitively reflected, and at the same time, the moisture diffusion and water flow paths inside the AICs were analyzed in depth using MRI to facilitate the visualization of the moisture inside the materials.
Figure 6(d)–(f) show the water diffusion frequency coding map corresponding to the one-dimensional spatial water distribution profile. From the maps, we can more intuitively see the water content information of the AICs and the changing trend of water content at different water absorption depths and times.
Two-dimensional spatial moisture distribution
The two-dimensional spatial water distributions of AIC0 and AIC10 were imaged after 1 and 30 minutes of water absorption (Figure 7(a) and (b)). In the image, the spot represents the signal from a water molecule. The closer the color of the spot area is to red, the higher the water content in the AICs material (Krishnamoorthy et al., 2021). After 1 minute of water absorption, compared with the control group AIC0, the water content around the second, third, and fourth layers of AIC10 was higher, whereas that in the central region was lower. After 30 minutes of water absorption, all structural layers of AIC0 and AIC10 were filled with water. This shows that during the water absorption process, water gradually migrated from the surface of the sample to its center.
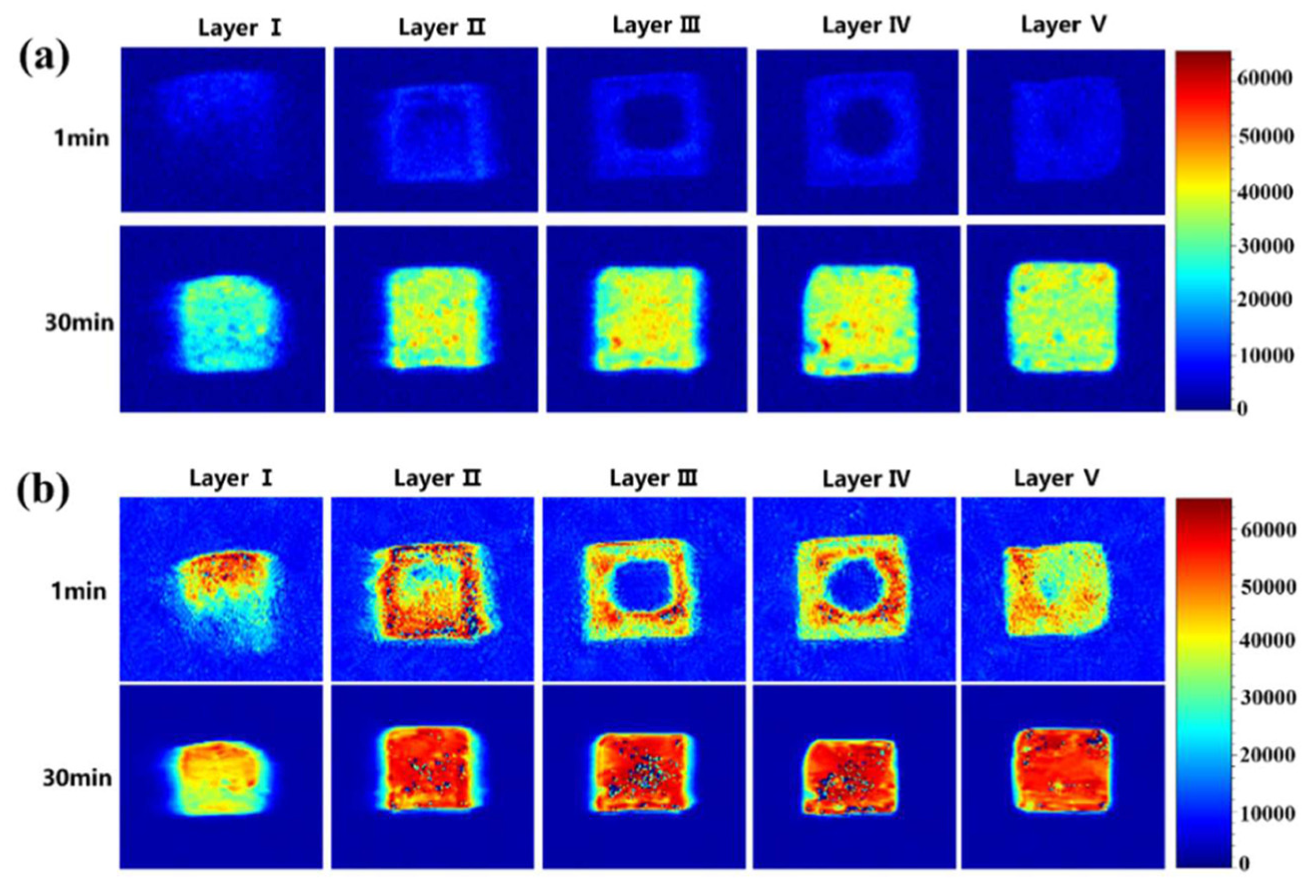
Imaging of two-dimensional spatial moisture distribution in: (a) AIC0 and (b) AIC10.
In addition, by comparing Figure 7(a) and (b), it was found that the water distribution in different structural layers of AIC0 in the control group was more uniform, while after adding aerogel, the water content of AIC10 in different structural layers was not uniform, and cold tones spots with low water content appeared in Figure 7(b; Li et al., 2017b).
The “cold tones spots”– regions with low water content appearing as cold tones in the two-dimensional MRI map of AIC10 (Figure 7(b)) – arise from a combination of local hydrophobicity, air entrapment, and preferential flow pathways.
Local hydrophobicity. Silica aerogel particles are intrinsically hydrophobic due to surface methyl groups. The interfacial transition zone between aerogel and cement paste inherits this hydrophobicity, repelling water molecules. These regions remain largely unwetted even after prolonged water contact.
Air entrapment. During capillary water uptake, the advancing water front can trap air pockets in pore irregularities, especially near hydrophobic surfaces where water entry is energetically unfavorable. The trapped air occupies pore space, preventing complete saturation and contributing to low signal intensity in MRI.
Wettability contrast and flow channeling. Because the cement matrix is hydrophilic, water preferentially flows through the connected hydrophilic pores (the fast pathways). Hydrophobic aerogel domains are bypassed, creating persistent low-saturation “islands” within a generally wetted matrix.
In contrast, the control sample AIC0 contains no hydrophobic inclusions; the entire pore network is uniformly hydrophilic. Consequently, water saturates the sample more homogeneously, and no distinct cold tones spots appear (Figure 7(a)).
Moisture migration behavior
To better explain the phenomenon of inhomogeneous water distribution in different structural layers inside AICs, a simplified schematic diagram of the water transport mechanism inside AICs was constructed based on the Derjaguin theoretical curves (Hadrien et al., 2023) and the results of the analysis of the one- and two-dimensional water distribution in Section 3.2, as shown in Figure 8.
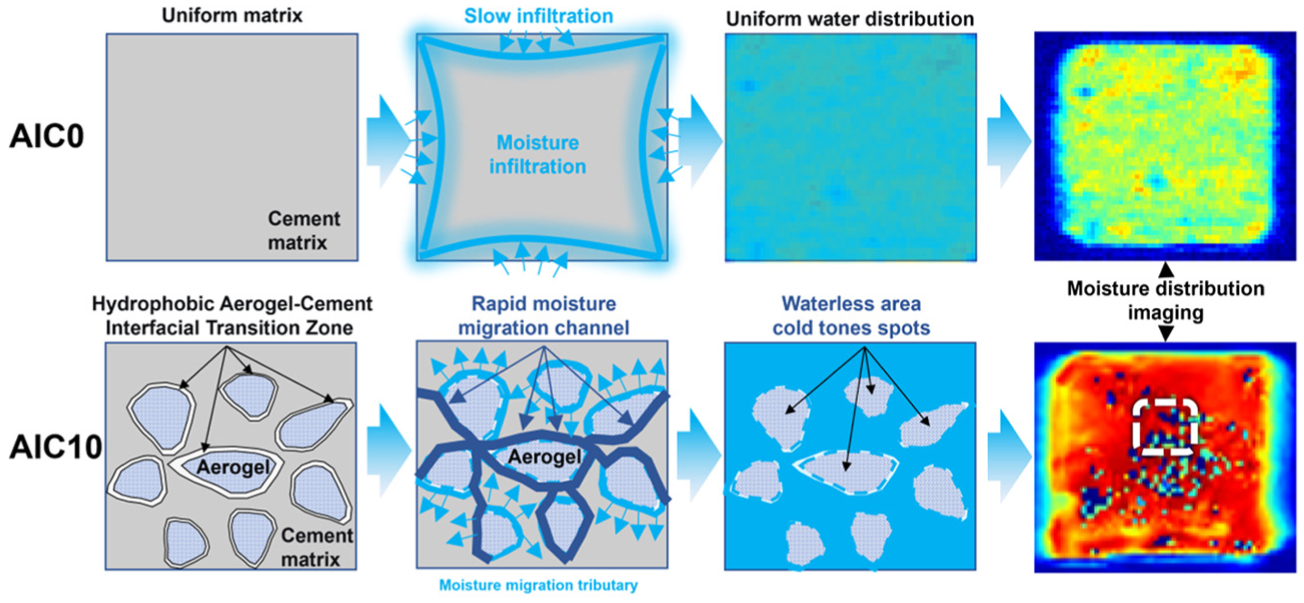
Simplified schematic diagram of water transport mechanism.
Despite the intrinsic hydrophobicity of silica aerogel, the percolating macroporous network formed by the low-compatibility aerogel-cement interface provides fast capillary pathways, leading to accelerated water migration. During water absorption, water preferentially wets the hydrophilic cement matrix and the connected macropores, whereas the aerogel particles and their surrounding interfacial voids (which contain both hydrophilic and hydrophobic sites (Liang et al., 2023b; Mao et al., 2021; Mishra et al., 2020).) remain poorly wetted. This mixed wettability results in a heterogeneous internal moisture distribution, with low-water-content areas appearing as cold tone spots in spatial images (Figure 7(b)).
An apparent tension might seem to exist: enhanced pore connectivity typically promotes uniform moisture flow, yet we observe heterogeneous saturation. The resolution is as follows – pore connectivity accelerates the overall water uptake rate, while wettability contrast dictates the spatial uniformity of saturation. Consequently, AICs possess both a connected macroporous network (fast flow) and hydrophobic domains (local dry spots). These two effects coexist and are not contradictory; both originate from the incorporation of aerogel – the former from interfacial defects (macroporous network), the latter from the intrinsic hydrophobicity of aerogel surfaces.
Both: a connected macroporous network (fast flow) and hydrophobic domains (local dry spots).
Conclusion
In this study, the effects of different silica aerogel contents on the pore size distribution and internal moisture migration behavior of AICs materials were discussed from a microscopic perspective by combining three pore measurement techniques. The water transport inside the AICs material was visualized and analyzed, and the microscopic mechanism of moisture migration was discussed. The following conclusions were drawn.
N2 physisorption, MIP, and LF-NMR consistently showed that increasing aerogel content led to higher specific surface area, average pore size, and overall porosity. The pore size distribution also shifted toward larger mesopores, as reflected by the upward shift of the distribution peak. This shows that the cement-based material has a large pore volume after adding aerogel, which promotes internal moisture migration of the material.
During the water absorption process of the AICs material, the internal water content of the material showed a decreasing trend from bottom to top, and the water content in the central region was low. Furthermore, after water absorption, the measured porosity decreased with increasing aerogel content, reflecting air entrapment and partial saturation of hydrophobic domains – a finding that complements the observed heterogeneous water distribution. The fundamental reason for the change in the water content in different pore intervals of the AICs materials under saturated conditions was further verified.
The water transport mechanism further verifies the microscopic mechanism of the change in water content in the pore size of AICs after adding the aerogel. Owing to the hydrophobicity of the aerogel itself, the hydrophobic interface micro-area formed when mixed with the cement matrix is a mixed distribution of hydrophilic and hydrophobic points, which is an important reason for the moisture migration of AICs.
Footnotes

Funding
The authors disclosed receipt of the following financial support for the research, authorship, and/or publication of this article: This work was supported by the National Natural Science Foundation of China [52476131] and [51976205], Key R&D Program of Zhejiang [2024C03252] and [2023YW107], and National Innovation and Entrepreneurship Training Program for College Students [No: 202410356010S].
Declaration of conflicting interests
The authors declared no potential conflicts of interest with respect to the research, authorship, and/or publication of this article.