






Abstract
Background:
This study aimed to explore potential biomarkers and mechanisms underlying in the treatment of neuropathic pain (NP) with Fu’s subcutaneous needling (FSN), employing a transcriptomics approach.
Methods:
In this study, RNA sequencing was performed in a rat model of chronic constriction injury treated with FSN and acupuncture methods. The FSN-related genes in the treatment of NP with FSN were obtained by overlapping the results of differential expression analysis. Potential biomarkers were identified by protein-protein interaction (PPI) analysis and machine learning. In addition, potential biomarkers were analyzed for functional enrichment, molecular regulatory networks, and drug prediction. Reverse transcription quantitative PCR (RT-qPCR) was employed to validate the expression levels of the biomarkers.
Results:
FOS, RAC2, and TYROBP were identified as potential biomarkers. Furthermore, mo-miR-92a-2-5p was predicted to co-target RAC2 and TYROBP. Twenty-five drugs were predicted to target FOS and four drugs were predicted to target RAC2 were also identified. FSN treatment enhanced and attenuated the expression of RAC2, TYROBP, and FOS, respectively.
Conclusion:
In this study, FOS, RAC2, and TYROBP were identified as potential biomarkers in the treatment of NP with FSN, providing a potential theoretical basis for NP treatment.
Introduction
Neuropathic pain (NP) is a common disorder caused by lesions or diseases of the central or peripheral somatosensory nervous system. 1 The primary symptoms of NP manifest as spontaneous pain, nociceptive hypersensitivity (overreaction to noxious stimuli), and allodynia (injurious reactions to harmless stimuli). NP is a primary feature of many painful disorders, including nerve compression, pain from sciatic nerve injury, trauma, changes associated with metabolic complications, and infectious diseases, such as postherpetic neuralgia.2,3 The most important feature of NP is the complex combination of sensory loss and pain. NP has a serious impact on the quality of life of patients, causing anxiety, depression, sleep disorders, and disability. With a prevalence of 7%–10%, it contributes significantly to the global burden of disease.4,5 Because it is difficult to directly treat damaged nerves, current NP treatments focus on controlling or improving symptoms. Presently, in Western drug therapy, calcium channel blockers are used as first-line therapeutic drugs for NP, such as pregabalin and gabapentin, which can relieve pain but have limited therapeutic effects and certain side effects. 6 Therefore, there is an urgent need to explore the mechanism underlying NP and discover new therapeutic approaches to provide a new direction for treating patients with NP.
Fu’s subcutaneous needling (FSN) is an invasive physical therapy method that uses disposable floating needles and other needles to rock with reperfusion movement in the subcutaneous superficial fascia around the pain limitation and is widely used worldwide. 7 FSN is effective for somatic and visceral pain as well as other non-painful disorders, such as stress urinary incontinence, Parkinson’s disease (PD), and intractable diarrhea.8–11 FSN and electroacupuncture are significantly more effective than Western medicine and traditional acupuncture in treating NP, improving patients’ somatic pain and quality of life, and are free of any toxic side effects.12,13 FSN can effectively improve pain in rat chronic constriction injury (CCI) models by regulating inflammation and endoplasmic reticulum stress. 14 FSN alleviates pain in CCI model rats by enhancing mitochondrial autophagy, restoring mitochondrial dynamics, and reducing inflammation. 15 However, the mechanisms underlying the therapeutic effects of FSN in treating NP remain unclear and require further in-depth study. In this study, we constructed a CCI model of the sciatic nerve, compared the samples from different treatment groups of the rat CCI model with those from the normal group, and validated the experiments using transcriptome sequencing technology and reverse transcription quantitative polymerase chain reaction (RT-qPCR) to explore the potential biomarkers of FSN for NP treatment and their potential molecular regulatory mechanisms using bioinformatics, which provides a new theory for FSN treatment of NP in the clinic. Molecular regulatory mechanisms provide a new theoretical basis for FSN in the clinical treatment of NP.
Materials and methods
Experimental animals
Thirty-two healthy male SD rats (SPF grade, 300 ± 20 g) were obtained from Jinan Pengyue Laboratory Animal Breeding Co. They were kept in a standard environment at a room temperature of 22–24°C, a 12-h light cycle, and adequate water and food. The rats were fed in the barrier environment of Qingdao University Laboratory Animal Center according to the standards for laboratory animals.
Construction of CCI model and grouping
Given that FSN acts directly on the subcutaneous fascia and muscle layers and that previous studies have shown it can promote muscle repair by regulating mitochondrial homeostasis. 16 Furthermore, the structural organization of the extracellular matrix (ECM) plays a central role in neuropathic pain (NP) and is closely associated with muscle function.17,18 Based on this, muscle tissue was selected for transcriptomic sequencing in this study. The specific modeling methods are as follows: Thirty-two SD rats were fed standard chow for 1 week. After 12 h of preoperative fasting, 24 rats were randomly chosen for sciatic nerve ligation. Then, animals were weighed and intraperitoneally injected with 2% sodium pentobarbital (2 mL/kg). Post-anesthesia, the rats were placed on the operation table, the rat’s hair was removed from the lateral side of the right hind limb, and the local skin of the rats was sterilized. The skin of the right lower limb of the rat was incised in the middle and lower third of the lateral thigh. The muscle was bluntly separated using ophthalmic forceps until the sciatic nerve was exposed. The sciatic nerve was stripped with a glass parting needle, and four ligations were made with a 4-0 silk thread at the sciatic nerve trunk, with an interval of approximately 1 mm between each ligation. The ligations were performed in a way that did not completely block the blood vessels, and the ligated local muscles produced a slight twitching. After completing the ligation, it was sutured and sterilized layer by layer. Penicillin was injected into the muscle with 40,000–50,000 U after the operation to prevent infection. After modeling, the operated side of the rat became ectopic, and lameness and contraction of the operated side appeared during activity, indicating successful modeling. The rats were anesthetized with pentobarbital sodium, and a muscle tissue sample was collected for RNA sequencing. Muscle tissue samples were divided into four groups: control (CON), model (MOD), acupuncture (ACP), and FSN, with eight samples per group.
RNA sequencing
Total RNA was extracted from the muscle tissue of 32 rats using TRIzol (Invitrogen, CA, United States) reagent according to the manufacturer’s protocol. RNA purity and quantity were evaluated using a NanoDrop ND-1000 spectrophotometer (NanoDrop, Wilmington, DE, United States). RNA integrity was assessed using an Agilent 2100 Bioanalyzer (Agilent, CA, United States). Samples with concentrations > 50 ng/µL, RNA integrity number values > 7.0, optical density 260/280 > 1.8, and total RNA > 1 µg were suitable for downstream experiments. Poly(A) RNA was purified using Dynabeads Oligo (dT)25-61005 (Thermo Fisher, CA, United States) in two rounds, with each round using 1 µg of total RNA. Subsequently, poly(A) RNA was fragmented into smaller pieces using the Magnesium RNA Fragmentation Module (NEB, cat. no. e6150, United States) at 94°C for 5–7 min. Then, cleaved RNA fragments were reverse transcribed into cDNA using SuperScript™ II Reverse Transcriptase (Invitrogen, cat. 1896649, United States). The average insert size of the final cDNA library was 300 ± 50 bp. Finally, paired-end 150 bp (PE150) sequencing was performed on an Illumina NovaSeq 6000 (LC-BioTechnology Co., Ltd., Hangzhou, China) according to the manufacturer’s recommended protocol. The Fastp software was used to eliminate reads that exhibited adaptor contamination, low-quality bases, and undetermined bases, using the default parameters. Then, the clean reads for each sample were retained for subsequent analyses. The clean reads were mapped to the rat genome using HISAT2 software. The reads per kilobase per million were calculated using Cufflinks (version 2.2.1) to quantify gene expression levels (Table S1).
Gene set variation analysis (GSVA) and differential expression analysis
To evaluate the enrichment results for the MOD group compared to the CON group (MOD vs CON), the ACP group compared to the MOD group (ACP vs MOD), and the FSN group compared to the MOD group (FSN vs MOD), the GSVA package (version 1.49.4) 19 was used to conduct three GSVA analyses within the transcriptome sequencing datasets. Meanwhile, the species was set to “Rattus norvegicus,” and the “HALLMARK” gene set from the Molecular Signatures Database was selected as the reference gene set. Differences in scores between MOD and CON groups, ACP and MOD groups, and FSN and MOD groups were compared by calculating the gene set score for each sample (|t| > 0, p < 0.05). The results were visualized using the ggplot2 package (version 3.3.2). 20
Initially, the DESeq2 package (version 1.42.0) 21 was used to perform three differential expression analyses to identify three differentially expressed genes (DEGs) with |log2Fold Change (FC)| > 1 and p-value < 0.05. Specifically, DEGs1 were identified by comparing the MOD and CON groups. DEGs2 were determined by comparing FSN and MOD groups. Furthermore, DEGs3 were selected by comparing ACP and MOD groups.
Identification and functional enrichment of candidate genes in FSN
The ggvenn package (version 1.7.3) was used to analyze genes with opposite expression trends in DEGs1 and DEGs3. These genes were defined as ACP. Furthermore, the same method was used to analyze genes with opposite expression trends between DEGs1 and DEGs2, known as FSN genes. Finally, the ggvenn package (version 1.7.3) was used to identify the overlaps between ACP and FSN genes. By removing these overlapping genes from the FSN gene set, we obtained FSN-related genes for subsequent analysis. Gene ontology (GO) and Kyoto encyclopedia of genes and genomes (KEGG) analysis were performed to determine the putative biological function and mechanism of candidate genes using the clusterProfiler package (version 3.16.0; p-value < 0.05). GO includes three aspects: biological processes (BP), molecular functions (MF), and cellular components (CC).
Protein-protein interaction (PPI) network analysis
To investigate the interactions between the protein levels of the candidate genes in FSN, these genes were imported into the Search Tool for the Retrieval of Interacting Genes/Proteins (STRING) database. The species was set to “Rattus norvegicus,” and the confidence level was established at 0.4 (confidence > 0.4). The PPI network was constructed using Cytoscape software (version 3.10.2). 22 Subsequently, closeness, edge percolated component (EPC), radiality, and stress algorithms were employed to identify candidate genes by overlapping the top 20 genes from each algorithm.
Machine learning and receiver operating characteristics (ROC) analysis
To further reduce the number of candidate genes, least absolute shrinkage and selection operator (LASSO), Boruta, and support vector machine-recursive feature elimination (SVM-RFE) analyses were conducted on the transcriptome data from FSN and MOD groups. The LASSO regression analysis of candidate genes was performed using the glmnet package (version 4.1-8) 23 with 5-fold cross-validation. Based on the candidate genes, the Boruta algorithm was used to screen Boruta-signature genes by the Boruta package (version 8.0.0). 24 SVM-RFE analysis was performed on the candidate genes using the e1071 package (version 1.7-14), also based on 5-fold cross-validation to identify the optimal SVM-RFE feature genes with the lowest error rate. An SVM-RFE of candidate biomarkers was conducted using the e1071 package (version 1.7-14) to identify the optimal SVM-RFE signature genes based on the lowest error rate. In addition, the ggvenn package (version 1.7.3) was used to identify the intersecting genes among LASSO, Boruta, and SVM-RFE signature genes considered as potential biomarkers. Moreover, Spearman’s correlation analysis of associations among potential biomarkers was performed using the psych package (version 2.2.5), with a cutoff defined as |correlation (r)| > 0.3 and p < 0.05. The output was visualized using the package ggplot2. Finally, the ability of the biomarker(s) to discriminate between FSN and MOD samples was assessed using ROC analysis, which yielded an area under the curve (AUC) using the pROC package (version 1.18.5). 25 An AUC > 0.7 was deemed indicative of a robust predictive capability. In addition, we incorporated the identified potential biomarkers into three models (Logistic, SVM, and RF) and evaluated the classification performance of each model using leave-one-out cross-validation.
Gene set enrichment analysis (GSEA)
To investigate the biological functions related to the potential biomarkers, GSEA was conducted on the transcriptome data of FSN and MOD groups. The Spearman correlation coefficients between each biomarker and all other genes were calculated using the psych package (v 2.2.5), and all sorted genes were ranked from big to small based on Spearman correlation coefficient and used as tested gene set. Meanwhile, the species was set to “Rattus norvegicus,” and “C2: KEGG” from the Molecular Signatures Database (MSigDB, https://www.gsea-msigdb.org/gsea/msigdb), was used the reference gene set. Subsequently, the GSEA was performed using the clusterProfiler package (v 3.16.0), with a threshold of p < 0.05 and |normalized enrichment score (NES)| > 1.
Molecular regulatory network and potential drug prediction
To further illuminate the mechanisms underlying the potential biomarkers, the mRNA-microRNA (miRNA) network was constructed. The miRNAs that targeted the potential biomarkers were obtained from the miRDB platform. Then, the miRNA-potential biomarker network was constructed and visualized using Cytoscape software (version 3.10.2). To identify drugs that may interact with potential biomarkers, potential drug candidates targeting these genes were analyzed using the Drug-gene Interaction database.
To identify drugs that may interact with potential biomarkers, potential drug candidates targeting these genes were analyzed using the DGIdb. Then, predicted drugs were imported into Cytoscape software (version 3.10.2) to visualize the biomarker-drug network (murine-derived genes were converted to human origin).
Gene expression analysis and RT-qPCR
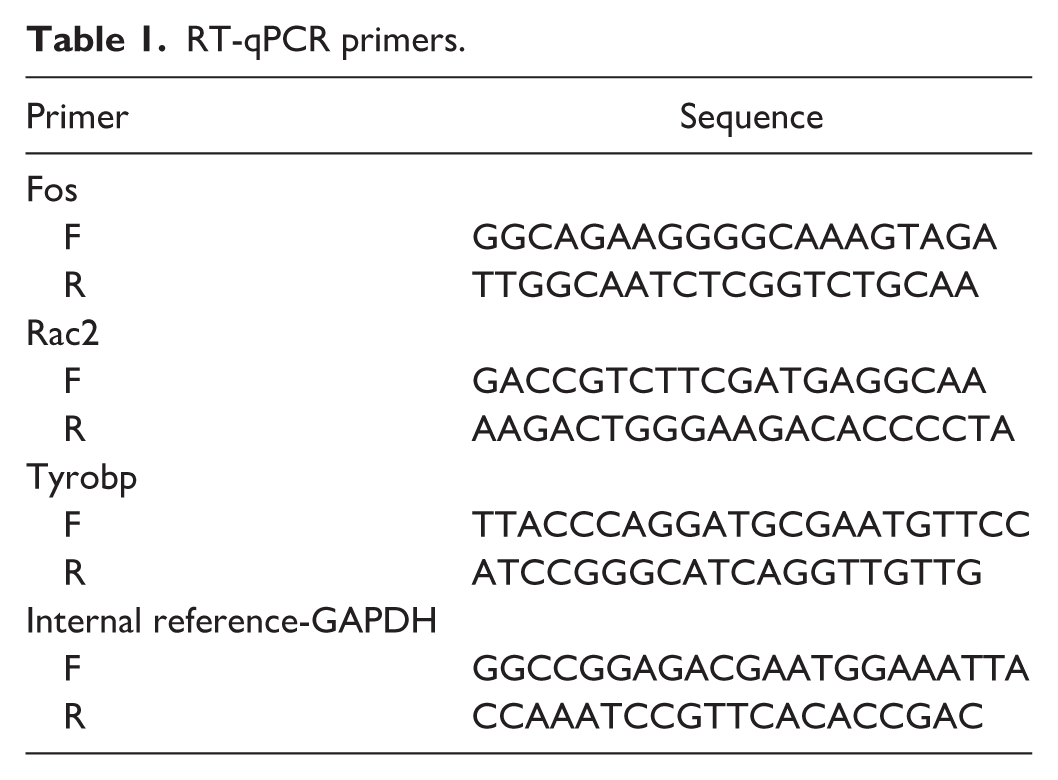
To assess potential biomarker expression across groups, gene expression analysis was performed using the Wilcoxon test, with statistical significance set at p < 0.05. To verify biomarker expression, RT-qPCR was performed on muscle tissue samples randomly selected from a subset of the same animal cohort used for RNA sequencing (n = 5 per group). RT-qPCR was performed under the following conditions: 1 min at 95°C, 20 s at 95°C, 20 s at 55°C, and 30 s at 72°C. The qPCR primers are listed in Table 1. The GAPDH gene served as an internal reference, and the 2−ΔΔCt method was used for measurement. 26 RT-qPCR results (p < 0.05) were analyzed using GraphPad Prism software (version 10).
RT-qPCR primers.
Statistical analysis
Bioinformatics analyses were performed using the R programming language (version 4.3.1). The Wilcoxon test was used to compare differences between two groups. A p < 0.05 was considered statistically significant.
Results
Significant variability in GSVA between groups
GSVA indicated that spermatogenesis and bile acid metabolism were activated in the MOD group, while glycolysis, IL2 STAT5 signaling, and other processes were inhibited in the MOD group compared to the CON group (Figure 1(a), Supplemental Table 1). In contrast to the MOD group, the FSN group exhibited activated heme metabolism. However, MTROC1 signaling was inhibited in the MOD group (Figure 1(b), Supplemental Table 2). Furthermore, xenobiotic metabolism, angiogenesis, and other pathways were activated in the ACP group compared to the MOD group (Figure 1(c), Supplemental Table 3).

(a) There was a significant difference in the GSVA analysis of the MOD group compared to the CON group. (b) There was a significant difference in GSVA analysis between the MOD group compared to the FSN group. (c) There was a significant difference in the GSVA analysis of the MOD group compared to the ACP group.
Differential expression analysis
Initially, 411 DEGs1 were identified between MOD and CON groups, with 74 upregulated and 337 downregulated in the MOD group (Figure 2(a) and (b)). A total of 964 DEGs2 were identified between the FSN and MOD groups. Among these, 567 were overexpressed, while 397 were underexpressed in the FSN group (Figure 2(c) and (d)). Subsequently, 108 DEGs3 were identified between ACP and MOD groups, with 91 upregulated and 17 downregulated (Figure 2(e) and (f)). Enrichment analysis of these 411 DEGs1 revealed 1458 GO terms, including 1292 BP, 113 MF, and 53 CC, covering many functions, such as extracellular matrix organization, extracellular matrix, and glycosaminoglycan binding (Figure 2(g)). We identified 66 KEGG pathways, including the PI3K-Akt signaling pathway, cytoskeleton in muscle cells, and protein digestion and absorption (Figure 2(h)). Additionally, GO analysis of DEGs2 revealed significant enrichment in 795 entries. Among them, 589 BP-like generations of precursor metabolites and energy, 103 CC-like ribosomes, and 103 CC-like structural constituents of ribosomes were enriched (Figure 2(i)). KEGG pathway enrichment significantly enriched 39 pathways, including prion disease, ribosomes, and Huntington’s disease (Figure 2(j)). Besides, the enriched GO functions of DEGs3 primarily included extracellular matrix organization, extracellular matrix, and glycosaminoglycan binding (Figure 2(k)). DEGs3 were primarily concentrated in 21 KEGG pathways, including the PI3K-Akt signaling pathway, human papillomavirus infection, and ECM-receptor interactions (Figure 2(l)).
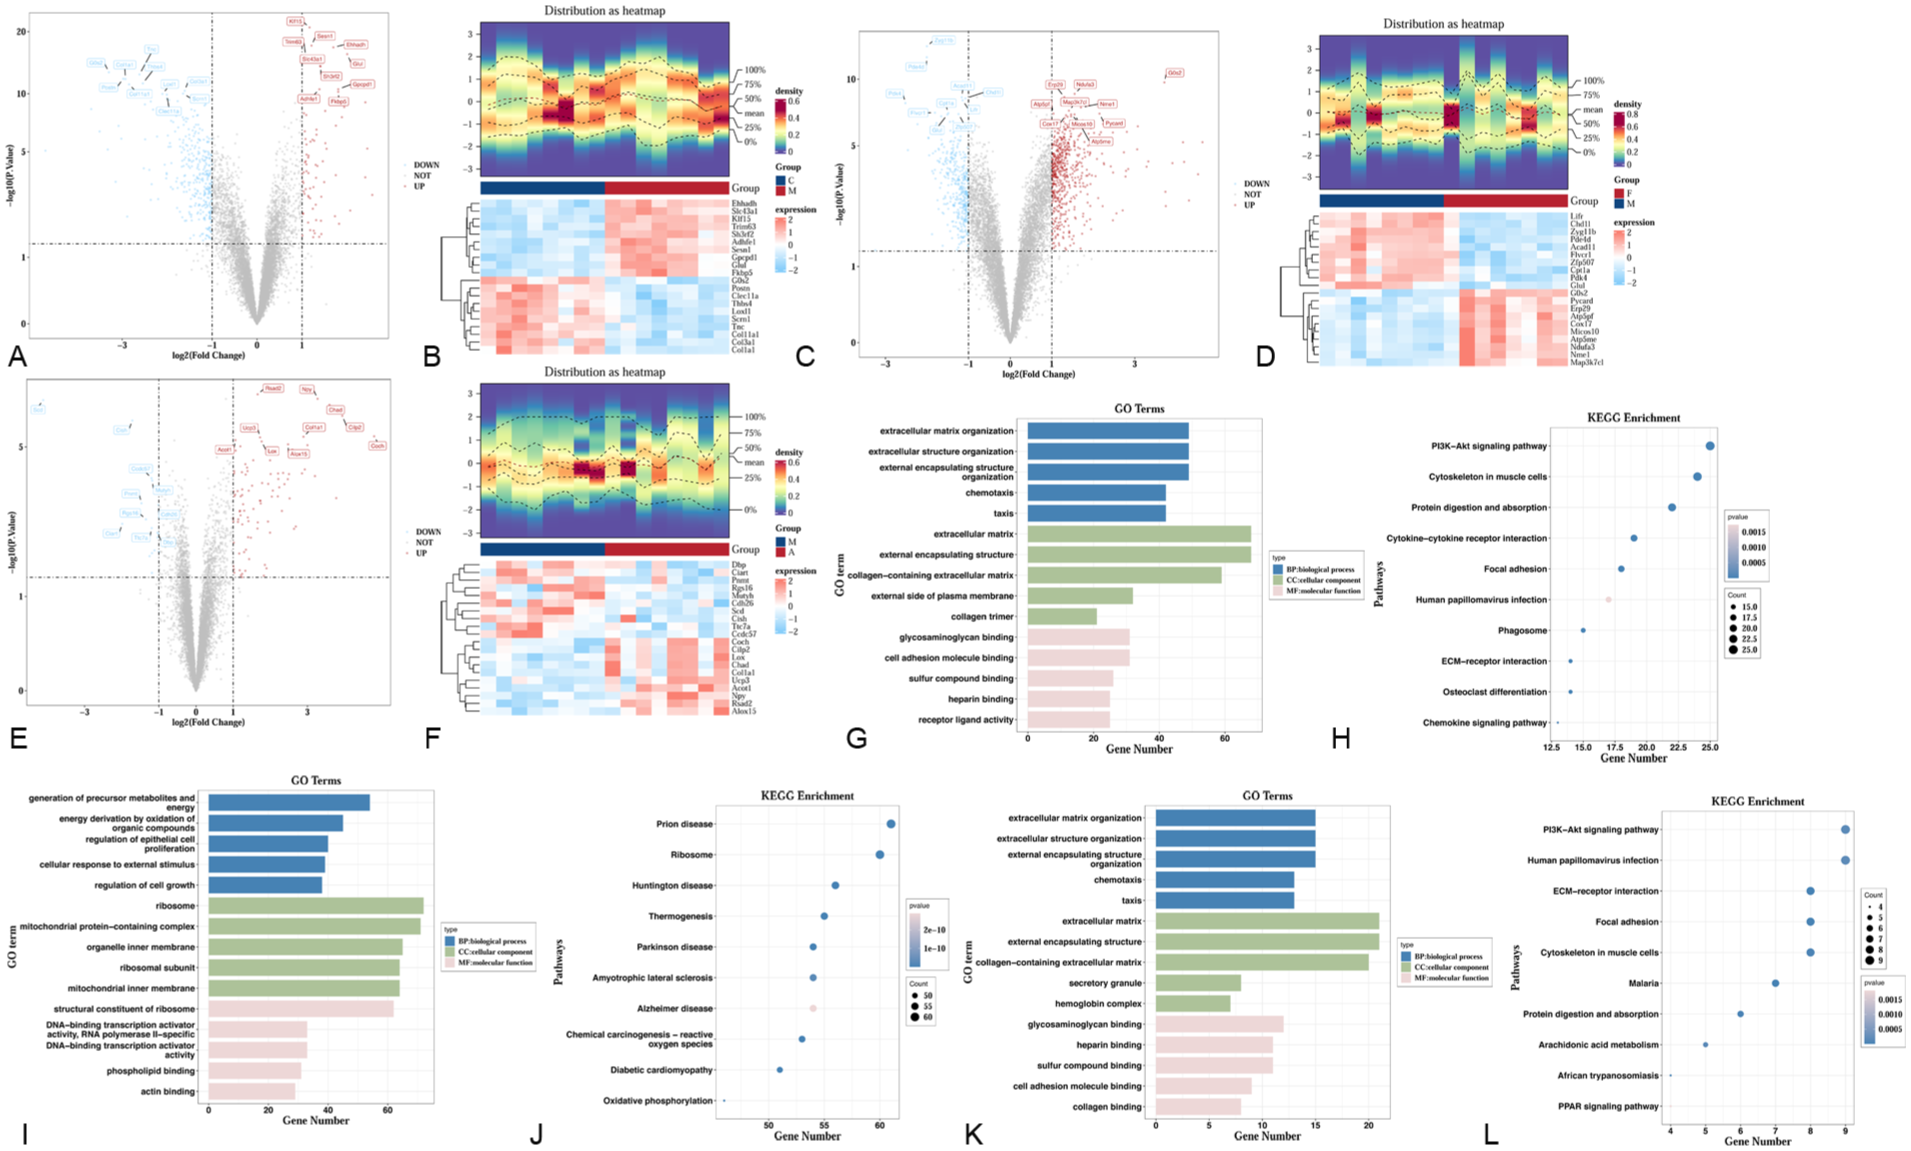
(a–b) Volcano plots and heatmaps of differential expression analysis (DEGs1) between MOD and COD groups. (c–d) Volcano plots and heatmaps of differential expression analysis (DEGs2) between FSN and MOD groups. (e–f) Volcano plots and heatmaps of differential expression analysis (DEGs3) between ACP and MOD groups. (a–f) The volcano plot displays differential fold change (log-transformed) on the x-axis and −log₁₀(p-value) on the y-axis. Each point represents a gene: red indicates upregulated genes, blue denotes downregulated genes, and gray signifies genes with no significant difference. The plot highlights the top 10 most significantly up- and downregulated genes by |p-value|. In the heatmap, each small square represents a gene. Its color indicates the expression level of that gene, with darker shades denoting higher expression (red for high expression, blue for low expression, and white for no significant difference). (g–h) GO, KEGG enrichment analysis of DEGs1. (i–j) GO, KEGG enrichment analysis of DEGs2. (k–l) GO, KEGG enrichment analysis of DEGs3. (g, i, k) The horizontal axis represents the number of genes enriched in the pathway, while the vertical axis denotes the pathway name. (h, j, l) The horizontal axis represents gene count, while the vertical axis displays different pathway names. Each bubble denotes a pathway, with its size indicating the number of genes within that pathway (Count). Larger bubbles signify greater enrichment of genes within that pathway. Bubble color corresponds to p-value, with pinker hues indicating higher p-values.
Candidate genes associated with FSN treatment for NP
Initially, 201 FSN genes were identified between DEGs1 and DEGs2 (Figure 3(a)). Subsequently, 63 ACP genes were identified between DEGs1 and DEGs3 (Figure 3(b)). Finally, there were 48 overlapping genes among the 201 FSN genes and the 63 ACP genes (Figure 3(c)). After excluding these overlapping genes, 153 FSN-related genes were identified from the FSN genes for further analysis. The GO analysis revealed significant enrichment of 619 different entries. Among them, 550 BP-like responses to nutrients, 19 CC-like extracellular matrices, and 50 MF-like amide bindings were enriched (Figure 3(d)). Besides, KEGG pathway enrichment significantly enriched 47 pathways, including osteoclast differentiation, pertussis, and Staphylococcus aureus infection (Figure 3(e)).
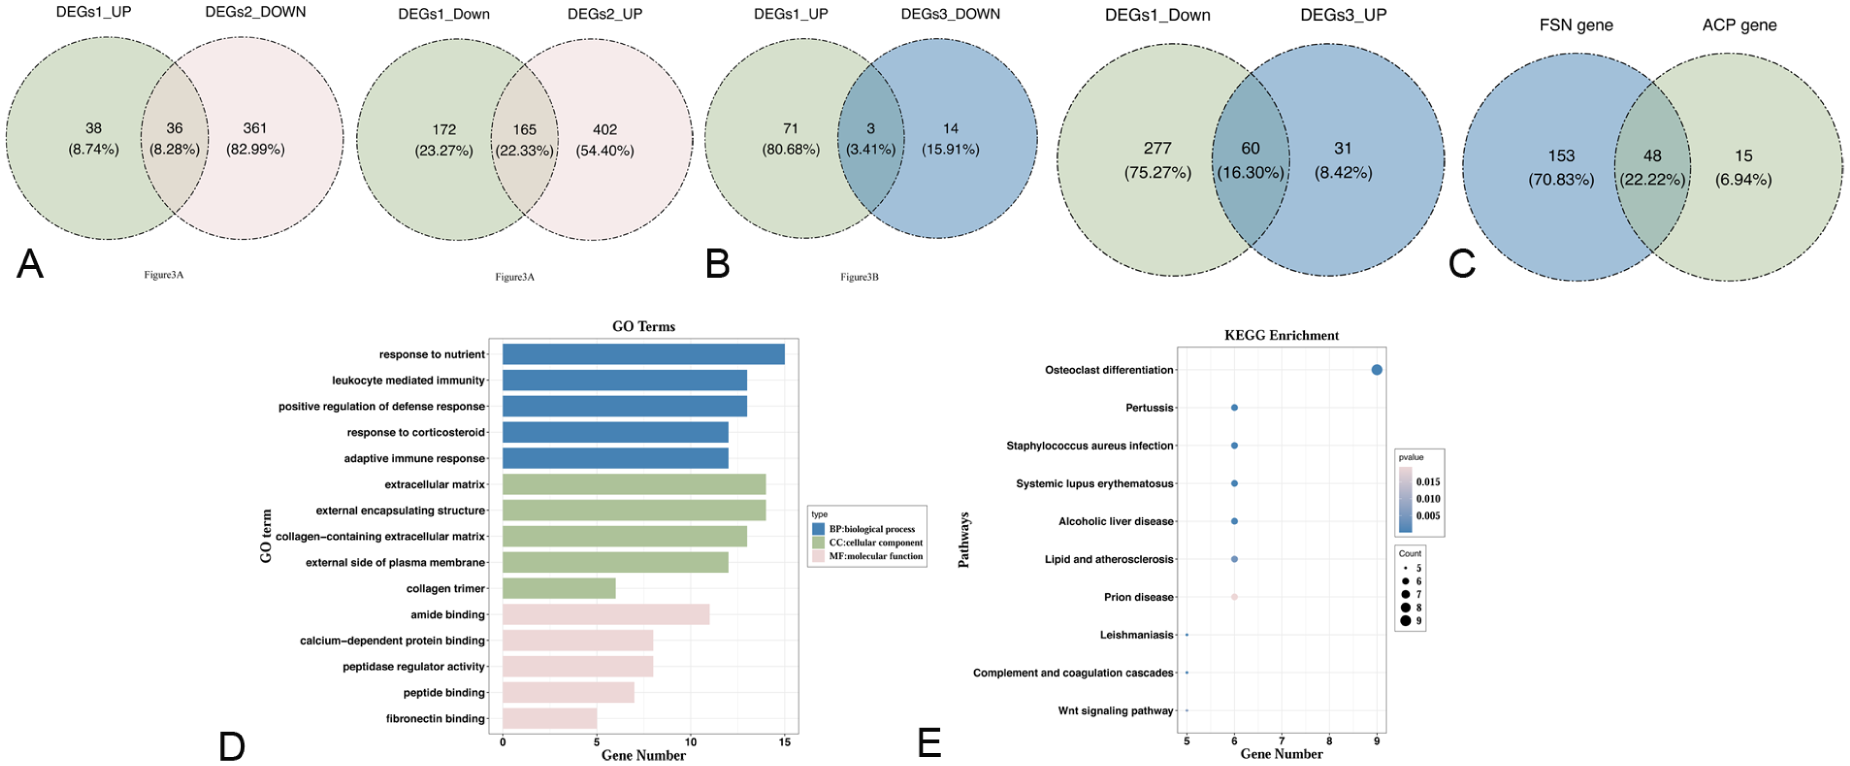
(a) FSN genes:the same methodology was applied to analyze the genes with opposite expression trends between DEGs1 and DEGs2. (b) ACP genes:the same methodology was applied to analyze the genes with opposite expression trends between DEGs1 and DEGs3. (c) Candidate genes: Intersection of ACP genes and FSN genes. (d) The GO analysis of candidate genes. (e) The KEGG analysis of candidate genes.
FBJ murine osteosarcoma viral oncogene homolog (FOS), Ras-related C3 botulinum toxin substrate 2 (RAC2), and transmembrane immune signaling adaptor protein (TYROBP) were identified as biomarkers
The PPI analysis demonstrated that the candidate targets exhibited multiple network and synergistic interactions. For example, C1QC, LOXL1, and FOS demonstrated close interactions with other genes. Subsequently, 10 candidate genes were selected for further analysis by overlapping the top 20 genes identified independently by the closeness, EPC, radiality, and stress algorithms (Figure 4(a) and (b)).
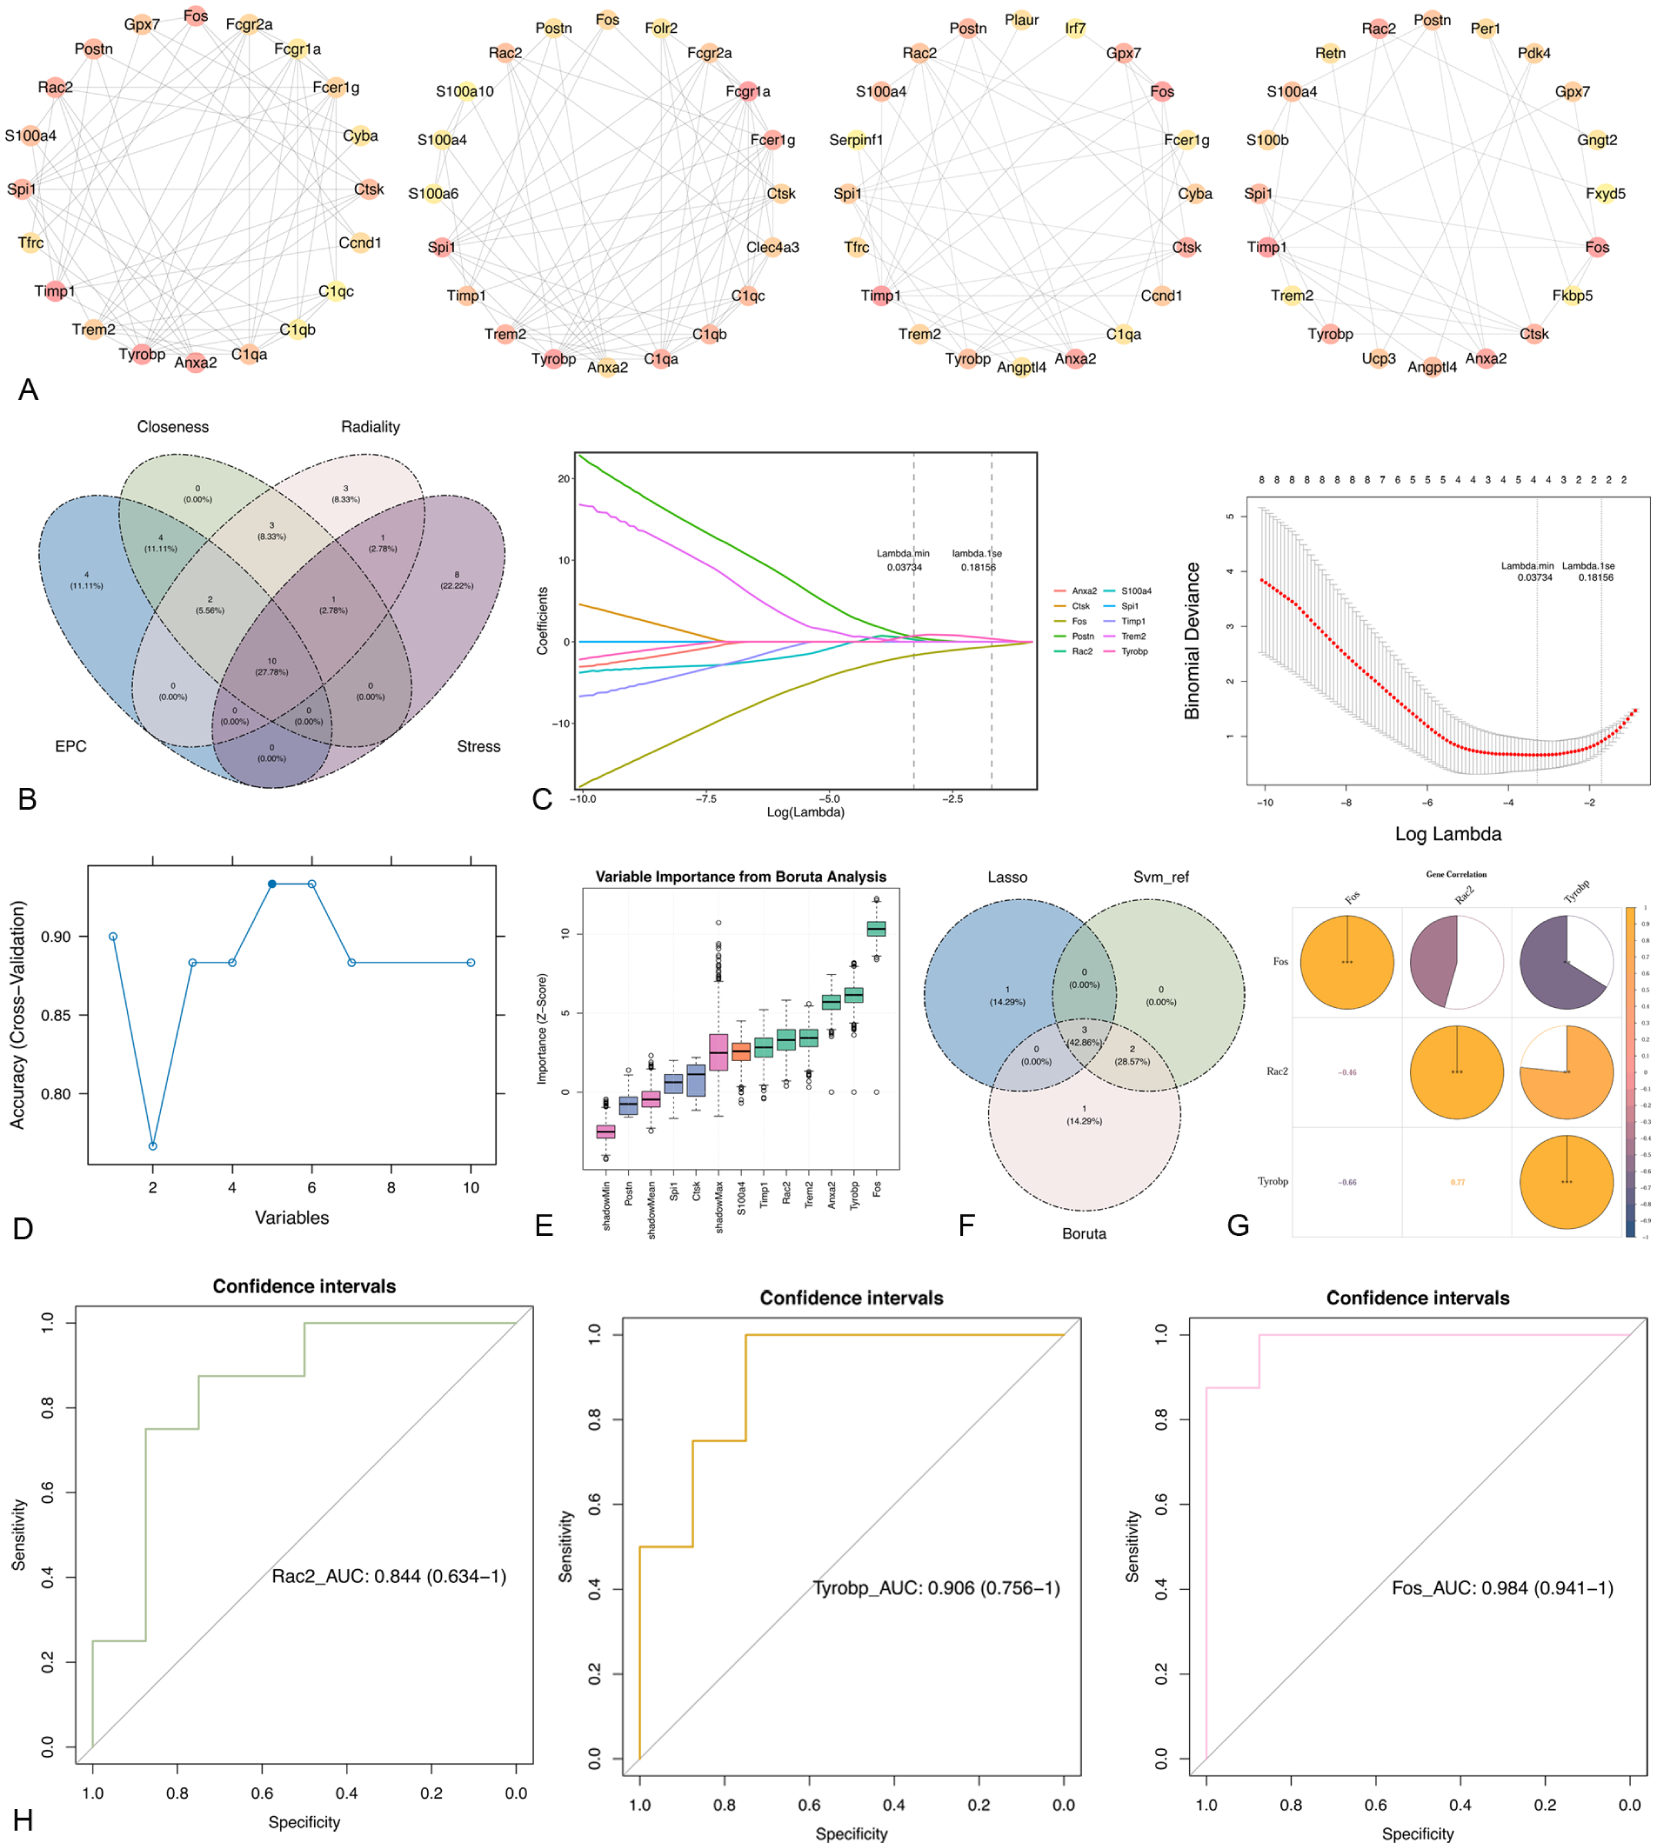
(a) PPI network diagrams of genes screened by four algorithms (closeness, EPC, radiality, and stress). (b) Venn diagram illustrating the gene screening process using four algorithms. (c) LASSO regression analysis of candidate biomarkers to screen for LASSO signature genes. The left figure depicts the LASSO coefficient spectrum, with the horizontal axis representing the logarithm of lambdas and the vertical axis showing variable coefficients, each line corresponding to a gene. As the parameter log λ increases, the regression coefficients (i.e. vertical axis values) progressively converge, ultimately stabilizing at 0. Upon reaching the optimal lambda, coefficients equal to 0 are eliminated. Variables with coefficients equal to 0 are discarded. The right-hand graph displays the logarithm of the penalty coefficient (log λ) on the x-axis and the likelihood deviation on the y-axis. A lower y-axis value indicates superior equation fitting. The dashed line on the left represents Lambda min, that is, the λ value yielding the smallest deviation, signifying optimal model fitting at this lambda value. The dashed line on the right denotes Lambda.1se, where the model exhibits excellent fit while incorporating fewer equations, resulting in a simpler model. (d) SVM-RFE algorithm for candidate biomarkers. (e) Boruta model for candidate biomarkers. The vertical axis in the figure represents feature importance scores, where a higher score indicates a greater contribution to the model. The pink box line denotes shadow features, whose scores typically serve as a baseline. If an actual feature’s score exceeds that of the shadow feature, it is considered significant. Important features are marked in green, unimportant features in light purple, and uncertain features in orange. (f) Taking the intersection of the above three algorithms to get the biomarker. (g) SCorrelation analysis between biomarkers. Yellow denotes positive correlation, blue denotes negative correlation; asterisks indicate significance: *p < 0.05; **p < 0.01; ***p < 0.001. (h) ROC analysis of biomarkers. The horizontal axis 1-Specificity (FPR) represents specificity, that is, the false positive rate (FPR); the vertical axis Sensitivity (TPR) represents sensitivity, that is, the true positive rate (TPR); and the ROC curve illustrates the relationship between sensitivity and specificity. The closer the X-axis is to zero, the higher the accuracy; the greater the Y-axis, the better the accuracy.
When the minimum lambda value was 0.03734, the LASSO algorithm identified four signature genes as candidate genes: FOS, RAC2, POSTN, and TYROBP (Figure 4(c)). Using the SVM-RFE algorithm, the classifier achieved a minimum error when the number of features was identified as five, allowing the selection of five signature genes among the identified candidate genes: FOS, TYROBP, ANXA2, RAC2, and CTSK (Figure 4(d)). The Boruta model was used to select 6 signature genes from the 10 candidate genes: TIMP1, RAC2, TREM2, ANXA2, TYROBP, and FOS (Figure 4(e)). Subsequently, we intersected the genes obtained from the above-mentioned machine learning algorithms and found that FOS, RAC2, and TYROBP were identified by all the algorithms, implying that these genes can be used as potential biomarkers (Figure 4(f)).
We explored the association among three potential biomarkers, and the results revealed that three genes were correlated (Figure 4(g)). The highest significant positive correlation was observed between RAC2 and TYROBP (r = 0.77, p < 0.01), while a significant negative correlation was found between FOS and TYROBP (r = –0.48, p < 0.01). Furthermore, the AUC for each potential biomarker in the transcriptome data of FSN and MOD groups exceeded 0.8 in FSN and MOD (Figure 4(h)), indicating that potential biomarkers can distinguish between FSN and MOD samples. Furthermore, the AUC values for logistic regression, SVM, and RF, as assessed by leave-one-out cross-validation, were all >0.7, suggesting that FOS, RAC2, and TYROBP exhibit good classification performance (Supplemental Figure 1).
Potential biomarkers were involved in multiple signaling pathways
GSEA revealed several signaling pathways and potential biological mechanisms associated with these potential biomarkers. Among the top five pathways, all potential biomarkers were co-enriched in Huntington’s disease, oxidative phosphorylation, PD, and ribosomal pathways. Additionally, FOS and TYROBP were co-enriched in the Alzheimer’s disease pathway, while RAC2 was enriched in the insulin signaling pathway (Figure 5(a)–(c)). These results suggest that FOS, RAC2, and TYROBP may play roles in treating NP with FSN.
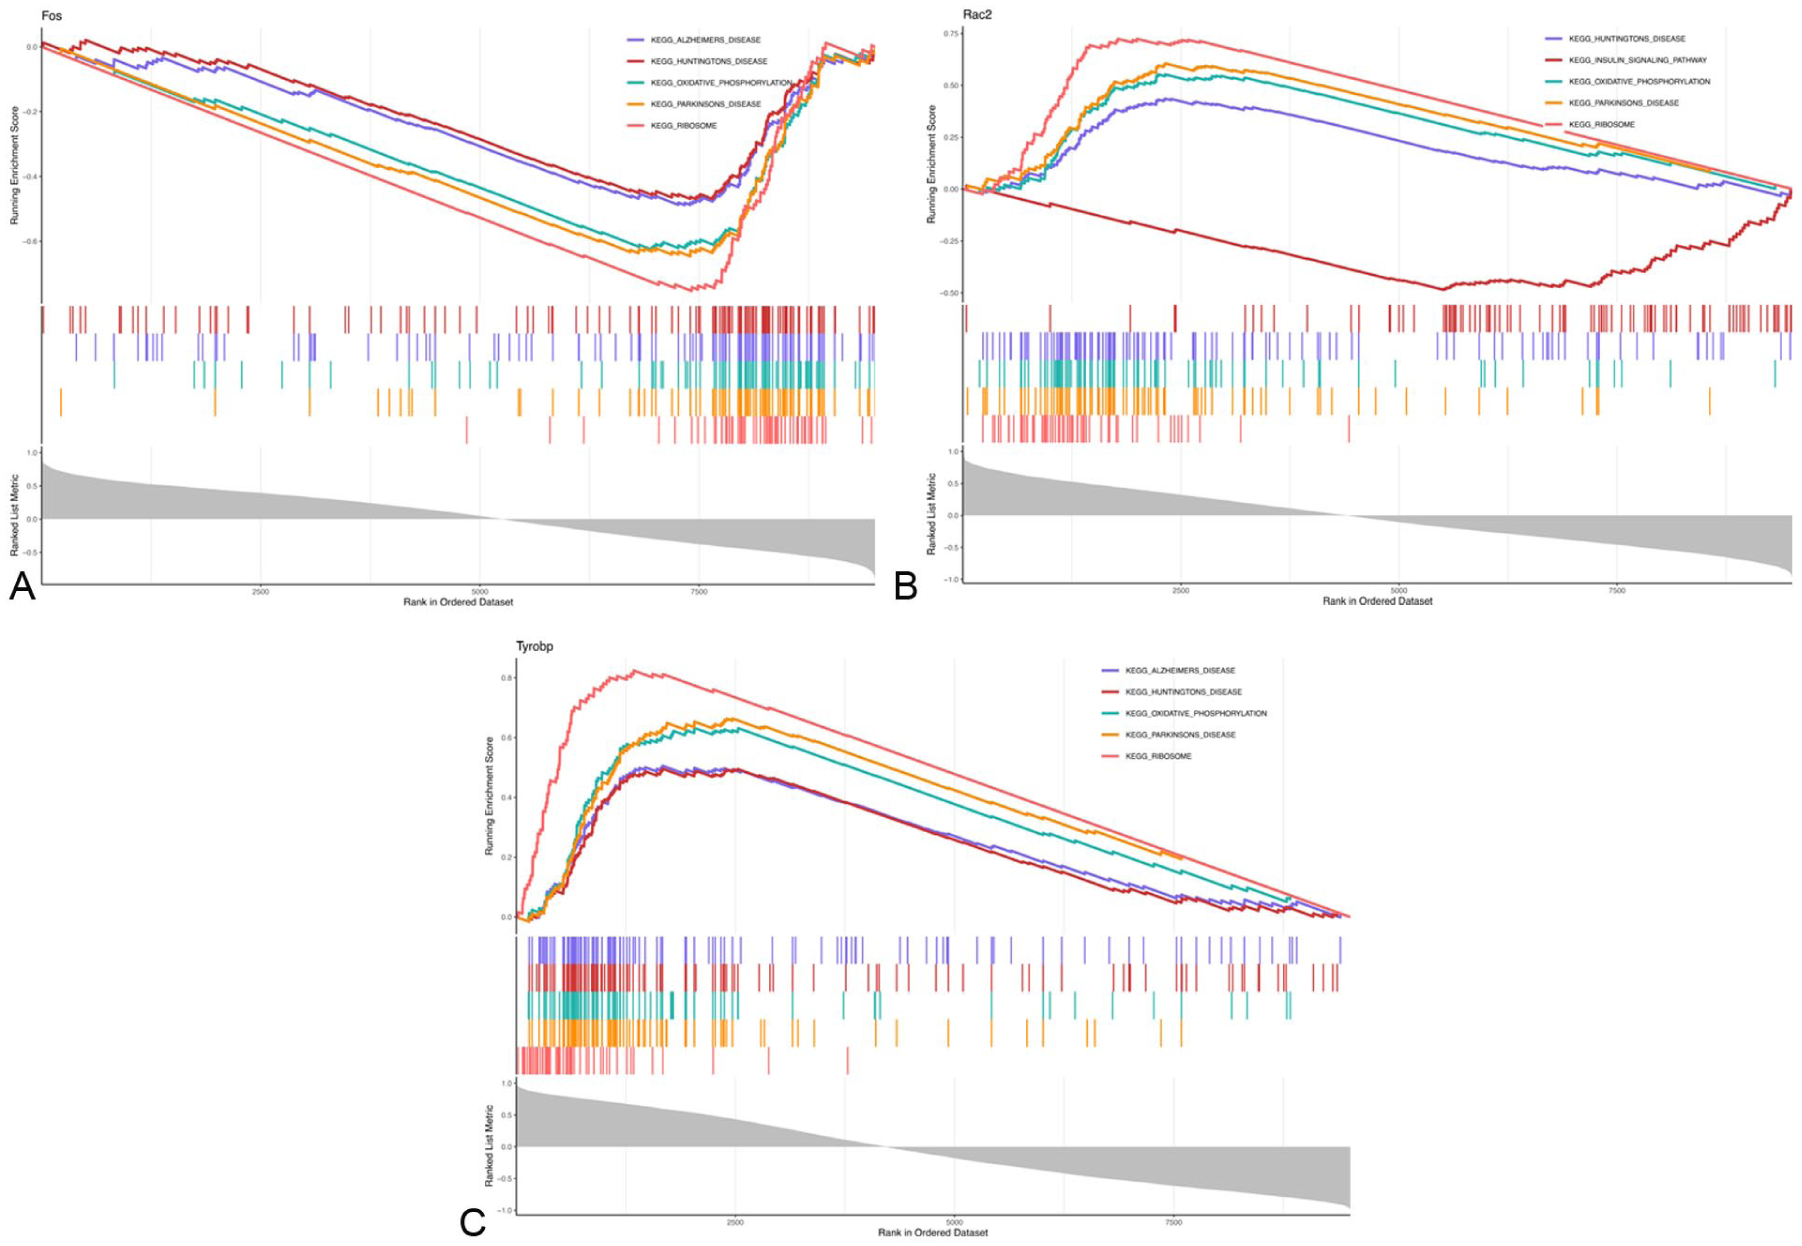
(a) GSEA analysis of FOS. (b) GSEA analysis of RAC2. (c) GSEA analysis of TYROBP. The horizontal axis represents the set of genes to be tested, ordered by gene correlation. The region to the left with values greater than 0 denotes genes positively correlated with the key gene, while the region to the right with values less than 0 denotes genes negatively correlated with the key gene. The vertical axis comprises two sections: one denotes the Enrichment Score, where positive values indicate genes positively correlated with the key gene are associated with the corresponding biological process or pathway and are more likely to be activated or upregulated in the sample, while negative values indicate the opposite; the other part denotes the metric used for gene ranking (Ranked List Metric). A positive Ranked List Metric for a gene indicates its expression is significantly upregulated in the disease group relative to the control group, while a negative value indicates the opposite. Lines of different colors represent distinct biological pathways. Small vertical lines beneath the lines, also colored differently, denote each gene enriched within the corresponding pathway.
Interaction networks were identified among potential biomarkers, miRNAs, and drugs
Based on the miRDB database, we searched for miRNAs that could target some of these potential biomarkers (six miRNAs targeted FOS, seven miRNAs targeted RAC2, and four miRNAs targeted TYROBP). Accordingly, we generated a network with 19 nodes and 17 edges (Figure 6(a)), revealing that mo-miR-92a-2-5p was predicted to co-target RAC2 and TYROBP.

(a) miRNA-biomarker network. (b) Biomarker-drug network. Light yellow circles denote key biomarkers, while blue circles denote miRNAs.
Based on the DGIdb, we identified 25 drugs were predicted to target FOS and 4 drugs were predicted to target RAC2. We did not find any drug related to TYROBP. Then, we constructed a potential biomarker-drug network consisting of 31 nodes and 29 edges (Figure 6(b)). The drug with the highest correlation with FOS was the protein kinase A inhibitor, while the cyclophosphamide anhydrous correlated best with RAC2.
FSN treatment enhanced and attenuated the expression of RAC2, TYROBP, and FOS
We observed that the expression levels of RAC2 and TYROBP were significantly elevated in the FSN group than in the MOD group and in the ACP group than in the MOD group (p < 0.05). However, FOS expression level was lower in the FSN group than in the MOD group (p < 0.001), with no significant differences between ACP and MOD groups (Figure 7(a)–(c)). The expression of these three potential biomarkers was further confirmed by RT-qPCR (Figure 7(d)–(f)), which was consistent with the previous results, indicating that these potential biomarkers play a role in treating NP with FSN.

(a–c) Gene expression analysis of FOS, RAC2, and TYROBP between MOD and CON groups, FSN and MOD groups and ACP and MOD groups (p < 0.05); (d–f) RT-qPCR experimental validation of three biomarkers.
Discussion
NP is a chronic pain. In this study, we successfully established a rat CCI model. We identified three potential biomarkers (FOS, RAC2, and TYROBP) for FSN treatment via bioinformatics analysis, and verified their expression using qPCR. We analyzed the biological pathways involved in the potential biomarkers and potential molecular mechanisms using bioinformatics, providing a new reference for treating NP with FSN.
Initially, we identified three potential biomarkers: FOS, RAC2, and TYROBP. FOS proteins are part of the transcription factor AP-1, which binds to specific DNA sequences to regulate the expression of downstream genes. In the nervous system, FOS gene expression serves as a biomarker for neuronal activity. Although FOS is a ubiquitous immediate-early gene and a general marker of cellular and neuronal activation with limited specificity for NP, its dynamic expression in the local fascial microenvironment is highly relevant to nociceptive hypersensitivity. c-Fos recognizes activated cells that respond to various stimuli, including pain.27–29 Notably, recent studies have demonstrated that downregulation of the FOS gene in ischemic stroke models significantly increases oxidative stress levels, promotes neuronal apoptosis, and inhibits mitochondrial function. 30 Previous research has confirmed that FSN treatment effectively improves mitochondrial function in skeletal muscles of sciatica rats, alleviating energy metabolism disorders and oxidative damage. 12 In conjunction with the findings of this study, FOS expression was markedly lower in the FSN group compared to the model group (p < 0.001), leading us to hypothesize that FSN may mitigate FOS-mediated mitochondrial dysfunction and oxidative stress by suppressing excessive FOS expression, thereby alleviating NP. Future studies could validate the causal role of FOS overexpression or downregulation in FSN’s enhancement of mitochondrial function and analgesic effects in CCI rats.
RAC2 is a member of the RAC family. RAC2 can regulate the polymerization and depolymerization of actin filaments, affecting cell morphology changes, migration, and intercellular adhesion. 31 The immune system is involved in the functional regulation of various immune cells. RAC2 activates the superoxide-producing NADPH oxidase complex, leading to the production of large amounts of reactive oxygen species (ROS), exacerbating oxidative damage and energy metabolism disorders. 32 However, other studies have demonstrated that NADPH oxidase is indispensable in the clearance of apoptotic cells (ACs) by inflammatory macrophages, with the ROS it generates promoting phagosome maturation and intracellular acidification, thereby accelerating the degradation of ingested apoptotic cells. 33 This study found that RAC2 expression was significantly downregulated in the skeletal muscle of CCI model rats, but recovered markedly following FSN treatment. Given the aforementioned contradictions –namely, that RAC2-mediated ROS may both exacerbate injury and participate in the clearance of necrotic debris, we hypothesize that FSN alleviates neuropathic pain by restoring moderate RAC2 expression, thereby moderately activating NADPH oxidase to generate controlled ROS for the clearance of pathogens or necrotic tissue. Future studies could utilize immunofluorescence colocalization to identify the cellular origin of RAC2 and, in combination with specific knockout or overexpression models, further validate the necessity of restored RAC2 expression in the analgesic effects of FSN.
In immune cells, TYROBP regulates immune cell activation and signaling. It can bind to the receptor triggered on myeloid cell 2 (TREM2), 34 receive extracellular signals, and transmit them to the cell, leading to phosphorylation of TYROBP after ligand recognition and activation of downstream signaling pathways, thereby regulating immune cell differentiation, proliferation, phagocytosis, apoptosis, and inflammatory response. 35 Additionally, Studies have shown that the TREM2-TYROBP complex is widely expressed in macrophages and microglia, and primarily influences cellular polarization and inflammatory responses by regulating the NF-κB signaling pathway. 36 Upon binding to TYROBP, TREM2 triggers the recruitment and phosphorylation of downstream signaling molecules, thereby activating pathways such as PI3K/Akt, NF-κB, and nuclear factor of activated T cells (NFAT). 37 Furthermore, in Tyrobp-knockout RAW264.7 macrophages, the absence of this gene impairs phagocytic function. 38 In this study, we observed a significant downregulation of TYROBP expression in the skeletal muscle of CCI model rats, which was markedly restored following FSN treatment. Evidence suggests that FSN treatment significantly reduces serum levels of TNF-α and IL-6 in rats with a model of neuropathic pain, 15 and RNA sequencing and GSEA confirm that FSN effectively inhibits inflammatory pathways and promotes the expression of neurotrophic factors. 14 These findings suggest that TYROBP may participate in FSN-mediated treatment of NP by regulating immune cell function and inflammatory responses. It should be noted that the aforementioned hypothesis regarding the mechanism by which TYROBP regulates immune-inflammatory responses to facilitate FSN treatment of NP is primarily based on bioinformatics analysis and existing literature; further in vitro and in vivo experiments, such as gene knockout, overexpression, or specific inhibitor studies, are required to validate the causal relationship and specific molecular networks.
In this study, GSEA was used to explore pathways in which three potential biomarkers were co-enriched: Huntington’s disease, oxidative phosphorylation (OXPHOS), PD, and ribosomes. Abnormal electron transfer during OXPHOS generates ROS, and excessive ROS production triggers oxidative stress and cell damage. OXPHOS inhibition can lead to excessive generation of ROS and mitochondrial dysfunction, causing various pathological pain.39–41 The pain caused by OXPHOS inhibition may be effectively alleviated by antioxidant treatment, improvement of mitochondrial function, and inhibition of pain signaling pathways. Previous studies have demonstrated that FSN therapy in CCI models can lead to increased levels of FGFR1, FGFR3, phosphorylated ERK, and phosphorylated FOXO3 and can effectively alleviate the damage to muscle energy metabolism and protein expression caused by CCI 16 demonstrating its therapeutic potential in NP. NP can increase the expression of phosphorylated mammalian target of rapamycin (p-mTOR), protein S6 kinase beta-1 (p-S6K1), and phosphorylated eukaryotic translation initiation factor 4E-binding protein (p-4E-BP1). However, acupuncture intervention attenuated the upregulation of mTOR signaling in rats with NP, alleviating both mechanical and thermal pain thresholds. 42 Consequently, these enriched pathways provide new ideas for NP treatment.
By constructing a molecular regulatory network, this study identified several miRNAs that may target FOS, RAC2, and TYROBP. Among these, miR-92a-2-5p targets both RAC2 and TYROBP. Previous studies have reported that certain miRNAs (such as miR-129-5p and miR-7a-5p) are associated with neuropathic pain,43,44 while others (such as miR-222-3p, miR-221-3p, and miR-544-3p) are linked to osteoarthritis pain.45,46 Furthermore, the remaining miRNAs in the network are currently known to be involved in the pathological processes of various other diseases,47–58 but have not yet been confirmed to be associated with NP. Consequently, we speculate that these genes may be potential biomarkers for FSN treatment in NP. It should be emphasized that the above results are derived from computational predictions based on the database and require further experimental validation.
Based on computational predictions using the DGIdb database, protein kinase A inhibitors and anhydrous cyclophosphamide have been identified as potential candidate drugs for targeting FOS and RAC2, respectively Local injection of protein kinase A inhibitors in the anterior cingulate cortex can effectively block the phosphorylation of GluR1 Ser845 and reduce pain hypersensitivity and anxiety, while the c-Fos levels exhibit no significant change. 59 Cyclophosphamide can cause bladder inflammation and pain, and is a commonly used animal model for interstitial cystitis/bladder pain syndrome. 60 However, these studies have not directly demonstrated that protein kinase A inhibitors or cyclophosphamide exert their analgesic effects via FOS or RAC2. Consequently, the drug prediction results from this study provide preliminary insights for further experimental investigation; these predictions will need to be directly validated in future animal studies or cell models.
Bioinformatics analyses, including variance analysis, PPI network, and machine learning, were used to identify three potential biomarkers associated with FSN treatment for NP. Furthermore, based on the potential biomarkers, GSEA enrichment analysis, molecular regulatory network analysis, and drug prediction were performed.
Limitations
This study has certain limitations. First, the muscle tissue samples used in this study were primarily selected based on the sites of action of FSN and its regulatory role in muscle repair; however, the association between the identified biomarkers (FOS, RAC2, TYROBP) and the core neural mechanisms of NP requires further validation in key neural tissues such as the dorsal root ganglia or the spinal cord. Second, the sample size was relatively small, and insufficient statistical power may have compromised the reliability of the differential expression results, increased the risk of false positives, and thereby weakened the robustness of the transcriptomic biomarker discovery. Furthermore, this study validated biomarker expression levels solely via RT-qPCR and did not conduct functional experiments such as gene knockdown, overexpression, or pharmacological interventions; therefore, the causal roles of FOS, RAC2, and TYROBP in FSN-mediated analgesic effects remain unclear. Future studies will validate the expression changes of these three biomarkers in the dorsal root ganglion and spinal cord of the CCI model, expand the sample size of independent cohorts, and employ multiple hypothesis testing to reduce the false-positive rate; simultaneously, in vivo functional experiments – such as local injection of lentivirus-mediated shRNA to knockdown RAC2 or TYROBP in the dorsal root ganglion, AAV-mediated overexpression of FOS, and administration of pharmacological inhibitors – will be conducted to observe their effects on mechanical and thermal pain thresholds, thereby clarifying the causal relationships and molecular mechanisms of FOS, RAC2, and TYROBP in the treatment of neuropathic pain by FSN.
Supplemental Material
sj-xlsx-1-mpx-10.1177_17448069261459255 – Supplemental material for Transcriptome profiling and experimental validation identify FOS, RAC2, and TYROBP as potential biomarkers for Fu’s subcutaneous needling in neuropathic pain treatment
Supplemental material, sj-xlsx-1-mpx-10.1177_17448069261459255 for Transcriptome profiling and experimental validation identify FOS, RAC2, and TYROBP as potential biomarkers for Fu’s subcutaneous needling in neuropathic pain treatment by Huiqin Fang, Yaping Li, Jiaqi Li, Yarong Sun and Yunhua Zang in Molecular Pain
Supplemental Material
sj-xlsx-2-mpx-10.1177_17448069261459255 – Supplemental material for Transcriptome profiling and experimental validation identify FOS, RAC2, and TYROBP as potential biomarkers for Fu’s subcutaneous needling in neuropathic pain treatment
Supplemental material, sj-xlsx-2-mpx-10.1177_17448069261459255 for Transcriptome profiling and experimental validation identify FOS, RAC2, and TYROBP as potential biomarkers for Fu’s subcutaneous needling in neuropathic pain treatment by Huiqin Fang, Yaping Li, Jiaqi Li, Yarong Sun and Yunhua Zang in Molecular Pain
Supplemental Material
sj-xlsx-3-mpx-10.1177_17448069261459255 – Supplemental material for Transcriptome profiling and experimental validation identify FOS, RAC2, and TYROBP as potential biomarkers for Fu’s subcutaneous needling in neuropathic pain treatment
Supplemental material, sj-xlsx-3-mpx-10.1177_17448069261459255 for Transcriptome profiling and experimental validation identify FOS, RAC2, and TYROBP as potential biomarkers for Fu’s subcutaneous needling in neuropathic pain treatment by Huiqin Fang, Yaping Li, Jiaqi Li, Yarong Sun and Yunhua Zang in Molecular Pain
Supplemental Material
sj-xlsx-4-mpx-10.1177_17448069261459255 – Supplemental material for Transcriptome profiling and experimental validation identify FOS, RAC2, and TYROBP as potential biomarkers for Fu’s subcutaneous needling in neuropathic pain treatment
Supplemental material, sj-xlsx-4-mpx-10.1177_17448069261459255 for Transcriptome profiling and experimental validation identify FOS, RAC2, and TYROBP as potential biomarkers for Fu’s subcutaneous needling in neuropathic pain treatment by Huiqin Fang, Yaping Li, Jiaqi Li, Yarong Sun and Yunhua Zang in Molecular Pain
Footnotes
Author contributions
Y.Z. conceived and designed the experiments, H.F. wrote the manuscript, H.F., J.L., Y.S., and Y.L. performed the experiments, analyzed the data and completed paintings. Y.Z. completed manuscript revisions. All authors reviewed the manuscript.
Declaration of conflicting interests
The authors declared no potential conflicts of interest with respect to the research, authorship, and/or publication of this article.
Funding
The authors disclosed receipt of the following financial support for the research, authorship, and/or publication of this article: This work was supported by the Medical and Health Research Project of Bao’an District Medical Association in Shenzhen (BAYXY2024041), the Shenzhen Municipal Science and Technology Program Project (JCYJ20220530162614031), and the Traditional Chinese Medicine Research Project of Guangdong Provincial Administration of Traditional Chinese Medicine in 2025 (20252038).
Ethical declaration
This study was implemented after approval by the Medical Ethics Committee of Qingdao Hospital of Traditional Chinese Medicine. Ethical Approval Number: 2022HC12LS032.

Data sharing statement
All the data in the manuscript are available upon reasonable request from the corresponding author.*
Supplemental material
Supplemental material for this article is available online.
References
Supplementary Material
Please find the following supplemental material available below.
For Open Access articles published under a Creative Commons License, all supplemental material carries the same license as the article it is associated with.
For non-Open Access articles published, all supplemental material carries a non-exclusive license, and permission requests for re-use of supplemental material or any part of supplemental material shall be sent directly to the copyright owner as specified in the copyright notice associated with the article.
