
Abstract
This study tested a model of patient loyalty, patient satisfaction, and providers switching. The data were analyzed in two separate stages but linked sequentially with structural equation modeling using partial least squares. A comparison of expectations and actual experiences of patients revealed two effects. If their actual experience was better than their expectations, they became loyal, but if the opposite occurred, they generally switched to other health care providers. This negative effect was not observed when the patients’ treatment modes were considered—they would still choose the health service because of imposed circumstances. The switching behavior of the patient is also not a moderating variable.
Introduction
Recently, research into consumer loyalty to goods and services has increased rapidly. The consumers in question include patients who are loyal to health care providers. As with other service providers, those in health care should focus all their marketing activities on generating loyal customers and should aim to achieve high levels of loyalty. To achieve high loyalty, a service provider must provide high customer value. 1 Based on MacStravic, value is something owned by the customers; it is delivered by organizations (quality-for-price value) but is gained by the customers (benefit-for-cost value). 2 Heskett, Sasser, and Schlesinger explained that there is an important relationship between customer satisfaction and customer loyalty in competitive industries. This relationship is particularly strong when customers are very satisfied. However, authors have also found a strong link between dissatisfaction and disloyalty. 3 Satisfaction is considered the dominant affective reaction amongst, for example, regret, happiness, and disappointment. 4
According to Baird, 5 health care is a very personal service. Patients share their most intimate secrets. They come to health services in a condition of emotional and physical stress. Emotions run high when people are under stress. Health care services are complex in nature, with a high involvement of the patient in interactions with the physician. 6 The patient as customer has particular characteristics that differ from customers in other contexts; their behavior is determined by various factors such as their unavoidable physical condition, their specific disease and the gravity of their case, etc. He or she does not have a choice in the type and quality of treatment, the diagnosis, or even the prescribed drug (p. 22). 6 Patients prefer to choose physicians based on the quality of trust (p. 24). 6
In complex services (e.g. health care), as explained by Rao and Dasu (p. 283), 4 customers who access the services use only a subset of the services and use them rarely or only once. During a meeting with a service provider, the customer may not receive clear expectations about the process and/or outcome of the impending services. This can increase the likelihood of a customer being dissatisfied or feeling they received poor service. Ordinary patients (those without medical knowledge), do not have enough knowledge about their disease; they rely upon physicians (pp. 22–23). 6 Every time there is an interaction between physicians and patients, there is an opportunity for evaluation of how well physicians meet patient expectations. 7 Each patient expectation, based on Absar and Rahman 8 must be adequately addressed by physicians, because satisfaction and expectations are entwined. The combination of consumer expectation and service performance results in satisfaction or dissatisfaction. The results of research conducted by Lee 9 consistently showed that customers have a tendency to be dissatisfied with their experience of medical treatment. Neira et al. 10 state that the failure of a service due to a perceived lack of preferential treatment may lead to an increase in customer dissatisfaction.
Dissatisfaction is significantly influenced by three traditional behavioral responses. The greater the dissatisfaction of customers, the more likely they are to switch providers, complain, and discuss their dissatisfaction with others. 11 Halstead 12 found in his research, supporting the findings of previous researchers, that dissatisfied consumers engage in significantly more word-of-mouth behavior compared with consumers who are satisfied, and will inform more people about their unsatisfactory experience. Baird (p. 8) 5 adds that dissatisfied customers tell 13 other people. Ho et al. 13 found that dissatisfaction with emergency services (emergency care coverage and procedures, walk-in appointments, and 24-h telephone consultations) increased the likelihood of switching health care providers.
Astuti and Nagase 14 explain the antecedents of loyalty in health care organizations through relationship marketing and patient satisfaction. Based on a comprehensive dataset, considering both male and female patients and the age of patients, they found that patient satisfaction had a positive and significant effect on loyalty. This report differs from the research of Astuti and Nagase in two respects: it considers patient loyalty as a dependent variable influenced by satisfaction and patient transfer to another provider; and the data analysis for loyalty of patients was based on the mode of their treatment being a general practitioner, specialist physician, or dentist.
Satisfaction and switching are the antecedents of increased and decreased loyalty, respectively. This study sought to examine more deeply how the loyalty of patients in health care is strengthened (through satisfaction) or weakened (resulting in or from switching providers), based on a comprehensive dataset including the mode of treatment (general practitioner, specialist physician, or dentist).
Literature review and hypotheses
Patient satisfaction and patient loyalty
Many researchers have discussed and defined loyalty, including its consequences and influencing factors. Dick and Basu 15 define loyalty as a combination of relative attitude and repeat patronage. The combination resulted in four levels of loyalty—true loyalty, latent loyalty, spurious loyalty, and no loyalty. Gremler and Brown 16 concluded from the results of their literature review that the construct of service loyalty consists of three separate dimensions, namely behavioral loyalty, attitudinal loyalty, and cognitive loyalty. The authors concluded that loyalty is the extent to which customers engage in repeat purchase behavior, have a positive attitude towards service providers, and use only the provider when a need for the service arises. MacStravic (p. 15) 2 described loyalty through the concept of a Loyalty Marketing Wheel. He explained loyalty as two parts that together form a circle, similar to a wheel. The first part addresses loyalty-focused approaches to learning about consumers, linking the five steps of delivering value to consumers (learn, manage, promise, track, and remind). The second part relates to securing return-value contributions from consumers (share, recognize, monitor, promote, and evaluate). The loyalty marketing chains have been represented using a wheel metaphor because service providers are expected to rotate through the same steps repeatedly, moving the wheel forward. The wheel reflects the new challenge that loyalty marketing presents to health plans and providers: to be loyal to consumers to achieve and retain their loyalty.
According to Newsome and Wright, 17 followed by many subsequent researchers, patient satisfaction and customer satisfaction are not the same thing. The separation was necessary because the marketing-oriented conceptual model was not easy to apply, or was simply inappropriate for many common medical scenarios. The authors add (p. 165) 17 that health is not homogeneous; it is typically a complex blend of emotions, the real and the unreal, and the consumption of health cannot be seen. Patients may be using different criteria to assess the management of life-threatening emergencies compared with routine health checks. Evaluation may differ depending on whether it was the patient or the health care professional that identified the problem in the first place. Jenkinson et al. 18 reported the level of satisfaction’ patient with their hospital care by willingness to recommend the hospital. The authors found that most respondents explained their period of inpatient care and would definitely recommended hospital to family and friend as good, very good, and excellent by 6.9%, 36.8%, and 56.2%, respectively. However, many patients who reported satisfaction with the care they received also indicated a problem with their inpatient treatment.
Each time a customer/patient comes into contact with any aspect of the service system (service encounters), they are presented with the opportunity to evaluate the services and quality of service providers to form an opinion (p. 25). 6 Rational preferences, and the emotional bond that exists between the consumer and the service provider, created by satisfaction, result in high customer loyalty (p. 36). 1 Previous researchers have linked customer satisfaction and loyalty. Lee and Lee 19 identified the difference between intentions and behaviors related to loyalty. Their results showed a strong relationship between satisfaction and brand loyalty, confirmed through logistics regression analysis of average, and differentiation. Satisfied customers tend to show brand loyalty. Gronholdt et al. 20 concluded that customer satisfaction has a positive effect (strong significance) on the formation of loyalty.
Based on the foregoing, the following hypothesis was proposed: H1: Patient satisfaction positively affects patient loyalty.
Patient satisfaction and switching
Baker (pp. 2–3) 7 explains the need to understand and manage the expectations of patients as much as possible to reduce the difference between their expectations and actual experiences. When consumers feel that the performance of a product is worse than expected, they feel dissatisfied (p. 36). 1 Zeithaml et al. (p. 180) 3 explained that a service failure is generally described as service performance that falls below a customer’s expectations in such a way that leads to customer dissatisfaction.
Consumers who experience a service failure will react in various ways. As described by Zeithaml et al. (pp. 185–186), 3 consumers have two ways of reacting; actively and passively. Consumers who are passive do not complain, possibly because they do not know how to complain, or because they did not believe that the complaint was positive. Those who are active do make complaints, for various reasons, and either through direct complaints to the service provider, negative word of mouth, or the use of a third party. All reactions, whether passive or active lead to the same ends: they leave or switch to another provider, or stay and/or keep taking the product. As explained by Bolfing, 21 the customer moves through a sequence of dissatisfaction responses (complaining, negative word of mouth, and switching).
Word of mouth is defined by Lau and Ng 22 as oral, person-to-person communication between a perceived noncommercial communicator and a receiver, concerning a brand, product, or service offered for sale. Based on discrete choice models, Wangenheim and Bayon 23 found that 68.9% of respondents were correctly predicted to stay or switch. One of the considerations is satisfaction. Consumers will switch, but there is also subsequent switching behavior due to the effect of word of mouth. Halstead (p. 7) 12 found in his research that the consumers with unsatisfactory experiences will communication more negatively to others than those who are satisfied.
Brand switching in general is change from one brand to another. In health care organization context, patients switch from one health care provider to another. Uturestantix et al. 24 found that consumer dissatisfaction was a positive influence on brand switching decisions. In other words, satisfaction was inversely proportional to switching. The consumer who was not satisfied would attempt to find information on other products that they deemed to have added value and that were in line with their expectations, and they may stop buying products or influence others not to buy. McDougall and Levesque 25 concluded in their research that brand switching was inversely related to satisfaction, in other words satisfaction negatively affected brand switching.
Based on the foregoing, the following hypothesis was proposed: H2: Patient satisfaction inversely affects patient switching
Patient switching and patient loyalty
The cause of switching to another provider is variation. For example, customer switching in service industri caused by pricing, inconvenience, core service failures, service encounter failures, employee responses to service failures, atraction by competitors, ethical problems, and involuntary 26 or according to Mazursky et al., 27 consumer switching a brand caused by extrinsic (price and coupon) and intrinsic (a desire to try a new brand).
Based on findings Van Trijp and Inman, 28 variaety-seeking was a different pattern of loyalty and may be a cause of the switch from a brand. The conclusion from the research on search behavior variations was that someone who has the need to seek higher variation is more likely to engage in variety-seeking behavior than in repeat purchases.
A patient who has not received satisfactory service can switch to another physiciant. 29 In other words, the patient is no longer loyal because he or she did not receive satisfactory service and is able to switch to another service provider.
Based on the foregoing, the following hypothesis was proposed: H3: Patient switching negatively affects loyalty
Patient switching mediates the relationship between patient satisfaction and loyalty
Consumer dissatisfaction after purchase due to performance of the product is lower after the introduction of information and the evaluation of a brand. For the manager of services, measurement of switching intention and loyalty are important. According to Lapre, 30 service failure followed by poor service recovery leads to customer dissatisfaction.
Singh adopted the theory of Hirschman (1970), a conceptual framework of exit, voice and loyalty in his research on Industry Characteristics and Consumer Dissatisfaction. In research investigating respondents who experienced dissatisfaction in the three categories of services (grocery, auto-repair, and medical care), Singh (p.40) 29 found that over 63% of dissatisfied, patients had changed physicians (exit).
Based on the foregoing, the following hypothesis was proposed: H4: Patient switching mediates the relationship between patient satisfaction and loyalty.
Data and methodology
Research design
This study was designed to test the associations among patient satisfaction, patient switching, and loyalty as well as to examine whether patient switching mediated the association between patient satisfaction and loyalty to health care organizations.
Operational definitions of research variables and indicators
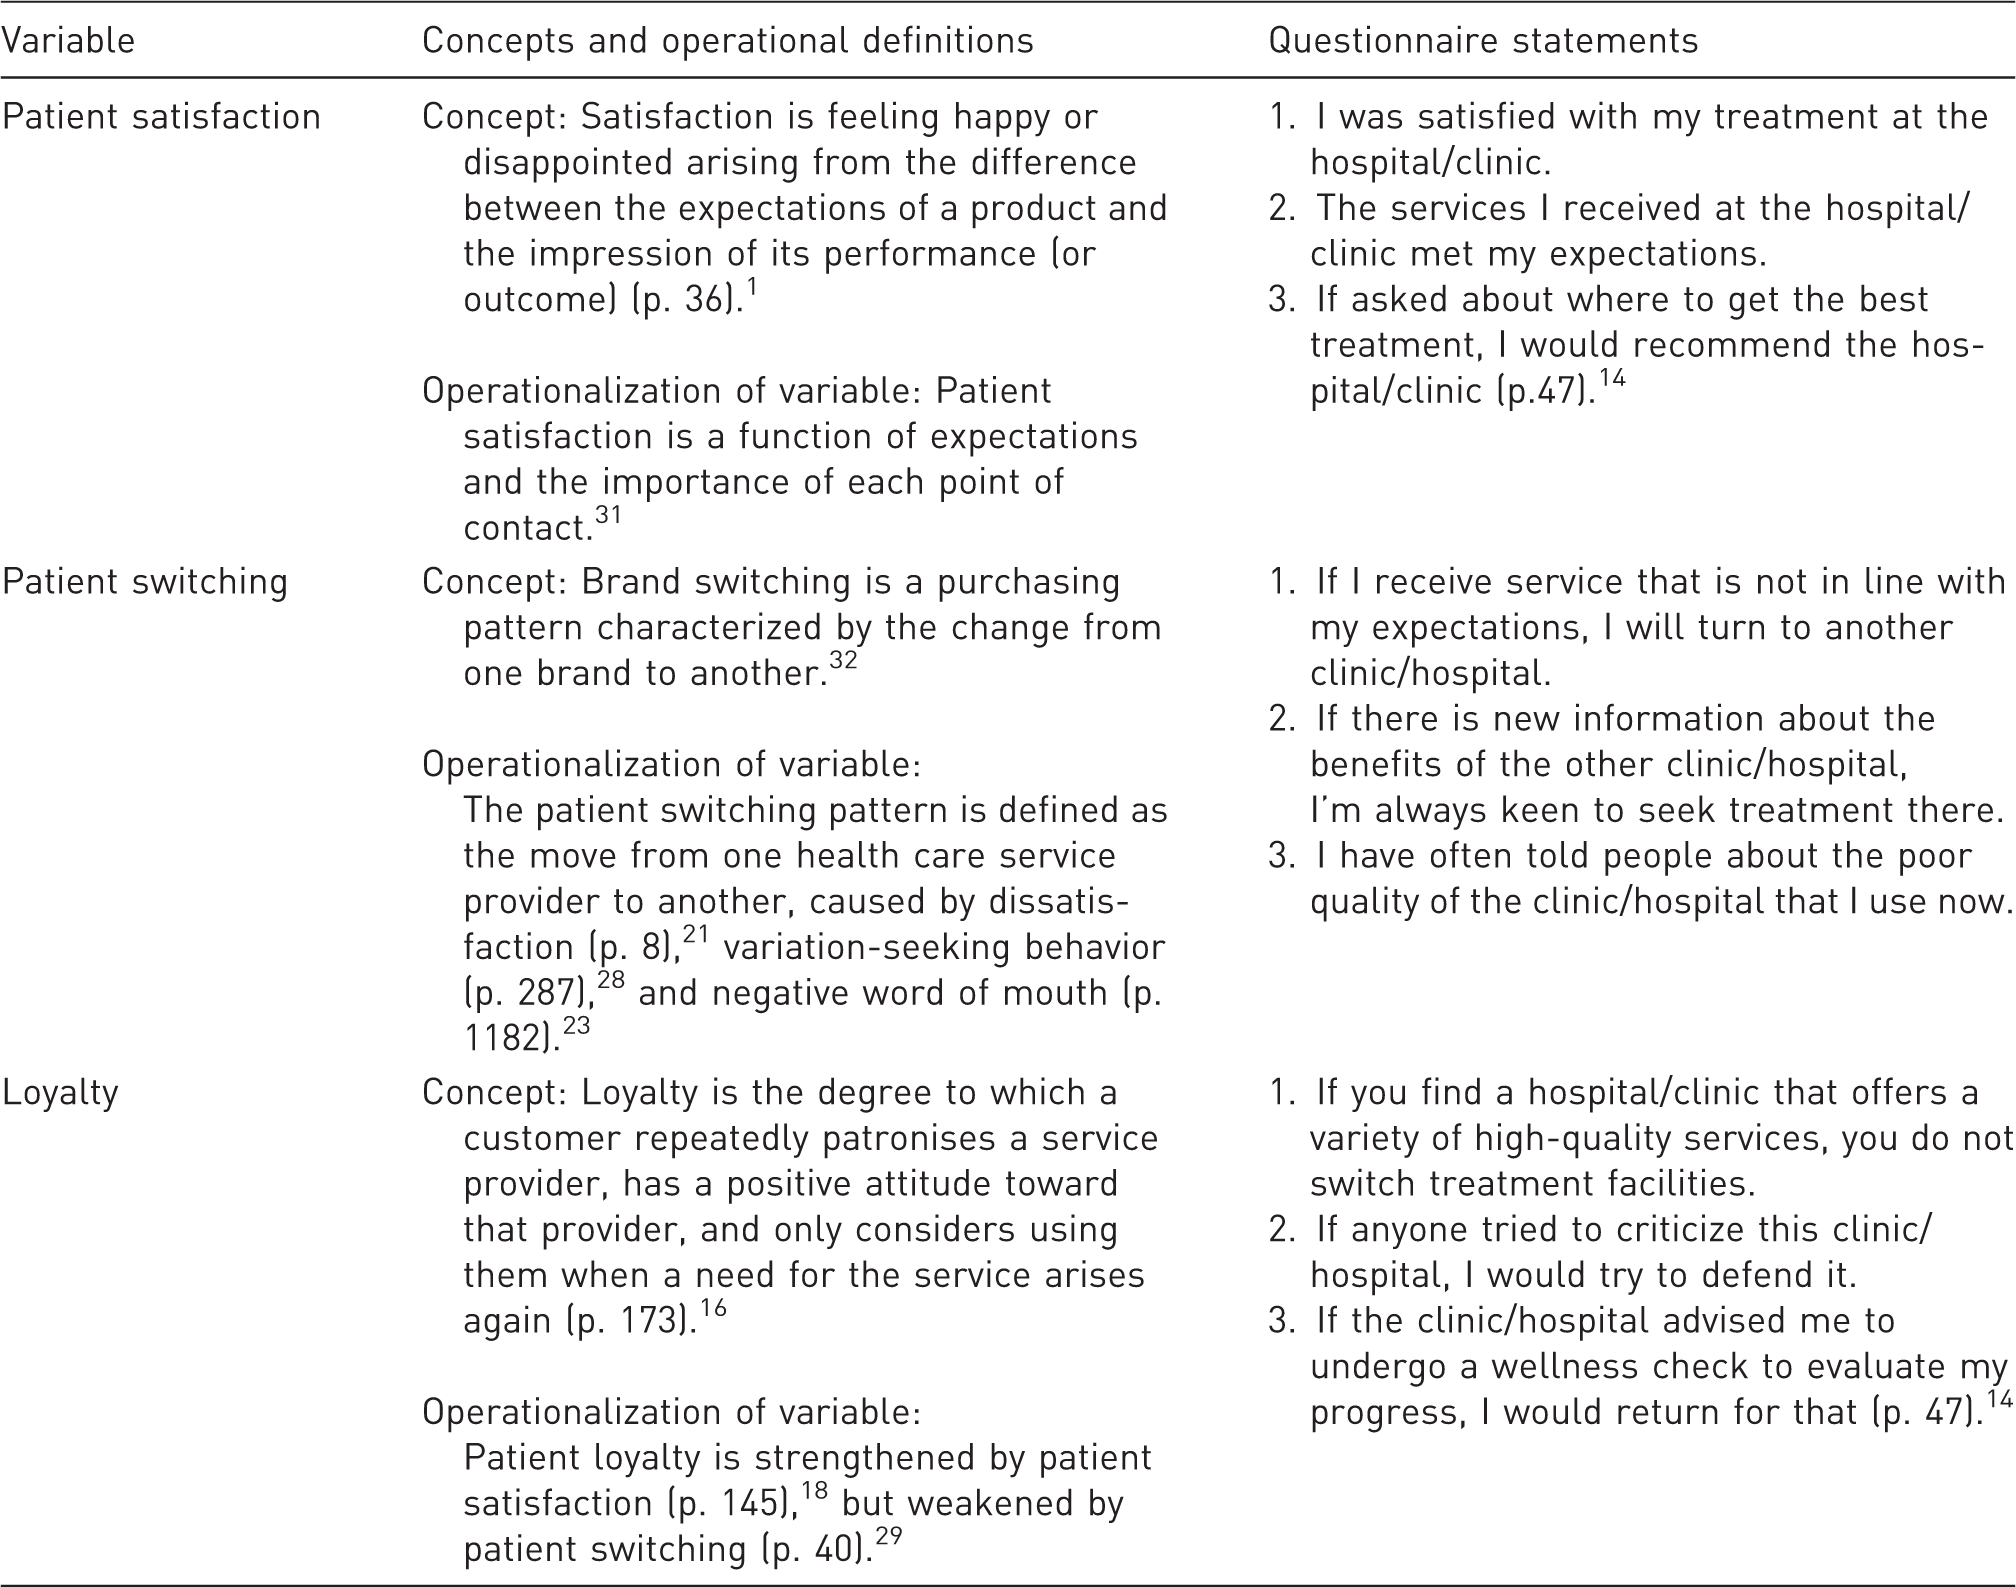
Data collection
We distributed questionnaires to patients undergoing outpatient treatment between 15 February and 15 March 2013. The response rate was 97%. There were 122 male and 185 female respondents, and from the perspective of the mode of treatment, 169, 107, and 31 patients were treated by general practitioners, specialist physicians and dentists, respectively.
Data analysis
The analysis was carried out through structural equation modeling (SEM) using partial least squares (PLS Smart 2.0). According to Chin, 33 SEM involves generalization and extension of first-generation procedures, such as the main component analysis, factor analysis, discriminant analysis, and multiple regressions. The model was constructed based on the structural relationships among latent variables, based on the formulation of the research problem or hypothesis. The application of certain constraints or assumptions in SEM allows for more flexibility. According to Henseler and Fassot, 34 PLS path modeling is used to analyze the moderating effects of variations in factors that affect the strength or direction of the relationship between exogenous and endogenous variables.
In designing the measurement model (outer model), measures used for the constructs included convergent and discriminant validity, composite reliability, and Cronbach’s α. Convergent validity measures the magnitude of the correlation among the latent variables within a construct by examining the reliability of an item in terms of a standard loading factor. A correlation can be said to be valid if it has a value >0.7. Loadings of 0.5 or 0.6 may be acceptable if the research is still at the early stage of developing measurement scales. 35 The next evaluation assessed and compared the discriminant validity and the square root of the average variance extracted (AVE). The recommended value is >0.5. 36 Composite reliability values of >0.6 indicate that the construct is reliable. 37 Test reliability was assessed using Cronbach’s α, which assesses the consistency of items; the value is acceptable if α ≥ 0.5.
The next stage was to design the structural model (inner model); after the model was judged to meet the criteria for the outer model, the structural models were tested. This stage assessed the relationship among the latent variables based on the study’s theoretical assumptions. The design of a structural model of the relationships among latent variables is based on the formulation of the research problem or hypothesis (Figure 1).
Model of patient loyalty to health care organizations through patient satisfaction and patient switching.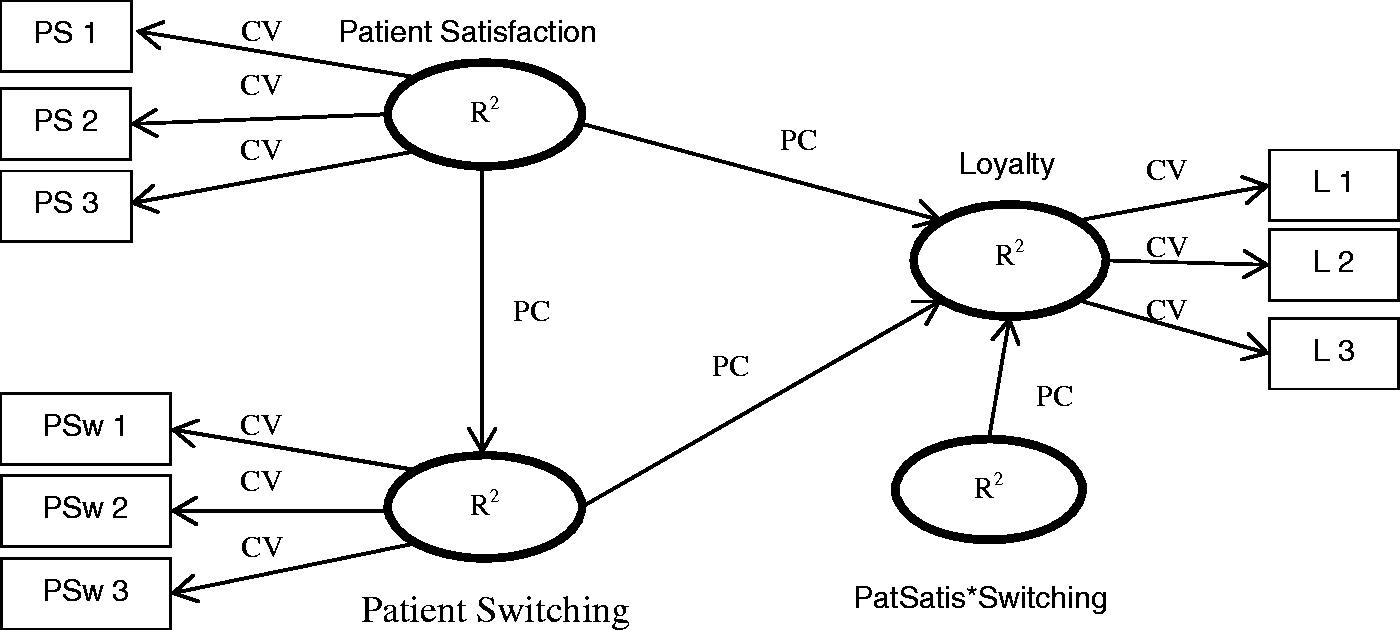
The structural model was tested by evaluation of goodness of fit and path coefficients.
Measurement and designed model
The model analyzed the data in two stages. In the first stage, the data were analyzed as a comprehensive dataset. In the second stage, the data were separated based on the mode of treatment.
Measurement model (outer mode)
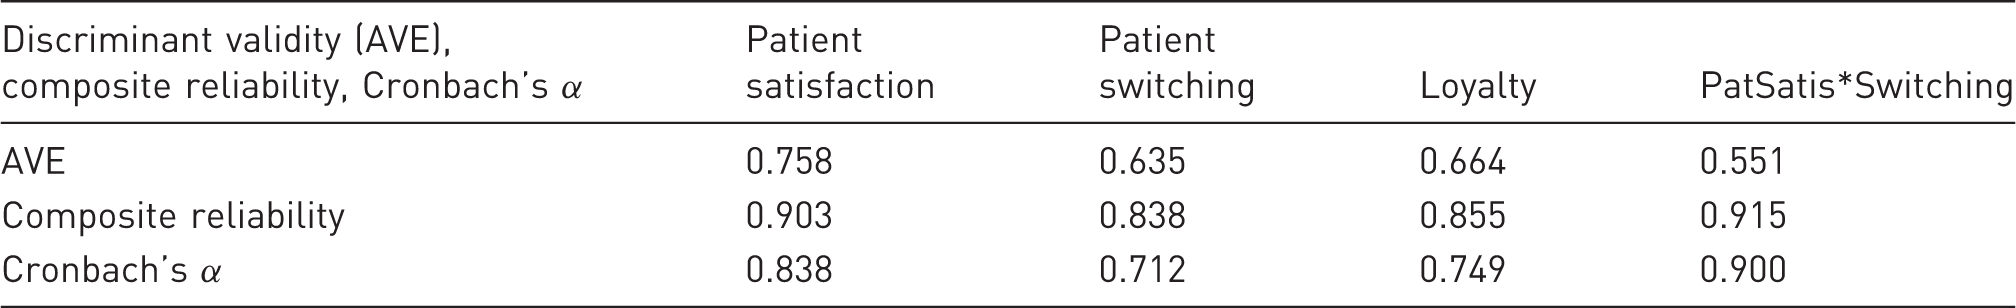
Measures used for the constructs included convergent and discriminant validity, composite reliability, and Cronbach’s α. This measurement model was considered from a convergent validity (loading factor) perspective; based on Figure 2, the convergent validity value was >0.7, indicating validity. Furthermore, according to Table 2, AVEs exceeded 0.5, confirming that all measures had discriminant validity. The values for composite reliability were >0.6, indicating that the latent constructs of loyalty, patient satisfaction, patient switching, and the construct that mediated between patient satisfaction and patient switching were reliable. The Cronbach’s α values for all latent constructs were >0.5, indicating that the questionnaire was internally consistent.
Structural equation modeling with partial least squares of patient loyalty for the comprehensive data set. Discriminant validity (AVE), composite reliability, and Cronbach’s α for the comprehensive dataset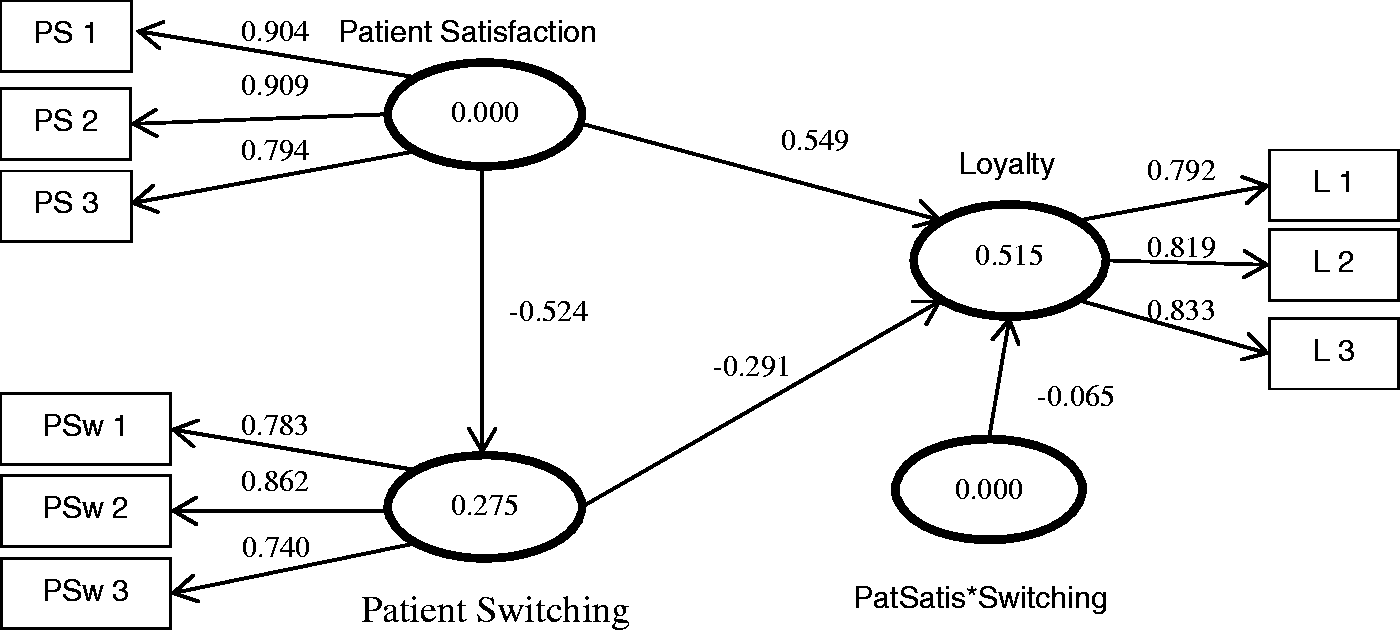
Designing the structural model (inner model)
After taking measurements at the outer models, new structural models were tested. Figure 2 shows the structural equation modeling with PLS of patient loyalty from the perspectives of patient satisfaction and patient switching. In Figure 2, it can be seen that the R2 (evaluation of goodness of fit) of patient switching and loyalty are 0.275 and 0.515, respectively. The R2 value of 0.275 indicates that 27.50% of the variability in the patient switching construct was explained by patient satisfaction. The R2 value of 0.515 indicates that 51.50% of the variability in loyalty can be explained by patient satisfaction, patient switching and also the moderating constructs of patient satisfaction and patient switching. Furthermore, the direction of the relationship between patient satisfaction and loyalty is positive (see path coefficient). However, the model is going in the opposite direction between patient satisfaction and patient switching, switching patients and loyalty, and loyalty moderating variables.
Path coefficients, t-statistics, and results
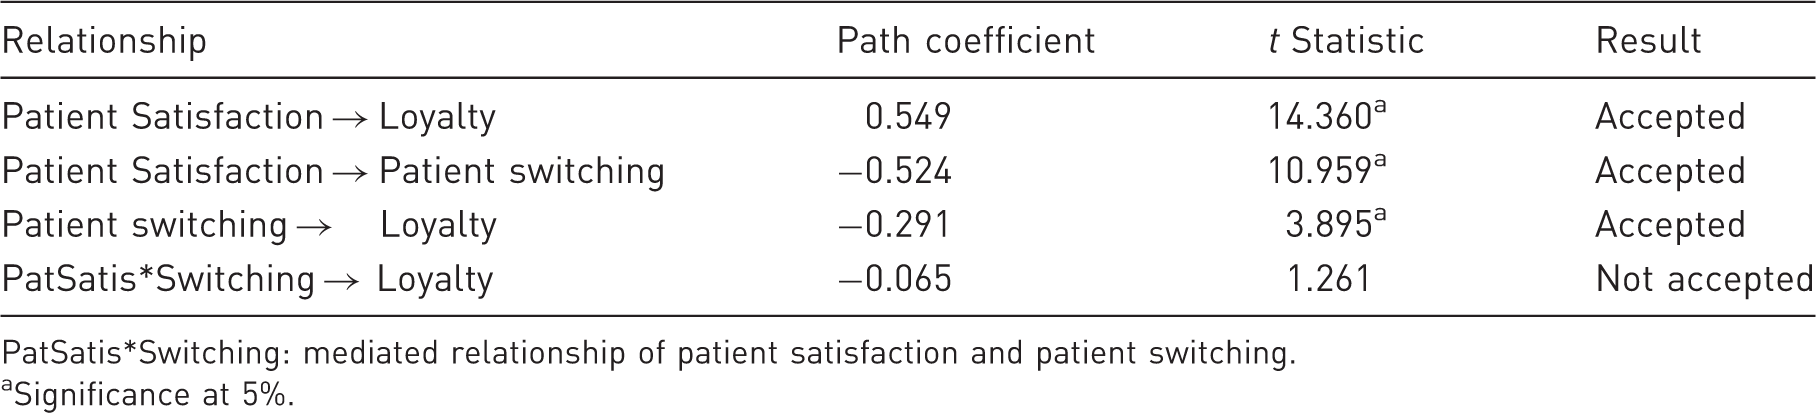
PatSatis*Switching: mediated relationship of patient satisfaction and patient switching.
Significance at 5%.
Measurement model loyalty based on mode of treatment
Respondents generally aim for a particular mode of treatment. In this study, three modes were investigated, namely treatment by a general practitioner, a specialist physician or a dentist. The numbers of patients who responded were 169, 107, and 31, respectively.
Path coefficients of model based on mode of treatment
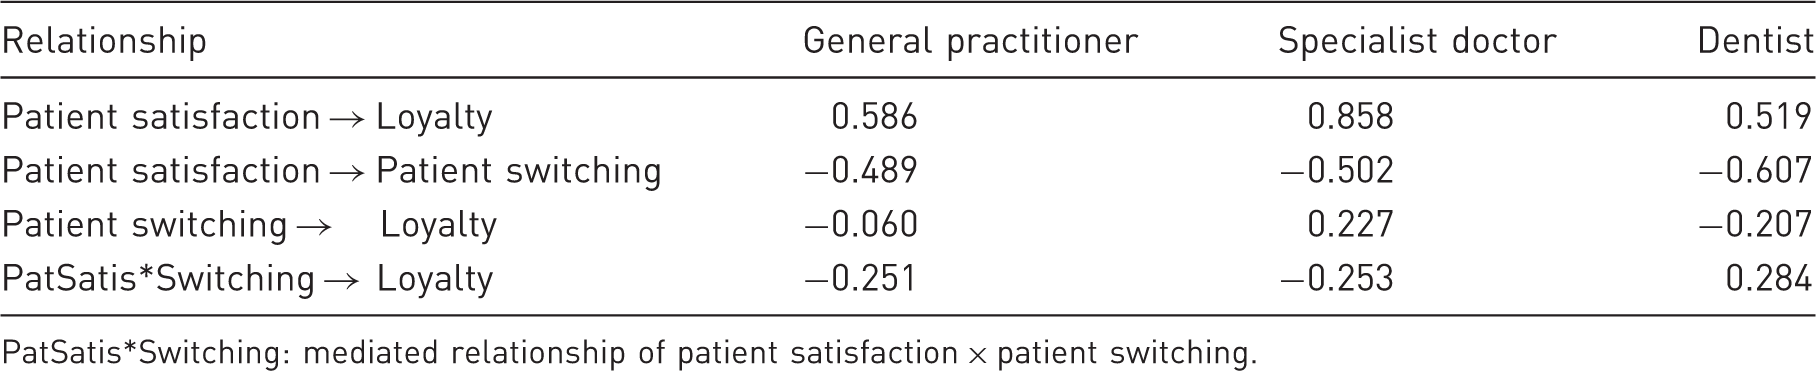
PatSatis*Switching: mediated relationship of patient satisfaction × patient switching.
t Statistics of model based on mode of treatment
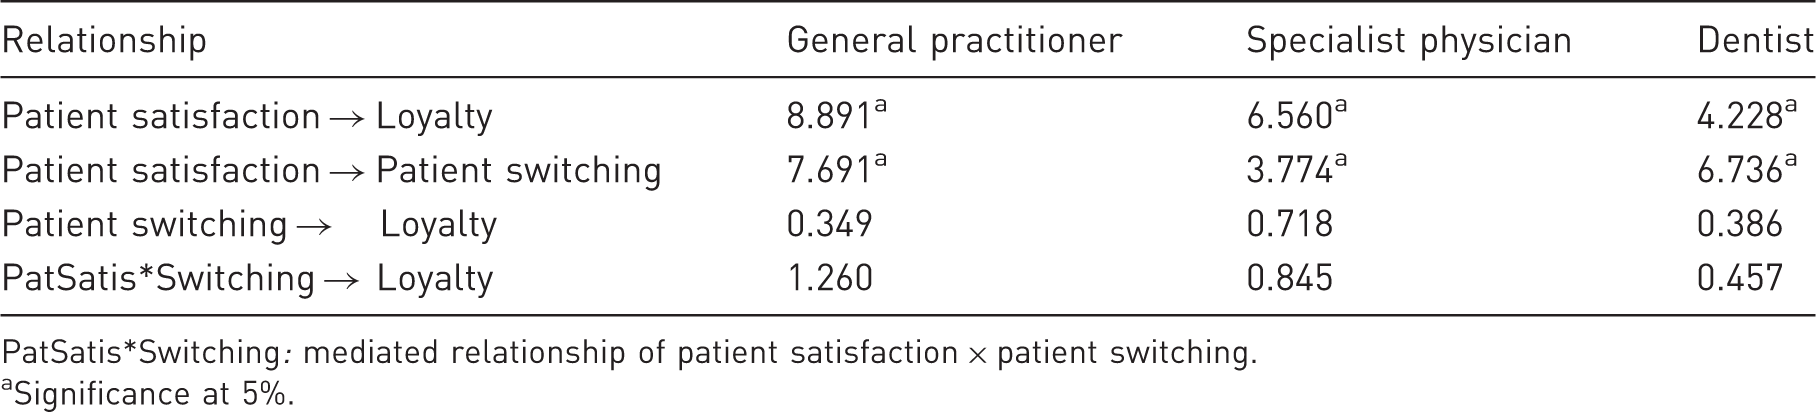
PatSatis*Switching: mediated relationship of patient satisfaction × patient switching.
Significance at 5%.
Results and discussion
Effect of patient satisfaction on loyalty
Table 3 above illustrates the path coefficient models, a comprehensive review of the data. The results show that patient satisfaction is positively related to loyalty (0.549). The t-statistic showed that patient satisfaction had a more significant influence on patient loyalty (14.360, α = 0.05). When the data were considered from the perspective of the patient’s mode of treatment, the results showed a positive and significant relationship between patient satisfaction and loyalty to general practitioners, specialist physicians, and dentists (see Table 5). The results of the acceptance t-test, that patient satisfaction and loyalty are significantly positively correlated, support Hypothesis 1 (H1).
The significant positive correlation means that if patients gain satisfaction, they increase their loyalty to their healthcare providers. Patient satisfaction was obtained as a result of service; in this study it was the result of their experience of treatment, that they felt happy or disappointed, and made recommendations to others. We compared their expectations with actual experience, both in general and based on the mode of treatment, either by general practitioners, specialist physicians or dentists. The results of this study are consistent with those reported previously (p. 52), 14 (p. 145), 19 and (p. 512). 20
Effect of patient satisfaction on patient switching
As seen in Table 3, the results showed that patient satisfaction was negatively related to patient switching (−0.524), and had a significant effect thereon (10.959, α = 0.05) when considered using the comprehensive dataset. The same can be said for the relationship between patient satisfaction and patient switching when treatment mode is considered. For patients seeking treatment at general practitioners, specialist physicians and dentists (see Tables 4 and 5) there was a negative and significant relationship, at the 5% level, between patient satisfaction and patient switching. The results of the acceptance t-test, that patient satisfaction and patient switching are significantly negatively correlated, can be said to support Hypothesis 2 (H2).
The negative direction of the relationship indicates that satisfaction is inversely related to the switching of patients to other service providers. In other words, patients are dissatisfied with services as a result of less satisfactory experiences in their treatment, compared with their expectations. The result of patient dissatisfaction due to failure of the service is negative communication about the service (p. 7) 12 to prospective patients or existing patients. This study is in line with the results obtained by Uturestantix et al., (p. 12) 25 that consumer dissatisfaction exerts a positive influence on brand-switching decisions.
Effect of patient switching on loyalty
The results in Table 4 above show that patient switching is negatively associated with patient loyalty (−0.291), with a significant effect (3.895, α = 0.05), if the model is analysed using the comprehensive dataset. These results are consistent with the findings of Bofling (p. 8), 21 Van Trijp and Inman (p. 287), 28 and Wangenheim (p. 1182). 23 However, if the model is analyzed using the patient’s treatment mode, the results are different.
The relationship between patient satisfaction and patient switching, for patients seeing general practitioners (see Tables 4 and 5) was not significant at the 5% level, though a negative direction of the relationship was observed. The same was observed for patients seeking the treatment of a dentist (see Tables 4 and 5). However, for patients seeking treatment by a specialist, this relationship was positive.
The patient-switching pattern is defined as the purchase of services that move from one health service provider to another. However, from the results of this study, this does not apply to patients when the mode of their treatment is considered. For patients who went to see a general practitioner or a dentist, despite there being a negative direction in the relationship between their satisfaction and switching, their dissatisfaction did not cause them to move to other health services. For patients who went to a specialist, dissatisfaction did not cause a weakening of loyalty, but it also had no significant effect.
Effects of moderating variables on loyalty
Patient switching as a mediator in the relationship between patient satisfaction and loyalty has a negative direction, though the effect is not significant. The same result was seen in the pattern of relationships for patients seeking treatment at general practitioners and specialists. However, a different result was observed in the behavior of patients seeking treatment by a dentist—that relationship showed a positive correlation.
Based on the findings of Singh (p. 40) 29 that patients who do not receive good service switch to another health care provider, Srinivasan 38 found that those who have switched to other service providers and inherently disloyal has a low loyalty index. This result is in contrast to the findings in this study, that the trigger does not cause the patient to switch (for patients seeking treatment by a general practitioner) or in particular, to become disloyal.
Conclusion and limited findings
Patients who experience a service compare their expectations with their actual experience. If they feel satisfied they will be strongly loyal to the healthcare providers. However if they experience dissatisfaction, in general they will turn to other health care providers.
Triggers of patient switching behavior, such as dissatisfaction, variation-seeking behavior (because there is a desire to try other healthcare providers) or because of negative word of mouth, do in general cause them to switch and do weaken loyalty. However, this is not the case when the mode of treatment is considered. Patients still did not switch or weaken their loyalty. The switching behavior of the patient is also not a moderating variable between patient satisfaction and loyalty. In other words, patients who are not satisfied get negative feedback about health care providers from other people, but still seek treatment from those providers. They do not switch providers because the patients are those using health insurance financed by the Government or by universities, who have specified the treatment that can be financed by their insurance.
Finally, this research contributes to understanding the importance of the efforts of health care organizations to develop loyalty by focusing on patient satisfaction and patient switching. The limitation of this study is that respondents were localized in one region and so the results may not be representative of the entire country. The results of this study may be different for patients who seek treatment at a hospital or clinic financed by the patients themselves.
Footnotes
Acknowledgements
The authors would like to thank the management of Banyumas Hospital, The Indonesian Red Cross Clinic Branch in Banyumas and the Muhammadiyah University of Purwokerto Clinic. The authors also acknowledge the helpful comments of the two anonymous reviewers. The first author would like to thanks the Directorate General of Higher Education (DIKTI) Indonesia and Kanazawa University Japan for financial support through the Joint Scholarship Program.
Conflict of interest
None declared.
Funding
This research received no specific grant from any funding agency in the public, commercial, or not-for-profit sectors.