
Abstract
Two tasks (A and B) were designed which required participants to sequentially move through four target positions in a Lissajous display. Task A was designed so that participants could complete the task using either unimanual or bimanual control strategies. Task B was designed so that participants could complete the task using relatively simple or more complex bimanual control strategies. The purpose of this study was to determine which control strategy the participant utilises to complete the two tasks when Lissajous displays are provided and to determine the degree to which the size of the targets influences the control strategy chosen under these conditions. The movement amplitude between two adjacent targets and the target size resulted in an Index of Difficulty (ID) of 2 and 4 for each task. For both tasks, participants practised 15 trials (30 s per trial) for each ID and then was administered a test trial. The results for both Tasks A and B indicated that the ID2 condition resulted in a circular path, whereas the ID4 condition resulted in a straight-line path on the Lissajous plot. This suggests that at the low ID condition participants produced a continuous 1:1 with 90° phase offset bimanual coordination pattern. At the high ID condition, the participants consistently chose to switch to a more stable unimanual left and right movements in Task A and to transition between in-phase and anti-phase bimanual coordination patterns in Task B. In addition, both limbs’ movements were more harmonic in the low ID condition than in the high ID condition.
Bimanual control strategies
The bimanual coordination literature has consistently argued that bimanual control is in many situations relatively more difficult than unimanual control especially when the task requires the two limbs to activate non-homologous muscles and/or produce different movement patterns. Kelso, Southard, and Goodman (1979), for example, demonstrated that bimanual aiming movements to targets of different widths and amplitudes were produced more slowly than when the tasks were produced unimanually, although this difference was relatively small when the amplitudes and target widths for the two limbs in the bimanual conditions were the same and the response required the simultaneous activation of homologous muscles. The bimanual literature has also repeatedly demonstrated that a 1:1 in-phase coordination pattern is highly stable, whereas other phase offsets are less stable and significantly more difficult to perform. This was clearly demonstrated in experiments using scanning trials (e.g., Yamanishi, Kawato, & Suzuk, 1980; Zanone & Kelso, 1992) where coordination errors and variability for all phase offsets tested were significantly higher than for the in-phase (0° phase offset), although the anti-phase (180°) coordination pattern was also produced in a relatively stable manner. These findings led researchers to conclude that relative phase (RP) patterns other than in-phase and anti-phase are inherently unstable and the motor system shows a bias towards what has been labelled as the intrinsic dynamics of in-phase and anti-phase coordination (Schöner & Kelso, 1988).
This research has also shown that in-phase coordination patterns are more stable than anti-phase coordination patterns (e.g., Kelso, 1981, 1984; Kelso, Scholz, & Schöner, 1986) and that when cycle frequency is increased participants sometimes spontaneously transition from anti-phase to in-phase but not from in-phase to anti-phase (Beek, Peper, & Stegeman, 1995, for review). In addition, research on the production of bimanual multi-frequency ratios (e.g., 1:2, 2:3, 3:5 ratios), which are considered significantly more difficult to perform (see Peper, Beek, & Van Wieringen, 1995, for discussion; Shea et al., 2016, for recent review), often shows signs that participants spontaneously transition to more stable 1:1 or lower order frequency relationships while performing these polyrhythmic coordination patterns (e.g., Buchanan & Ryu, 2006; Peper et al., 1995; Treffner & Turvey, 1993; Washbum et al., 2014). Thus, when attempting to produce phase or frequency relationships other than 1:1 in-phase, the instability of the coordination pattern could result in the movement of one limb towards the pattern of movement of the other limb, resulting in a phase transition to a more stable (e.g., 1:1 in-phase) coordination pattern (see Beek et al., 1995, for a review). We interpret these results to mean that participants when faced with a novel movement task will choose to utilise unimanual control strategies over bimanual control strategies when permitted by the task constraints. We also interpret these findings to suggest that when more than one bimanual control strategy could be used to perform a task, participants will choose to complete the task using a more stable coordination pattern over a less stable coordination pattern especially when one of the goals is to move as quickly and smoothly as possible.
In addition, the unimanual aiming literature has repeatedly demonstrated that increases in task difficulty (Index of Difficulty [ID]) result in changes in the control strategies used to perform the task (e.g., Buchanan, Park, & Shea, 2006; Guiard, 1997; Meyer, Kornblum, Abrams, Wright, & Smith, 1988). The changes in control strategies are reflected in a number of kinematic measures derived from the displacement time series (e.g., time to peak velocity [PV], harmonicity). Movements made at lower IDs in reciprocal Fitts’ tasks are often described as harmonic and/or open loop, indicating proportional acceleration/deceleration profiles, minimal corrections made during movement trajectory, and little if any dwell time (DT) present at target reversal. Alternatively, movements made at higher IDs are often described as inharmonic and/or closed loop, with a greater proportion of movement time (MT) utilised in the deceleration phase than acceleration phase, increased zero crossings in the acceleration profile (indicating adjustments during the later portion of the movement), and an increase in DT at target reversal. These changes are consistent with the notion that control strategies shift from cyclical/harmonic units of action to concatenated series of discrete units as difficulty is increased. Buchanan and colleagues (Buchanan, Park, & Shea, 2004, 2006), for example, observed that participants shifted from discrete to cyclical control when the ID was incrementally decreased within a trial or between trials and shifted from cyclical to discrete control when the ID was increased. However, little is known about how changes in this type of constraint affect the changes in control strategies in bimanual aiming tasks. Presumably, increases in ID will result in shifts to more stable control strategies and greater online processing of the movement.
The tasks used in the present experiment were designed so that they could be completed using more than one control strategy. Task A was designed so that the participant could complete the task using either unimanual or bimanual control strategies (Figure 1a and b). Task B (Figure 1g and h) was designed so that participants could complete the task using relatively simple (in-phase and anti-phase) or more complex bimanual control strategies (1:1 with 90° phase offset). The movement amplitude between targets for both tasks was 20°, although the bimanual coordination literature suggests that participants will tend to choose more stable coordination patterns over less stable patterns (Fontaine et al., 1997; Haken et al., 1985; Schöner, Haken, & Kelso, 1986; Schöner & Kelso, 1988; Zanone & Kelso, 1992). However, there is little literature that has directly compared participants’ control preference when facing a choice of performing different unimanual/bimanual control strategies when Lissajous displays are provided. It is also interesting to note that we expect the control strategies to range from rhythmical, continuous movement of the two limbs to a series of discrete unimanual movements. As noted by Hogan and Sternad (2007), it is important for research to cross the typical boundaries separating the rhythmical nature of much of the bimanual control research to the control of more discrete movements.
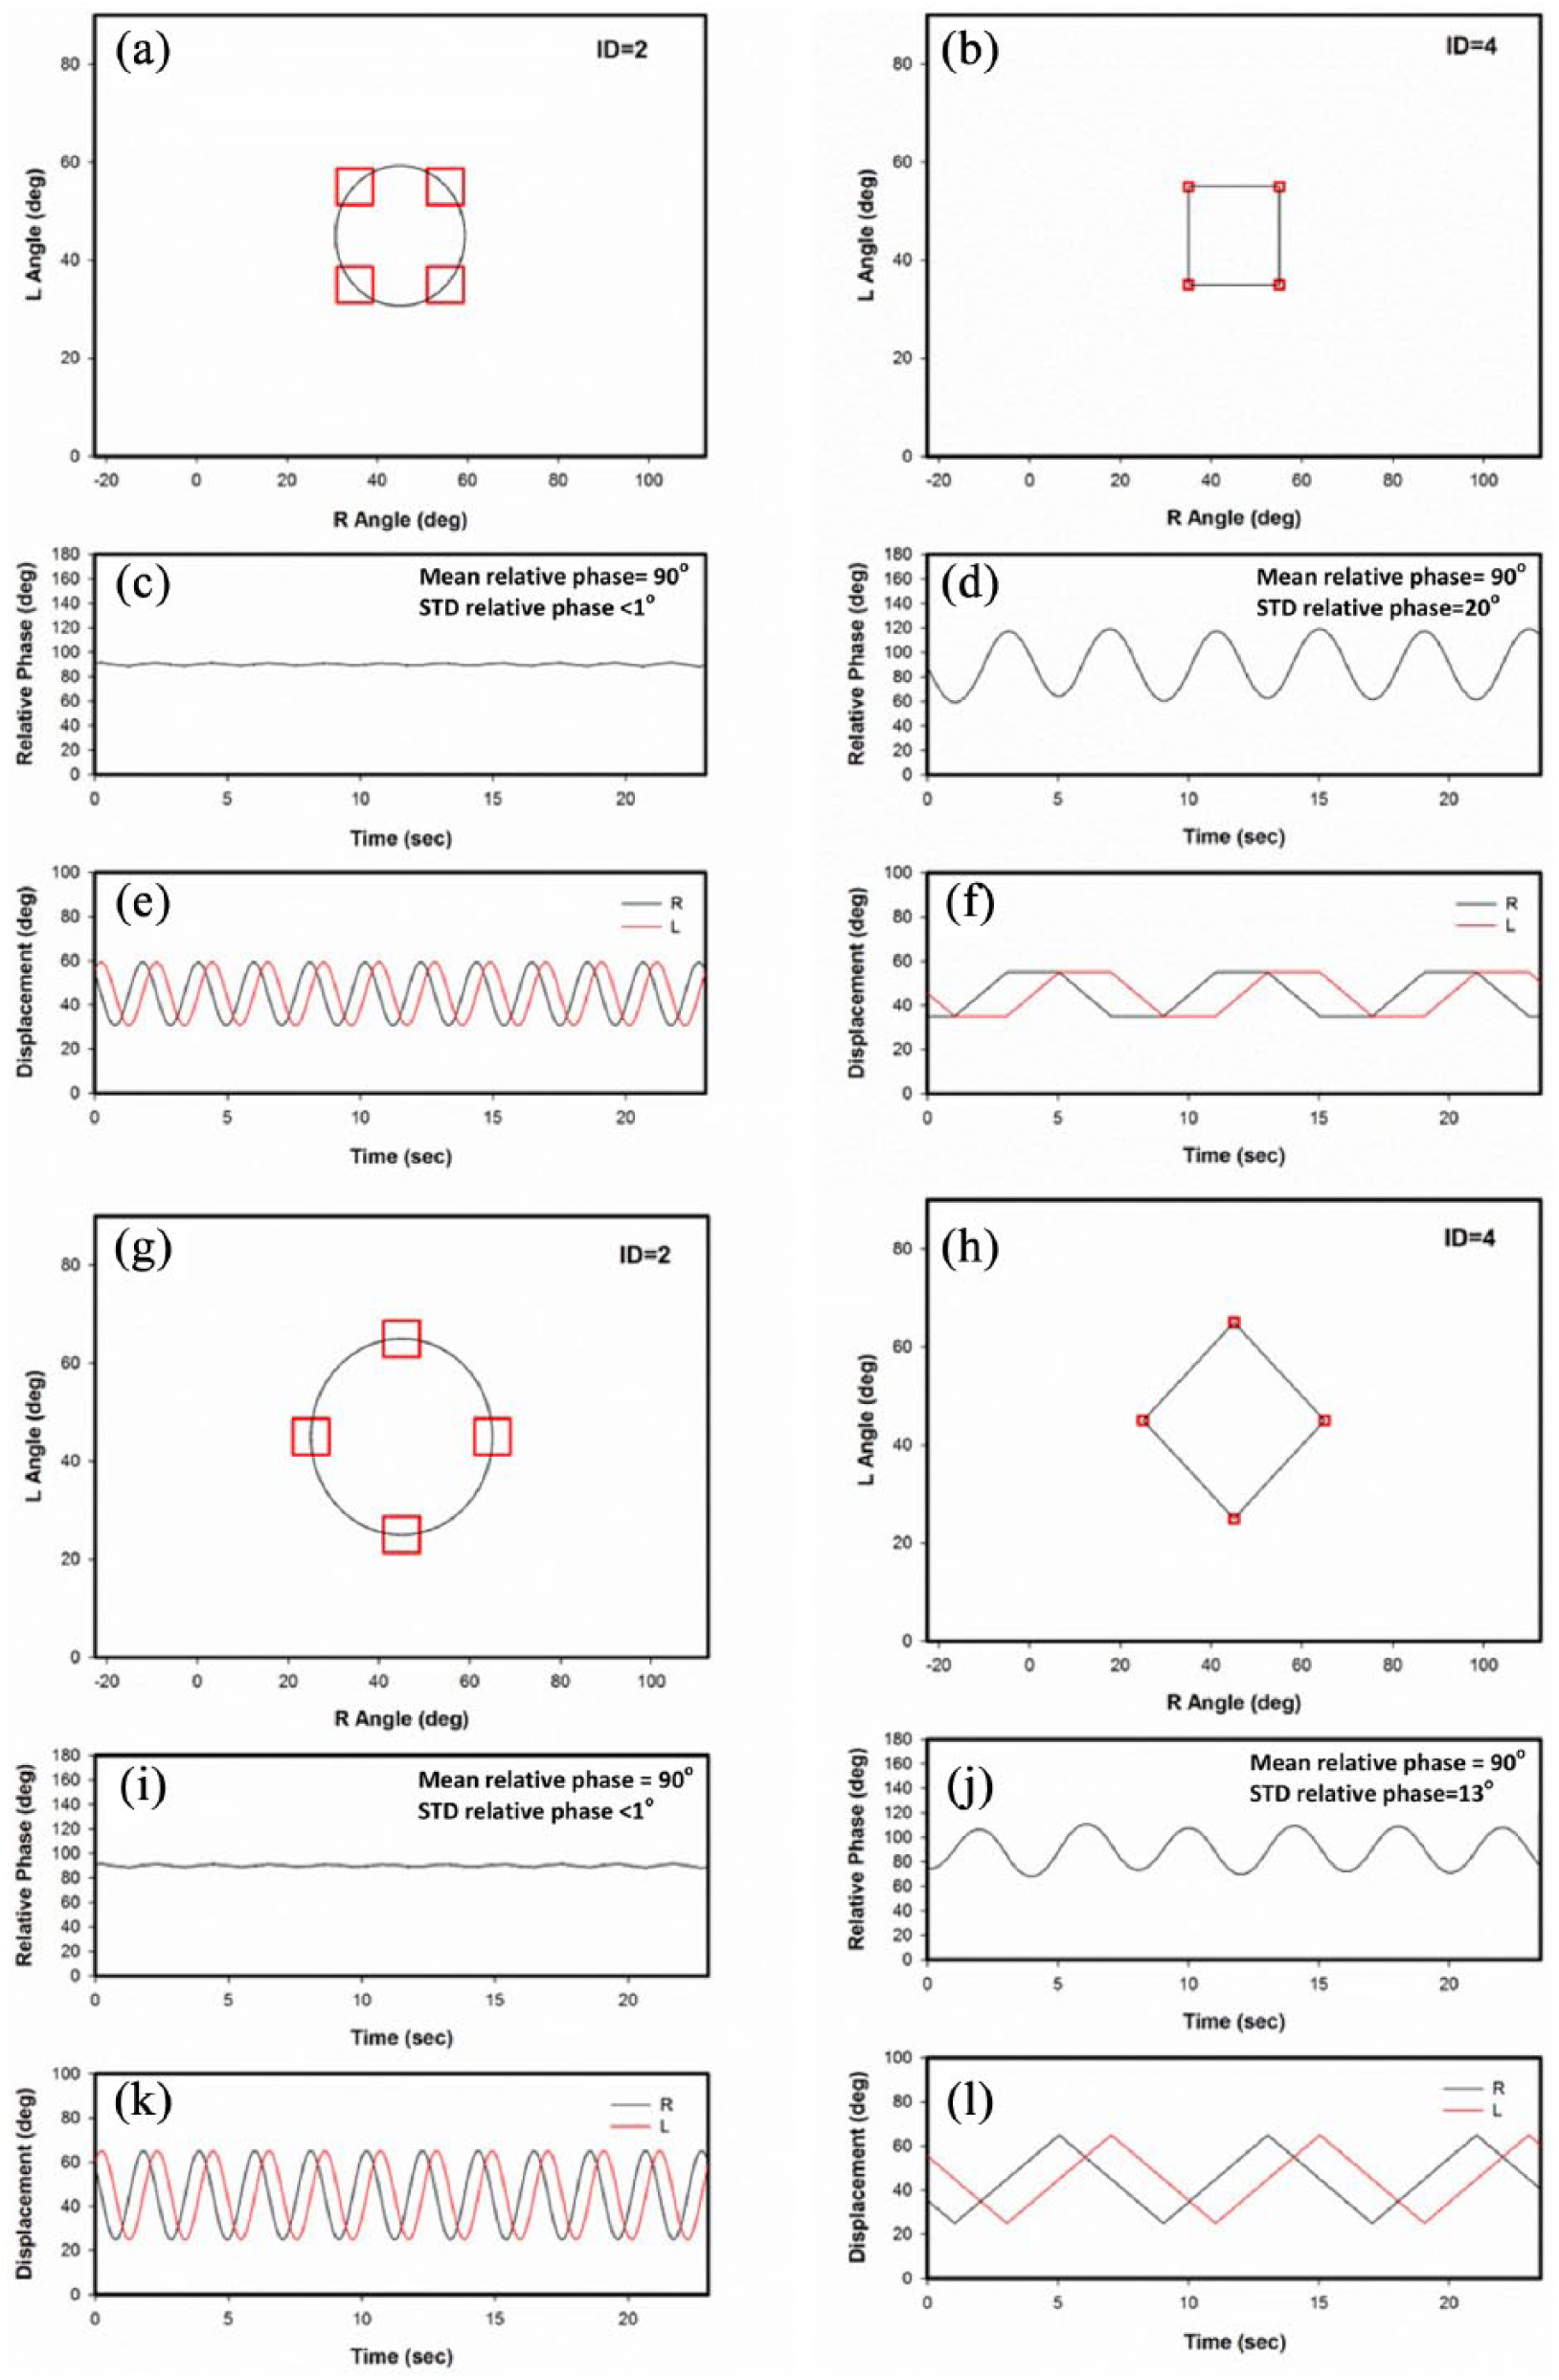
Lissajous plots, relative phase, and displacement for simulated left and right limb movements that result in a perfect 1:1 with 90° relative phase in Task A, ID = 2 condition (a, c, e) and Task B, ID = 2 condition (g, i, k). Simulated left and right limb sequences of direct movements in Task A, ID = 4 condition (b, d, f) and Task B (h, j, l).
Lissajous displays, which are used in the present experiment, portray the position of the two limbs as a single point (cursor) with the position of the right arm, for example, moving the cursor left (flexion) and right (extension) while the movement of the left arm moves the cursor down (flexion) and up (extension) in the display. Participants have been able to perform a wide variety of bimanual coordination patterns following only a few minutes of practice when Lissajous displays are used (Kovacs, Buchanan, & Shea, 2009b; Panzer, Kennedy, & Shea, 2018; Wang, Kennedy, Panzer, & Shea, in press; Shea, Buchanan, & Kennedy, 2016, for review). Thus, participants may choose more stable unimanual/bimanual control strategies (e.g., unimanual control) or less stable bimanual control strategies (e.g., 1:1 bimanual with 90° RP) to move a cursor between targets in the Lissajous display. For example, if the performer perceives the four targets arranged in a square (Task A) or diamond (Task B) shape as a single task, a circular movement path in the Lissajous feedback display may result in the participant using a bimanual 1:1 with 90° RP control strategy (Fontaine et al., 1997; Kovacs, Buchanan, & Shea, 2009a; Zanone & Kelso, 1992). Alternatively, if the performer perceives the task as a series of independent movements, they may attempt to hit the targets in a linear fashion one by one. If this is the case, straight paths will result from alternating left and right limb unimanual control in Task A or bimanual 1:1 (in-phase and anti-phase) movements in Task B.
As noted above, Lissajous displays were used in the present experiment. This type of display has been shown to minimise perceptual and attentional constraints that influence the production of many bimanual coordination patterns (see Shea et al., 2016, for review). In fact, many bimanual control patterns that have been thought to be difficult, if not impossible, to produce without extended practice have been effectively produced following only minutes of practice when Lissajous or other integrated displays were used (e.g., Kovacs, Buchanan, & Shea, 2010a, 2010b; Preilowski, 1972). Thus, participants may be more likely to choose what are commonly thought to be more difficult control strategies because some of the perceptual and attentional constraints normally impinging on the performance of these tasks are minimised by the Lissajous display. Without an integrated display like the Lissajous display, the effective production of a 90° RP coordination pattern would require multiple days of practice. However, with the Lissajous display, we expect participants to choose this coordination pattern to achieve the low ID conditions following only 7.5 min of practice.
The purpose of the study is to determine the control strategy participants used to complete two movement tasks when Lissajous displays are provided and to determine the degree to which the size of the targets influences the control strategy chosen. Each task consists of four targets that the participants cycle through in a specific order. Participants will be asked to move through (hit) as many of the targets as possible in each 30 s trial and will be encouraged to increase the hit rate over practice. Presumably, participants will choose more stable unimanual/bimanual coordination strategies over more complex/less stable bimanual coordination strategies to complete the various tasks especially when the ID is increased (target size decreased). Given the previous literature, we would predict that participants will consistently choose more stable coordination patterns over less stable coordination patterns (Haken et al., 1985; Schöner et al., 1986; Yamanishi et al., 1980) particularly when accuracy requirements are increased. However, given the recent findings that Lissajous displays greatly reduce perceptual and attentional constraints on bimanual control, it would not be unexpected for more complex patterns of bimanual coordination (e.g., bimanual 90° RP) to emerge as participants attempt to efficiently move through the target sequence.
Methods
Participants
Sixteen (nine males, seven females) college-age participants were recruited for the experiment. Participants had no prior experience with the experimental task and were not informed of the control options. Participants signed a consent form approved by the local institutional review board (IRB) before entering the test room. A modified Cohen handedness evaluation (Coren, 1993) was used to access participants’ handedness. All participants were classified as right-arm dominant.
Apparatus
The apparatus consists of two horizontal levers affixed at one end to a near-frictionless vertical axle. One lever was positioned on the left side of a table and was used by the left limb and the other on the right side was used by the right limb. The axles, which rotated freely in ball-bearing supports, allowed the levers to move in the horizontal plane over the table surface. Near the distal end of the levers, vertical handles were attached. The positions of the handles were adjusted so that when the participant rested their forearms on the levers with their elbow aligned over the axis of rotation, they could comfortably grasp the handles (palms facing each other). The horizontal movements of the levers were monitored (200 Hz) by potentiometers that were attached to the axles. The online data were used to move the cursor in the Lissajous display and were stored for later analysis. The cursor indicating the current position of the lever(s) was projected on the wall 2 m in front of the participant by a projection system mounted above and behind the table. A wooden frame was used to block participants’ vision of their limbs.
Procedure
Prior to entering the testing room, participants were assigned to one of the two tasks (A or B). Each task included two conditions: ID2 and ID4. Tasks A and B differed in terms of the position of the targets. Participants were seated in a height-adjustable chair in front of the table on which the levers were mounted. Prior to introducing the tasks, participants were provided a 30-s period to move the cursor on the screen. Note that the position of the cursor was controlled by left and right limb movements. Left limb movement moved the cursor up (extension) and down (flexion), whereas right limb movement moved the cursor left (flexion) and right (extension). To begin a trial, four target boxes were positioned (depending on the task) in the Lissajous display projected on the screen in front of the participant. Participants were told that the trial begins when one of the target boxes was illuminated and the task was to move the cursor to the illuminated target as fast and accurately as possible. Upon achieving the target (when both limbs were in the target area), the illumination was turned off and the next box in the sequence was immediately illuminated. Participants were told that the goal was to move cursor to the target area and hit as many illuminated target boxes as possible in each trial. Participants were not provided any information on potential control strategies. At the end of a trial, the number of hits was displayed on the screen and the participant was encouraged to increase this number from trial to trial. In each of the tasks, the horizontal/vertical distance/amplitude between two adjacent targets (20°) and the width of the target (10° or 2.5°) resulted in an ID of 2 in one condition and an ID of 4 (ID = log2(2A/W), Fitts, 1954) in the other condition. The order in which the participants practised the ID2 and ID4 conditions was counterbalanced. The targets in Task A were arranged in a square shape (Figure 1a and b) and the targets were illuminated in a counterclockwise order. This task could be produced using a series of unimanual left and right limb movements or could be performed using a more complex 1:1 with 90° phase offset bimanual coordination strategy. The targets in Task B were arranged in the diamond shape (Figure 1 g and h) and were illuminated in a counterclockwise order. This task could be performed by connecting the targets in a series of linear path on the Lissajous plot (resulting in a discrete 1:1 bimanual coordination pattern with 90° phase offset) or by connecting the targets through a circular path on the Lissajous plot (resulting in a continuous 1:1 bimanual coordination pattern with 90° phase offset). For both tasks, each participant practised 15 trials for both ID2 and ID4 conditions (order counterbalanced). Following the completion of practice, a test trial was administered under each ID condition (order counterbalanced). Each trial was 30 s.
Data analysis
All data analyses were performed using MATLAB (Mathworks, Natick, MA). The individual limb displacement time series were used to compute lever displacement, velocity, and acceleration. To reduce noise, the displacement time series were filtered with a second-order dual-pass Butterworth filter with a cut-off frequency of 10 Hz. A 3-point difference algorithm was used to compute the velocity and acceleration. The analyses presented will focus on task performance (segment MT and hits) across acquisition and test trials. Other unimanual and bimanual measures will be analysed on the test trials for each task and ID condition.
Task performance
The time required to move from one target to the next was termed segment MT and the number of targets hit during the trial was termed hits. Segment MT was determined as the time from when both limbs exited one target area to the time they entered next target area. Note that this time excludes time in the target area. Segment MT variability was defined as the standard deviation of the segment MTs across the trial. Hits were defined as the number of targets achieved during the course of the 30-s trial.
Unimanual measurements
MT, DT, and percent time to peak velocity (PTPV) for each limb were also calculated on a half-cycle basis, with each half cycle representing an extension or flexion. After finding the PV for each half cycle movement, onset and offset were determined. Movement onset was calculated by tracking backward from PV to a value of 5% of PV following the previous movement reversal. Movement offset was calculated by tracing forward from PV to a value of 5% of PV before reversal for the next movement. In a reciprocal aiming task, as ID increases, the time spent on reversing the movement in preparation for the following cycle increases (e.g., Boyle & Shea, 2011; Kovacs, Buchanan, & Shea, 2008). This time is known as dwell time: DT = movement onset i + 1 – movement offset i . MT was calculated by the equation MT = movement offset i – movement onset i . The PTPV was determined by the equation PTPV = (PV i – onset i )/(offset i – onset i ).
Windows between adjacent pairs of zero crossings in the displacement trace were defined to compute an index of movement harmonicity (H) (Guiard, 1993). Each time window comprised a single movement reversal. Within each time window, we identified all the deflections of the filtered acceleration trace. When the deflections are all positive or negative within the calculation window, H was computed as the ratio of absolute minimum to absolute maximum acceleration. When a single peak (sinusoidal acceleration) occurred in the acceleration trace within the calculation window, the value of H was 1, indicating a harmonic motion of the limb. If the acceleration trace crosses from negative to positive (or vice versa) within the window, the value of H was 0, indicating inharmonic motion. Finally, the individual harmonicity values for each time window within a trial were averaged yielding a global estimate of H for that participant and trial.
Bimanual measures
For each trial in the bimanual condition, a continuous RP measure (φc) was computed to examine the spatiotemporal coordination of the limbs during the task. To calculate the continuous RP, first, the continuous phase angle (
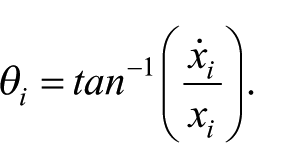
Then, the continuous phase angle for the left limb was subtracted from the right limb for each sampled point:
In addition, tangential velocity (TV) was calculated based on both lever velocities. TV and TV variability were defined as the mean and SD of the TV time series across trial. TV time series provide information on the degree to which the coordination pattern resulted in continuous or discrete bimanual movement of the cursor.
Data of MT, DT, PTPV, and H values will be analysed in separate Task (A, B) ×ID (2,4) × Limb (left, right) analyses of variance (ANOVAs) with repeated measures on Limb and ID. Segment MT, segment MT variability, hit number, mean RP, SD of RP, mean TV, and SD of TV for each task and condition will be analysed in Task (A, B) × ID (2,4) ANOVAs with repeated measures on ID. Significant main effects will be further analysed with Duncan’s new multiple range test, and significant interactions will be further analysed with simple main effects. An alpha level of .05 will be used for all tests.
Results
Displacement, velocity, Lissajous plot, phase portrait (velocity vs. position), TV, and RP at ID2 and ID4 for a participant on each task are provided in Figure 2. Mean segment MT and hit number for every three practice trials and the test trial for each task and ID condition are provided in Figure 3a and b. Bimanual measures of RP, RP variability, TV, and TV variability are also included in Figure 3c to f. Descriptive statistics for bimanual and unimanual measures at different IDs and limbs are provided in Table 1. Unimanual measures of (a) MT, (b, c) DT, (d) PTPV, (e) harmonicity, and (f) harmonicity variability are provided in Figure 4.
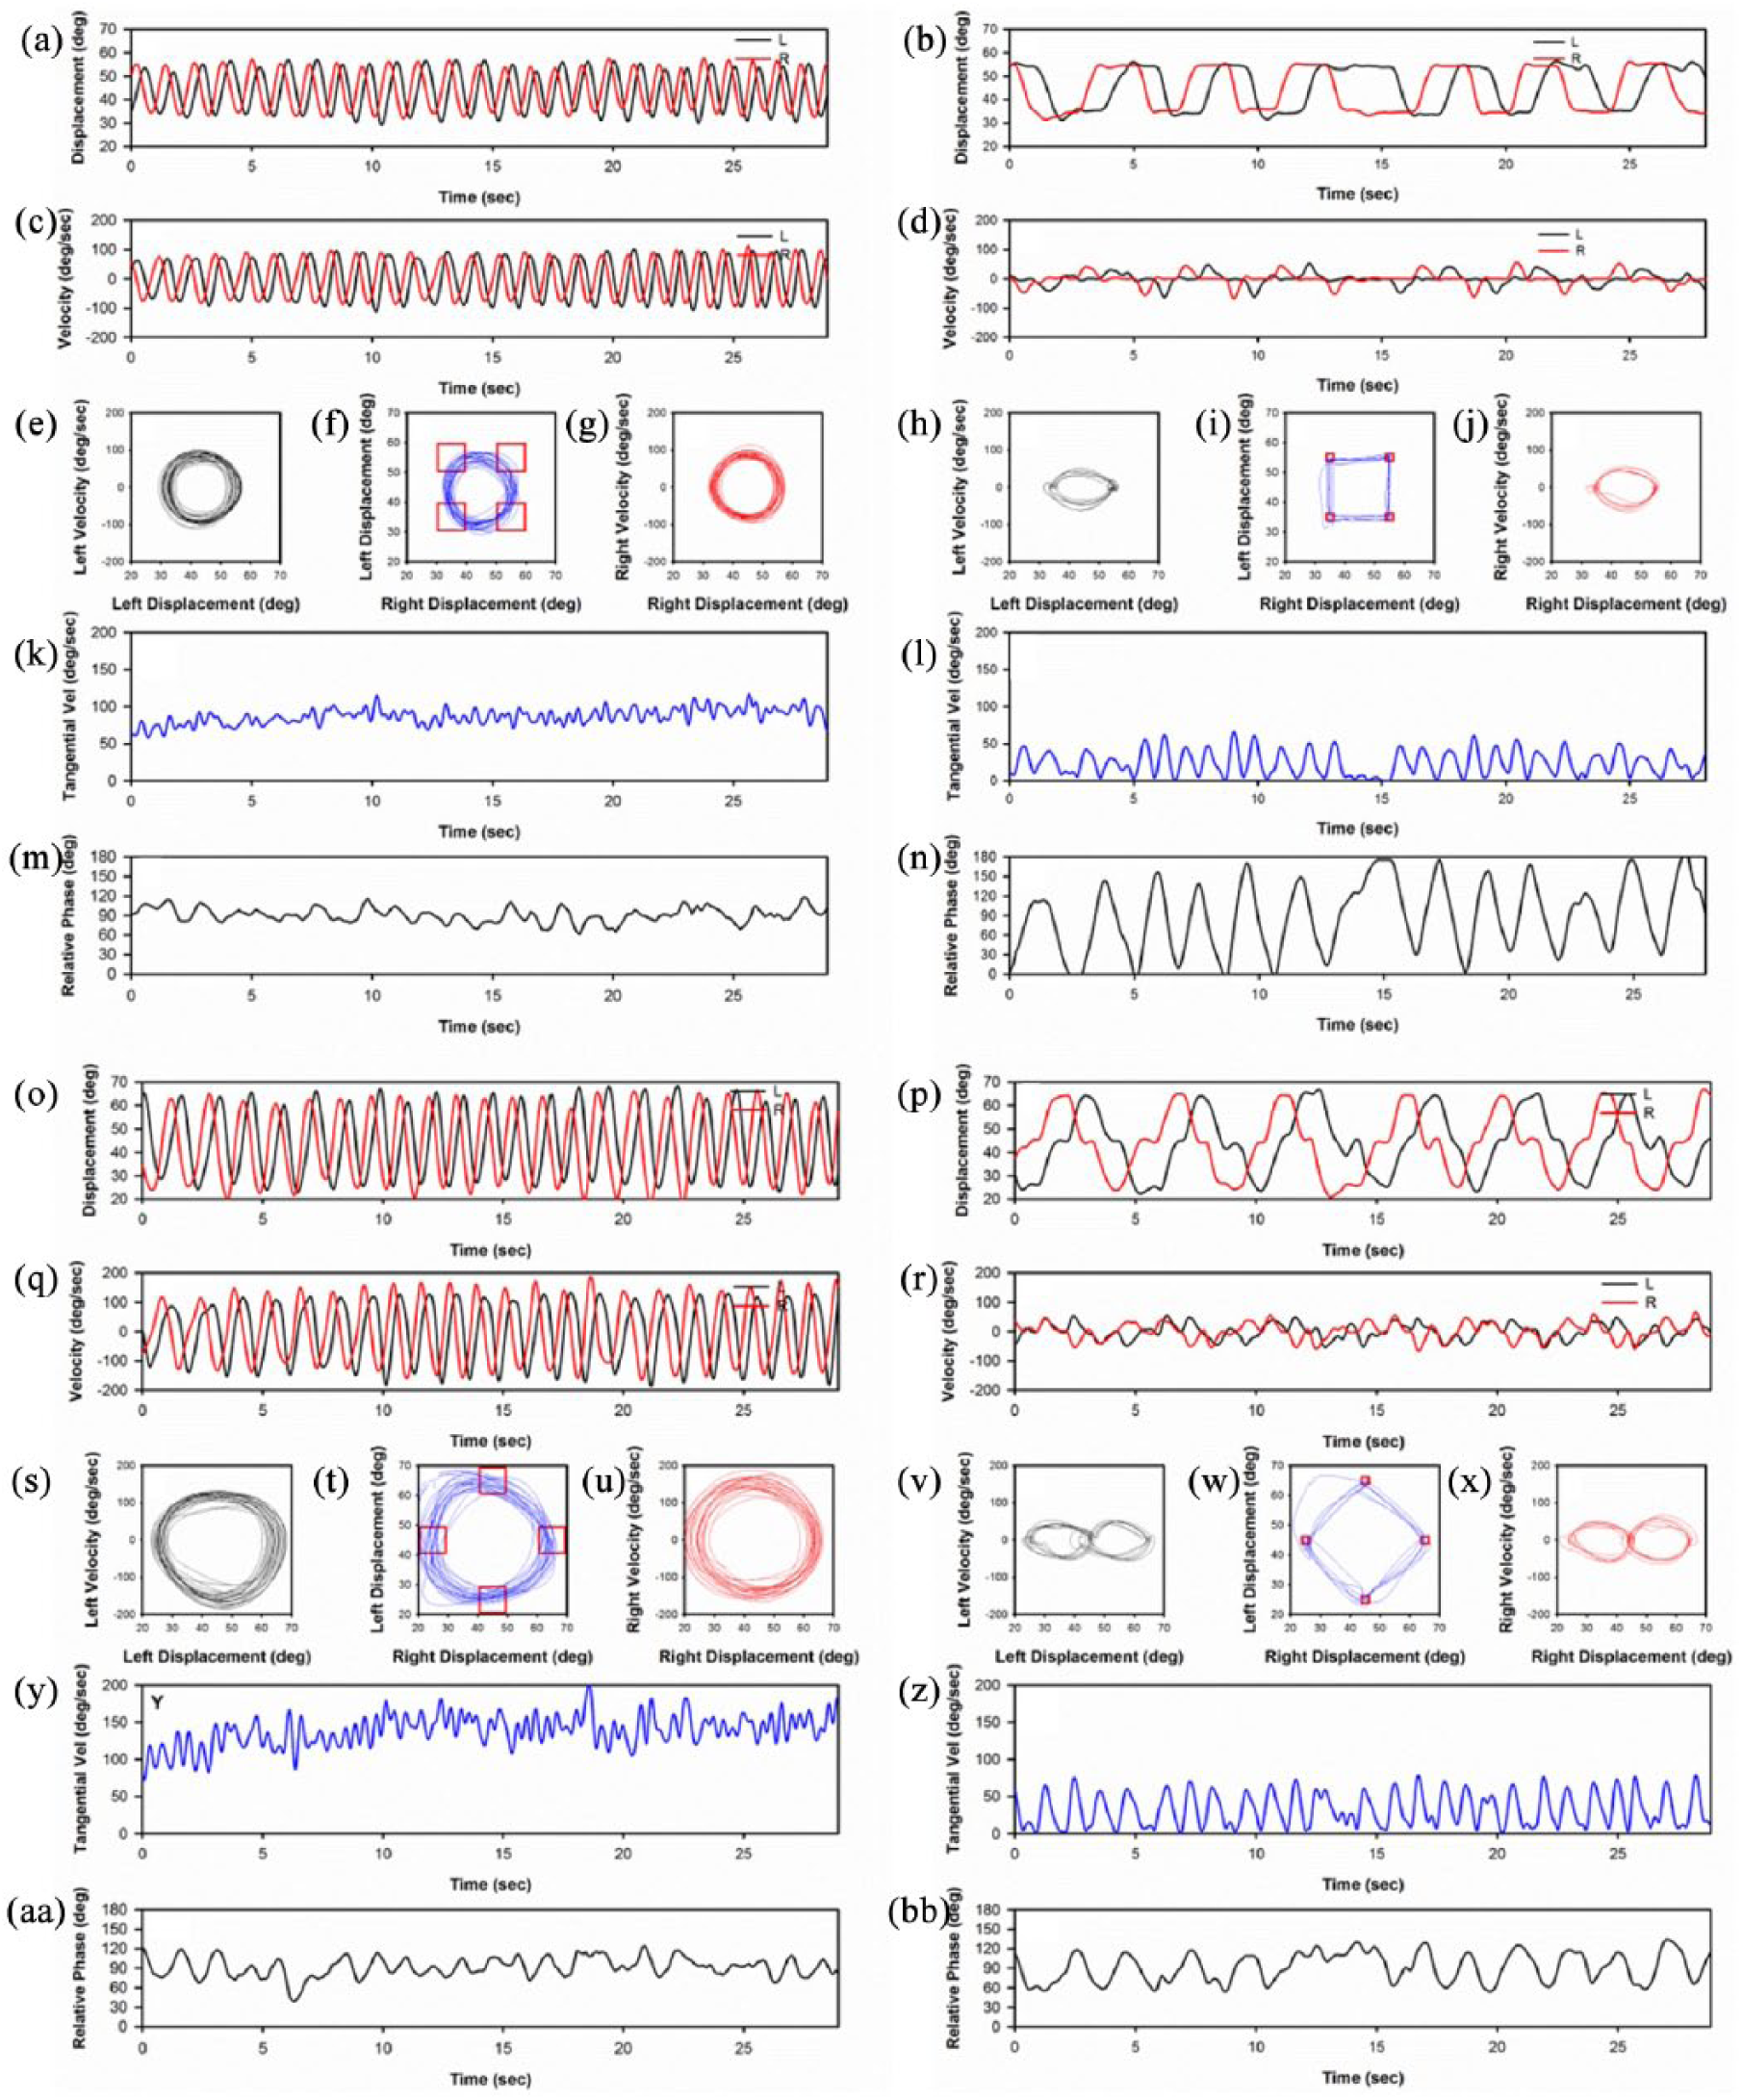
Sample displacement (a,b), velocity (c,d), Lissajous plot (f,i), velocity-displacement phase plot (e,g,h,j), tangential velocity(k,l), and relative phase (m,n) for Task A, ID = 4 condition (top, left) and Task A, ID = 2 condition (top, right). Sample displacement (o,p), velocity (q,r), Lissajous plot (t,w), velocity -displacement phase plot (s,u,v,x), tangential velocity(y,z), and relative phase (aa,bb) for Task B, ID = 4 condition (bottom, left) and Task B, ID = 2 condition (bottom, right).
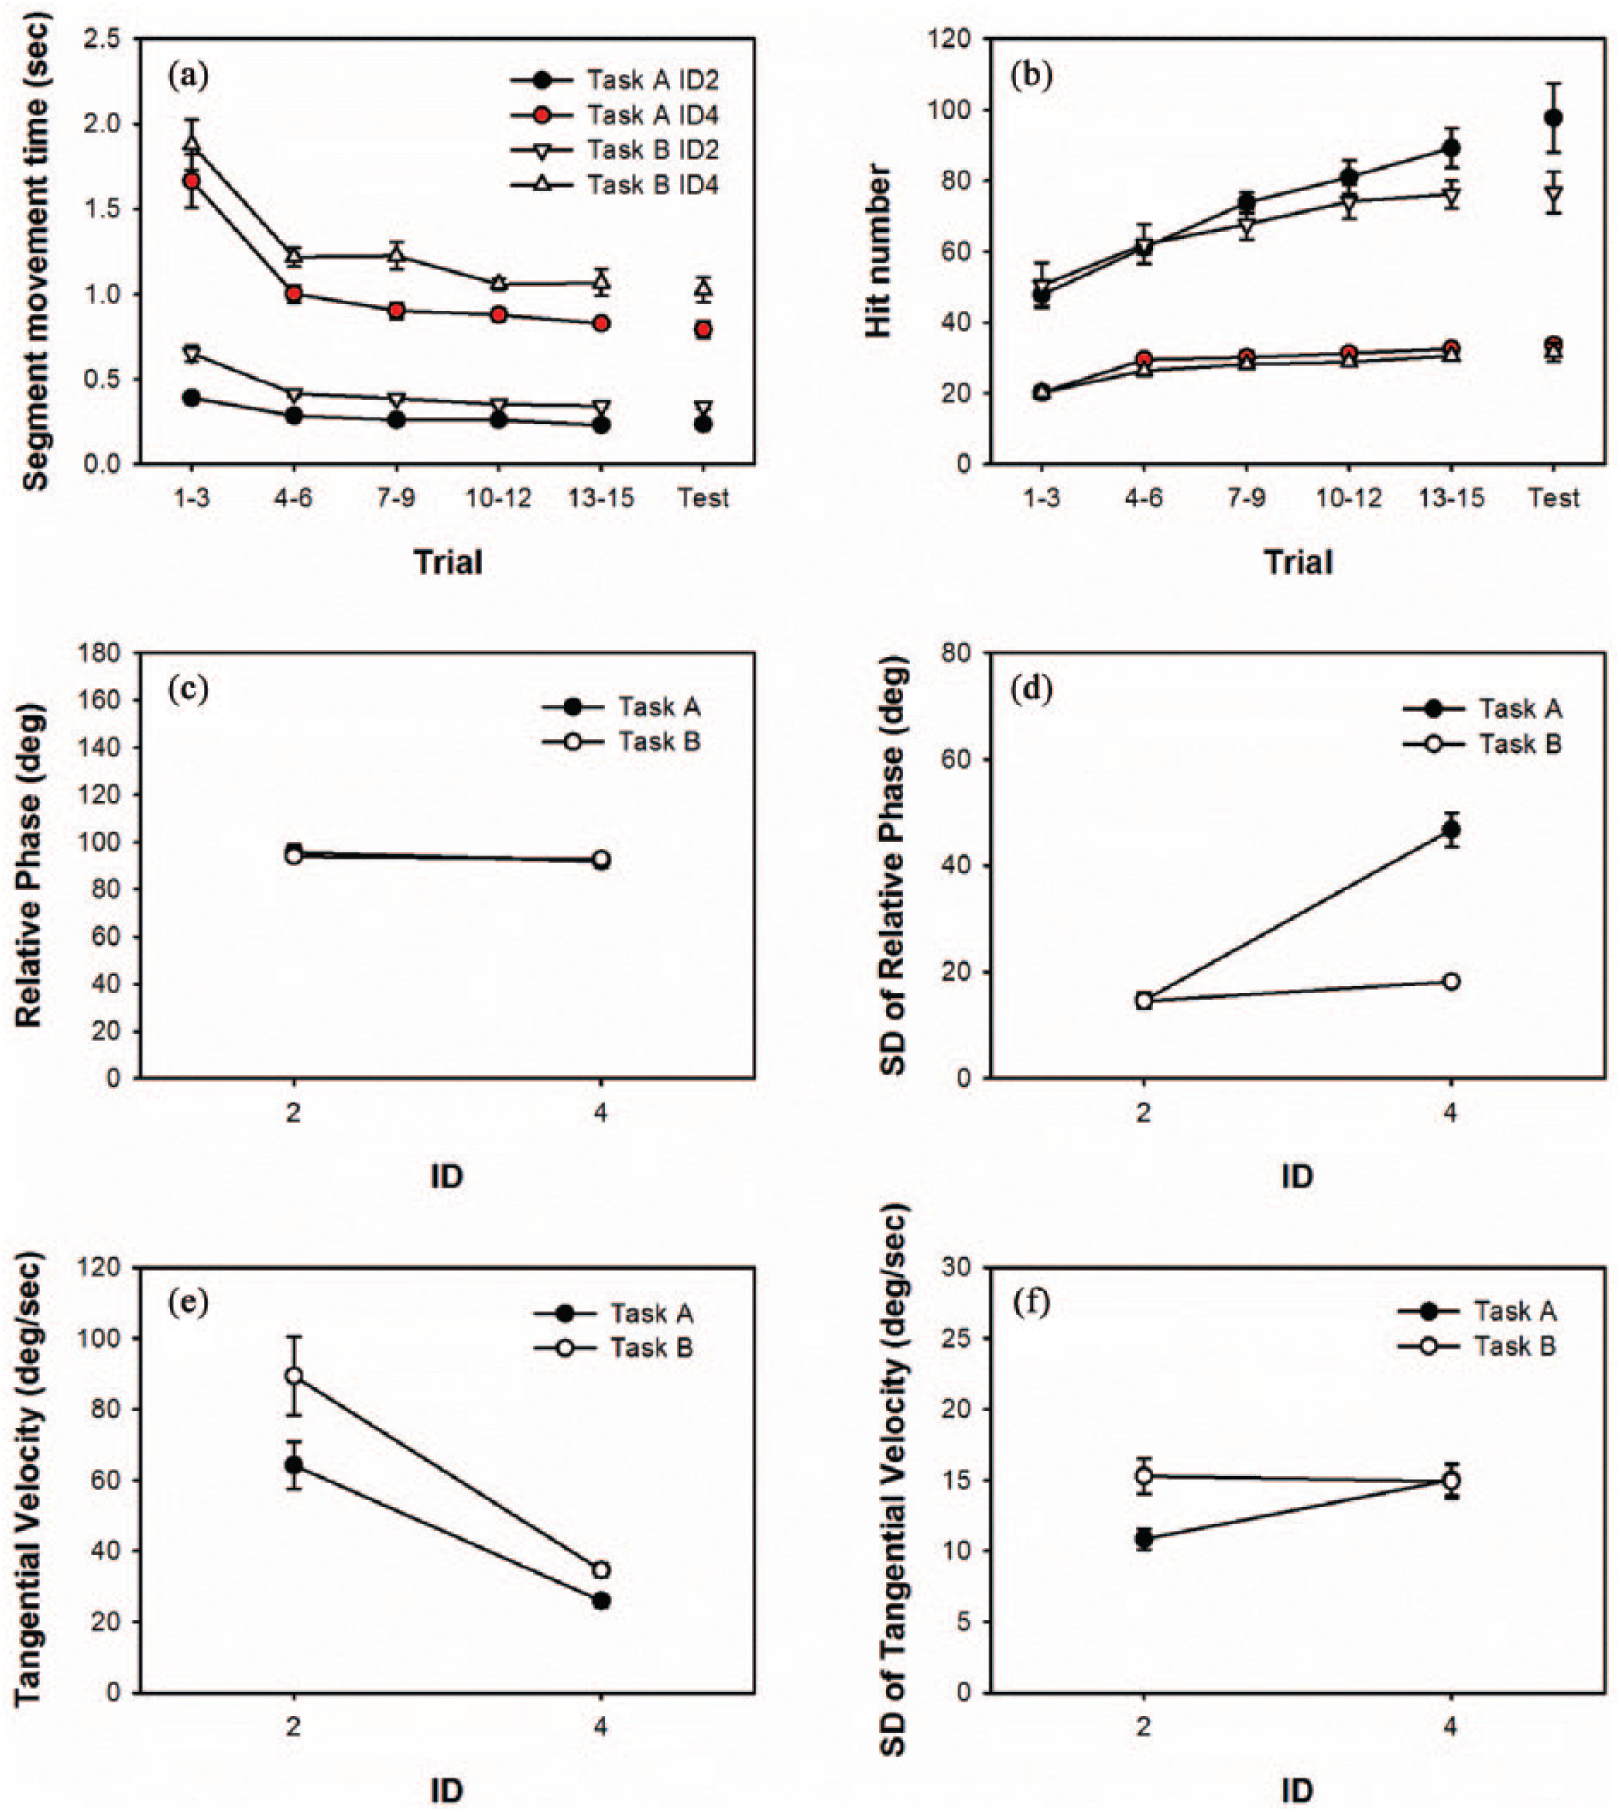
(a) Mean segment movement time and (b) hit number for every three practice trials and the test trial for each task and ID condition. Bimanual measures of (c) mean relative phase, (d) relative phase variability, (e) tangential velocity, and (f) tangential velocity variability for each task and ID on the test trial. Error bars represent standard error.
Mean values for IDs = 2 and 4 for one participant tested on Task A and for one participant tested on Task B.
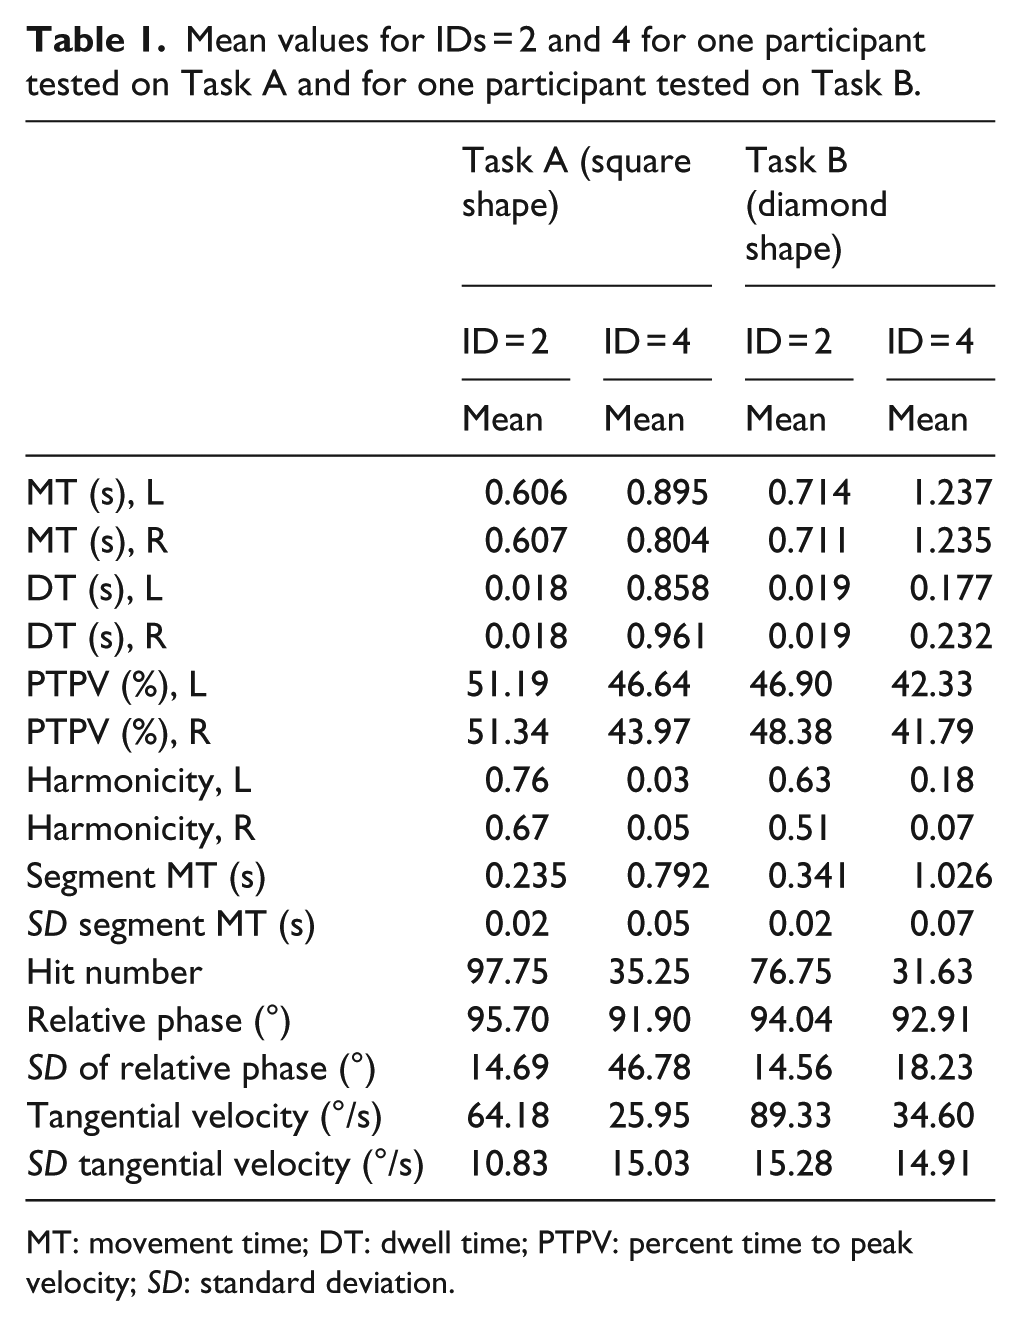
MT: movement time; DT: dwell time; PTPV: percent time to peak velocity; SD: standard deviation.
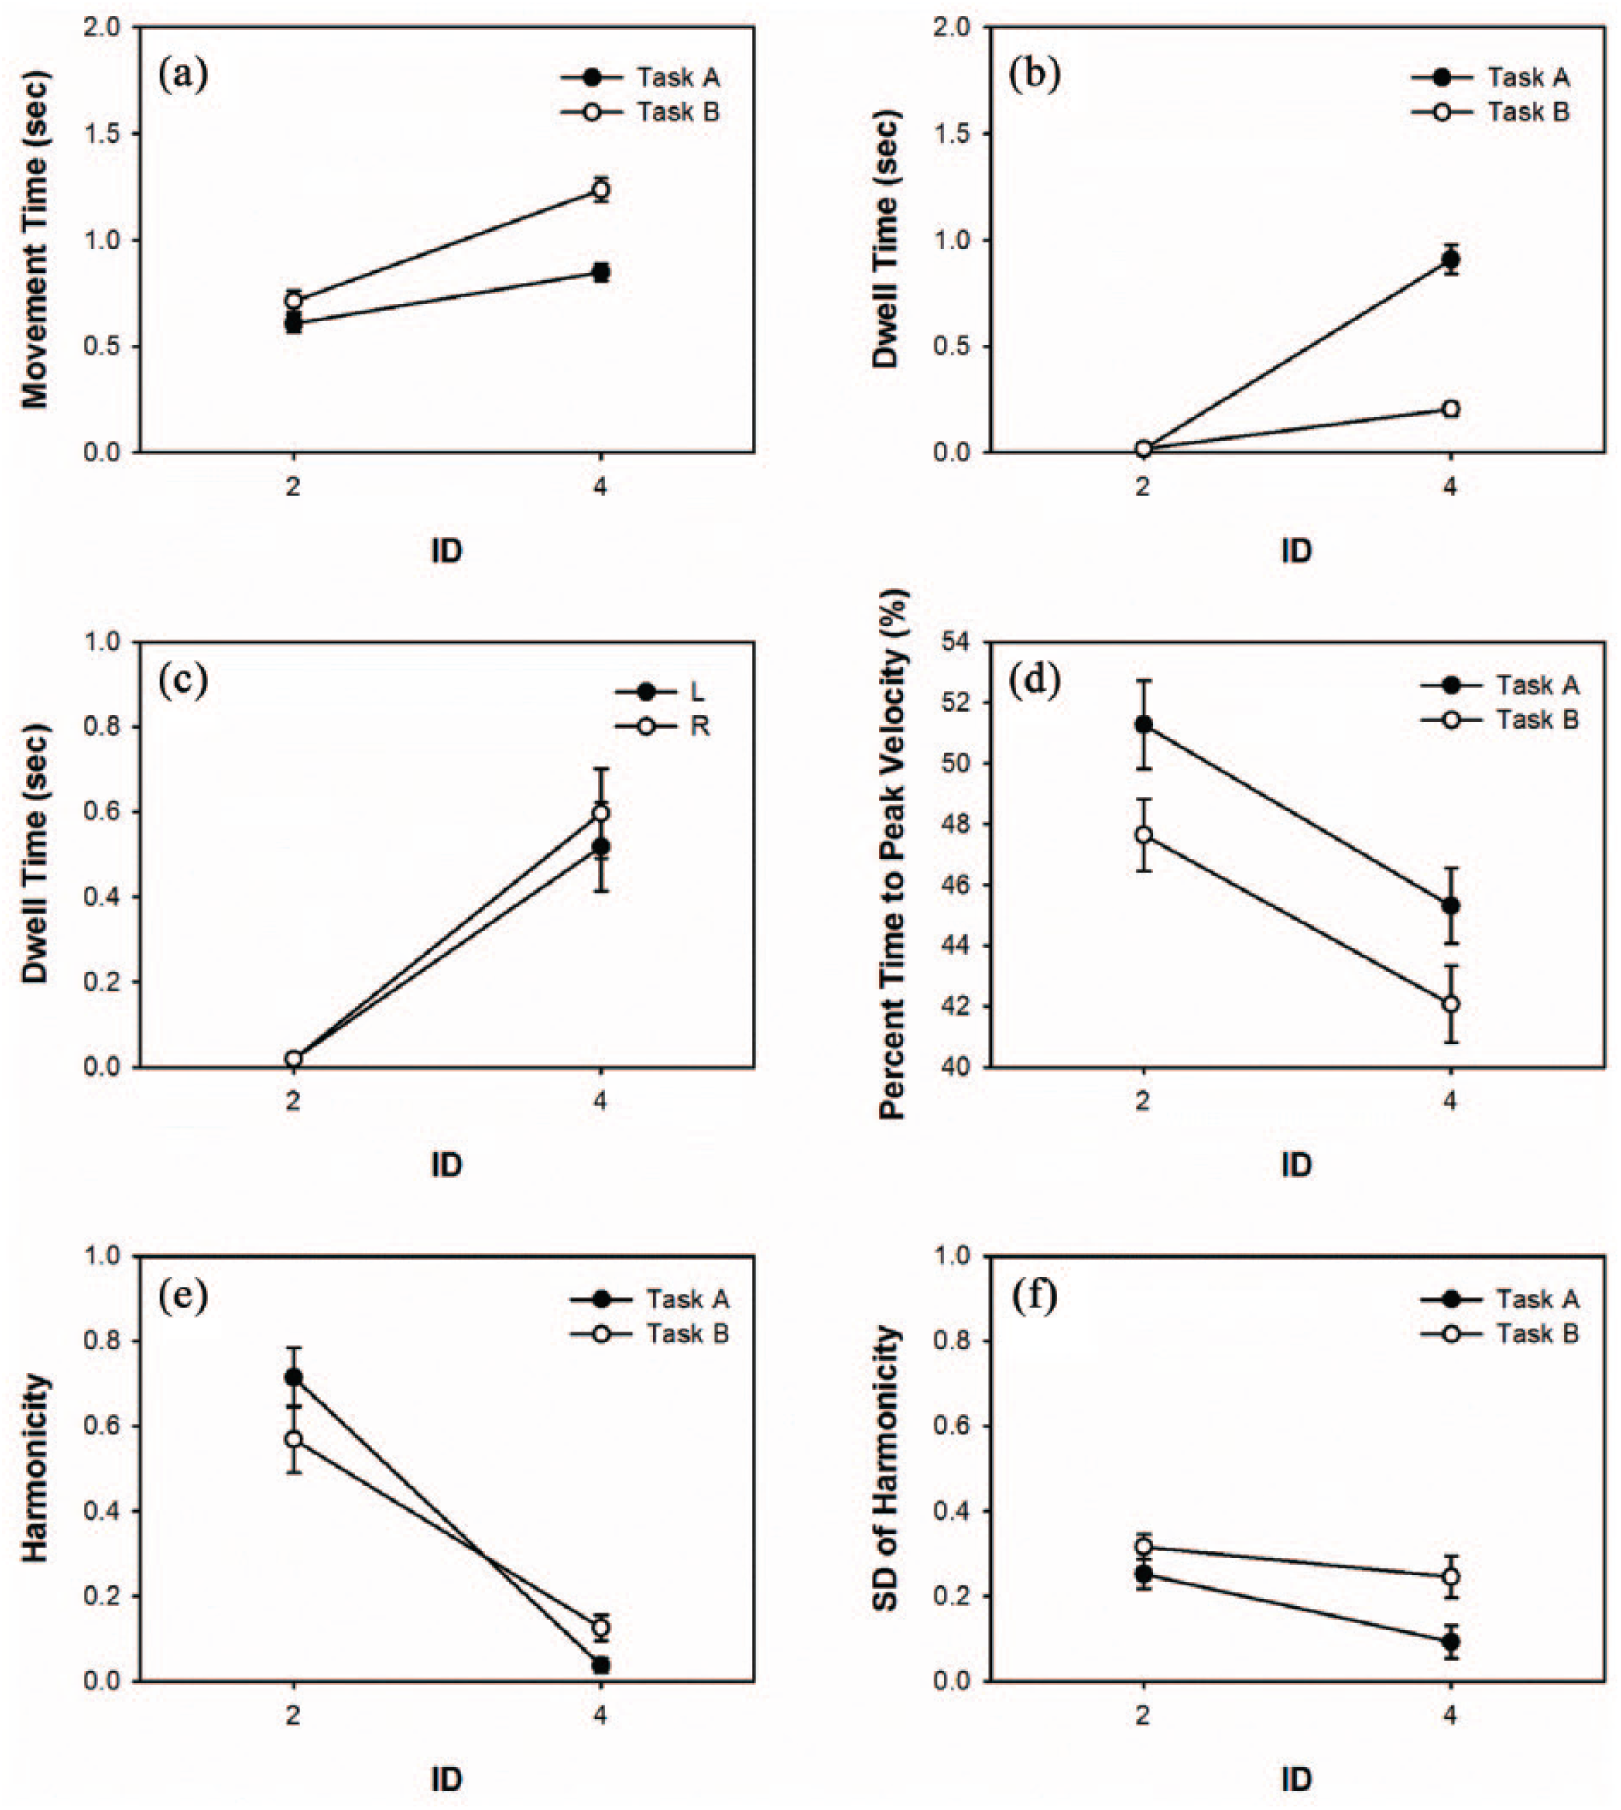
Unimanual measures of (a) mean movement time, (b, c) dwell time, (d) percent time to peak velocity, (e) harmonicity, and (f) harmonicity variability for Tasks A and B as a function of ID. The error bars represent standard error.
Task performance
Segment MT
The acquisition analysis for segment MT (Figure 3a) indicated a main effect of Task, F(1, 14) = 4.61, p < .05, with MT longer for Task B (M = 0.861 s, SE = 0.070 s) than for Task A (M = 0.670 s, SE = 0.058 s). The symbols M and SE represent mean and standard error values, respectively. The main effects of ID, F(1, 14) = 55.91, p < .01, and Trial, F(4, 56) = 35.73, p < .01, were also significant. In addition, the ID ×Trial interaction was significant, F(4, 56) = 5.00, p < .01. Simple main effects analysis of the Trial × ID interaction indicated that the segment MT for ID4 conditions decreased from Trials 1-3 to Trials 4-6; however, no significant difference between trials was detected for ID2 conditions. Simple main effects analysis of the Trial × ID interaction also indicated that the segment MT was longer for ID4 than for ID2 for all trials.
The analysis of segment MT on the test trial indicated main effects of Task, F(1, 14) = 6.92, p < .05, with segment MT longer for Task B (M = 0.684 s, SE = 0.101 s) than for Task A (M = 0.514 s, SE = 0.077 s) and ID, F(1, 14) = 121.5, p < .01, with segment MT increasing from the ID = 2 condition (M = 0.288 s, SE = 0.013 s) to the ID = 4 condition (M = 0.909 s, SE = 0.046 s).
Hits
The acquisition analysis of Hits indicated main effects of ID, F(1, 14) = 61.64, p < .01, and Trial, F(4, 56) = 48.57, p < .01. In addition, the ID ×Trial interaction was significant, F(5, 56) = 11.02, p < .01. Simple main effects analysis of the Trial × ID interaction indicated that the number of hits for ID2 condition increased over practice from Trials 1-3 to Trials 9-12 and the number of hits for ID4 increased from Trials 1-3 to Trials 4-6. Simple main effects analysis of the Trial × ID interaction also indicated that the number of hits was higher for ID2 than for ID4 for all trials.
The analysis of Hits on the test trial indicated only a main effect of ID, F(1, 14) = 93.51, p < .01, with the number of hits decreasing from the ID = 2 condition (M = 87.25, SE = 6.13) to the ID = 4 condition (M = 33.43, SE = 1.55).
Bimanual performance
RP
The analysis of mean RP did not detect any main effects or interactions (Figure 3c).
SD of RP
The analysis of RP variability detected a main effect of Task, F(1, 14) = 47.56, p < .01, and ID, F(1, 14) = 98.63, p < .01. In addition, the Task × ID interaction, F(1, 14) = 62.30, p < .01, was significant (Figure 3d). Simple main effects analysis of the Task × ID interaction indicated that RP variability for Task A was larger at ID4 (M = 46.78°, SE = 3.23°) than at ID2 (M = 14.68°, SE = 1.53°), but the difference in RP variability between the two IDs for Task B was not significant. Simple main effects analysis of the Task × ID interaction also indicated that the RP variability was larger for Task A (M = 46.78 , SE = 3.23 ) than Task B (M = 18.23 , SE = .89 ) at ID4, but no difference in RP variability between the two tasks was detected at ID2.
TV
The analysis of TV detected a main effect of Task, F(1, 14) = 5.28, p < .05, and ID, F(1, 14) = 66.65, p < .01 (Figure 3e). The average TV for Task B (M = 61.96 /s, SE = 8.90 /s) was larger than for Task A (M = 45.06 /s, SE = 5.95 /s). The TV for ID2 (M = 76.75 /s, SE = 7.02 °/s) was larger than for ID4 (M = 30.27 /s, SE = 1.65 /s). The Task × ID interaction was not significant.
SD of TV
The analysis of TV variability detected a Task × ID interaction, F(1, 14) = 5.69, p < .05 (Figure 3f). Simple main effects analysis of the Task × ID interaction indicated that TV variability for Task A was larger for ID4 (M = 15.02 °/s, SE = 1.12 °/s) than for ID2 (M = 10.82 °/s, SE = 0.73 °/s), but the difference in TV variability between the two IDs was not significant for Task B. Simple main effects analysis of the Task × ID interaction also indicated that the TV variability was smaller for Task A (M = 10.82 °/s, SE = 0.73 °/s) than for Task B (M = 15.28 °/s, SE = 1.23 °/s) at ID2, but no difference in TV variability between the two tasks was detected at ID4. None of the main effects was significant.
Unimanual performance
MT
The analysis of MT detected a main effect of Task, F(1, 14) = 12.05, p < .01, and ID, F(1, 14) = 40.88, p < .01. In addition, the Task × ID interaction, F(1, 14) = 5.48, p < .01, was significant (Figure 4c). Simple main effects analysis of the Task × ID interaction indicated that the MT for both tasks was longer at ID4 than ID2 (Task A-ID2 M = 0.606 s, SE = 0.040 s: Task A-ID4 M = 0.849 s, SE = 0.039 s; Task B-ID2 M = 0.712 s, SE = 0.050 s: Task B-ID4 M = 1.236 s, SE = 0.056 s). Simple main effects analysis of the Task × ID interaction also indicated that the MT was longer for Task B than Task A at ID4, but no difference in MT between the two tasks was detected at ID2. No other main effects or interactions were significant.
DT
The analysis detected a main effect of Task, F(1, 14) = 47.17, p < .01, Limb, F(1, 14) = 6.99, p < .05, and ID, F(1, 14) = 111.75, p < .01. In addition, the Task × ID interaction, F(1, 14) = 47.94, p < .01 (Figure 4d), and the Limb × ID interaction, F(1,14) = 7.35, p < .01 (Figure 4e), were significant. Simple main effects analysis of the Task × ID interaction indicated that the DT for both tasks was longer at ID4 than at ID2 (Task A-ID2 M = 0.017 s, SE = 0.002 s: Task A-ID4 M = 0.909 s, SE = 0.067 s; Task B-ID2 M = 0.018 s, SE = 0.003 s: Task B-ID4 M = 0.204 s, SE = 0.031 s). Simple main effects analysis of the Task × ID interaction also indicated that the DT was longer for Task A than for Task B at ID4, but no difference in DT between the two tasks was detected at ID2. Simple main effects analysis of the Limb × ID interaction indicated that the DT for both limbs was longer at ID4 than at ID2 (left-ID2 M = 0.018 s, SE = 0.002 s: left-ID4 M = 0.517 s, SE = 0.103 s; right-ID2 M = 0.018 s, SE = 0.002 s: right-ID4 M = 0.596 s, SE = 0.105 s). Simple main effects analysis of the Limb × ID interaction also indicated that the DT was longer for the right limb than left limb at ID4, but no difference in DT between the two limbs was detected at ID2. No other main effects or interactions were significant.
PTPV
The analysis of PTPV detected a main effect of Task, F(1, 14) = 5.57, p < .05, and ID, F(1,14) = 12.06, p < .01 (Figure 4f). The PTPV for Task A (M = 48.28%, SE = 1.08%) was higher than for Task B (M = 44.85%, SE = 0.99%). The PTPV for ID2 (M = 49.44%, SE = 0.97%) was higher than for ID4 (M = 43.684%, SE = 0.91%). No other main effects or interactions were significant.
Harmonicity (H)
The analysis of harmonicity detected a main effect of Limb, F(1, 14) = 7.78, p < .05, and ID, F(1, 14) = 55.12, p < .01 (Figure 4g). The H values for the left limb (M = 0.398, SE = 0.064) were higher than for the right limb (M = 0.324, SE = 0.063). The H values for ID2 (M = 0.641, SE = 0.054) were higher than for ID4 (M = 0.081, SE = 0.018). No other main effects or interactions were significant.
Discussion
The results suggest that participants were adept at adopting effective control strategies when faced with novel tasks and were also effective in altering this strategy when the size of the targets increased or decreased. The bimanual coordination performance results for both Tasks A and B indicated that for the ID2 condition, participants moved the cursor in a circular path in the Lissajous display. The circular path resulted from participants adopting a bimanual control strategy with the two limbs moving in 1:1 with a 90° phase offset. For Tasks A and B at ID2, RP was ≈90° with relatively small RP variability (<15°). This strategy is similar to that portrayed using simulated data in Figure 1 (a, c, e and g, i, k).
In the ID4 condition where the target size was reduced, however, participants moved the cursor in more direct straight-line paths in the Lissajous display. For Task A, this resulted from the participants alternating between unimanual right and left limb movements. When tested on Task B, participants achieved the relatively straight-line movements between targets by alternating between in-phase (moving the limbs in the same direction) and anti-phase (moving the limbs in opposite directions). These control strategies are also similar to those depicted in Figure 1 (b, d, f and h, j, l) using simulated data.
Note that for Tasks A and B for the ID4 conditions, mean RP values were also ≈90° However, this was not a result of participants adopting the same control strategy used in the ID2 conditions, but rather this was a result of participants performing Task A-ID4 by alternating the movement of the left and right limb (unimanual control strategy). This results in RP values changing when the phase angle of one limb does not change while the phase angle of the other limb is changing. The result was a substantial increase in RP variability from <15° for the ID2 condition to 46° for the ID4 condition. For Task B, mean RP was also similar across IDs, but RP variability only modestly increased as the ID increased. The data indicated that participants performing Task B-ID4 continually transitioned between bimanual in-phase and anti-phase coordination patterns at the ID4 condition. Note also that the RP computation for the ID4 condition was influenced by not only the fact that the limbs transitioned between moving in the same direction and moving in opposite directions but also the finding that the limbs were offset in terms of where the phase cycle for one limb started and ended and where the phase cycle for the other limb started and ended. This produced RP values that were less variable than for Task A-ID4.
Influence of ID on bimanual coordination
The performance results for both Tasks A and B indicated that as ID increased, segment MTs (time between two targets) were slower and hit numbers were decreased. Indeed, the velocity of the cursor in the Lissajous display for both tasks (which scales to the TV of the two limbs) was high and relatively stable for the ID2 conditions and was lower and more variable at ID4 conditions. These findings were consistent with the unimanual measures for both tasks which showed that as ID increased, MT, DT, and cycle duration increased while PTPV and harmonicity were reduced, indicating that more time was spent on the deceleration phase and the movement was less harmonic. These kinematic features all suggest that movement control changed from cyclical/open-loop to a more discrete/close-loop controlled motion. These findings are generally consistent with the unimanual aiming literature (Buchanan et al., 2004, 2006; Guiard, 1993, 1997) and suggest that the influence of ID on unimanual control strategies used in reciprocal aiming movements can be extended to bimanual movements.
Taking the bimanual and unimanual measures of performance results together, we conclude that at the low ID condition participants of both tasks produced a continuous 90° bimanual coordination pattern (Figure 3a and o) with relatively harmonic movements for both limbs. The movement for each limb is consistent with reciprocal unimanual movement typically observed under low ID constraints. However, in the ID4 condition, the participants chose to switch between unimanual left and right movements in Task A (Figure 1b) and to switch between 1:1 in-phase and anti-phase bimanual coordination patterns in Task B (Figure 1p). The present results suggest that participants when facing different task restraints (e.g., target arrangement and target size) chose different unimanual and bimanual control strategies. When asked to perform Task A-ID2, participants choose a more difficult and presumably less stable 1:1 bimanual coordination pattern with 90° RP over a less difficult unimanual control strategy, but chose the less difficult and more stable unimanual control option when the ID was increased. This finding, in part, goes against our initial prediction based on the bimanual coordination literature. The literature suggests that more stable bimanual coordination patterns are preferred over less stable bimanual control strategies and unimanual control strategies are preferred over bimanual control strategies when permitted by task constrains. When asked to perform Task B-ID2, participants not only chose a continuous bimanual 1:1 with 90° RP control strategy but also utilised a slightly modified form of this control strategy when the ID was increased. Perhaps most striking was the finding that all participants adopted approximately the same control strategy for each of the task conditions with the strategy not influenced by which ID condition was tested first or second.
Impact of integrated displays on bimanual coordination
The difficulty in producing 1:1 bimanual coordination patterns with various phase offsets has been attributed, in part, to phase attraction to the intrinsic dynamics (in-phase or anti-phase) of the perceptual-motor system (e.g., de Guzman & Kelso, 1991; Haken, Peper, Beek, & Daffertshofer, 1996; de Guzman & Kelso, 1991; Peper et al., 1995; Treffner & Turvey, 1993). These characteristics have been formally characterised (e.g., Kelso, 1995), extensively investigated (e.g., Carson, 2005; Fuchs & Jirsa), explained using concepts taken from synergetics (Haken, 1981) and nonlinear dynamical systems, and modelled using nonlinearly coupled limit cycle oscillators (Haken, Kelso, & Bunz, 1985) perturbed by stochastic forces (Schöner et al., 1986).
Indeed, the learning of many phase relationships other than in-phase and anti-phase has required several days of practice, and some more complex multi-frequency bimanual coordination patterns have been deemed impossible to be effectively performed without very extensive practice. However, when integrated information such as provided in Lissajous displays is used, as in the present experiments, participants’ performance on a wide variety of phase relationships and multiple frequency ratios has been shown to be remarkably stable after only a few minutes of practice (e.g., Kovacs et al., 2010a, 2010b). Similarly, this literature has demonstrated that participants can intentionally transition between various phase relationships and even transfer from one complex frequency ratio (5:3) to another (4:3) without warning, or additional practice suggests that the effects of the intrinsic dynamics are minimised when this type of feedback is provided. Indeed, in each of these experiments, RP errors were not only similar across the tasks but also remarkably low (variability ≈10°). We argue that this was possible because salient, unified extrinsic information was provided in the form of a Lissajous display. This perceptual information allowed participants detect and correct coordination errors, allowing them to rapidly “tune-in” the required behaviour. It is important to note that other forms of integrated displays have also produced very positive results (e.g., Boyle, Panzer, & Shea, 2012; Preilowski, 1972; see Shea et al., 2016, for review) and are sometimes used in game controls to integrate the movement of the fingers of the left and right limb or more natural situations (see Diedrichsen, Nambisan, Kennerley, & Ivry, 2004).
In terms of the present experiment, it is truly remarkable that participants, although not previously exposed to this form of feedback, were able to choose very effective control strategies to complete the specific task requirement and then alter their control strategy as the ID was increased or decreased depending on the order in which they practised the ID conditions. The bottom line is that participants find it relatively easy to traverse the attractor landscape when integrated feedback is provided. Thus, when feedback is provided that directs the attention of the participant to the integrated movement of their limbs, the pool of salient control options is greatly increased. The ability to quickly and effectively modify newly developed control strategies demonstrates the amazing capabilities of the perceptional motor system.
Summary
Although the tasks and Lissajous displays were novel to the participants, they were able to select and effectively implement appropriate unimanual and bimanual control strategies depending on the demands of the task. For Task A, where the targets were arranged in a square shape, participants switched between a bimanual 1:1 with 90° phase offset and unimanual control when the target size was increased or decreased, with the strategy utilised relatively uniform across participants. For Task B, where the targets were arranged in a diamond shape, participants switched between two distinct bimanual coordination patterns. As with Task A, participants asked to perform Task B with the low ID utilised 1:1 with a 90° RP offset. When the ID was increased, participants alternated between in-phase and anti-phase coordination patterns.
Footnotes
Declaration of conflicting interests
The author(s) declared no potential conflicts of interest with respect to the research, authorship, and/or publication of this article.
Funding
The author(s) received no financial support for the research, authorship, and/or publication of this article.