
Abstract
Studies examining the formation of melodic and harmonic expectations during music listening have repeatedly demonstrated that a tonal context primes listeners to expect certain (tonally related) continuations over others. However, few such studies have (1) selected stimuli using ready examples of expectancy violation derived from real-world instances of tonal music, (2) provided a consistent account for the influence of sensory and cognitive mechanisms on tonal expectancies by comparing different computational simulations, or (3) combined melodic and harmonic representations in modelling cognitive processes of expectation. To resolve these issues, this study measures expectations for the most recurrent cadence patterns associated with tonal music and then simulates the reported findings using three sensory–cognitive models of auditory expectation. In Experiment 1, participants provided explicit retrospective expectancy ratings both before and after hearing the target melodic tone and chord of the cadential formula. In Experiment 2, participants indicated as quickly as possible whether those target events were in or out of tune relative to the preceding context. Across both experiments, cadences terminating with stable melodic tones and chords elicited the highest expectancy ratings and the fastest and most accurate responses. Moreover, the model simulations supported a cognitive interpretation of tonal processing, in which listeners with exposure to tonal music generate expectations as a consequence of the frequent (co-)occurrence of events on the musical surface.
To account for the formation of expectations during music listening, an extensive body of research on the perception of Western tonal music has adopted a top-down, cognitive view of musical processing (Collins, Tillmann, Barrett, Delbé, & Janata, 2014), whereby listeners learn the temporal relations characterising complex hierarchical organisational systems like tonality or metre over the course of exposure and then impose that knowledge on all subsequent musical experiences. From this point of view, composers seem to exploit the brain’s predictive mechanisms by organising musical events to reflect the kinds of statistical regularities that listeners will learn and remember (Krumhansl, 1990). The tonal cadence is exemplary in this regard. As a highly recurrent harmonic and melodic formula, the cadence provides perhaps the clearest instance of phrase-level schematic organisation in the tonal system. As a consequence, cadences serve as closing gestures in a vast number of genres and style periods, with the cluster of constituent features that characterise cadences—such as a conventionalised harmonic (chord) progression and a falling melody—alerting listeners to the impending end of the phrase, theme, or larger section that subsumes them.
According to Huron (2006) and Meyer (1956), cadences are the most predictable, probabilistic, and specifically envisaged temporal patterns in all of tonal music. For this reason, cadences are routinely employed in experimental contexts to investigate cognitive processes related to the storage of harmonic and tonal structure in long-term memory (Krumhansl & Kessler, 1982), the perception of dynamic variations in tension (Bigand & Parncutt, 1999), and the priming of tones or chords from similar or identical tonal contexts (e.g., Koelsch, Gunter, Friederici, & Schröger, 2000). These findings have led researchers to suggest that listeners with exposure to tonal music possess schematic representations for cadences and other recurrent temporal patterns (Eberlein, 1997; Eberlein & Fricke, 1992; Gjerdingen, 1988; Meyer, 1967; Rosner & Narmour, 1992; Sears, 2015, 2016; Sears, Caplin, & McAdams, 2014; Temperley, 2004).
Nevertheless, recent simulations of tonal priming effects using sensory models of echoic and auditory short-term memory have called into question the necessity of strictly cognitive accounts (Bigand, Delbé, Poulin-Charronnat, Leman, & Tillmann, 2014; Collins et al., 2014). From the sensory point of view, facilitation effects arise when the preceding context shares sensory features with the target event of the sequence. Whether cadences and other temporal patterns reflect processing mechanisms related to learning and memory is thus inconsequential to sensory accounts so long as the terminal events of the pattern share component tones or overtones with the preceding context. What is more, studies examining the influence of sensory and cognitive processes on the formation of tonal expectancies typically compose (or select) melodic or harmonic (chord) sequences that control for the psychoacoustic similarities between the preceding context and the terminal, target event (e.g., Tekman & Bharucha, 1998). As a result, ecological validity tends to be low in the expectancy literature (Pearce, Ruiz, Kapasi, Wiggins, & Bhattacharya, 2010), as participants are less likely to encounter such artificially constructed stimuli in the natural environment.
To resolve these issues using ready examples of expectancy violation derived from genuine musical materials, the present study compared the most common cadence patterns from a representative corpus of tonal music against cadential deviations (Caplin, 1998, 2004; Sears et al., 2014), which initially promise the expected terminal events of a cadential formula but then replace those events with unexpected melodic tones or chords. To account for the sensory and cognitive mechanisms underlying tonal expectancies, we also simulated the reported findings using three sensory–cognitive models of musical processing. The first is the echoic memory (EM) model (Leman, 2000), 1 a sensory model of auditory expectations that simulated the priming effects for stimulus sets from 18 separate studies (Bigand et al., 2014). The second is the tonal space (TS) model (Janata et al., 2002), a sensory–cognitive priming model that has predicted the priming effects for the response-time (RT) data from seven separate studies (Collins et al., 2014). Finally, the third is the Information Dynamics of Music (IDyOM) model (Pearce, 2005), a finite-context (or n-gram) model simulating cognitive priming effects, which has been shown to predict behavioural (Omigie, Pearce, & Stewart, 2012; Pearce, Ruiz, et al., 2010; Pearce & Wiggins, 2006), electrophysiological (Egermann, Pearce, Wiggins, & McAdams, 2013), and neural evidence for melodic pitch expectations (Omigie, Pearce, Williamson, & Stewart, 2013; Pearce, Ruiz, et al., 2010).
We first introduce the necessary music terminology and concepts, and then review explicit and implicit behavioural methods for measuring tonal expectations, as well as the evidence obtained therefrom.
Tonal structure
Much of the world’s music relies on musical scales that divide the octave—a doubling in frequency—into a moderate number of discrete and discriminable steps (Dowling & Harwood, 1986). In equal-tempered music, the octave is typically divided equally into 12 steps (or semitones) along a logarithmic scale, subsets of which form the most common scales associated with Western tonal music (e.g., major, minor, pentatonic). The vast majority of these scales also depend on the perceptual phenomenon known as octave equivalence (Deutsch, 1999)—pitches separated by a frequency interval representing a power of two are perceived as similar—to reduce the vocabulary of pitches to 12 pitch classes, each of which receives a letter designation in music theory nomenclature (C, C♯/D♭, D, etc.).
For each of the 12 major and minor keys associated with the tonal system (one major and one minor for each pitch class), seven pitch classes (called diatonic) belong to the key and five (called chromatic) fall outside the key. Together, the diatonic pitch classes form the degrees of the scale and are represented numerically with a caret above each numeral (see Figure 1a). Thus, C and G are the first and fifth scale degrees in the key of C major, and so receive the values 1ˆ and 5ˆ, respectively. Furthermore, two pitches presented simultaneously form a harmonic interval, combinations of which form chords.
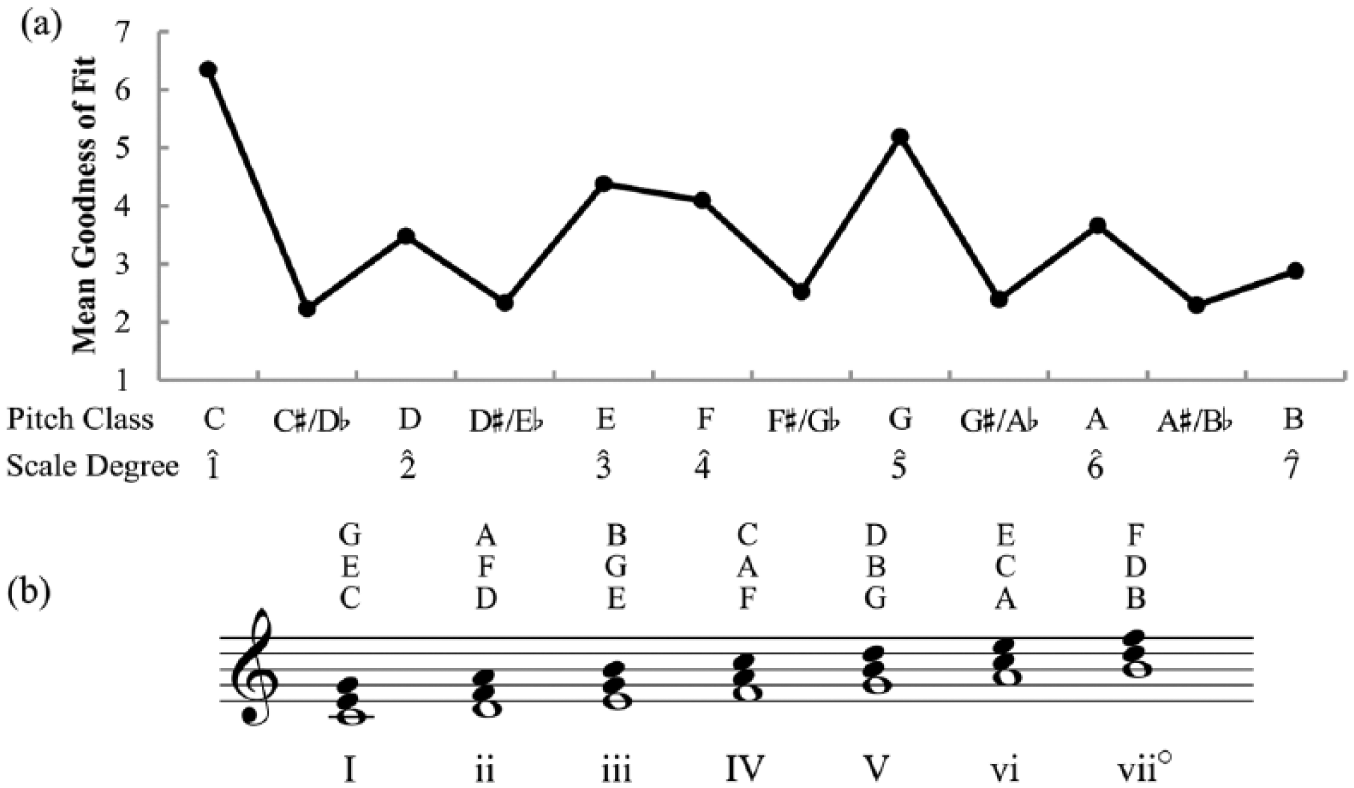
Krumhansl and Kessler’s (1982) major key profile (a), and the seven diatonic triads for the key of C major, with pitch classes above and Roman numerals (b).
The diatonic chords associated with tonal harmony typically consist of two or more scale degrees ordered such that their intervals feature superimposed thirds—intervals that span three or four semitones—above the most perceptually stable scale degree of the chord, called the root (Parncutt, 1989; Rameau, 1722/1971). A chord featuring two superimposed thirds is called a triad, and the size of one or both of these intervals determines whether the triad is major (i.e., the lower interval spans four semitones, or a major third), minor (i.e., the lower interval spans three semitones, or a minor third), augmented (i.e., both intervals feature major thirds), or diminished (i.e., both intervals feature minor thirds). Shown in Figure 1b, chords built in this way on each degree of the diatonic scale are represented using Roman numerals, with the letter case of the Roman numeral used to denote whether the chord features a major (uppercase) or minor (lowercase) triad. 2 In the key of C major, for example, an F major triad consists of the pitch classes F, A, and C, and given that F is the fourth degree of the scale, the chord receives the Roman numeral IV.
Broadly conceived, tonality refers to the systematic hierarchical organisation of pitch phenomena such that certain tones and/or chords are perceived as more stable and serve as better completions than others (Bharucha & Krumhansl, 1983). This tonal hierarchy is perhaps best illustrated in Krumhansl and Kessler’s (1982) seminal probe-tone studies, in which participants heard a short context consisting of a harmonic cadence (IV–V–I) and then indicated how well each of the 12 members of the chromatic scale fit with the preceding context. In the major key profile obtained by Krumhansl and Kessler (see Figure 1a), the tonic (1ˆ) received the highest fit ratings, leading them to suggest that it serves as the most stable reference point in the tonal system (see also Bharucha, 1984; Krumhansl, 1990). In descending order of fit, the tonic was then followed by the dominant (5ˆ), the remaining diatonic members (2ˆ, 3ˆ, 4ˆ, 6ˆ, and 7ˆ), and finally the other (chromatic) members (not labelled). In a subsequent study, Krumhansl, Bharucha, and Kessler (1982) also generalised these findings to the chords of the diatonic scale, noting that more stable chords like the tonic (I) and dominant (V) serve as better continuations in two-chord progressions, and so appear at the top of the harmonic hierarchy. What is more, these chords receive higher continuation judgements when they follow, rather than precede, the remaining diatonic chords (Bharucha & Krumhansl, 1983), suggesting that they appear at the ends of cadences and other recurrent closing patterns in tonal music because they serve as cognitive reference points (Rosch, 1975).
Measuring tonal expectations
To measure the formation of expectations during music listening, behavioural studies employ explicit and implicit measures. Explicit measures typically consist of retrospective rating tasks, in which participants hear a musical context and then indicate the strength and specificity of their expectations for further continuation (Schmuckler, 1989), or they provide a measure of uncertainty for the range of possible future outcomes (Hansen & Pearce, 2014; Huron, 2006, p. 46). However, explicit measures have been criticised for conflating expectations derived from explicit training with those resulting from implicit exposure (Bigand, 2003), so experimental studies often employ implicit tasks using the priming paradigm, which assumes that the processing of incoming events is affected by the context in which they appear; related or repeated events are primed, thus facilitating processing (for a detailed discussion of experimental methods in studies examining tonal expectations, see Huron & Margulis, 2010).
To account for tonal priming effects, researchers typically control for the sensory or psychoacoustic similarities between the preceding context and the target by manipulating the experimental stimuli so that (1) the context and the target share no component tone or chord events (repetition priming) and/or (2) the selected timbre consists of a simple periodic waveform like a sine tone to minimise the potential for shared overtones (sensory priming). In the last three decades, priming studies have demonstrated that after short contexts, targets from related tonal contexts were processed faster than unrelated targets even when the context and target did not share sensory information or were separated by a silent interval or a white noise burst (Bharucha & Stoeckig, 1987; Tekman & Bharucha, 1992). In longer contexts, participants also demonstrated facilitated processing for related targets compared with less related targets (Koelsch, Jentschke, Sammler, & Mietchen, 2007; Marmel, Tillmann, & Delbé, 2010), and this priming effect persisted even when the less related targets shared more tones with the context than related targets (Bigand, Poulin, Tillmann, Madurell, & D’Adamo, 2003). These schematic priming effects also remained unaffected by veridical knowledge about how each stimulus might proceed (Justus & Bharucha, 2001; Tillmann & Poulin-Charronnat, 2010).
Nevertheless, disentangling low-level sensory influences from cognitive accounts of tonal expectancy remains a tremendous challenge, and appealing to the musical materials themselves tends to complicate rather than clarify matters. Sensory or psychoacoustic accounts of tonal harmony are deeply rooted in the history of Western music theory (e.g., Rameau, 1722/1971), and they continue to find favour in contemporary scholarship (Large, Kim, Flaig, Bharucha, & Krumhansl, 2016; Leman, 2000; Parncutt, 1989). Bigand et al. (2014) note, for example, that tonal syntax reflects psychoacoustic constraints like octave equivalence and harmonic overtones, as well as general auditory mechanisms related to the perception of acoustic dissonance (Plomp & Levelt, 1965; Sethares, 1998), virtual pitch perception (Terhardt, 1974; Terhardt, Stoll, & Seewann, 1982), and principles of auditory stream analysis (Bregman, 1990; Wright & Bregman, 1987). Note and chord events associated with the tonic and dominant also feature strong overlaps in harmonic spectra, which suggests that properties of sounds could provide an “acoustic foundation” for tonal syntax (Bigand et al., 2014, p. 3).
Unfortunately, because tonal priming studies often feature rhythmically isochronous, chorale-like passages presented at relatively long inter-onset intervals (IOIs), with the target or the preceding context recomposed in the unexpected condition, these stimulus sets do not adequately reflect examples of expectancy violation derived from musical styles and genres to which listeners might be exposed (Pearce, Ruiz, et al., 2010). To resolve this issue, recent studies have demonstrated melodic and harmonic priming effects for genuine musical materials using behavioural and psychophysiological measures (Aarden, 2003; Egermann et al., 2013; Koelsch, Kilches, Steinbeis, & Schelinski, 2008; Pearce, Ruiz, et al., 2010; Steinbeis, Koelsch, & Sloboda, 2006). Only two of these studies extended the reported findings to multi-voiced chord progressions, however, and neither of these studies attempted to replicate their findings using existing computational models of auditory expectation. Finally, no study to date has attempted to staircase tonal expectations by comparing the most expected cadential sequences against their less expected (and thus less stable) cadential counterparts.
To address these issues, this study examined expectations for the terminal melodic tones and chords from the most common cadence patterns associated with tonal music. To that end, we adopted the stimulus-selection paradigm introduced in Sears et al. (2014), in which participants provided completion ratings for passages from Mozart’s keyboard sonatas that terminated with cadences from one of the following five categories in contemporary tonal cadence typologies (e.g., Caplin, 1998, 2004; Schmalfeldt, 1992): perfect authentic cadence (PAC), imperfect authentic cadence (IAC), half cadence (HC), deceptive cadence (DC), and evaded cadence (EV). Shown in the first example of Figure 2, the PAC category, which features a final chord progression from a root-position dominant to a root-position tonic (i.e., a V–I progression with the root scale degree in the lowest voice in each chord), as well as the arrival of the melody on 1ˆ, serves as the quintessential closing pattern for musical repertories spanning much of the history of Western music (Margulis, 2005; Sears, 2016) and also routinely appears in the expected condition in harmonic priming studies. The IAC category is a melodic variant of the PAC category that replaces 1ˆ with 3ˆ in the melody but retains the V–I chord progression. Like the PAC category, the IAC also typically appears at the ends of phrases or larger sections in tonal music. These two categories therefore constitute authentic cadences and appear at the top of the hierarchy of harmonic stability (Krumhansl et al., 1982).
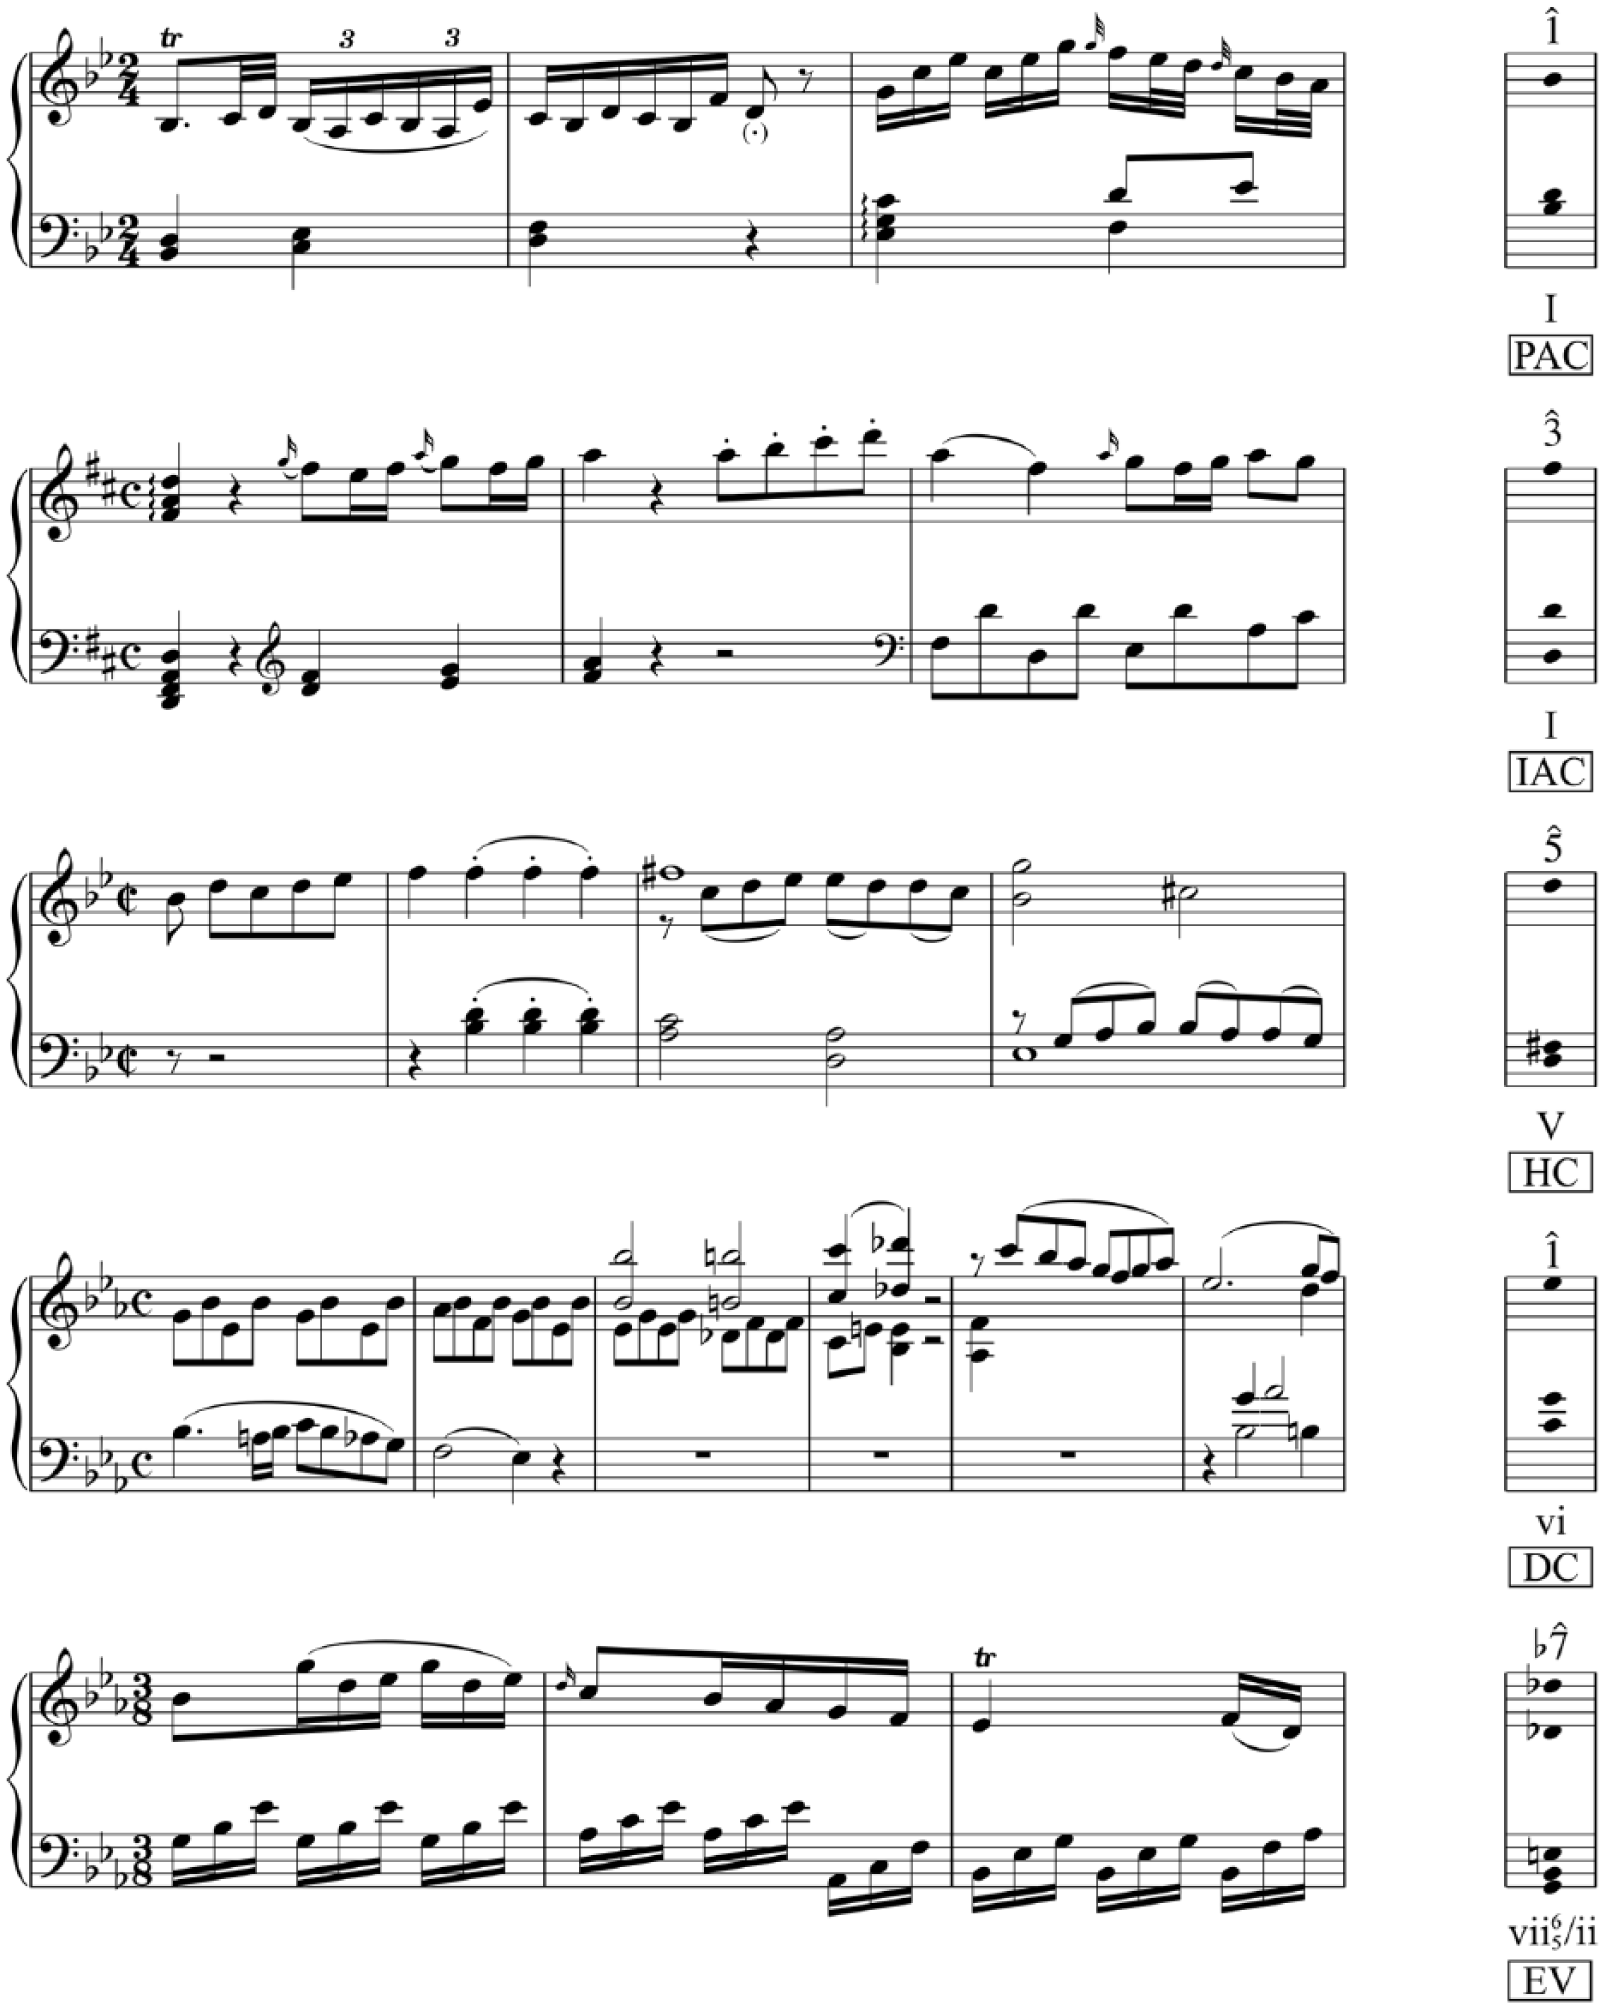
Five stimuli representing the five cadence categories.
The HC category (third example in Figure 2) concludes with dominant triad in root position and any chord member in the melody (i.e., a V chord with 2ˆ, 5ˆ, or 7ˆ in the melody). Unlike the PAC and IAC categories, the HC category concludes with the less stable dominant chord, and thus appears below the authentic cadences in the harmonic hierarchy and presumably elicits weaker expectations in anticipation of its occurrence (Tillmann, Janata, Birk, & Bharucha, 2008). Finally, the remaining two categories represent cadential deviations of the authentic cadence, which is to say that they initially promise an authentic cadence, yet fundamentally deviate from the pattern’s terminal events. The DC category (fourth example in Figure 2) leaves the pattern somewhat open by closing with a nontonic chord, usually vi, but the melodic line resolves to a stable scale degree like 1ˆ or 3ˆ. Finally, the EV category (final example in Figure 2) is characterised by a sudden interruption in the harmonic and melodic events of the pattern: the melody, instead of resolving to 1ˆ, often leaps up to another scale degree (such as 5ˆ), and the final harmony may be replaced by an unexpected, nontonic chord (for further details, see Sears et al., 2014). Together, these categories would be expected to appear at the bottom of the harmonic hierarchy.
To measure tonal expectancies, this study employs a converging-methods approach. In Experiment 1, participants were presented with a truncated stimulus that omits the final, target melodic tone and chord of the cadence; they then heard a nontruncated version of the stimulus that includes the final events. Following the truncated stimulus, participants indicated the strength and specificity of their expectations for a musical continuation. Following the nontruncated stimulus, participants then indicated how well the final target melodic tone and chord fit with the expectations they had formed during the preceding context. To measure expectancies implicitly, Experiment 2 adopted the priming paradigm, in which participants indicated as quickly as possible whether the target melodic tone and chord from each stimulus were in or out of tune relative to the preceding context. Accuracies and response times (RTs) were then collected to determine whether the preceding context primed participants to expect tonally related or repeated (i.e., identical) target events. Finally, to account for the findings from these experiments, we simulated the results using three sensory and/or cognitive computational models of tonal expectation.
Experiment 1
Method
Participants
Participants were 40 members (20 female) of the Montreal community recruited through the Schulich School of Music and the McGill University classified ads. Ages ranged from 18 to 46 (M = 24, SD = 6). Twenty participants with musical training equivalent or superior to second-year-university level formed the musician group, and 20 participants with less than 1 year of musical training comprised the nonmusician group. To limit any effects caused by familiarity with the stimuli, no participant with more than 2 years of formal study on the piano was permitted to take part. All participants provided informed consent, and the study was certified for ethical compliance by the McGill University Research Ethics Board.
A questionnaire was administered to assess musical preferences and training. Musicians and nonmusicians reported listening to an average of 21 and 16 hr of music each week, respectively, and all but two participants self-identified as music lovers. The musicians practised their primary instruments for an average of 20 hr each week and had been playing their primary instruments for an average of 6 years. All of the participants reported normal hearing, which was confirmed with a standard audiogram administered before the experiment (ISO 389-8, 2004; Martin & Champlin, 2000).
Materials
The stimuli consisted of 40 excerpts selected from Mozart’s keyboard sonatas containing an equal number for each cadence category (eight each; see Supplemental Appendix A). To examine expectations both before and after the terminal harmonic and melodic events of the excerpt, two versions of each excerpt were created: a truncated version that omits the terminal target melodic tone and chord, and a nontruncated version that includes the target melodic tone and chord. Because these excerpts only present expected phrase endings, it was assumed that the selected stimuli would not represent the full range of the expectancy strength and specificity scales, as passages selected from the beginning or middle of a musical phrase could potentially generate weaker expectations (Escoffier & Tillmann, 2008; Pearce, Müllensiefen, & Wiggins, 2010; Tillmann & Marmel, 2013). So as not to bias ratings of expectation towards one end of the expectancy scales, eight foil stimuli that terminate in the middle of a musical phrase were also selected from Mozart’s keyboard sonatas, thus encouraging listeners to use the lower end of the scale.
Following the experimental design employed in Sears et al. (2014), performance features (such as dynamics and rubato) were neutralised and the tempo of each stimulus was determined by convention. The duration of the truncated excerpts ranged from 5 to 15 s (M = 8.49, SD = 2.61). To ensure that unwanted differences concerning the terminal harmonic and melodic events would not affect expectancy ratings while preserving the stylistic integrity of each excerpt, the durations of the target melodic tone and chord were recomposed to 900 ms and any melodic dissonances (such as a melodic suspension or appoggiatura) were removed. These steps ensured an optimal balance between ecological validity on one hand and stimulus control on the other (Sears, 2015). Each stimulus was first created with the notation software Sibelius (Avid Technologies, Burlington, MA, USA) and then realised as a .wav sound file at a sampling rate of 44.1 kHz and 16-bit amplitude resolution using a piano physical model created by PianoTeq (Modartt S.A.S., Ramonville Saint Agne, France).
Design and procedure
Participants were presented with a randomised set of 40 stimuli and eight interspersed foils. After listening to the truncated version of each stimulus, participants rated the strength of their expectation that the music would continue (Expectancy Strength) and the specificity of their expectation for a musical continuation (Expectancy Specificity) on continuous analogue scales that were subdivided into seven discrete categories labelled from 1 to 7 (called analogical–categorical scales; Weber, 1991). For the expectancy strength scale, participants were instructed that a value of 1 indicates that they had no expectations that the music would continue, whereas a value of 7 indicates that they had very strong expectations that the music would continue. On the expectancy specificity scale, a value of 1 indicates that they had no specific idea how the music would continue, whereas a value of 7 indicates that they had a very specific idea how the music would continue. In addition to their expectancy ratings, participants also responded to the statement, “Following this excerpt, the end of the passage is imminent,” on a 4-point Likert-type scale labelled from strongly agree to strongly disagree. Next, participants listened to the nontruncated version of the same stimulus and rated on a 7-point analogical–categorical scale how well the target melodic tone and chord fit with the expectations they had formed when they heard the truncated version, with a rating of 1 indicating that the musical continuation fit very poorly, and a rating of 7 indicating that it fit very well. For every trial, the scales appeared on the screen from top to bottom in the following order: strength, specificity, imminence, and fit. To familiarise the participants with the range of stimuli and the experimental task, the session began with an exposure phase and a practice phase consisting of 12 additional stimuli. After completing the experiment, participants filled out a short questionnaire addressing their music background.
Analysis
Data were analysed with a linear mixed effects model (LMM) approach (West, Welch, & Galecki, 2007), an alternative to conventional regression models (multiple linear regression [MLR], analysis of variance [ANOVA], etc.), that allows the researcher to control for random sources of variance without the loss of statistical power resulting from data aggregation across subjects or stimuli, which is a frequent preliminary step in repeated-measures designs (e.g., F1 and F2 ANOVAs, RM-ANOVA). As suggested by Baayen, Davidson, and Bates (2008), we included crossed random effects for participants and items (musical excerpts). All mixed effects analyses were conducted with the software R (2.15) using the packages lme4 (Bates, Maechler, & Bolker, 2011) and languageR (Baayen, 2012). Following Barr, Levy, Scheepers, and Tily (2013), all models included a full random effects structure as specified by the design of the experiment, with intercepts for each participant and by-participant slopes for the within-subject fixed factor of cadence category (PAC, IAC, HC, DC, and EV), and with intercepts for each musical stimulus and by-stimulus slopes for the between-subjects factor of musical training (musicians, nonmusicians). 3 To examine more specific hypotheses about the potential differences between cadence categories, we also included two planned comparisons using the lsmeans package (Lenth, 2014), corrected with Bonferroni adjustment: the first to examine the predicted linear or quadratic trends for each rating scale using a polynomial contrast (Polynomial), and the second to determine whether authentic cadences elicit significantly higher expectancy fit ratings relative to cadential deviations (Authentic vs. Deviations), as was demonstrated in Sears et al. (2014). Finally, to visualise the effects of the included fixed factors on participant ratings after controlling for the random variance in the dataset, the figures present the estimated means and standard errors determined by the model.
Results
Figure 3 displays line plots of the estimated mean expectation strength, specificity, and fit ratings of musicians and nonmusicians for each cadence category. Excerpts from the foil condition have also been plotted for comparison, but only responses to the cadence categories are presented in the analyses that follow, resulting in a preliminary dataset of 1,600 trials (40 stimuli × 40 participants). Results are reported for expectation strength, expectation specificity, and phrase completion for the truncated stimuli and then expectation fit for the nontruncated stimuli.
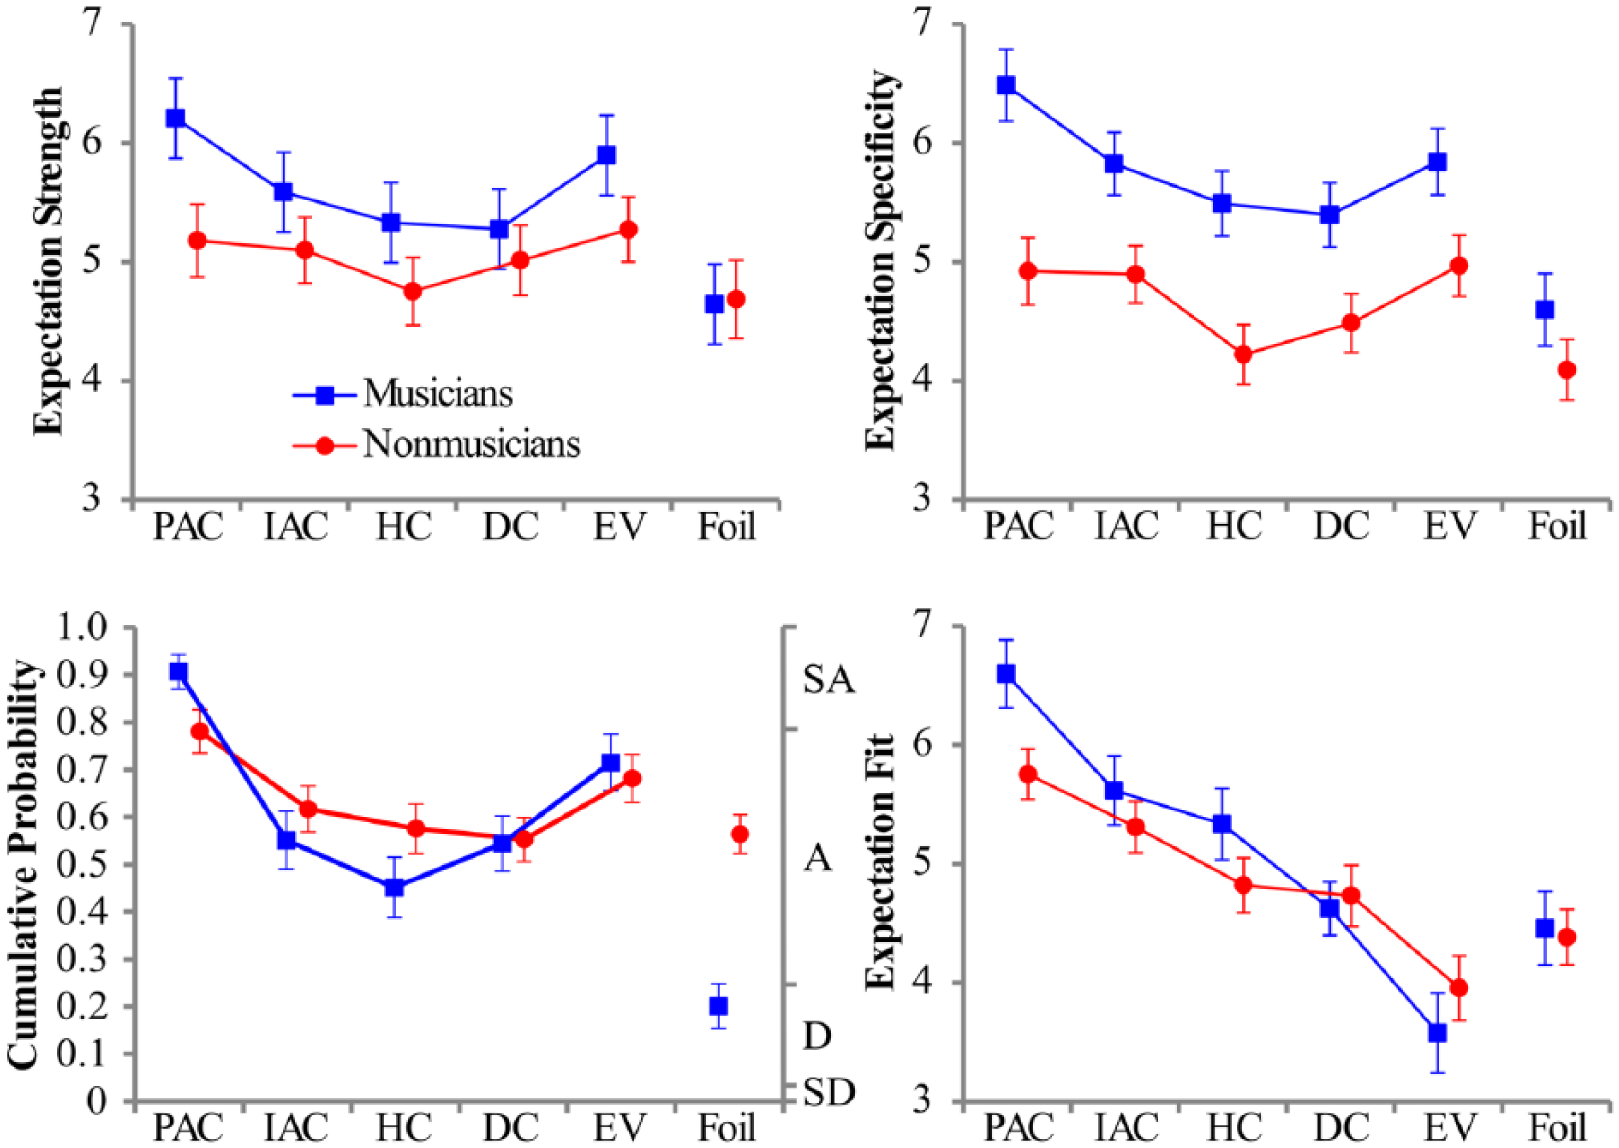
Line plots of the estimated mean expectation strength, specificity, Likert-type-scale, and fit ratings of musicians (in blue online) and nonmusicians (in red online) for each cadence category and the foil category.
Shown in Table 1, Type III Wald F tests of a mixed 5 × 2 LMM of the expectation strength ratings with Kenward–Roger approximation for the denominator degrees of freedom revealed a significant effect of cadence category (Halekoh & Højsgaard, 2014). Because the authentic cadences (PAC, IAC) and the cadential deviations (DC, EV) only differ in their terminal harmonic and melodic events, it was predicted that the truncated stimuli from the HC category would receive the lowest expectancy strength ratings. As expected, a polynomial contrast of the cadence categories revealed a significant quadratic trend from the PAC to EV categories, B = 1.99, t = 3.37, p < .001, with the estimated means exhibiting a U shape from the outer cadence categories (PAC and EV) to the inner category (HC), and with the HC category receiving the lowest strength ratings overall (M = 5.04, SE = 0.21). The model estimates also suggested a main effect of training on expectation strength, with nonmusicians providing lower ratings than musicians overall, but this effect was not significant, and there was no interaction between the two factors.
Analysis of deviance table for maximal linear mixed effects models predicting ratings of expectation strength, specificity, and fit.
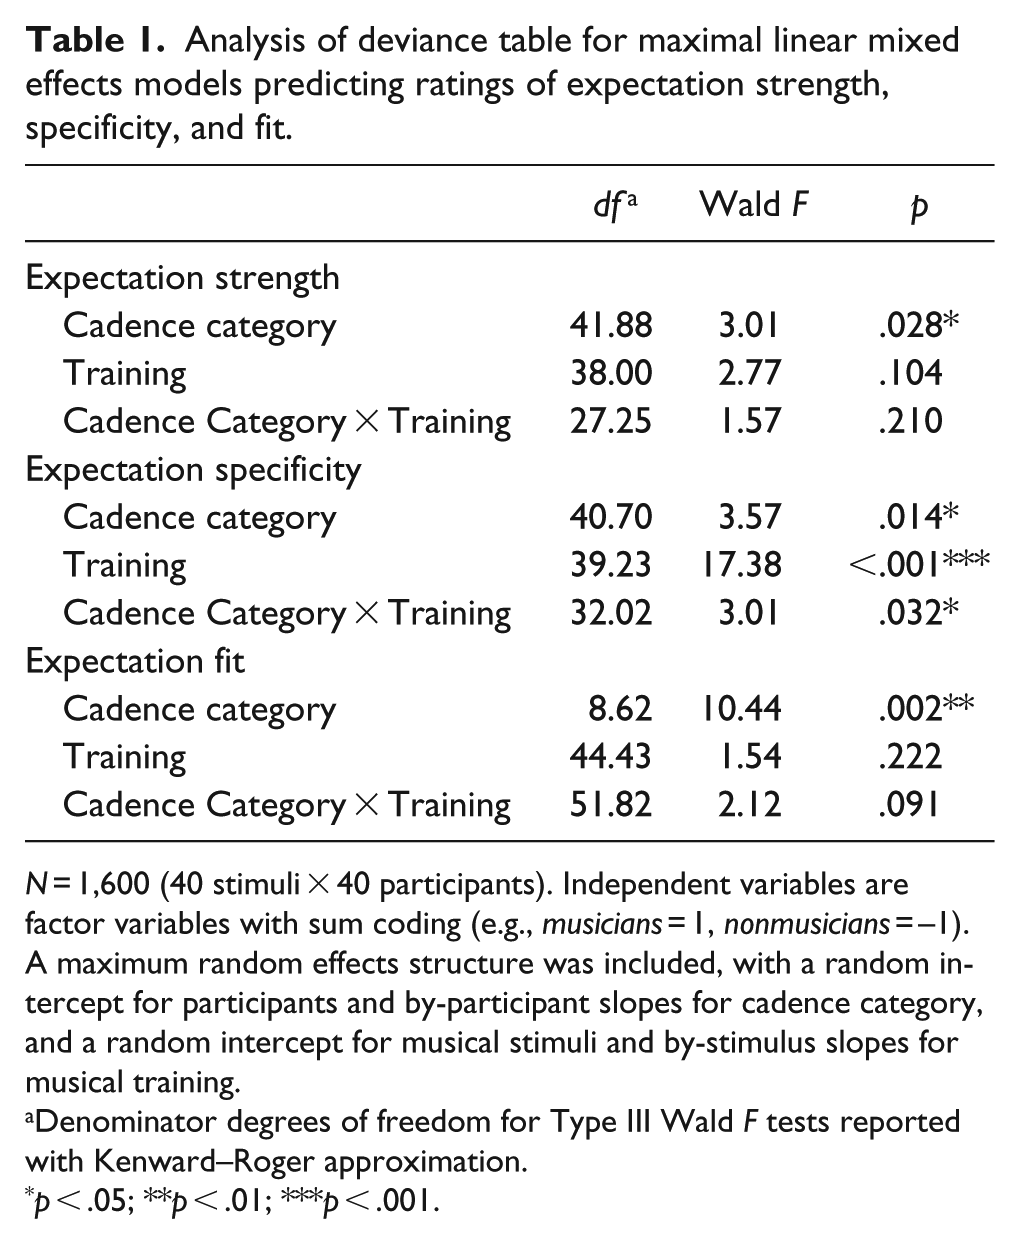
N = 1,600 (40 stimuli × 40 participants). Independent variables are factor variables with sum coding (e.g., musicians = 1, nonmusicians = −1). A maximum random effects structure was included, with a random intercept for participants and by-participant slopes for cadence category, and a random intercept for musical stimuli and by-stimulus slopes for musical training.
Denominator degrees of freedom for Type III Wald F tests reported with Kenward–Roger approximation.
p < .05; **p < .01; ***p < .001.
The expectation strength and specificity ratings averaged across participants for each stimulus were highly correlated, r(38) = .85, p < .001, as was found in Schmuckler (1989). Type III Wald F tests revealed main effects of cadence category and training, as well as a significant interaction (see Table 1). The PAC and HC categories received the highest and lowest specificity ratings, respectively, and polynomial contrasts revealed the same U-shaped quadratic trend in the ratings for both groups (musicians, B = 2.45, t = 2.65, p = .021; nonmusicians, B = 2.02, t = 2.43, p = .036). Musicians also provided significantly higher specificity ratings than nonmusicians.
The 4-point Likert-type-scale ratings for the statement, “following this excerpt the end of the passage is imminent,” provided similar results to those observed for the analogical–categorical scales of expectation strength and specificity (see Figure 3). Given the ordinal nature of the dependent variable, the ratings were entered into a proportional-odds mixed effects model (Christensen, 2015). To examine main effects and interactions, a likelihood ratio test was calculated for each fixed effect that compares the full fixed (and random) effects model with a reduced model that only excludes the effect of interest (West et al., 2007). Model comparisons revealed a significant effect of cadence category, χ2(8) = 38.77, p < .001, and training, χ2(5) = 11.29, p = .046, and there was a significant interaction, χ2(4) = 11.29, p = .023. The PAC and HC categories again received the highest and lowest ratings, respectively, and a quadratic trend was observed in the ratings of both musicians, B = 10.52, z = 5.66, p < .001, and nonmusicians, B = 4.96, z = 3.36, p < .001. However, nonmusicians also demonstrated a bias to agree or strongly agree throughout the experimental session, as indicated by the higher average ratings even for the foil stimuli, which ended in the middle of a musical phrase.
Shown in Table 1, a mixed 5 × 2 LMM of the expectation fit ratings for the nontruncated stimuli revealed a significant effect of cadence category, but musical training and the interaction were not significant. As expected, the authentic cadence categories (PAC, IAC) received significantly higher fit ratings than the cadential deviations (DC, EV) for both groups (musicians, Mdiff = −2.00, t = 6.08, p < .001; nonmusicians, Mdiff = −1.18, t = 4.51, p = .008). What is more, polynomial contrasts revealed a significant decreasing linear trend from the PAC to the EV categories for the fit ratings of both musicians, B = −7.03, t = −6.84, p < .001, and nonmusicians, B = −4.16, t = −5.03, p < .008, a finding that replicates the ordering of cadence categories observed in previous studies (Sears et al., 2014; Sears, Pearce, Caplin, & McAdams, 2018).
Discussion
As expected, ratings of expectation strength, specificity, and phrase completion exhibited a U-shaped pattern across the selected cadence categories, with the PAC and HC categories receiving the highest and lowest ratings, respectively. These findings from real musical examples support the view that tonic harmony elicits stronger and more specific expectations for its occurrence than does dominant harmony within the tonal system (Bharucha & Krumhansl, 1983; Sears, Spitzer, Caplin, & McAdams, 2018), and so appears at the top of the harmonic hierarchy (Krumhansl et al., 1982). When the stimuli included the terminal, target melodic and harmonic events in the nontruncated condition, however, ratings of expectation fit demonstrated the same descending linear trend observed in other experiments, with the HC category positioned not at the bottom of expectancy fit scale, but somewhere in the middle (Sears, 2016; Sears et al., 2014; Sears et al., 2018). Taken together, these two findings suggest that the HC serves as the weakest category in prospect as a result of the relatively weak and unspecific expectations it affords, yet finds itself near the middle of the expectancy fit scale in retrospect by virtue of the fulfilment of those expectations, however weakly formed (Burstein, 2014). Finally, the cadential deviations received the lowest average fit ratings for both groups, suggesting that they violated listener expectations, and so appear at the bottom of the harmonic hierarchy.
Experiment 2
Method
Participants
Just as in Experiment 1, participants were 40 nonpianists (20 female) recruited using the same services, 20 of whom were musicians. Ages ranged from 18 to 35 (M = 23, SD = 4). Musicians and nonmusicians reported listening to an average of 17 and 14 hr of music each week, respectively, and all but four of them self-identified as music lovers. The musicians practised their primary instruments for an average of 19 hr each week and had been playing their primary instruments for an average of 12 years. All of the participants reported normal hearing. Four of the participants from Experiment 1 also participated in Experiment 2. The mean accuracies and response times across all stimuli for these participants did not significantly differ from those of the remaining participants, however, and Experiment 2 was conducted six months after Experiment 1, so we elected to include their data.
Materials
The stimuli were the same as those employed in Experiment 1, but all foil and truncated stimuli were omitted, resulting in a set of 40 stimuli. To create the intonation task for Experiment 2, the terminal, target melodic and harmonic events in each stimulus were presented both in tune and out of tune (i.e., the final melodic tone and chord were tuned 40 cents sharp relative to the preceding musical context), resulting in 40 in-tune and 40 out-of-tune (foil) trials for the session.
Design and procedure
The experimental session was divided into two phases. In the first training phase, participants were presented with a randomised set of 20 additional stimuli selected from Mozart’s keyboard sonatas and containing an equal number from each cadence category. Given that the temporal duration from the beginning of the trial to the target melodic tone and chord varied for each stimulus (see Supplemental Appendix A), it was necessary to provide a visual cue to alert the participants to the onset of the target (Pearce, Müllensiefen, & Wiggins, 2010; Tillmann & Marmel, 2013). Shown in Figure 4, in each trial a yellow diamond playback cursor was provided at the top of the screen that moved from left to right along a playback bar, and a black vertical line was placed near the end of the playback bar with a black circle directly above it to mark the onset of the terminal target melodic tone and chord. When the playback cursor reached the black line, the circle turned green, at which point participants were instructed to judge as quickly and accurately as possible whether the chord marked by the black line was in or out of tune by pressing one of two buttons on the keyboard, labelled “in” and “out,” respectively. Following the completion of each trial in the training phase, visual feedback was provided on the screen to indicate whether the response was correct or incorrect. In the second experimental phase, participants performed the in-tune/out-of-tune judgement without feedback, and the 80 trials were randomised such that the target and foil conditions of each stimulus were not presented within five experimental trials of each other. After completing the experiment, participants filled out a short questionnaire addressing their music background.
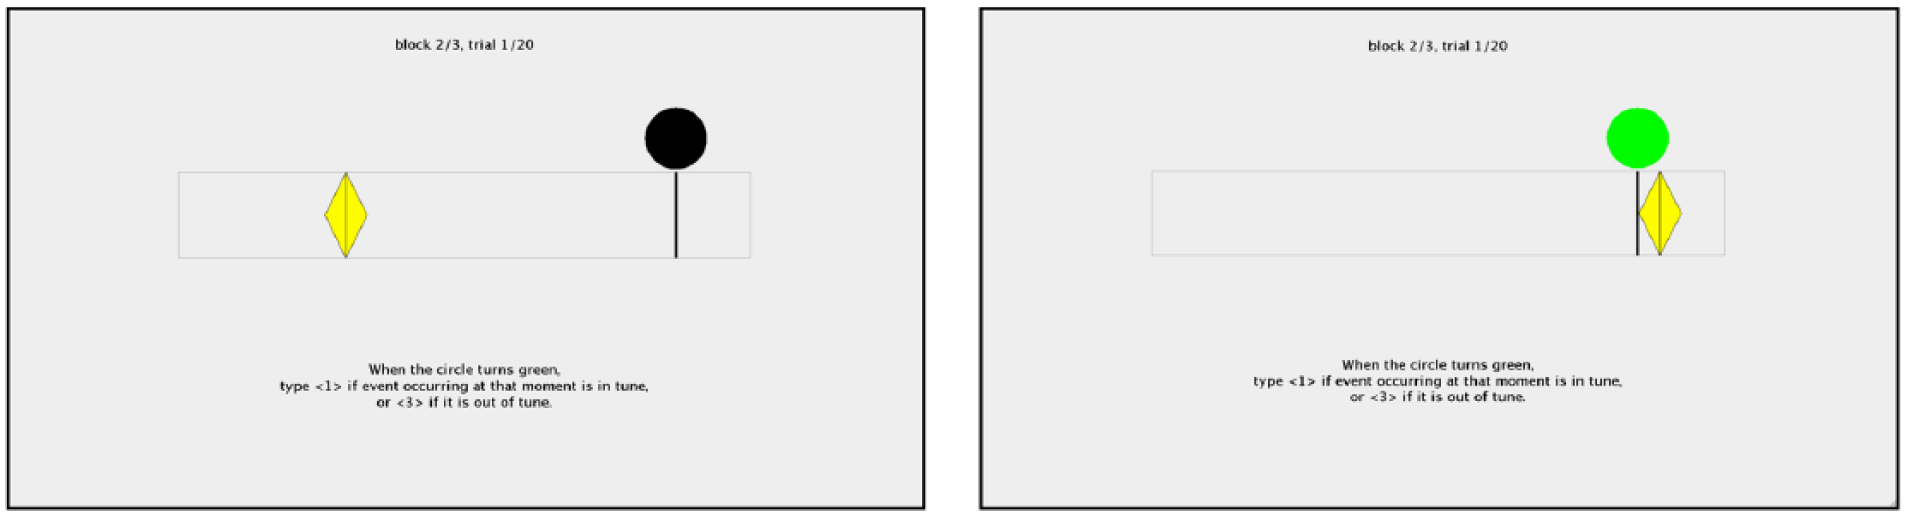
The display used to present the stimuli and collect behavioural responses in Experiment 2.
Analysis
As suggested by Jaeger (2008) and Quené and van den Bergh (2008), response accuracies were analysed with mixed effects logistic regression models (generalized linear mixed effects models [GLMMs]), with the accuracy of the response as a binomial dependent variable. To estimate a linear regression model on proportion data, GLMMs transform proportions onto an unbounded log-odds scale, so all estimates in the following analyses are reported on the log-odds scale. For transparency, however, the plotted GLMM estimates were back-transformed onto a probability scale (0-1). Correct RTs were analysed with LMMs.
Results
Bigand et al. (2003) and Tillmann and Marmel (2013) excluded out-of-tune foils from the analysis under the assumption that they do not constitute lawful musical events. However, we first examine the impact of the intonation task on accuracies and response times before considering the effect of the cadence categories for the in-tune trials. Responses preceding the onset of the target melodic tone and chord were deemed too early (RT < 0 ms) and were excluded from the analysis (13 trials or .8%). Moreover, because RT data typically feature long-tailed distributions that violate assumptions of normality and homogeneity of variance in repeated-measures designs, Ratcliff (1993) recommends eliminating the top 5% of the RTs in the long tail (i.e., the slowest, outlier responses across participants and experimental conditions). This procedure excluded an additional 67 trials from the analysis (RT range: 4-1,000 ms).
Figure 5 displays line plots of the estimated mean accuracies and correct RTs of musicians and nonmusicians for the in-tune and out-of-tune trials. For response accuracies, a mixed 2 × 2 LMM for the factors of intonation (in tune, out of tune) and musical training (musicians, nonmusicians) revealed a significant effect of training, χ2(1) = 31.90, p < .001, with the responses of musicians generally at ceiling across the experiment. The effect of intonation and the interaction between training and intonation were not significant, however. As expected, Type III Wald F tests for the correct RTs also did not reveal significant effects of intonation or training, or an interaction between the two.
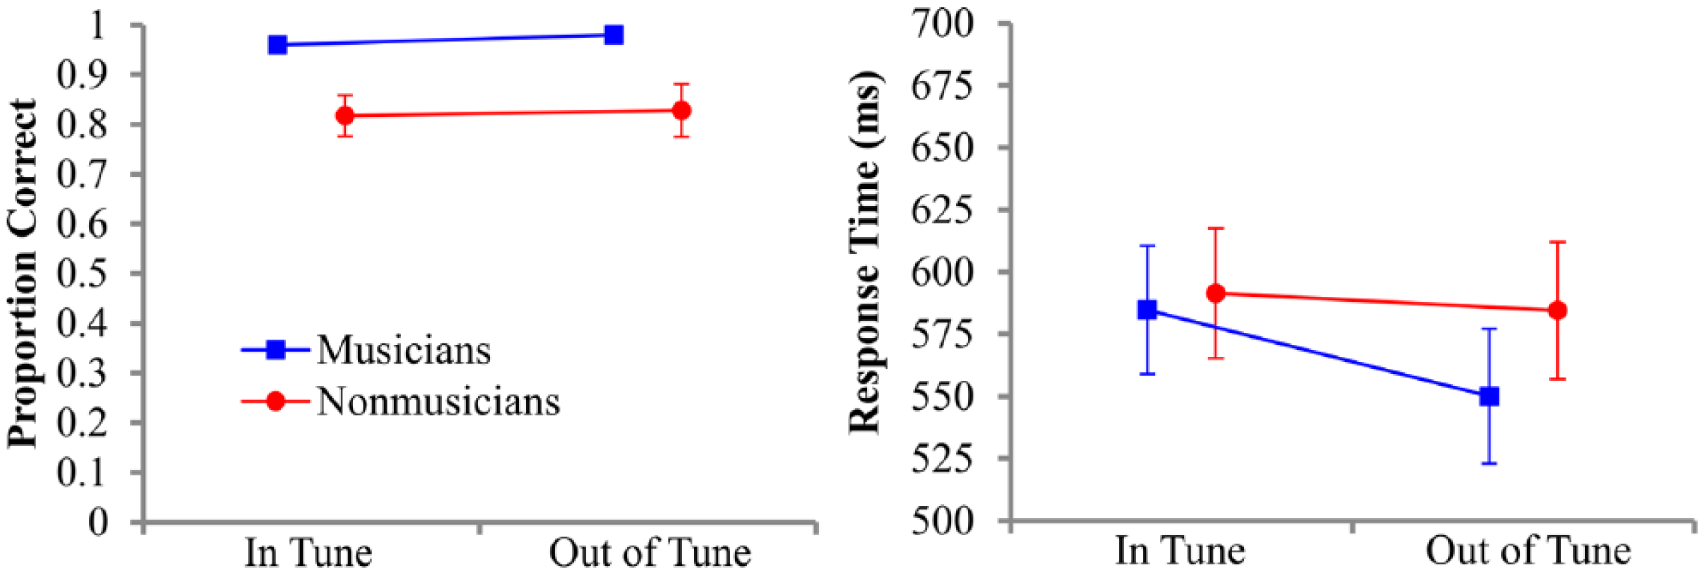
Line plots of the estimated mean proportion correct and correct response times of musicians (in blue online) and nonmusicians (in red online) for in-tune and out-of-tune trials.
To examine the effect of the cadence categories, the following analysis omits the out-of-tune foil trials following Bigand et al. (2003). For response accuracies, Type III Wald chi-square tests revealed significant main effects of cadence category, χ2(4) = 14.78, p = .005, and training, χ2(1) = 21.15, p < .001, and a significant interaction, χ2(4) = 12.93, p = .012. Shown in Figure 6, the planned comparison between the authentic cadence categories (PAC, IAC) and the cadential deviations (DC, EV) revealed that for the nonmusician group, the estimated odds of correctly identifying the intonation of the target melodic tone and chord were higher for authentic cadences than for cadential deviations, B = 2.76, z = 5.03, p < .001. The same trend emerged for the musician group, but the effect was not significant, B = 0.42, z = 0.64, p > .05. Polynomial contrasts also revealed a significant decreasing linear trend from the PAC to EV categories for the nonmusician group, B = −9.40, z = −5.32, p < .001, but not for the musician group, B = −1.39, z = −0.67, p > .05.
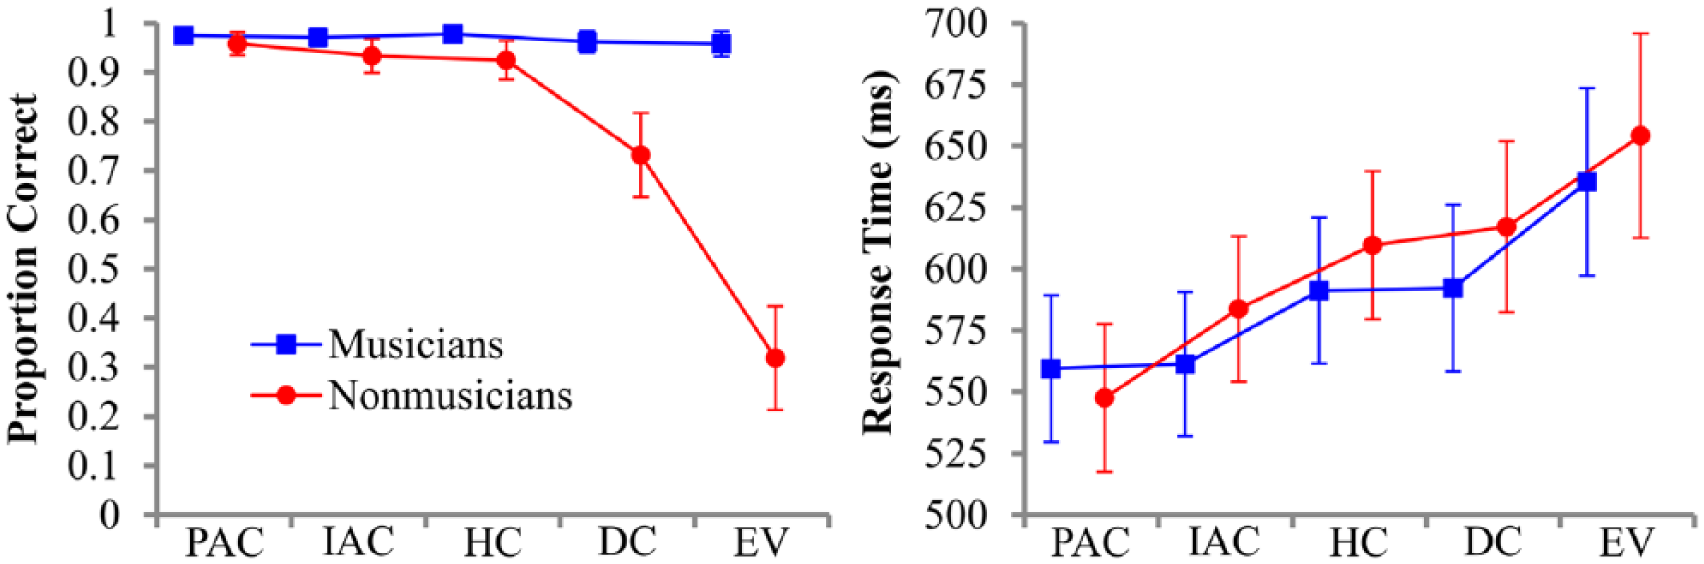
Line plots of the estimated mean proportion correct and correct response times of musicians (in blue online) and nonmusicians (in red online) for each cadence category.
Type III Wald F tests of the fixed effects from the 5 × 2 LMM of the correct RTs revealed a significant effect of cadence category, F(4, 40.79) = 3.19, p = .023, but the main effect of training and the interaction were not significant. The planned comparisons revealed that nonmusicians responded more quickly to the terminal melodic tone and chord from the authentic cadence categories relative to the cadential deviations, Mdiff = −70.02 ms, t = −2.92, p = .018. The same trend emerged for musicians, but the effect was marginal, Mdiff = −53.38 ms, t = −2.45, p = .069. However, polynomial contrasts revealed a significant increasing linear trend in RTs for both groups (musicians, B = 182.67, df = 70.06, t = 2.61, p = .046; nonmusicians, B = 246.65, df = 73.52, t = 3.13, p = .010), which again corresponds to the ordering of cadence categories observed in Experiment 1 and in previous studies (Sears et al., 2014; Sears et al., 2018).
Discussion
Participants were faster and more accurate for the terminal melodic and harmonic events from the authentic cadence categories (PAC, IAC) compared with the cadential deviations (DC, EV). These effects were weaker (or nonsignificant) for the musician group, however. This finding suggests either that musicians remained unaffected by the relatedness of the target melodic tone and chord to the preceding context—a hypothesis that contradicts the findings from Experiment 1—or that the simplicity of the secondary task for the selected foil condition may have influenced the magnitude of the observed priming effect. Nevertheless, the correct RTs from both groups demonstrated a significant increasing linear trend from the PAC to the EV categories, thereby replicating the expectancy fit ratings from Experiment 1. For the HC category, participant responses again appeared somewhere in the middle compared with the other categories, indicating a processing benefit relative to the cadential deviations but a processing cost relative to the authentic cadence categories.
Simulations
The purpose of the simulations is to determine whether the priming effects observed in Experiments 1 and 2 result from sensory processes accumulated over the duration of the EM model, from top-down, cognitive processes reflecting implicit exposure over the course of many years (the IDyOM model), or from some combination of these two processes (the TS model).
EM
Leman’s (2000) model of echoic memory (EM) attempted to account for Krumhansl and Kessler’s (1982) tonal probe-tone judgements by comparing the immediate pitch percept with the integrated pitch image computed over the window of echoic memory (Krumhansl, 1990). The EM model determines the similarity (or tonal contextuality) between an immediate auditory image of the target tone and/or chord (the local pitch image, or LPI) with a more global auditory image of the preceding context integrated over the duration of EM (the global pitch image, or GPI) using the Pearson correlation coefficient r. According to Bigand et al. (2014), the tonal contextuality index therefore represents the tension of the LPI with respect to the GPI, with high values indicating high correlations, and thus low levels of tension (see Supplemental Appendix B for further details).
TS
Unlike the EM model, the TS model assumes that tonal contexts are maintained in regions of the brain mediating interactions between sensory, cognitive, and affective information (Janata et al., 2002, p. 2169). Thus, the TS model was designed to account for both sensory and cognitive priming effects by projecting the output pitch images from the EM model to the surface of a torus using a self-organising map (SOM) algorithm (Kohonen, 1995). The authors trained the SOM using the pitch images from the EM model integrated with a 2-s time constant that were extracted from a melody that was explicitly composed to modulate through all 24 major and minor keys over the course of approximately 8 min (Collins et al., 2014, p. 42). Like the EM model, Janata et al. (2002) also integrate the activation patterns over time to incorporate the effects of EM. Thus, at any point during the stimulus input, the relative activations across the map that have been accumulated over EM represent the effects of long-term schematic knowledge on the tonal expectancies of listeners.
IDyOM
Although the TS model simulates the influence of schematic knowledge on tonal expectancies, it fails to consider whether an SOM can account for tonal priming effects in isolation. Furthermore, SOMs have been criticised in recent years because they generally do not represent the contextual relations between contiguous events on the musical surface (Collins et al., 2014). In this regard, the IDyOM model offers a suitable alternative, because it explicitly simulates long-term statistical learning of sequential dependencies between events in tonal music (Pearce, 2005). In short, IDyOM is a finite-context (or n-gram) modelling framework that predicts the next melodic tone or chord in a musical stimulus by acquiring knowledge through unsupervised statistical learning.
Method
Each model simulation predicted the target melodic tone and chord given the preceding context (i.e., the truncated condition) for each stimulus. For the EM and TS models, the LPI was set to 0.1 s to represent the immediate pitch percept (Leman, 2000), and the GPI was set to 4 s to correspond with previously published evidence for the duration of EM (Darwin & Turvey, 1972). Following Collins et al. (2014), for each stimulus from Experiment 2, we computed the correlation between the LPI and GPI as a continuous time series at a sampling rate of 26 Hz for both models. To obtain a single estimate for each stimulus comparing the target melodic tone and chord with the preceding context, the correlation time series for the EM and TS models were averaged over the time window corresponding to the duration of the target events.
For IDyOM, providing a suitable training corpus of Mozart’s keyboard sonatas was beyond the scope of the present study, so the model was trained to predict the target melodic tone and chord in each stimulus using a corpus of 50 movements from Haydn’s string quartets (Sears et al., 2018). In doing so, our assumption is that the sequential dependencies between melodic or harmonic events in a corpus of string quartets will roughly correspond to those found in Mozart’s keyboard sonatas. Following Sears et al. (2018), we included a melodic model that estimates the target note event from the upper-voice melody in each stimulus (melody), a harmonic model that estimates the target chord event (harmony), and a composite model that combines the predictions from the melodic and harmonic models into a single probability estimate (composite), thereby representing pitch-based expectations more generally (see Supplemental Appendix B).
Results
To examine the effect of the cadence categories individually, one-way ANOVAs were specified for each model simulation. However, Levene’s test revealed heteroscedastic groups for two of the three models, so we report Welch’s F test and estimate effect size using estimated ω2 (Cohen, 2008). Finally, to address whether the estimates from the model simulations correspond with the linear increase demonstrated in the fit ratings (Experiment 1) and correct RTs (Experiment 2), a polynomial contrast was also included that estimates the goodness-of-fit of the predicted trend without assuming equal variances.
Figure 7 presents line plots of the simulation estimates for the EM and TS models for each cadence category. The y-axis is inverted so that decreasing correlation estimates correspond to increasing RTs. A one-way ANOVA for the correlation estimates did not reveal a significant effect of cadence category for the EM model, F(4, 17.24) = 1.98, p = .142, estimated ω2 = .09, and the polynomial contrast did not exhibit the linear trend that was observed in the fit ratings and RTs, B = −0.10, df = 15.33, t = −0.90, p = .381. For the TS model, however, the mean correlation estimates demonstrated a marginal effect of cadence category, F(4, 15.61) = 3.02, p = .050, estimated ω2 = .17, but with excerpts from the HC category receiving the lowest estimates on average, M = 0.61, SE = 0.12. As a consequence, the polynomial contrast was not significant, B = −0.35, df = 8.43, t = −1.90, p = .093.
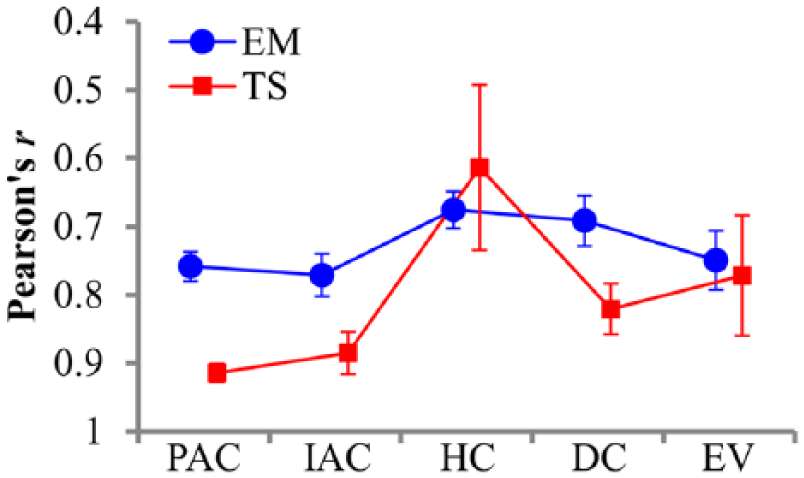
Line plots of the correlation estimates from the EM (in blue online) and TS (in red online) models for each cadence category.
Figure 8 presents line plots of the information content (IC) estimates from IDyOM for each cadence category. Probability estimates can become vanishingly small in n-gram models, so we report the IC estimates (Cleary & Witten, 1984). Given the probability of event ei, IC is 1/p(ei), and so represents the degree of contextual unexpectedness or surprise associated with ei.
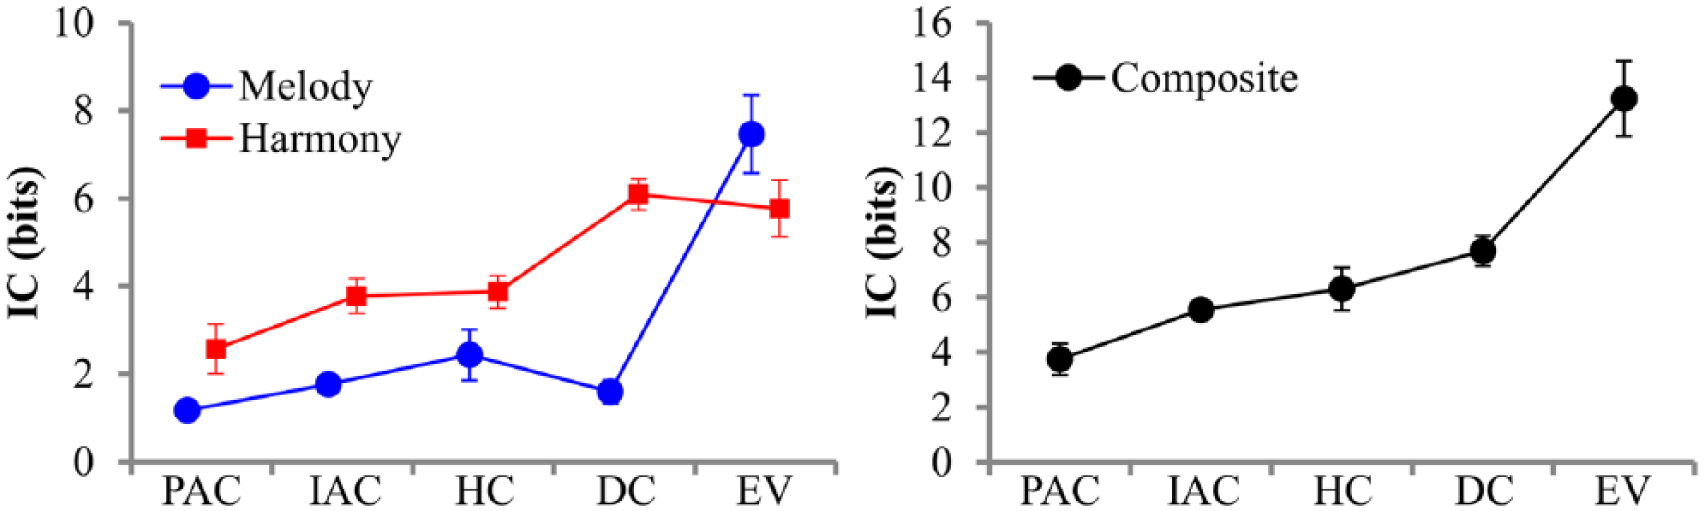
Line plots of the information content estimates from IDyOM for each cadence category.
The simulation estimates from IDyOM revealed a significant main effect of cadence category for all three viewpoint models: melody, F(4, 14.05) = 14.87, p < .001, estimated ω2 = .57; harmony, F(4, 17.31) = 9.41, p < .001, estimated ω2 = .46; and composite, F(4, 16.87) = 12.28, p < .001, estimated ω2 = .53. The polynomial contrast also exhibited a significant increasing linear trend from the PAC to the EV categories for each model (melody, B = 12.39, df = 7.53, t = 6.85, p < .001; harmony, B = 8.71, df = 16.31, t = 4.84, p < .001; composite, B = 21.11, df = 10.28, t = 6.96, p < .001). Thus, the cadence categories whose terminal melodic and harmonic events elicited lower fit ratings and slower responses times were also less predictable on average.
To examine the strength of this covariation, Table 2 presents the intercorrelations between the model simulations and the mean fit ratings and RTs collected in Experiments 1 and 2, respectively. For the model simulations, the EM and TS models did not produce significant correlations with any of the participant responses. Conversely, IDyOM featured moderate-to-strong correlations with nearly every response variable (r range = .34-.79). In each case, participants were faster and provided higher fit ratings for target events that received lower IC estimates by IDyOM, with the composite model receiving the highest correlations compared with the other model simulations.
Intercorrelations between the model simulations and the fit ratings (Experiment 1) and correct RTs (Experiment 2) of musicians and nonmusicians.
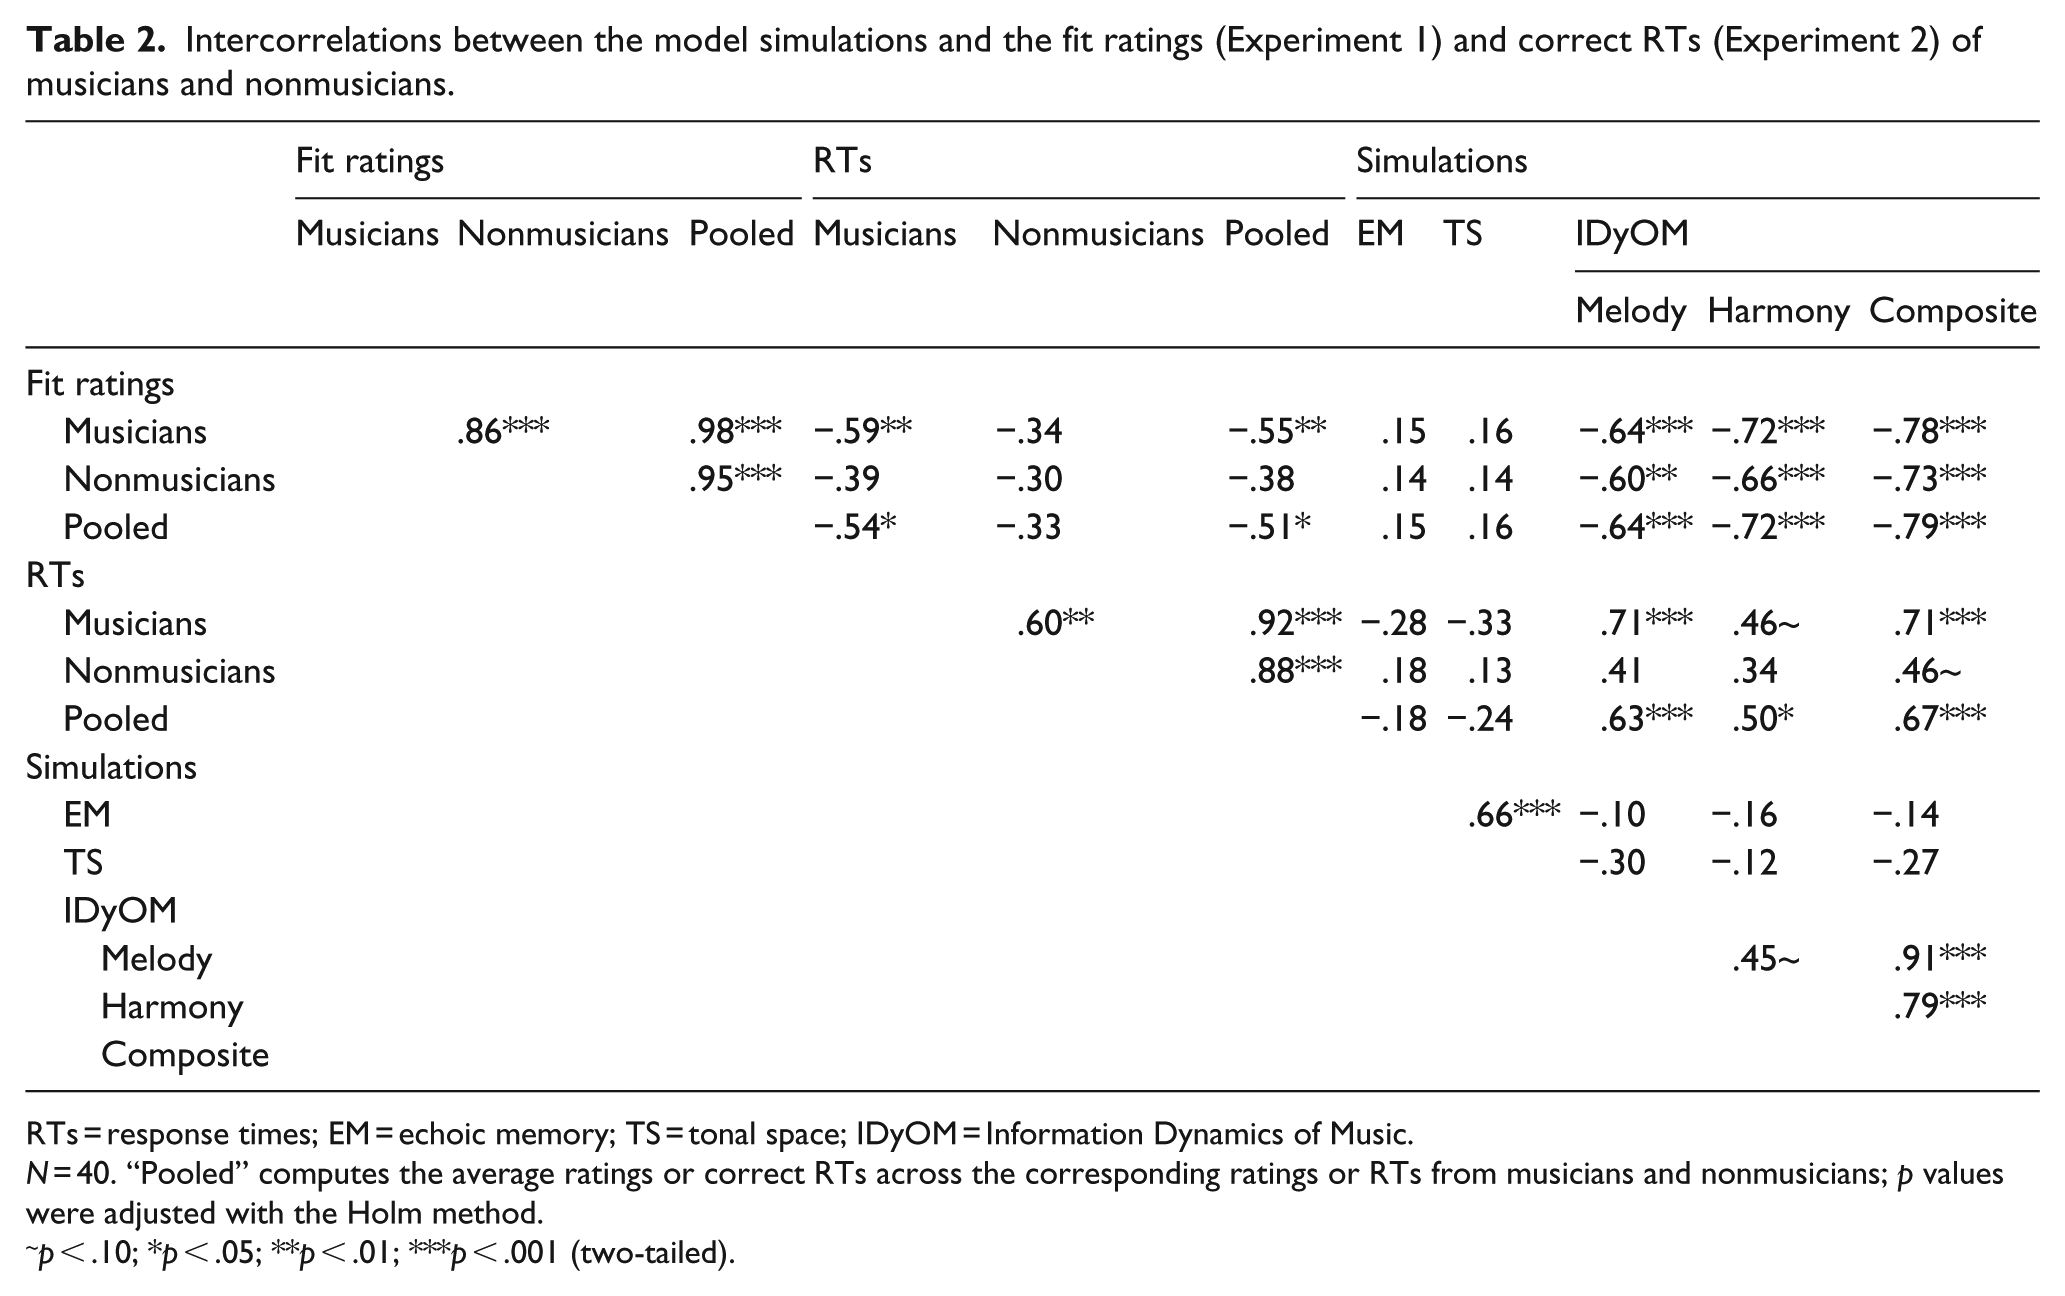
RTs = response times; EM = echoic memory; TS = tonal space; IDyOM = Information Dynamics of Music.
N = 40. “Pooled” computes the average ratings or correct RTs across the corresponding ratings or RTs from musicians and nonmusicians; p values were adjusted with the Holm method.
p < .10; *p < .05; **p < .01; ***p < .001 (two-tailed).
Discussion
Of the model simulations examined here, IDyOM provided the best fit with the experimental data from Experiments 1 and 2, with the EM and TS models generally producing null results. What is more, the IC estimates shown in Figure 7 correspond very closely with the IC estimates calculated for the cadences from a much larger dataset of Haydn’s string quartets (Sears et al., 2018), suggesting that these findings may generalise to other classical composers and genres that feature similar melodic and harmonic organisational principles. In the melodic viewpoint model, the PAC, IAC, HC, and DC categories received much lower IC estimates on average than the EV category, presumably because the former categories conclude with stepwise motion into a stable scale degree in the melody (e.g., 1ˆ or 3ˆ), whereas the latter category typically features an unexpected leap. In the harmonic viewpoint model, the DC and EV categories—which conclude with unexpected terminal chords—received higher IC estimates than the remaining categories, resulting in the same linear trend that was previously observed in the average fit ratings and RTs. Finally, estimates from the composite viewpoint produced the strongest correlations with the behavioural responses from both experiments and from both training groups.
General discussion
The goal of this study was to explore the underlying mechanisms responsible for the formation of tonal expectations during music listening using examples of expectancy fulfilment (PAC, IAC, HC) and violation (DC, EV) derived from real music. Previous studies have typically employed specially composed (or selected) isochronous chord sequences terminating with an authentic (V–I) cadence in the expected condition and then simply recomposed the target (or context) events in the unexpected condition(s). We adopted an alternative approach by selecting genuine musical stimuli that terminate with one of the five most common cadence categories in tonal music. In Experiment 1, participants provided the lowest strength and specificity ratings for truncated stimuli from the HC category. When the terminal events followed the preceding context in the nontruncated condition, however, the authentic cadence categories received the highest fit ratings (PAC, IAC), followed by the HC category in the centre of the expectancy fit scale, and finally the cadential deviations (DC, EV), which received the lowest fit ratings overall. The correct RTs in Experiment 2 generally replicated these findings, with stimuli terminating with an authentic cadence eliciting facilitation effects for both musicians and nonmusicians, thereby suggesting that authentic cadential contexts prime listeners to expect a tonic chord with a stable scale degree like 1ˆ or 3ˆ in the upper-voice melody. Moreover, the mean RTs across all five cadence categories demonstrated the same linear trend that was observed in Experiment 1, with the PAC, IAC, and HC categories eliciting the fastest and most accurate responses, followed by the DC and EV categories.
The cadence categories also elicited larger differences in the specificity and phrase completion ratings of musicians compared with nonmusicians in Experiment 1. In Experiment 2, however, this trend was not present, with the speed of responses showing no difference between musicians and nonmusicians, and accuracy demonstrating larger differences between cadence categories for nonmusicians than musicians. The relatively weaker effects found in Experiment 1 for the nonmusician group may have been due to the musician group’s increased familiarity either with the experimental tasks (strength, specificity, phrase completion, and fit), with technical terms relating to the experiments, or with the stimuli, which were derived from a well-known repertoire associated with the common-practice period. Bigand (2003) has championed implicit behavioural tasks like the priming paradigm for precisely these reasons.
To compare sensory or psychoacoustic explanations of tonal priming effects with cognitive accounts, we simulated the findings from both experiments using the EM (sensory) model, the TS (sensory–cognitive) model, and IDyOM (cognitive). The EM and TS models provided few notable results and generally failed to explain the pattern of results. Instead, IDyOM provided the best fit to the data, replicating the linear trend observed in the expectancy fit ratings in Experiment 1 and the RTs in Experiment 2, and demonstrating significant correlations between the experimental findings and the model predictions for the melody, the chord progression, and a composite probability estimate representing both musical parameters. These findings suggest that listeners generate expectations for potential continuations as a consequence of the frequent (co-)occurrence of events on the musical surface. However, this is not to say that sensory or psychoacoustic explanations for the priming effects observed here—or reported elsewhere—play no role in expectancy formation; only that the models representing these explanations generally fail to account for the priming effects observed in the present experiments.
Taken together, the simulations reported in this study provide evidence in support of a functional interpretation of tonal processing, in which listeners with exposure to tonal music retain long-term, schematic knowledge about the statistical dependencies between contiguous events. This knowledge allows listeners to generate expectations during music listening, with the syntactic relationships between tonal events activating schematic representations that either facilitate or inhibit the processing of continuations heard later. This is not to say that schematic knowledge is fixed across a group of listeners; the depth (or specificity) of that knowledge will vary from one person to another (Margulis, 2005). When confronted with a PAC, for example, listeners with relatively little exposure to music of the high classical period may hear a V–I chord progression, while those with a great deal of experience in the instrumental repertories of Haydn, Mozart, and Beethoven may possess a schematic representation that is nearly isomorphic with the encountered exemplar. But in our view, many of the features that characterise these cadences also characterise the tonal system in general. To be sure, even in today’s vast musical landscape, listeners with exposure to tonal music might form schematic representations for temporal patterns spanning a wide number of genres and style periods sharing similar characteristics (e.g., jazz, pop rock, classical). But no matter the manner or specificity of the representation, the important point here is that much of this knowledge lies beneath the conscious surface, reflects implicit rather than explicit learning strategies, and goes far beyond verbal description.
Supplemental Material
QJE-STD-18-028.R2-SupplementaryMaterial – Supplemental material for Expectations for tonal cadences: Sensory and cognitive priming effects
Supplemental material, QJE-STD-18-028.R2-SupplementaryMaterial for Expectations for tonal cadences: Sensory and cognitive priming effects by David RW Sears, Marcus T Pearce, Jacob Spitzer, William E Caplin and Stephen McAdams in Quarterly Journal of Experimental Psychology
Footnotes
Acknowledgements
This research was conducted at the Centre for Interdisciplinary Research in Music, Media, and Technology (CIRMMT) and the Schulich School of Music at McGill University. The authors would like to thank Bennett K Smith for the design of the interface used in this experiment and the anonymous reviewers for their insightful comments.
Declaration of conflicting interests
The author(s) declared no potential conflicts of interest with respect to the research, authorship, and/or publication of this article.
Funding
Funding was provided by a Richard H Tomlinson fellowship and a Quebec doctoral fellowship from the Programme de bourses d’excellence pour étudiants étrangers awarded to David RW Sears, a UK Engineering and Physical Sciences Research Council grant (EP/M000702/1) awarded to Marcus T Pearce, a Canadian Social Sciences and Humanities Research Council grant (410-2010-1091) and James McGill Professorship awarded to William E Caplin, and Canadian Natural Sciences and Engineering Research Council (RGPIN 2015-05280) and Social Sciences and Humanities Research Council (410-2009-2201) grants and Canada Research Chair (950-223484) awarded to Stephen McAdams.
Notes
References
Supplementary Material
Please find the following supplemental material available below.
For Open Access articles published under a Creative Commons License, all supplemental material carries the same license as the article it is associated with.
For non-Open Access articles published, all supplemental material carries a non-exclusive license, and permission requests for re-use of supplemental material or any part of supplemental material shall be sent directly to the copyright owner as specified in the copyright notice associated with the article.