
Abstract
Gaze direction is a powerful social cue, and there is considerable evidence that we preferentially direct our attentional resources to gaze-congruent locations. While a number of individual differences have been claimed to modulate gaze-cueing effects (e.g., trait anxiety), the modulation of gaze cueing for different emotional expressions of the cue has not been investigated in social anxiety, which is characterised by a range of attentional biases for stimuli perceived to be socially threatening. Therefore, in this study, we examined whether social anxiety modulates gaze-cueing effects for angry, fearful, and neutral expressions, while controlling for other individual-differences variables that may modulate gaze cueing: trait anxiety, depression, and autistic-like traits. In a sample of 100 female participants, we obtained large and reliable gaze-cueing effects; however, these effects were not modulated by social anxiety, or by any of the other individual-differences variables. These findings attest to the social importance of gaze cueing, and also call into question the replicability of individual differences in the effect.
Attention is a finite resource, and therefore must be deployed in a selective manner. To this end, humans—as highly social creatures—often rely on social cues to guide their attentional resources. One such cue is another individual’s gaze direction: Attending to where another is looking allows us to detect important events in the environment, assists us in understanding their goals and intentions (Baron-Cohen, 1995), and facilitates communication in social situations. The purpose of this study was to determine whether attention to gazed-at locations is modulated by social anxiety (SA), thus providing insight into how those with high levels of SA experience their social world. In the process of controlling for other individual-differences variables that have been found to modulate this process, we set another goal: to assess the replicability of these effects. This is important because previous studies that have demonstrated contextual modulations of gaze-following have shown poor replicability (e.g., Coy et al., 2019; McCrackin & Itier, 2019).
In the lab, gaze following is operationalised by the gaze-cueing procedure (a variant of the Posner cueing paradigm; Posner et al., 1978; for a review, see Frischen et al., 2007). 1 In a typical gaze-cueing task, a photograph or drawing of a face is presented in the centre of the screen, with the eyes averted either to the left or to the right. After a brief interval, a target appears either to the left-hand side or to the right-hand side of the stimulus, and participants must respond to this target via a keypress. It has consistently been shown that in such a task, reaction times (RTs) are faster to targets appearing at the gazed-at (or valid) location compared with the non-gazed-at (or invalid) location, even when the cue is non-predictive of the target location (e.g., Friesen & Kingstone, 1998; Langton & Bruce, 1999). This finding is thought to reflect the strong social relevance of gaze direction: Gaze conveys such meaning in everyday life that even when participants are instructed to ignore a gaze cue in the lab, attention is shifted to the gazed-at location.
Several contextual variables appear to modulate this gaze-cueing effect (GCE; see Dalmaso et al., 2020, for a recent review). One is the emotional expression of the gaze cue, with some studies finding that fearful faces increase the magnitude of the GCE relative to neutral faces (e.g., Bayless et al., 2011; Graham et al., 2010; Lassalle & Itier, 2013, 2015b; McCrackin & Itier, 2019; Putman et al., 2006), and some finding similar enhancements of the GCE for happy (e.g., McCrackin & Itier, 2018, 2019), angry (e.g., Holmes et al., 2006; Lassalle & Itier, 2013, 2015b), and surprised (e.g., Bayless et al., 2011; Lassalle & Itier, 2013, 2015b; Neath et al., 2013) expressions. These modulations are thought to result from the enhanced social relevance of averted gaze when combined with such expressions; a fearful face gazing in a particular direction, for instance, could signal the appearance of an object or event urgently requiring attention (e.g., the appearance of a snake), and therefore it is particularly beneficial for attention to be shifted to the gazed-at location (Tipples, 2006). Interestingly, however, Coy et al. (2019) recently failed to observe any modulations of the GCE by emotional expression: Across five experiments, the authors manipulated factors such as the number of emotional expressions, the number of gaze-cue identities, and participants’ country of origin, and consistently observed no interaction between cue validity and emotional expression for fearful and happy expressions. Therefore, the reliability of such effects is currently under question.
Certain individual-differences variables have also been claimed to modulate the GCE. For example, males show smaller GCEs than females (e.g., Bayliss et al., 2005; McCrackin & Itier, 2019), which may reflect their reduced sensitivity to non-verbal social stimuli relative to females (Hall, 1978). A reduced sensitivity to social information may also explain the finding that those with autism spectrum disorder, or those scoring highly on measures of autistic-like traits, exhibit a smaller GCE (e.g., Bayliss et al., 2005; Ristic et al., 2005) and reduced modulations of the GCE by the emotional expression of the cue (e.g., Lassalle & Itier, 2015a; McCrackin & Itier, 2019; Uono et al., 2009) relative to controls. Another key finding in the individual-differences domain is that higher levels of trait anxiety are associated with a greater GCE for fearful gaze cues (e.g., Putman et al., 2006; Tipples, 2006), with some authors finding that this modulation may only be present in highly trait-anxious participants (e.g., Fox et al., 2007; Holmes et al., 2006; Mathews et al., 2003). These findings are thought to reflect hypervigilance to threat in anxious participants, who may be more responsive to cues that could signal the presence of a threatening stimulus. However, the replicability of this finding has recently been called into question, with more recent studies failing to observe anxiety-related modulations of the GCE (Lassalle & Itier, 2015a; McCrackin & Itier, 2019; Neath et al., 2013).
Therefore, there appears to be some evidence that the GCE can be modulated by individual variations that reflect differences in processing social information (i.e., sex and autistic-like traits), as well as those that reflect hypervigilance to threatening stimuli (i.e., trait anxiety). Given that the magnitude of the GCE appears to depend on an individual’s relative sensitivity to both social information in general and threatening stimuli more specifically, it is possible that the effect may also vary as a function of SA. SA is characterised by a fear of situations in which one could be scrutinised by others (American Psychiatric Association, 2013), with these symptoms of fear distributed normally within the general population (Rapee & Spence, 2004). Socially anxious individuals exhibit a large degree of self-focused attention when confronted with a social context they perceive to be threatening (Clark & Wells, 1995; Rapee & Heimberg, 1997); moreover, they display characteristic processing biases in relation to socially threatening stimuli.
On the one hand, there is evidence that SA is associated with an attentional bias towards socially threatening stimuli, such as angry faces (e.g., Gilboa-Schechtman et al., 1999; Mogg et al., 2004); eye-tracking paradigms have further demonstrated that SA is associated with difficulty disengaging from these stimuli (e.g., Buckner et al., 2010; Schofield et al., 2012), and event-related potentials indicate that high-SA individuals may be particularly sensitive to averted gaze, perhaps because this could be interpreted as disinterest in the observer (Schmitz et al., 2012). On the other hand, there is also evidence that SA is associated with avoidance of socially threatening stimuli (e.g., Heuer et al., 2007; Mansell et al., 1999; Roelofs et al., 2010), including eye-tracking research which shows that socially anxious individuals avoid the eye region in faces, especially those with angry expressions (Horley et al., 2003, 2004). This avoidance may function as a “psychological escape” (p. 686) from a situation in which social interaction is a possibility (Mansell et al., 1999).
In general, socially anxious individuals may be especially sensitive to social threat, with attention biased to such signals (e.g., Gilboa-Schechtman et al., 1999; Mogg et al., 2004; Moriya & Tanno, 2011). Attention may be maintained at these signals (e.g., Buckner et al., 2010; Schofield et al., 2012), or these signals could be avoided in the service of evading social evaluation (e.g., Heuer et al., 2007; Mansell et al., 1999; Roelofs et al., 2010). With respect to gaze cueing, this leads to two main possibilities: SA may be associated with an increase in the magnitude of the GCE if the gaze cue is perceived to be socially threatening and attention is maintained on the stimulus, or a reduction in the magnitude of the GCE if the gaze cue is perceived to be socially threatening and avoidant behaviour follows.
Despite strong theoretical grounds for SA modulating the GCE, the few studies that have examined this possibility have not observed a modulation. Two studies included a measure of SA in their gaze-cueing experiments and found no variation in the magnitude of the GCE as a function of SA (Gregory & Jackson, 2017; Wei et al., 2019). However, these studies only employed gaze cues with neutral expressions; the lack of a socially threatening context could therefore explain the absence of any modulation. Recently, Gregory et al. (2019) examined overt gaze following in a low-SA group and a high-SA group. These authors found no differences between the groups in the frequency of gaze-elicited eye movements, but again, only neutral expressions were used; furthermore, it is possible that differences might only manifest in covert attentional shifts (i.e., those occurring without eye movements), given that socially anxious individuals are especially conscious of how they appear to others (Hope & Heimberg, 1988). To our knowledge, the only study to use cues with different emotional expressions in a typical gaze-cueing task was conducted by Boll et al. (2016), who, in one experiment, compared GCEs for angry, fearful, and happy expressions in participants with and without SA. However, these authors only observed the basic GCE when they restricted their analysis to fast RTs, and did not report any effects (or lack thereof) related to emotional expression within that analysis. Therefore, whether SA modulates the GCE for different emotional expressions remains an open question.
In the present study, within a large sample of 100 female participants, we examined whether SA modulates the GCE for three different emotional expressions. We employed an angry gaze cue to symbolise the type of self-relevant threat to which socially anxious participants might be especially sensitive (e.g., Mogg et al., 2004), a fearful gaze cue to represent external threat, and a neutral gaze cue as a “baseline” emotional expression. Furthermore, unlike each of the abovementioned studies that examined SA, we included measures of trait anxiety and autistic-like traits to control for other variables that could modulate the GCE (e.g., Fox et al., 2007; Ristic et al., 2005), allowing us to examine the replicability of these effects. We also included a depression scale, given the suggestion by McCrackin and Itier (2019) that depression may also modulate the GCE (note, however, that with a sample size of over 100 participants, these authors did not observe such a modulation in their own study). Finally, we included an arrow-cueing task to determine whether any modulations of gaze cueing by SA could be explained by variation in the processing of symbolic stimuli or external attentional cues more generally (see, for example, Heeren et al., 2015, who found that socially anxious participants exhibited diminished orienting in response to a peripheral attentional cue relative to controls). For both the gaze- and arrow-cueing blocks, we used a discrimination task to probe attentional orienting. While a number of previous studies (e.g., Bayless et al., 2011; Lassalle & Itier, 2013, 2015a, 2015b) used a localisation task, in which participants were required to use their left hand to respond to targets appearing on the left-hand side of the display and their right hand to respond to targets appearing on the right-hand side of the display, the use of such a task introduces the possibility that any observed cueing effects are at least partially the result of the gaze cue priming response preparation and execution, and not solely of the cue eliciting a shift of spatial attention (Simon, 1969; see Wiese et al., 2013, for a discussion of this issue in relation to gaze cueing).
If SA modulates the GCE, what might be the nature of this modulation across the different emotional expressions of the gaze cue? For the angry expression, which is likely to be perceived as socially threatening to those high in SA, we foresaw two possibilities: SA—after controlling for the other individual-differences variables—might be associated with an increase in the GCE if attention is maintained on the gaze cue due to its threat-signalling potential (e.g., Buckner et al., 2010), or a decrease in the GCE if avoidant behaviour or self-focused attention follows its presentation (e.g., Mansell et al., 1999). Given that the fearful face is more likely to be perceived as signalling a non-social, environmental threat (Tipples, 2006), we predicted no modulation of the GCE by SA for this expression after controlling for the other individual-differences variables. Finally, for the neutral gaze cue, we also predicted no modulation of the GCE by SA after controlling for the other individual differences. However, given some evidence that socially anxious individuals exhibit an interpretation bias to perceive neutral expressions as angry (e.g., Gutiérrez-García & Calvo, 2017; Yoon & Zinbarg, 2007), the results may resemble those for the angry gaze cue.
Method
Participants
To obtain an estimate of the sample size required to detect a small effect (Cohen’s f = .085) of SA on gaze-cueing scores—after controlling for trait anxiety, depression, and autistic-like traits—a power analysis was conducted using G*Power (Faul et al., 2007). Note that, to our knowledge, there is no readily available power calculator that can perform sample-size calculations for a repeated-measures analysis of covariance (ANCOVA; the main analytic technique used in the current study); the power analysis was therefore performed for a hypothetical hierarchical regression in which the unique effect of SA on gaze-cueing scores was assessed after first entering the scores on the other three individual-differences measures. When a power of .8 and alpha of .05 were specified, the analysis estimated a required sample size of 95.
Overall, 106 female, Caucasian students from The Australian National University participated in the study in exchange for course credit or AUD$15 payment. We recruited more participants than required to account for any potential exclusions (see section “Results”). The final sample consisted of 100 participants whose ages ranged from 18 to 40 years (M = 21.6, SD = 4.2). Females were selectively recruited because they have been shown to exhibit greater GCEs than males (Bayliss et al., 2005; McCrackin & Itier, 2019), and because the severity of SA tends to be stronger in females than in males (Asher et al., 2017; Xu et al., 2012), thus maximising the potential for this study to observe any modulation of the GCE by SA. Caucasians were selectively recruited because of known cultural differences in the perception of threat in direct eye contact (e.g., East Asians perceive direct eye contact to be more threatening than do Western Europeans; Akechi et al., 2013); this was a relevant consideration given that our gaze-cueing sequence began with a directly gazing face (see section “Procedure”). The study was approved by the Australian National University Human Research Ethics Committee (protocol number 2016/156), and each participant in the study provided written, informed consent. All participants had normal or corrected-to-normal vision.
Apparatus and stimuli
Stimuli were presented on an iMac computer with a 1,920 × 1,080 LCD monitor, which ran at a refresh rate of 60 Hz. Viewing distance to the monitor was fixed at 60 cm with a chinrest. Stimulus presentation was controlled via the Psychophysics Toolbox in MATLAB (Brainard, 1997), and questionnaires were completed on survey platform Qualtrics.
The face stimuli used in the gaze-cueing task were selected from the Radboud Faces Database (Langner et al., 2010), a validated collection of high-quality face photographs. For each expression we chose to study—angry, fearful, and neutral—two Caucasian male and two Caucasian female identities were selected, with direct-gaze, left-averted-gaze, and right-averted-gaze versions chosen for each combination of emotional expression and identity. The four identities were selected based on their high agreement ratings concerning the emotion being expressed (according to the validation study by Langner et al., 2010), as well as their possession of characteristics conducive to gaze cueing (e.g., wide-open eyes clearly averted to the left or to the right).
Graphics software Inkscape was used to convert each image to greyscale, and to crop each face so as to remove all hair and ear detail; any remaining stray hairs were removed using Adobe Photoshop. To ensure that for each combination of emotional expression and identity only the eyes differed between the various gaze directions, the eyes from the left-averted-gaze and right-averted-gaze versions of the same face were copied and pasted onto those of the direct-gaze version of the face. This resulted in three images for each combination of emotional expression and identity, with only the appearance of the eyes differing between them (dimensions: 6.5° × 8.9°). Figure 1 shows the angry, fearful, and neutral expressions for one of the selected identities.
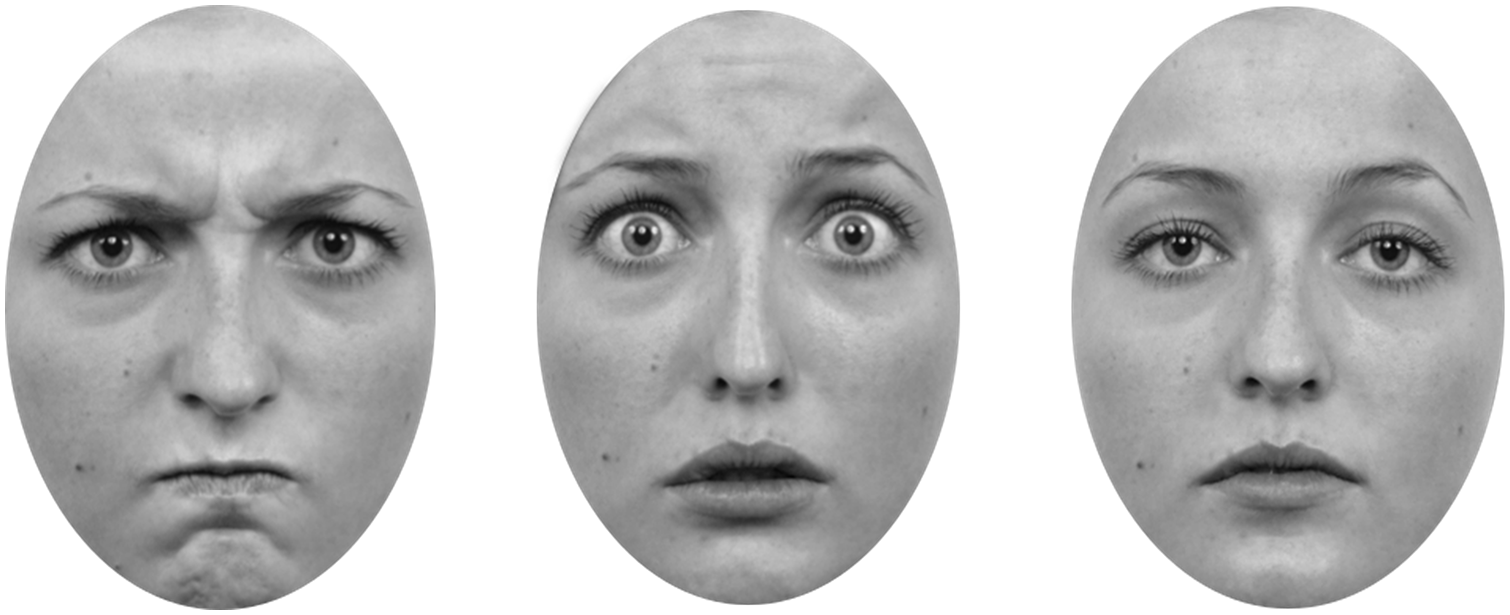
Examples of stimuli used in the current study.
For the arrow-cueing task, a black arrow containing both an arrowhead and an arrowtail was created. The central line of the arrow was 2.3° in length, with the lines making up the arrowhead and arrowtail spanning 1.1°. All lines had a thickness of 0.2°. For both the gaze- and arrow-cueing tasks, the letters “E” and “F” were used as targets; both letters were black, in Arial font, and subtended 0.8° × 0.8°. The eccentricity of the target letter was fixed at 5.5°. For the gaze-cueing task only, the target letter was located 0.8° above the horizontal meridian of the display so that it was in line with the eye region of the gaze cue.
Self-report measures
Participant screening
A preliminary screening questionnaire was created, which participants completed on Qualtrics. This contained questions about the participant’s handedness, and any past or existing diagnoses of attention deficit hyperactivity disorder (ADHD), attention deficit disorder (ADD), schizophrenia, or a major neurological injury or disease (e.g., brain tumour), disorders which may compromise face perception.
Self-Report Version of the Liebowitz Social Anxiety Scale
Participants completed the self-report version of the Liebowitz Social Anxiety Scale (LSAS-SR; Liebowitz, 1987). The LSAS-SR consists of 24 items, 11 of which describe a social interaction (e.g., “Talking to people in authority”), and 13 of which describe performance situations (e.g., “Eating in public places”). For each item, individuals indicate on a scale from 0 to 4 the extent to which the situation would provoke fear or anxiety (0 = None, 4 = Severe), and how often they would avoid the situation (0 = Never, 4 = Usually, (67%–100%)). The total scores for the “fear” and “avoidance” components are added together to form a total score, which can range from 0 to 144. The LSAS-SR has been found to possess psychometric properties on par with the clinician-administered version of the scale, with strong internal consistency, convergent validity with other SA measures, and discriminant validity (Fresco et al., 2001). The mean total LSAS-SR score in our sample (Table 1) was slightly higher than that observed by Caballo et al. (2013) in a large university-student sample (M = 45.7, SD = 19.8).
Descriptive statistics for questionnaires administered in the current study.
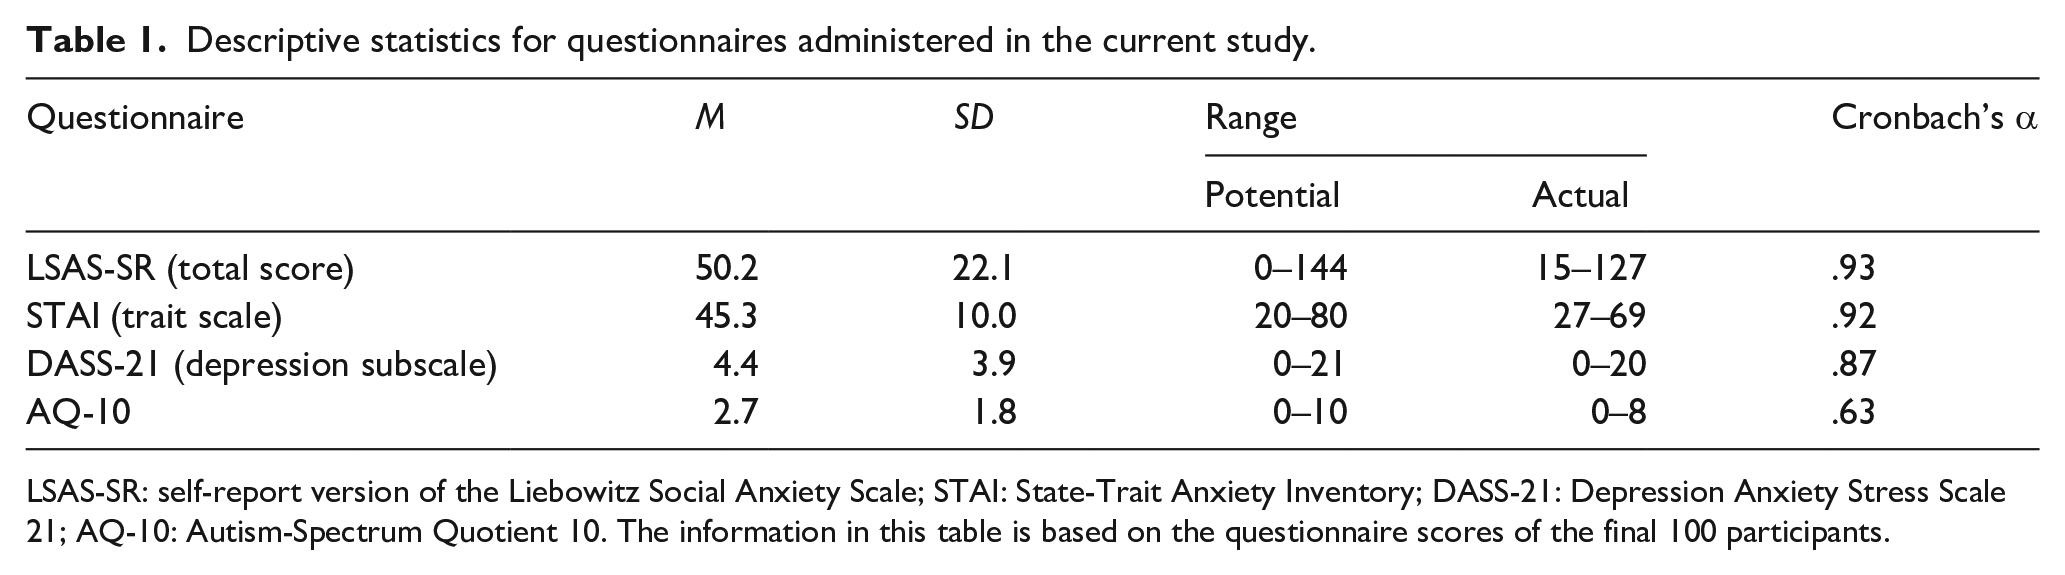
LSAS-SR: self-report version of the Liebowitz Social Anxiety Scale; STAI: State-Trait Anxiety Inventory; DASS-21: Depression Anxiety Stress Scale 21; AQ-10: Autism-Spectrum Quotient 10. The information in this table is based on the questionnaire scores of the final 100 participants.
Trait Scale of the State-Trait Anxiety Inventory
The trait scale of the State-Trait Anxiety Inventory (STAI; Spielberger et al., 1983) was used to assess trait anxiety. The scale consists of 20 statements (e.g., “I feel rested”), each requiring a response from 1 (Almost Never) to 4 (Almost Always). Possible scores range from 20 to 80, with higher scores indicating a greater trait-anxious character. The trait scale of the STAI possesses good psychometric properties, with strong construct and concurrent validity (Spielberger, 1989), and has been used in previous studies examining trait anxiety and the fearful GCE (Fox et al., 2007; Holmes et al., 2006; Mathews et al., 2003). The mean score in our sample (Table 1) was slightly higher than the mean of 40.4 (SD = 10.2) for college students in Spielberger et al.’s normative sample.
Depression Anxiety Stress Scale 21
We used the short-form version of the Depression Anxiety Stress Scale (DASS-21; Lovibond & Lovibond, 1995), which assesses symptoms of depression, anxiety, and stress. Note that while participants completed the whole scale, only the depression subscale was scored given the possible association between depression and the GCE (though see McCrackin & Itier, 2019, who did not observe such an association). The scale consists of 21 statements (e.g., “I felt down-hearted and blue”), to which participants must respond on a scale ranging from 0 (Did not apply to me at all) to 3 (Applied to me very much, or most of the time) in relation to how they had felt over the past week. Possible scores on the depression subscale (consisting of 7 items) range from 0 to 21. The subscale has been found to possess good psychometric properties, with strong internal consistency and concurrent validity (Antony et al., 1998). In our sample, the mean score on this scale (Table 1) was slightly higher than the mean of 2.1 (SD = 3.6) observed in a group of non-clinical volunteers (Antony et al., 1998).
Autism-Spectrum Quotient 10
We used the shortened version of the Autism-Spectrum Quotient (AQ-10; C. Allison et al., 2012), which consists of 10 statements that assess autistic-like traits (e.g., “I often notice small sounds when others do not”). For each statement, participants must indicate their response on a four-point scale ranging from Definitely Agree to Definitely Disagree. Possible scores on the AQ-10 range from 0 to 10, and the scale has excellent predictive validity with respect to the diagnosis of autism spectrum disorder (Booth et al., 2013). The mean AQ-10 score in our study (Table 1) was similar to the mean score of 2.8 (SD = 2.0) observed in a large sample of adult controls (Allison et al., 2012).
Procedure
The study consisted of a gaze-cueing block, an arrow-cueing block, and the series of questionnaires. The gaze-cueing block consisted of 180 valid trials (where the target appeared at the gazed-at location) and 180 invalid trials (where the target appeared at the non-gazed-at location), resulting in a cue validity of 50% (i.e., the cue was non-predictive with respect to the target location). For each emotional expression, there were 60 valid trials and 60 invalid trials, with an equal distribution of trials across the four gaze-cue identities (i.e., for each combination of emotional expression and identity, there were 30 trials). Trial types were randomly intermixed within the block.
Each trial began with a 1,000-ms presentation of the direct-gaze version of the gaze cue. This was followed by a 350-ms presentation of the right-averted-gaze or left-averted-gaze version of the same face. A 350-ms stimulus-onset asynchrony (SOA) was chosen as 350 ms is a sufficiently long period of time both for GCEs to emerge, and for the integration of emotional expression and gaze information to occur (Conty et al., 2012; McCrackin & Itier, 2018). The target letter (“E” or “F,” randomly determined) was then presented either to the left-hand side or to the right-hand side of the gaze cue with equal likelihood. Participants were required to press the letter “E” or the letter “F” on the keyboard depending on which letter appeared, with the target remaining on the display until a response was made. 2 After a response was registered, the letter disappeared and there was a 1-s intertrial interval. At every 90 trials, there was a self-paced rest break. Figure 2 illustrates the trial sequence for a single trial in the gaze-cueing block.
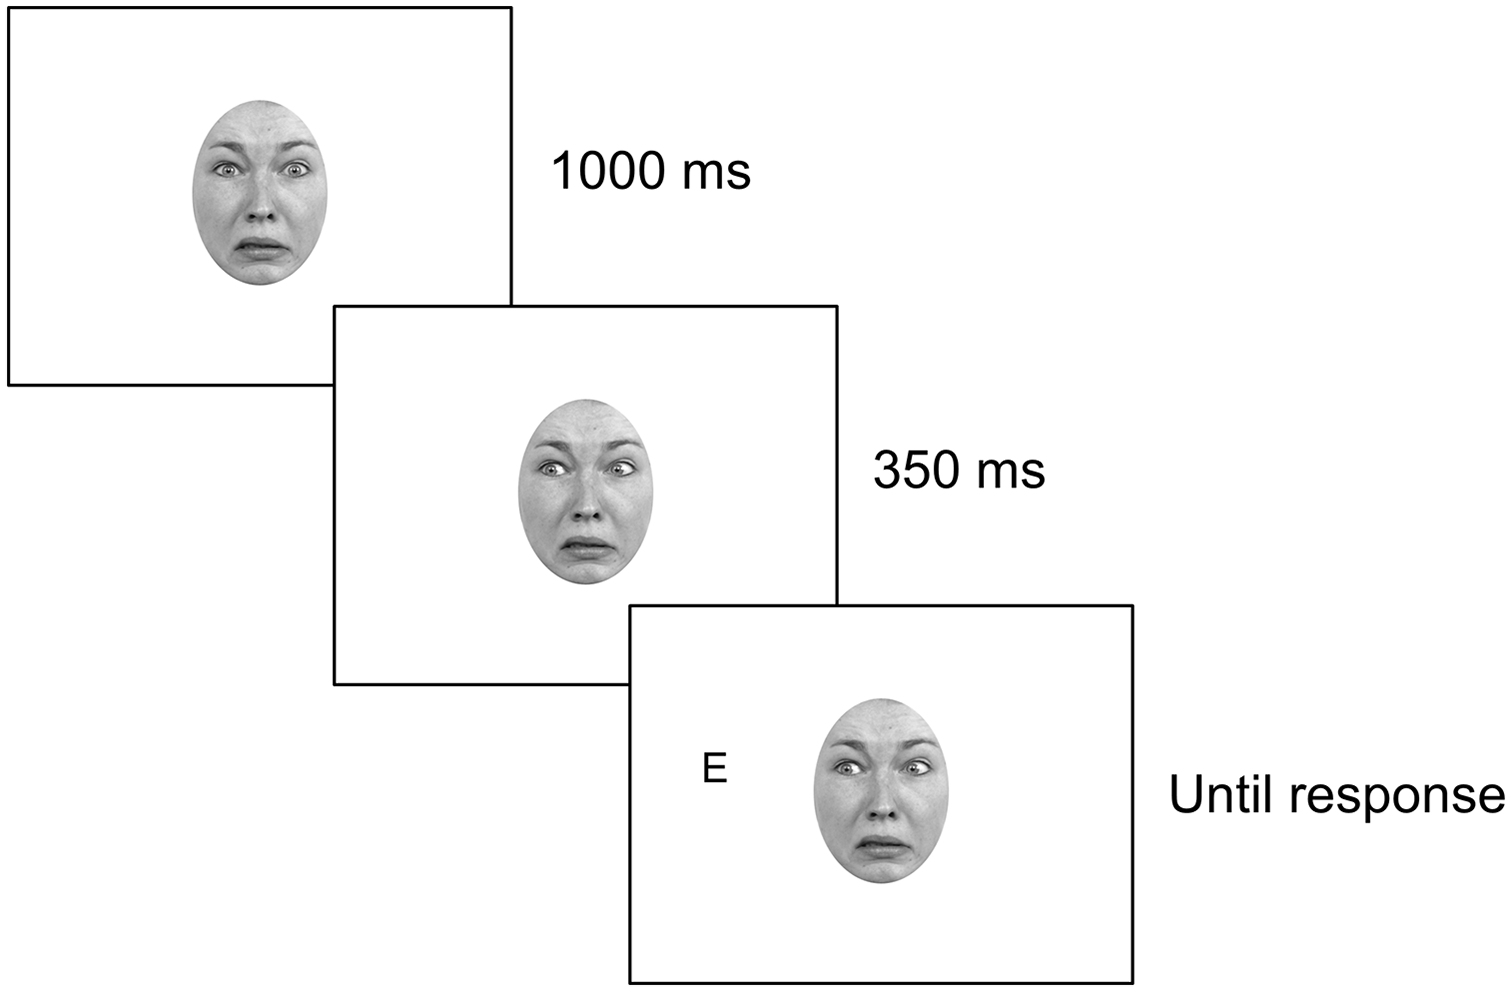
Example of a single trial in the gaze-cueing block of the current study.
The arrow-cueing block consisted of 120 trials (equivalent to the number of trials for a single emotional expression in the gaze-cueing block), 60 valid and 60 invalid. Following a 1,000-ms presentation of the straight-line component of the arrow, the arrowhead and arrowtail appeared simultaneously for 350 ms. The ensuing letter discrimination task was the same as that for the gaze-cueing block. Halfway through the block (i.e., after 60 trials), there was a self-paced rest break.
The order in which the gaze- and arrow-cueing blocks were completed was counterbalanced, and each block was preceded by a corresponding 6-trial practice block. Prior to each cueing block, participants were informed that the direction of the gaze or arrow was non-predictive of the target location, and were instructed to respond as quickly and as accurately as possible to the target letter using their left hand. They were also instructed to maintain fixation on the gaze or arrow cue. Following completion of the experimental blocks, participants completed the screening questionnaire, followed by the LSAS-SR, the trait scale of the STAI, the DASS-21, and the AQ-10. After all tasks were completed, participants were fully debriefed regarding the purpose of the study.
Data analysis plan
Trials in which participants responded incorrectly to the letter discrimination task, had RTs shorter than 100 ms, or had RTs longer than 2.5 SDs above their mean RT, were excluded (note that for the gaze-cueing block, RT screening was conducted separately for each emotional expression to account for any potential differences in overall RT between emotional expressions). For the gaze-cueing block, the mean RT for each combination of cueing condition (valid or invalid) and emotional expression (angry, fearful, or neutral) was calculated, collapsed across target location. For the arrow-cueing block, a mean valid RT and a mean invalid RT were calculated, again collapsing across target location. For the gaze-cueing scores, the main analysis consisted of a 2 (cue validity: valid or invalid) × 3 (emotional expression: angry, fearful, or neutral) repeated-measures ANCOVA, with LSAS-SR scores modelled as a continuous covariate. Another ANCOVA including the other scales (also modelled as continuous covariates) was conducted to control for other individual-differences variables, and an equivalent Bayesian ANCOVA was performed to quantify the evidence for the effects of interest. Similar analyses were performed on the arrow-cueing scores. Note that each covariate was centred to improve the interpretability of the results (Tabachnick & Fidell, 2013), and where violations of sphericity occurred, the Greenhouse–Geisser correction was employed.
Results
Data screening
Raw data are available here: https://osf.io/qz3vg/. Two participants’ data were excluded due to an indicated diagnosis of ADD or ADHD, and a further four participants’ data were excluded because these participants had more than 20% errors in the gaze-cueing block, indicating a lack of engagement with the task. This left a total of 100 participants in the final analysis (see section “Participants” for demographic information). Three univariate outliers (defined as cases with z-scores exceeding ±3.29; Tabachnick & Fidell, 2013) were identified, as were three multivariate outliers in the gaze-cueing block and two multivariate outliers in the arrow-cueing block (defined as cases with Mahalanobis distances exceeding 29.59 for the gaze-cueing data and 22.46 for the arrow-cueing data). Given that the results of the analyses reported below were unchanged when these outliers were removed, these cases were retained in the final data set.
Split-half reliability of gaze- and arrow-cueing scores
If a task has poor reliability, this can compromise the ability of a study to observe individual differences in performance on that task (e.g., Goodhew & Edwards, 2019; Hedge et al., 2018). Therefore, we assessed the reliability of our gaze- and arrow-cueing scores by conducting a split-half analysis using the R package “splithalf” (Parsons, 2020). This package provides an estimate of split-half reliability by randomly splitting the data in half for a specified number of repetitions, calculating cueing scores for each half, and then correlating these scores. The final split-half estimate is the average of these correlations.
As recommended by Parsons et al. (2019), 5,000 random splits of the data were performed. For the gaze-cueing scores (collapsed across emotional expression), reliability estimates were as follows: rs = .95, 95% confidence interval (CI) = [.93, .97] (uncorrected: r = .90, 95% CI = [.87, .93]). The gaze-cueing scores therefore exhibited excellent reliability. For the arrow-cueing scores, reliability was moderate: rs = .65, 95% CI = [.48, .76] (uncorrected: r = .48, 95% CI = [.32, .62]).
Gaze cueing
Mean RTs and error rates for the gaze-cueing task are shown in Table 2. RT data for the gaze-cueing block were submitted to an ANCOVA, with cue validity (valid or invalid) and emotional expression (angry, fearful, or neutral) as within-subjects factors, and centred LSAS-SR scores as a continuous covariate. This analysis revealed only a large effect of cue validity, F(1, 98) = 25.64, p < .001,
Mean RTs for the gaze- and arrow-cueing tasks.
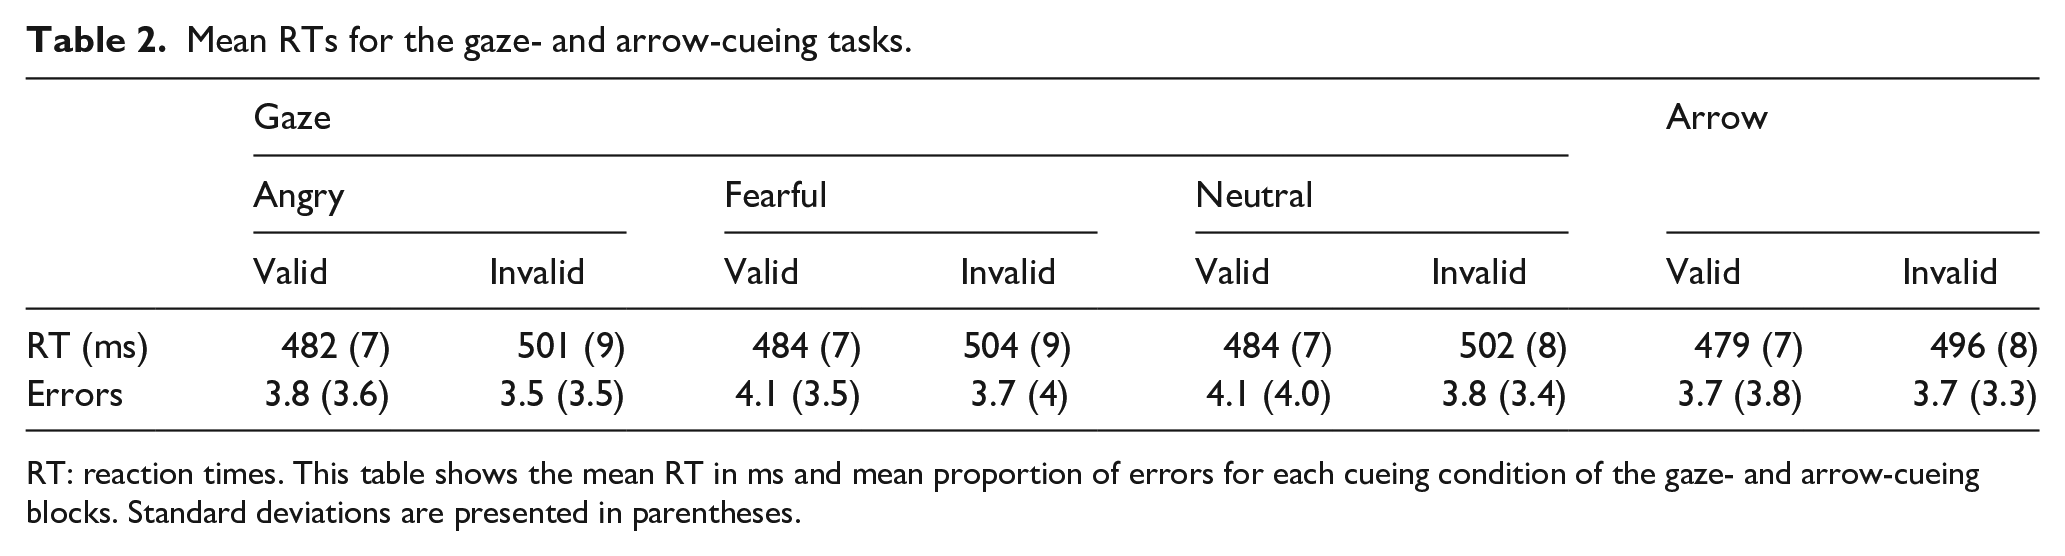
RT: reaction times. This table shows the mean RT in ms and mean proportion of errors for each cueing condition of the gaze- and arrow-cueing blocks. Standard deviations are presented in parentheses.
It is possible that other individual-differences variables were working in the opposite direction to the effect of SA on the GCE (e.g., autistic-like traits, which have been linked with a reduced GCE; Bayliss et al., 2005), which would mask the presence of this effect in the analysis. Therefore, another ANCOVA was performed on the RT data, with the addition of the STAI, DASS-21 (depression subscale), and AQ-10 scores as centred covariates. Again, only a significant effect of cue validity emerged, F(1, 95) = 24.94, p < .001,
Because our conclusions are based on null results, an equivalent Bayesian ANCOVA was conducted using JASP (JASP Team, 2020). This revealed a BF10 of 4.49e + 17 for the effect of cue validity, indicating “decisive” evidence for a GCE (Jeffreys, 1961). For each of the other effects, BF10 < 1, which is evidence in favour of the null hypothesis for these effects (Jeffreys, 1961). In particular, the BF10 for the three-way interaction between cue validity, emotional expression, and LSAS-SR scores was 0.08, indicating “substantial” evidence for the null hypothesis (Jeffreys, 1961). Figure 3 shows scatterplots of the GCE for each emotional expression as a function of centred LSAS-SR scores. 3
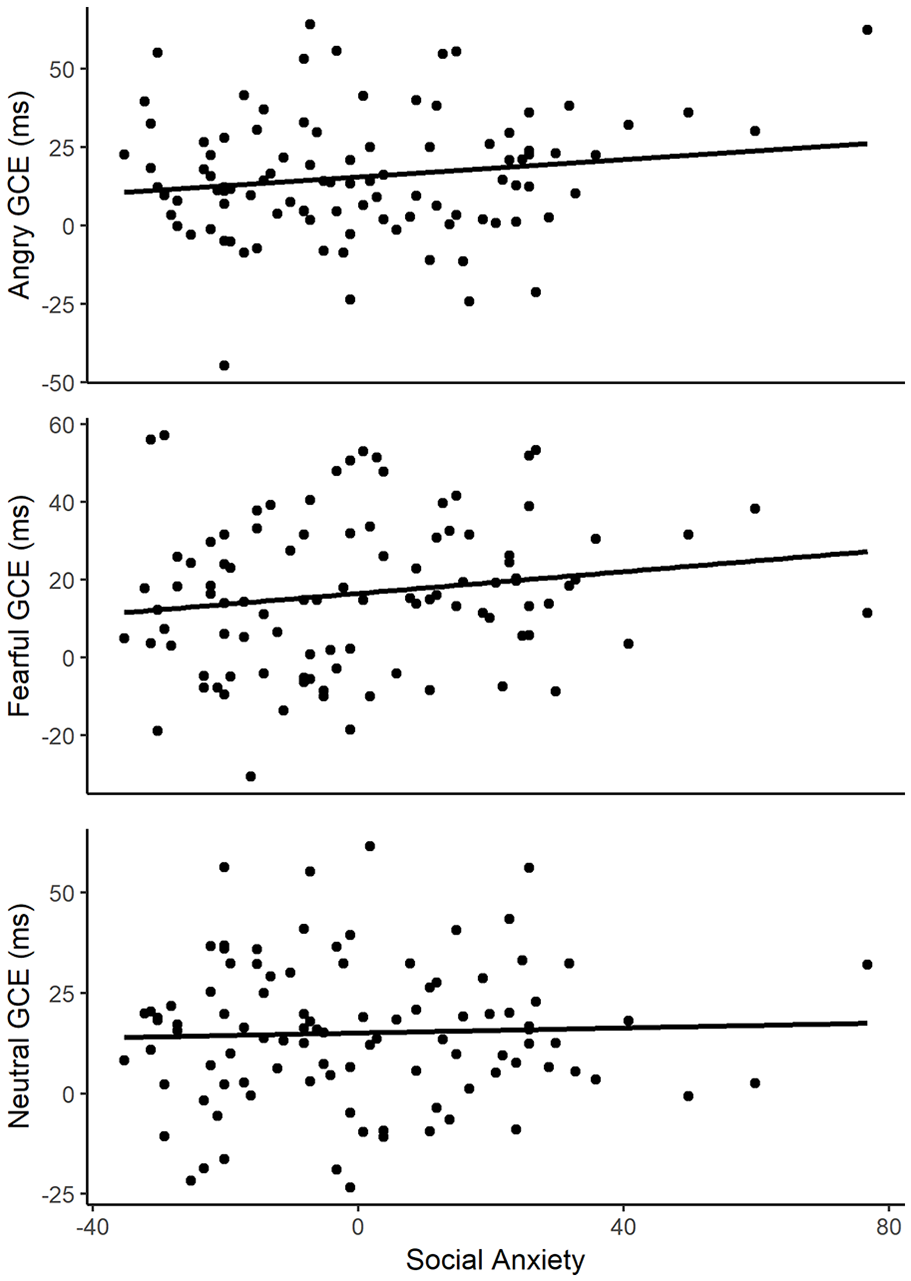
Relationship between social anxiety and GCEs for angry, fearful, and neutral expressions.
Arrow cueing
In light of previous research showing that socially anxious participants have a general impairment in the orienting network of attention (e.g., Heeren et al., 2015), we went on to examine whether SA modulated arrow-cueing scores. Mean RTs and error rates for the arrow-cueing task are shown in Table 2. We performed an ANCOVA on RTs in the arrow-cueing block, which contained the cue validity factor (valid or invalid) and the centred LSAS-SR scores as a covariate. This analysis again revealed only a significant effect of cue validity, F(1, 98) = 36.5, p < .001,
Discussion
In this study, we investigated whether SA modulates the GCE for different emotional expressions. While we observed reliable GCEs, we obtained clear evidence that these effects were not modulated by SA; in other words, in spite of SA being associated with a range of attentional biases, we have shown that gaze following is a process that remains intact across levels of SA. Interestingly, and contrary to some published findings, we also observed no modulations of the GCE by emotional expression, or modulations of the GCE by trait anxiety, depression, or autistic-like traits. Before turning to the implications of these findings, we first consider possible explanations for these null results.
Alternative explanations
One possibility for the lack of any effects involving SA is that we did not observe sufficient range in LSAS-SR scores to be able to detect an effect. First, it should be noted that SA symptoms are normally distributed within the general population (Rapee & Spence, 2004), and that the use of a continuous variable is preferable to dichotomisation in most circumstances (e.g., DeCoster et al., 2009; MacCallum et al., 2002). Therefore, our operationalisation of SA as a continuous variable was appropriate. The mean LSAS-SR score in our study was 50.2, with scores ranging from 15 to 127 (note that the maximum possible score was 144). Mennin et al. (2002) recommended a cut-off score of 30 for SA disorder, and 60 for its more severe, generalised subtype. In our sample, 82 of our 100 participants had scores of 30 or above, and 33 participants had scores of 60 or above. One possibility, then, is that we did not have enough participants with low LSAS-SR scores. Note, however, that our mean total LSAS-SR score of 50.2 was only slightly higher than the mean total LSAS-SR score of 45.7 found in a large university-student sample (Caballo et al., 2013), with the spread of scores similar between the two studies (SD = 22.1 in our study; SD = 19.8 in Caballo et al., 2013). Furthermore, in another study where LSAS-SR scores were used as a continuous covariate, significant effects of these scores were found on attentional engagement to angry faces (Delchau et al., 2019) despite a mean LSAS-SR score that was higher than ours (M = 55.4), and with a similar standard deviation (SD = 22.9). Finally, when we compared the 33 highest LSAS-SR scorers with the 33 lowest LSAS-SR scorers in a between-subjects analysis, we again found no effect of SA on cueing scores (see online Supplementary Material for details). Therefore, it seems unlikely that an insufficient spread of LSAS-SR scores could account for our null findings.
Another possibility is that our study lacked a sufficiently threatening context for a modulation of GCEs by SA to emerge. Mansell et al. (2002), for instance, found that socially anxious participants only avoided emotional faces when they were under social-evaluative threat (i.e., when participants were informed that they would have to deliver a speech following the experimental blocks). Our study did not contain such a manipulation. 4 However, there are many examples of socially anxious participants exhibiting attentional biases, such as a bias towards angry faces (e.g., Gilboa-Schechtman et al., 1999; Mogg et al., 2004), in the absence of such a condition. Unless the GCE is somehow less sensitive to modulations than these other attentional processes, it is unlikely that the lack of a threatening context is responsible for our null findings.
It could also be argued that the dynamics of the gaze-cueing paradigm we employed may not have been appropriate for revealing modulations of the GCE by emotional expression. Our sequence began with the direct-gaze version of the face already expressing the relevant emotion, and then averting its gaze; in other words, the emotional content of the gaze cue remained constant throughout the trial sequence. It has been argued that a dynamic sequence in which the gaze cue only assumes the relevant expression after the eyes have been averted is more likely to reveal modulations of the GCE by emotional expression, given that it reflects a more naturalistic scenario in which an emotion is expressed after an object is noticed (e.g., a neutral face assumes a fearful expression when a spider appears; Lassalle & Itier, 2015b). However, McCrackin and Itier (2019) have argued that the sequence used in the current study may tap into the differential sensitivity of particular populations to different emotions, and therefore may be the most ideal for revealing individual differences in gaze cueing; the authors offered this as a potential explanation for why they did not observe modulations of the GCE by trait anxiety, since they employed the aforementioned “gaze-shift-first” sequence. For SA specifically, the initial presentation of a directly gazing face expressing a socially threatening emotion—such as anger—would be the most likely to elicit an affective response in high-SA participants, since high-SA participants are averse to such expressions when they are gazing directly at the participant (e.g., Heuer et al., 2007; Mansell et al., 1999; Roelofs et al., 2010). In other words, if SA had modulated gaze following, it would likely have done so via a perception of threat in the gaze cue, and subsequent attentional maintenance on the face (potentially leading to an enhanced GCE) or avoidance (potentially leading to a diminished GCE). Therefore, while the type of sequence we used may be able to explain why no interaction between cue validity and emotional expression emerged, it cannot explain the lack of modulation by SA, or by any of the other individual-differences variables.
The lack of any modulation of the GCE by emotional expression might also be explained by the nature of the task (i.e., letter discrimination). For example, it has been argued that simply identifying a target letter—as opposed to making a more complex judgement about a target (e.g., “safe” vs. “dangerous”; Dawel et al., 2015)—can lead to a weaker, or absent, effect of emotional expression (Friesen et al., 2011). However, Coy et al. (2019)—across five experiments—failed to replicate the enhanced GCE for fearful faces even when a “safe” versus “dangerous” image categorisation task was employed, and modulations of the GCE by emotional expression have been observed even when simpler tasks, such as target localisation, have been used (e.g., Bayless et al., 2011; Lassalle & Itier, 2013, 2015a, 2015b). It has also been argued that localisation tasks are better able to reveal modulations of the GCE by emotional expression than discrimination tasks like ours, particularly for fearful expressions; this is because the hybrid of emotion and gaze information conveyed by a gaze cue could inform the viewer of where a dangerous target is located, which aligns more closely with the requirements of a localisation task (Lassalle & Itier, 2013). However, as we argued earlier, discrimination tasks are more appropriate for revealing the attentional effects of orienting in response to a gaze cue, since cueing effects revealed by localisation tasks may instead reflect the priming of response preparation and execution (Wiese et al., 2013). Therefore, while we may have observed modulations of the GCE by emotional expression had we used a localisation task instead of a discrimination task, we would not have been able to determine whether this was an entirely attentional modulation.
Finally, it is worth considering the possibility that our choice of SOA explains why we did not observe modulations of the GCE by any of the individual-differences variables, any of the emotional expressions, or by the combination of these two variables. Previous gaze-cueing studies have used a wide variety of SOAs, ranging from approximately 200 ms (e.g., Bayless et al., 2011; Graham et al., 2010; Putman et al., 2006) to around 700 ms (e.g., Tipples, 2006). Our 350-ms SOA was therefore comfortably within the range of those used in previous studies, and in particular, was similar to the SOAs used in studies that have observed modulations of the GCE: Fox et al. (2007), for instance, found an enhanced fearful GCE in high-trait-anxious participants with an SOA of 300 ms. Indeed, our SOA was also sufficiently long to allow for the integration of emotional expression and gaze information, which can occur as early as 200 ms after cue onset (Conty et al., 2012; McCrackin & Itier, 2018). Therefore, our null results are unlikely to be the product of the SOA we chose to employ. It should be noted, however, that some literature on vigilance-avoidance processes in anxiety indicates that engagement with threatening stimuli varies as a function of time course, such that anxious individuals experience rapid engagement with threatening stimuli, followed by disengagement (e.g., Mogg et al., 2004); this hints at the possibility that temporal factors such as SOA may play a role in attentional processes such as gaze cueing. Nevertheless, the fact that we obtained robust GCEs in spite of each face preceding stimulus onset for over a second (including the duration of the direct-gaze version of the face) suggests that avoidance of the stimulus did not occur; furthermore, if differences in the time course of GCEs were to differ across SA, this would likely occur as a function of total time of exposure to the face, rather than SOA per se. Nevertheless, future research could examine the time course of gaze cueing in SA.
Overall, then, it appears unlikely that the absence of any interactions involving cue validity could be attributed to insufficient spread in LSAS-SR scores, the lack of a sufficiently threatening context, the gaze-cueing sequence employed, the nature of the task, or the particular SOA used in our study. We therefore turn now to the implications of our findings.
Implications for SA
SA is characterised by a range of attentional biases, including engagement towards, avoidance of, and delayed disengagement from socially threatening expressions (e.g., Buckner et al., 2010; Mansell et al., 2002; Mogg et al., 2004). However, our data suggest that gaze-following is an attentional process that is unaffected by SA, even for expressions that could be perceived as threatening to high-SA participants (e.g., anger). Our findings align with those of Gregory et al. (2019), who found that those with SA do not show differences in overt gaze-following behaviour compared with a control group; however, we have extended this finding to the gaze-cueing paradigm, which can capture covert shifts of attention. In showing that this lack of modulation extends to gaze cueing by angry expressions, for which a range of attentional biases in SA have been demonstrated (e.g., Mogg et al., 2004), we have also extended the findings of Gregory and Jackson (2017), Wei et al. (2019), and Boll et al. (2016), who used only neutral expressions. The sparing of gaze cueing across SA perhaps attests to the fundamental importance of gaze-following behaviour, particularly as a means of detecting important environmental events, gauging the intentions of others, and facilitating social communication (Baron-Cohen, 1995).
At first blush, our results for both the gaze-cueing task and the arrow-cueing task are inconsistent with Heeren et al.’s (2015) finding that the orienting network of attention is impaired in those with SA. These authors found that compared with a non-clinical group, socially anxious participants exhibited a diminished orienting effect in response to a predictive peripheral cue. In our study, we observed no modulations of gaze- or arrow-induced orienting by SA. One explanation for this seeming inconsistency is that gaze and arrow cues carry more social and symbolic relevance than do peripheral cues, and therefore by virtue of their functional significance, are more resistant to modulations by SA. Another possibility relates to the fact that our gaze and arrow cues were non-predictive, whereas in Heeren et al.’s (2015) study, the cue was 100% valid. Therefore, altered orienting effects in those with SA could reflect differences in how the informative value of the cue was processed. Whatever the explanation for these discrepant findings, it is clear from our results that the ability to shift attention per se is unaffected by SA, since no diminished cueing effects were found in the current study.
Modulation of gaze cueing by other individual differences
As well as being unaffected by individual differences in SA, the GCEs we obtained in our study were robust to both the emotional expression of the gaze cue and the other individual-differences variables. As argued earlier, one possibility for the lack of any modulations by emotional expression (irrespective of any individual differences) was that we did not use a gaze-cueing sequence in which the face changed expression after averting its gaze, which some (e.g., Lassalle & Itier, 2015b; McCrackin & Itier, 2019) have argued is the most appropriate sequence for revealing such effects. While it has been suggested that the gaze-cueing sequence used in our study may be more appropriate for revealing individual differences in the magnitude of the GCE (McCrackin & Itier, 2019), the fact that we obtained no modulation of the GCE by any of the individual-differences variables in spite of this calls into question the relevance of this variable in explaining the presence or absence of these modulations. As mentioned previously, it is also unlikely that the nature of the task or our choice of SOA can explain our null findings. Therefore, we now explore each individual-differences variable in more depth.
Considering trait anxiety, previous studies have found that high-trait-anxious participants exhibit an enhanced GCE in response to fearful faces (Fox et al., 2007; Holmes et al., 2006; Mathews et al., 2003; Putman et al., 2006; Tipples, 2006). We observed no such effect. Interestingly, Mathews et al. (2003) and Fox et al. (2007) used a virtually identical gaze-cueing sequence to ours, and an identical measure of trait anxiety (the trait scale of the STAI). 5 These authors did not report the overall mean or spread of scores on this scale, so it is difficult to assess whether this inconsistency could be attributed to differences in the participant sample. However, it is worth noting that our sample size of 100 vastly exceeds that of both Mathews et al. (N = 45) and Fox et al. (N = 40), as well as those of the other studies (N = 36 in Holmes et al., 2006; n = 30 in Experiment 1 of Putman et al., 2006; N = 38 in Tipples, 2006); it is therefore likely that our study possessed more power to detect such an effect. Furthermore, when we dichotomised our participant sample into “low-trait-anxious” and “high-trait-anxious” groups for comparability to these earlier studies, we also obtained no effect of trait anxiety on GCEs (see online Supplementary Material for details of this analysis). Our results therefore seriously call into question the robustness of this effect.
We also did not find any effects of depression or autistic-like traits on gaze-cueing scores. With regard to depression, McCrackin and Itier (2019) have previously suggested that the purported trait-anxiety modulation of the fearful GCE may be driven by this construct; however, they failed to find any effect of depression on GCEs in their own data. Consistent with their results, in our study, we obtained no significant effects involving depression, providing further evidence that this variable does not modulate gaze cueing. With regard to autistic-like traits, previous studies have reported diminished GCEs in autism (e.g., Ristic et al., 2005); McCrackin and Itier (2019) also reported that high scores on the Attention to Detail subscale of the full AQ were associated with reduced modulations of the GCE by emotional expression, especially for happy expressions (see also Lassalle & Itier, 2015a). This may be because in order for such modulations to emerge, the face must be processed holistically; high scorers on the Attention to Detail subscale may instead use a local processing strategy (Lassalle & Itier, 2015a; McCrackin & Itier, 2019). Perhaps we did not obtain an effect of autistic-like traits on the GCE because we administered the AQ-10 (a shortened version of the AQ), which did not allow us to probe the different facets of autistic-like traits, or because we did not include gaze cues with happy expressions. Another potential explanation lies in the fact that we used an all-female participant sample, which may have resulted in few high AQ-10 scores being observed (see Baron-Cohen et al., 2001, for a discussion of sex differences in autistic-like traits). Indeed, in our sample of 100 participants, only 11 had an AQ-10 score of 6 or above, where a score of 6 represents the proposed cutoff point for a potential diagnosis of autism spectrum disorder (Allison et al., 2012). Nevertheless, our inability to replicate the trait-anxiety modulation of the GCE for fearful faces—within a large sample—suggests that the reliability of effects relating to autistic-like traits might also merit further investigation.
Reliability of gaze cueing
That gaze-cueing scores were not modulated by SA, or by any of the other individual-differences variables, could be attributed to the profound social importance of attending to locations gazed at by another. Indeed, it may be the case that this process is so fundamental to everyday social functioning that it is resistant to any differences across SA in how the emotional content of a face is perceived (i.e., as socially threatening vs. socially benign). Support for the potential innateness of gaze following comes from studies showing that humans possess dedicated neural circuitry for processing gaze direction (e.g., Allison et al., 2000; Perrett et al., 1992; see Carlin & Calder, 2013; Emery, 2000, for reviews), and that gaze-following behaviour occurs early in life (e.g., Farroni et al., 2000; Hood et al., 1998). In addition, if the GCE is indeed greater for females than it is for males (e.g., Bayliss et al., 2005; McCrackin & Itier, 2019), perhaps because females exhibit a relatively heightened sensitivity to non-verbal social cues (Hall, 1978), then our all-female participant sample may have further contributed to buttressing the GCE against modulation by SA and the other individual-differences variables. Nevertheless, our gaze-cueing scores exhibited excellent rank-order consistency when a split-half analysis of these scores was conducted (rs = .95; see section “Results”). This indicates that there may be systematic individual differences in the magnitude of the GCE. Our null findings, however, suggest that SA, trait anxiety, depression, and autistic-like traits are not the source of these differences; therefore, further research should be devoted to examining the robustness of individual-differences variables that have been claimed to modulate the GCE, and to uncovering other contextual variables that may modulate the effect (e.g., Dalmaso et al., 2020).
Conclusion
SA is associated with a range of attentional biases. However, the current study shows that attentional orienting in response to one’s gaze direction—a cue with powerful social meaning—is unaffected by individual differences in SA, even for emotional expressions that high-SA participants find especially threatening (i.e., anger). In the process of controlling for other individual-differences variables that have been claimed to modulate the GCE, we also failed to replicate the results of previous studies that have shown modulations of the fearful GCE by trait anxiety, and also found no effect of depression or autistic-like traits. We suggest that the gaze cueing and individual differences literature may be faced with the same replicability issues as the literature on the modulation of gaze cueing by emotional expression, echoing Coy et al.’s (2019) recent call for these ostensible modulations to be reinvestigated.
Supplemental Material
sj-docx-1-qjp-10.1177_1747021820973954 – Supplemental material for Examining the effects of social anxiety and other individual differences on gaze-directed attentional shifts
Supplemental material, sj-docx-1-qjp-10.1177_1747021820973954 for Examining the effects of social anxiety and other individual differences on gaze-directed attentional shifts by Louisa A Talipski, Emily Bell, Stephanie C Goodhew, Amy Dawel and Mark Edwards in Quarterly Journal of Experimental Psychology
Footnotes
Declaration of conflicting interests
The author(s) declared no potential conflicts of interest with respect to the research, authorship, and/or publication of this article.
Funding
The author(s) disclosed receipt of the following financial support for the research, authorship, and/or publication of this article: This work was supported by an Australian Government Research Training Program scholarship awarded to L.A.T.; an Australian Research Council Future Fellowship (No. FT170100021) awarded to S.C.G.; and an Australian Research Council Discovery Project (No. DP190103103) awarded to M.E.
Notes
References
Supplementary Material
Please find the following supplemental material available below.
For Open Access articles published under a Creative Commons License, all supplemental material carries the same license as the article it is associated with.
For non-Open Access articles published, all supplemental material carries a non-exclusive license, and permission requests for re-use of supplemental material or any part of supplemental material shall be sent directly to the copyright owner as specified in the copyright notice associated with the article.