
Abstract
Previous face matching studies provide evidence that matching same identity faces (match trials) and discriminating different face identities (non-match trials) rely on distinct processes. For example, instructional studies geared towards improving face matching in applied settings have often found selective improvements in match or non-match trials only. In addition, a small study found that developmental prosopagnosics (DPs) have specific deficits in making match but not non-match judgements. In the current study, we sought to replicate this finding in DPs and examine how individual differences across DPs and controls in match versus non-match performance relate to featural versus holistic processing abilities. In all, 43 DPs and 27 controls matched face images shown from similar front views or with varied lighting or viewpoint. Participants also performed tasks measuring featural (eyes/mouth) and holistic processing (part–whole task). We found that DPs showed worse overall matching performance than controls and that their relative match versus non-match deficit depended on image variation condition, indicating that DPs do not consistently show match- or non-match-specific deficits. When examining the association between holistic and featural processing abilities and match versus non-match trials in the entire group of DPs and controls, we found a very clear dissociation: Match trials significantly correlated with eye processing ability (r = .48) but not holistic processing (r = .11), whereas non-match trials significantly correlated with holistic processing (r = .32) but not eye processing ability (r = .03). This suggests that matching same identity faces relies more on eye processing while discriminating different faces relies more on holistic processing.
Keywords
Introduction
Comparing two face images is an important task for identity verification routinely performed by passport control officers, police officers, bartenders, and cashiers. Accurately matching faces can be challenging and error-prone, particularly for unfamiliar faces (for a review, see Young & Burton, 2018). Recent studies suggest that matching same identity faces (match trials) and discriminating different face identities (non-match trials) rely on distinct processes (Bindemann & Burton, 2020), although the nature of these processes is poorly understood. Further evidence for this dissociation is from a recent small study that found that developmental prosopagnosics (DPs), individuals with lifelong face recognition deficits (Duchaine & Nakayama, 2006a), were impaired on match but not non-match trials (White et al., 2017). The goals of the current study were to (a) further investigate the nature of face matching impairments in a larger sample of DPs under multiple face image variation conditions and (b) examine whether individual differences in the ability to match same face identities versus discriminate different faces rely more or less on feature-based versus holistic processing.
Studies have consistently found evidence that performance on face match and non-match trials depends on at least partially dissociable mechanisms. First, in contrast to object tasks that typically show that performance on old/match items and new/non-match items is highly correlated (mirror effect, Glanzer & Adams, 1990), unfamiliar faces typically show much lower correlations between match and non-match trial accuracy of the same face images (e.g., r = .10, Megreya & Burton, 2007). In addition, face match and non-match trials have been shown to dissociate during instructional intervention studies geared towards enhancing face matching performance in applied settings. For example, Towler et al. (2017) presented a pair of unfamiliar faces above a list of eleven facial features (e.g., ears, eyes, and nose), and observers were asked to first rate the similarity of each feature and then make match/non-match judgements. The results demonstrated that, compared with making no ratings, feature similarity ratings improved accuracy on match trials and slightly impaired accuracy on non-match trials. Using a similar paradigm, Megreya and Bindemann (2018) found that, compared with not providing instructions, specifically instructing participants to pay attention to the eyebrows led to improvements in accuracy on match trials but not non-match trials whereas instructions to attend to the ears decreased both match and non-match performance. Contrasting these results, Towler et al. (2021) recently found that instructing individuals to focus specifically on the ears and facial marks (e.g., scars, blemishes) improved accuracy on non-match trials, but not match trials, although these effects were specific to the high-resolution faces condition. Together, these studies provide evidence that match and non-match trials depend on separable mechanisms. However, the results observed have been inconsistent and may be specific to the images used and the mechanisms underlying differential match versus non-match performance remain to be characterised.
Studying how individual differences in feature and holistic processing abilities associate with match versus non-match performance could provide important complementary evidence to these studies. As increased attention to features has often been shown to enhance match trial performance (e.g., Megreya & Bindemann, 2018; although see Towler et al., 2021, for an exception), feature abilities could be particularly associated with match trial performance. It should be noted that the features focused on by facial examiners may be distinct from features commonly attended to in everyday life and feature expertise in the normal population (e.g., Phillips et al., 2018). Using a normal control sample, Abudarham and colleagues (2019, 2021) used a reverse-engineering approach and identified specific features critical for determining face identity in both familiar and unfamiliar faces: lip thickness, eye colour, eye shape, eyebrow thickness, and hair. Consistent with these critical features, using the “bubbles” technique, super face recognisers, who have superior face matching abilities (Bobak et al., 2016), have shown to use the eyes/eyebrows and the mouth more for recognition than controls (Tardif et al., 2019; although they may tend to fixate the bridge of the nose, Bobak et al., 2016). Furthermore, Davis et al. (2021) found that instructing participants to attend to internal features (eyebrows, nose, mouth) resulted in higher match hit rates on a simultaneous matching task, while instructions to attend to external features (ears, chin/jawline, face shape) and no instructions both produced similarly lower hit rates. This suggests that enhanced perceptual sensitivity to features in the eye and mouth regions is important for matching faces and could be particularly associated with improved match trial performance. In addition to specific feature abilities, the ability to perform holistic face processing, the simultaneous integration of features and spacing information into a unified percept (Rossion & Boremanse, 2008), could also be differentially related to match versus non-match performance. Although some have questioned the degree to which face expertise mechanisms like holistic processing are used when matching unfamiliar faces (e.g., Young & Burton, 2018), better holistic processing abilities, as measured by the part–whole and face inversion effects, have been robustly associated with more accurate matching of unfamiliar faces (Cambridge Face Perception Test, Rezlescu et al., 2017; although not when using the composite effect to measure holistic processing, see Verhallen et al., 2017). However, no study to date has reported specific associations between holistic processing and match versus non-match trials.
Examining face matching in individuals with inferior face matching abilities may provide additional insights into the mechanisms underlying match versus non-match judgements. Developmental DPs have been shown to be impaired at face matching tasks for both unfamiliar (e.g., Mishra et al., 2021; White et al., 2017; although see Ulrich et al., 2017) and familiar faces (White et al., 2017). DPs have also demonstrated deficits in feature-based processing (DeGutis, Cohan, et al. 2012; Le Grand et al., 2006), especially of internal facial features (e.g., eye region, Fisher et al., 2016). They also have been shown to have reduced, although not completely abolished, holistic face processing (Avidan et al., 2011; DeGutis, Chatterjee, et al., 2012; DeGutis, Cohan, et al., 2012; Palermo et al., 2011; although see Tsantani et al., 2020). Notably, despite these feature and holistic deficits and anecdotal accounts of DPs relying on extra-facial information such as voice and gait for recognition (Adams et al., 2020), DPs have shown to rely on very similar critical features as controls when performing face matching (Abudarham et al., 2021). In terms of face match versus non-match trial performance, White et al. (2017) found that a small group of six DPs were impaired on match trials but performed similarly to controls on non-match trials. This pattern was found when using images of both familiar and unfamiliar faces. This suggests that DPs have a specific deficit in matching same-identity faces. Although the idea that DPs have a match trial-specific deficit but intact non-match performance is provocative, this effect could be driven by simply a non-match response bias in a few DPs. Furthermore, anecdotal reports of DPs suggest that they often confuse two different individuals as being the same person (e.g., Murray et al., 2018), consistent with non-match errors. However, these reports could reflect more of a memory phenomenon than a perceptual one. Considering that DP is a heterogeneous disorder (see Corrow et al., 2016 for a discussion), replication of White et al.’s match trial-specific deficits with a larger DP sample is necessary before strong conclusions can be made.
In the current study, we sought to further clarify the mechanisms of match versus non-match judgements by (a) examining a larger sample of DPs (N = 43) and (b) performing individual differences analysis with match/non-match performance and measures of feature and holistic processing. Because face matching results may depend on the to-be-matched faces and image variations (Bindemann & Burton, 2020), we examined whether the results were similar across different image changes by showing pairs of faces from either (a) front views with similar lighting, (b) front views with different lighting, or (c) different viewpoints. We had participants view image pairs that disappeared after 3 s, which is approximately the average time to make a match judgement with faces having similar lighting/viewpoint changes (e.g., Rossion & Michel, 2018). This also avoided ceiling effects in accuracy. Finally, to better understand the mechanisms underlying match versus non-match trials, we administered an assessment of feature discrimination ability (“Georges” task, Malcolm et al., 2004) as well as the part–whole task to measure both feature and holistic processing (Tanaka et al., 2004). We then examined individual differences, associations between feature and holistic processing, and match/non-match conditions in the combined DP and control group, to maximise the range of individual differences across measures (we also analysed each group separately). Importantly, previous studies have found that, rather than representing two discrete groups, the distribution of DPs’ perceptual performance is shifted towards impairment but highly overlapping with the control distribution (e.g., Biotti et al., 2019) and DPs may use similar critical features for face matching (Abudarham et al., 2021), suggesting that examining the combined DP and control group is a valid approach to examining individual differences associations. Based on previous work (Megreya & Bindemann, 2018; Towler et al., 2017), we hypothesised that better feature discrimination abilities, particularly with the eye region that contains many identity-diagnostic features (Abudarham et al., 2019) would be associated with better matching trial performance.
Materials and methods
Participants
Participants were between the ages of 18 and 70 years old (N = 70). Developmental prosopagnosics (DPs) were recruited from our database of previous DP participants in the Boston area, references from other research labs (Dr. Matthew Peterson, MIT; Professor Brad Duchaine, Dartmouth College, www.faceblind.org), and individuals who responded to our advertisement on the Massachusetts Bay Transportation Authority subway system. Control participants were recruited from both the Harvard Decision Science Laboratory in Cambridge, Massachusetts and through flyers distributed in the Boston area.
DPs were screened using the 20-Item Prosopagnosia Index (PI-20; Shah et al., 2015), a famous faces memory test (FFMT), and the CFMT (Duchaine & Nakayama, 2006b). To qualify as a DP, participants had to report lifelong face recognition deficits (all but three scored >65 on the PI-20, see Table 1), present with objective face recognition deficits on both the CFMT and FFMT (z ⩽1.5, as calculated from the control group in Duchaine & Nakayama, 2006b), and have an absence of significant neurological disorders (similar to our recent studies, e.g., Stumps et al., 2020). Typically developing controls did not report any face recognition deficits and all scored 45 or above on the CFMT. All participants had normal or corrected-to-normal vision and had to have scored within the normal range on the Leuven Perceptual Organisation Screening Test (L-POST; Torfs et al., 2014) to rule out other causes of poor face recognition. It should be noted that as the PI-20 measures the severity of face recognition difficulties and controls had to report no lifelong difficulties in face recognition, controls did not receive the PI-20. Informed consent was obtained for all participants prior to data collection according to the Declaration of Helsinki. Participants were compensated for their time at a rate of US$10/hr. The study was approved by the VA Boston Healthcare System and Harvard Medical School Institutional Review Boards, and all study tasks were completed at either the VA Boston Healthcare System in Jamaica Plain or the Harvard Decision Science Lab.
DP demographics, face recognition, and face matching performance compared with controls.
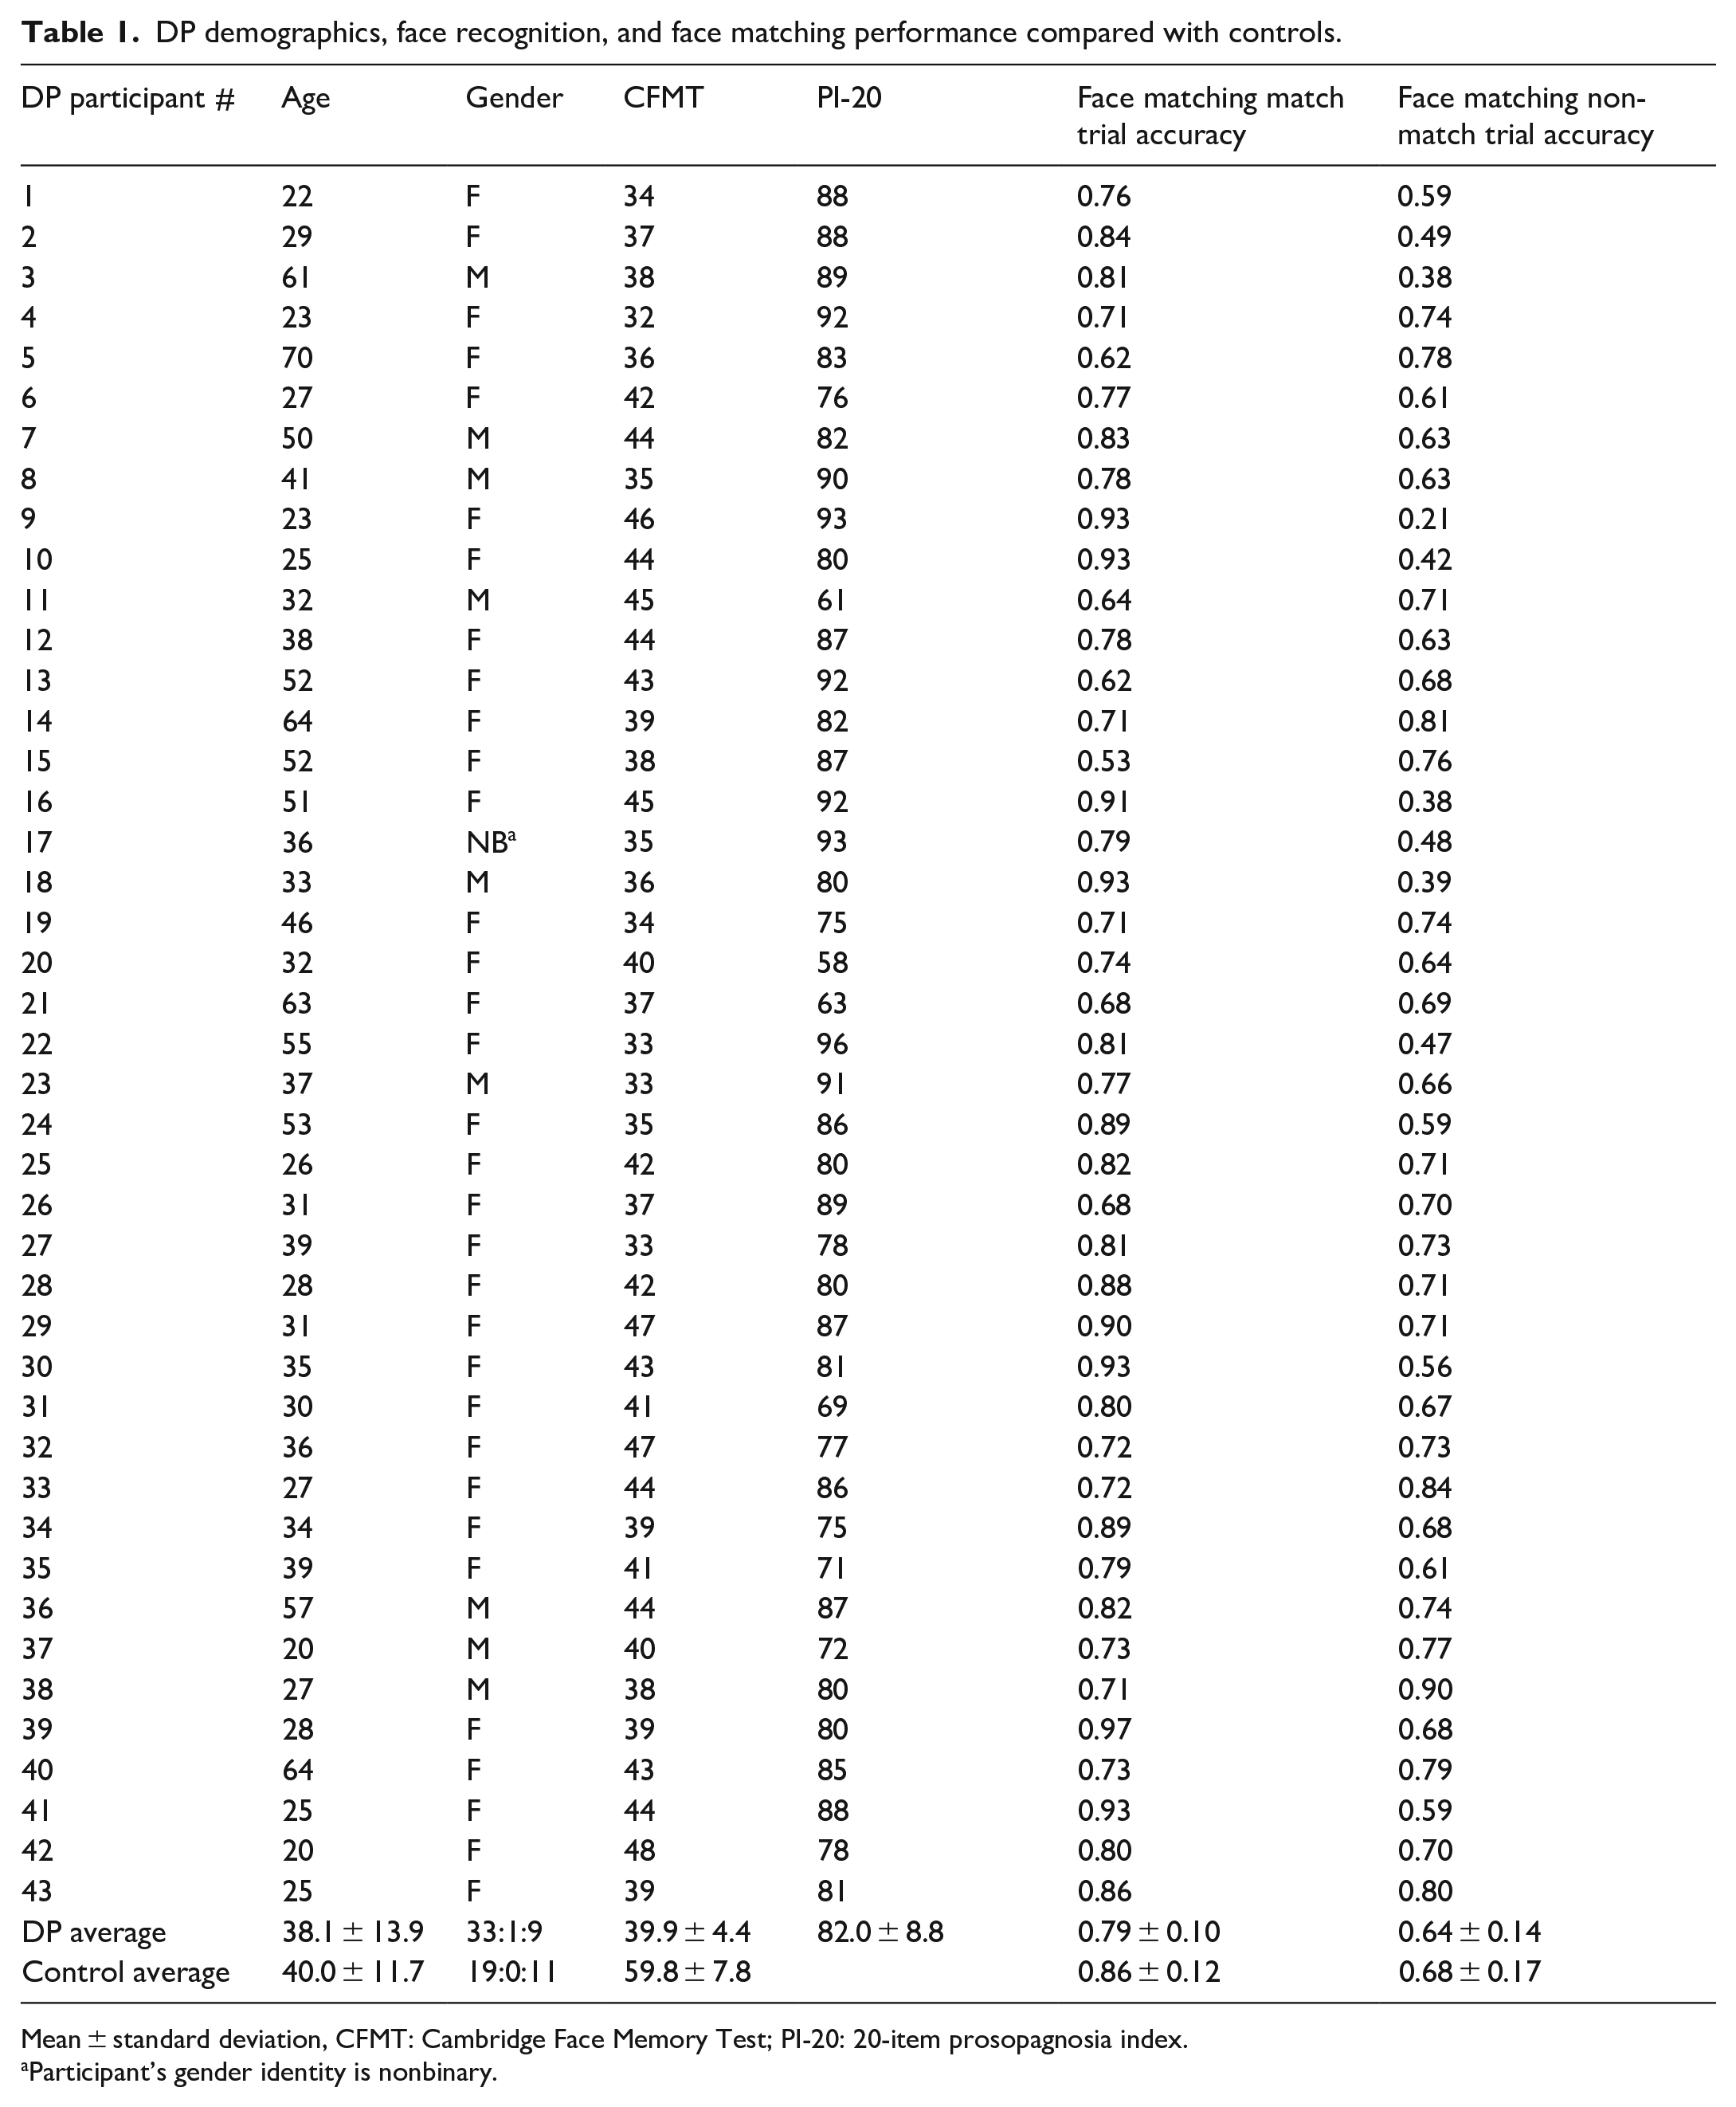
Mean ± standard deviation, CFMT: Cambridge Face Memory Test; PI-20: 20-item prosopagnosia index.
Participant’s gender identity is nonbinary.
Same/different face matching task
In this task, participants were presented with two face images on the screen side-by-side (4.5 cm × 6 cm each) for 3 s and had to indicate by pressing 1 or 0 whether the faces were the same or different identities, respectively. There was a 1-s inter-trial interval. We used neutral expression face images from the multi-PIE database (Gross et al., 2010) that we converted to greyscale and cropped to remove external features such as hair or clothing. Individual foil faces were carefully selected to be matched to each individual target face based on gender, age, ethnicity, and distinctive features (e.g., thin eyebrows, dark eyes). In particular, foil faces had very similar verbal descriptions to target faces in terms of their top three most distinctive features. There were seven different trial types: (a) same identity from front view (face images were taken on different days), (b) different identity from front view, (c) same identity with lighting change (fully lit vs. lit from the side), (d) different identity with lighting change, (e) same identity with viewpoint change (front view vs. 3/4 view), (f) different identity with viewpoint change, and (g) identical images with two different crops. There were 30 trials per trial type which were randomly intermixed for a total of 210 trials. The same identity and same day but cropped differently trials were included as an effort check. Participants were ~99% accurate on these trials and they were not included in the subsequent analyses.
Part–whole task
We used the version of the part–whole task from Tanaka et al. (2004), used with permission of Jim Tanaka, University of Victoria. Target faces were created using the outline of one Caucasian male face. By inserting a combination of six different pairs of eyes, noses, and mouths, six unique target faces were created. For whole trials, foil faces were created by switching one of the three facial features (eyes, nose, or mouth) with that of a different target face. For part trials, foil stimuli were an isolated facial feature (eyes, nose, or mouth) from another target face. Each trial began with a central fixation display presented for 500 ms. Next, one of the six target faces was centrally presented for 1,000 ms, and participants attempted to encode this face. Next, a scrambled face mask was displayed for 500 ms. During the subsequent test period, participants were presented with a pair of probe images side by side, either whole faces (whole trials) or isolated features (part trials). One of these images matched the target, and the other image was a foil. Stimuli remained on the screen until participants indicated with a button press which probe stimulus matched the target face (participants responded 1 for left image, 2 for right image). For whole trials, participants chose between the whole target face and a whole foil face, which was the same as the target face except that one of the features (eyes, nose, or mouth) was replaced with a foil feature. For part trials, participants chose between a face part from the target face (eyes, nose, or mouth) and the same facial feature from a foil face. On a given trial, participants were given no indication on which feature they would be tested, nor did they know whether isolated features or whole faces would be shown during the test period. There were 72 trials (36 parts trials and 36 whole trials), 24 for each feature type. We calculated the holistic advantage by first regressing the part trial “control condition” from the whole trial “condition of interest” (using the regression equation in the control sample, e.g., see DeGutis et al., 2013), and then applying this equation to calculate residuals for DPs and controls.
Georges task
The Georges task has been used in previous studies as a measure of the ability to discriminate feature identities and configurations (e.g., Malcolm et al., 2004; Pancaroglu et al., 2016). In the Georges face task, participants are presented with frontal views of three same-identity unfamiliar faces in a triangular arrangement for 2 s, with the lower two faces slightly offset horizontally. Two faces were identical and one had a single manipulation. These faces were manipulated in six ways. These six ways involved three categories of change: internal feature position, feature size, and external contour. Each category of change had one manipulation in the upper face and one in the lower face. To manipulate feature position, either the eyes were edited to be closer together or the mouth was edited to be higher on the face. To manipulate feature shape, the width of both eyes was increased or the vertical width of the mouth was increased. To manipulate external contour, the hairline was elevated or the chin was narrowed. Participants indicated which of the three faces differed from the other two using the left, right, and up arrow keys. There were 108 trials, with six different face identities.
Analyses
Sample size justification
Our sample size was guided by previous studies comparing DPs and controls (White et al., 2017) as well as individual differences studies (DeGutis et al., 2013; Rezlescu et al., 2017; Richler et al., 2011). White et al. (2017) found significant differences in face matching ability between controls and DPs with a sample of only 21 controls and 6 DPs. However, considering that DPs have been shown to be quite perceptually heterogeneous (Corrow et al., 2016), we wanted to include additional DPs in the current study to ensure that our findings would be robust and replicable. Unfortunately, our sample of controls was smaller than the DP sample due to not being allowed to run in-lab participants during the COVID-19 pandemic. To test for individual differences associations, we used a combined sample similar in size to studies that have found significant individual differences between feature and holistic processing and face recognition (N = 38, Richler et al., 2011; N = 43, DeGutis et al., 2013) as well as face matching ability (N = 80 in-lab, Rezlescu et al., 2017). Including both DPs and controls in our sample provided a more expanded range of face matching performance than simply examining an unimpaired population, which likely improved our ability to detect individual differences associations.
Analysis plan
To confirm that DPs showed overall deficits in face matching, we first compared DPs and controls in their overall face matching ability collapsed across match and non-match trials using accuracy and d-prime. To examine whether there were response bias differences (e.g., DPs responding “non-match” on the majority of trials), we also compared criterion c between the groups. Next, to test whether DPs showed a selective deficit on match trials, we compared DPs and controls in their overall match and non-match trial accuracy. We then proceeded to test whether match/non-match differences between DPs and controls varied by condition by performing a repeated-measures ANOVA on Group × Match/non-match × Condition (lighting change, viewpoint change, and front view conditions).
To examine how individual differences in match versus non-match trial performance relate to holistic processing as well as eyes/mouth processing, we calculated holistic processing from the part–whole task and focused on feature composites. We created composite measures for two reasons. First, the individual feature conditions were made up of a limited number of trials and had modest reliability (see Supplementary materials) and composite measures were employed to improve reliability, which is particularly important for individual differences analyses (e.g., DeGutis et al., 2013). Second, composites provide a summary measure of participants’ overall sensitivity to changes to a particular feature. Composites were created for eyes by averaging all part–whole eyes trials (whole and part) with Georges task eyes trials (eye size and width) and for mouths by averaging all part–whole mouth trials (whole and part) and Georges task mouth (mouth size and vertical position). Because knowing the reliabilities of measures is particularly important for individual differences research (i.e., knowing the reliability gives an indication of the maximum correlation between two measures), we calculated reliabilities of all measures using Cronbach’s alpha and Guttman’s lambda 2 (similar to DeGutis et al., 2013; Rezlescu et al., 2017). For eyes and mouth composite reliability, we used the Wang and Stanley (1970) composite reliability formula. We then ran correlations between holistic processing and eye/mouth processing and match and non-match trials. We also ran exploratory correlations between the other Georges (forehead, chin) and part–whole features. Because each of these features were only represented by a single condition (e.g., only changing the size or the position) and were therefore less reliable, we did not focus our main analyses on these features. We tested for differences between correlations for match and non-match trials by using Fisher’s r to z transformation and computing z-tests for dependent correlations. Finally, we ran exploratory multiple regressions using eye processing and holistic processing to predict overall face matching performance.
Results
Demographics and diagnostic test performance
Our sample consisted of 43 DPs (33 females, 1 nonbinary) and 27 controls (19 females) with a similar mean age of 38.07 (SD = 13.91) and 40.03 (SD = 11.69), respectively (see Table 1). According to the DSM-5 criteria of cognitive impairment (⩽1 SD below the mean on two or more tests for mild, ⩽2 SD for major), based on diagnostic face recognition measures our DP sample included 6 mild DPs and 37 major DPs. We conducted DP versus control group analyses excluding these 6 mild DPs and the results were very similar. Unsurprisingly, the entire DP group performed substantially worse than controls on the CFMT (DP M = 39.9 versus control M = 59.8) and to a lesser extent on the same/different face matching task (see Table 1). Note that the control CFMT M and SD was similar to the original Duchaine and Nakayama (2006b) study and there were only three controls with scores of 70 or above, suggesting that controls with very high face recognition abilities were not driving the results.
Comparing face matching performance between DPs and controls
Overall face matching performance collapsed across match/non-match trials
Before separately analysing match and non-match trials, we first sought to confirm that DPs were impaired in their overall performance on the face matching task and determine whether this varied by condition. Starting with accuracy, we ran a 2 (DP/control) × 3 (lighting change/viewpoint change/front view) ANOVA. We found a significant main effect of group, F(1, 68) = 9.40, p = .003,
Match versus non-match trial accuracy
We next sought to examine one of the main goals of this study, to test whether, similar to White et al. (2017), DPs’ face matching deficits were greater for match than non-match trials. As White et al. (2017) included various lighting and viewpoint changes in their face stimuli, we performed a Group × Match/non-match trial ANOVA collapsed across conditions. We found significant main effects of group, F(1, 68) = 9.95, p = .002,
One possible reason we did not replicate White et al. (2017) is that the match/non-match trial difference between DPs and controls varied as a function of the nature of the image changes in our lighting change, viewpoint change, and front view conditions. To examine this possibility, we conducted a 3-way ANOVA with Group (DP/control) × Trial type (match/non-match trials) × Condition (lighting, viewpoint, front view) and indeed found a significant 3-way interaction between group, trial type, and condition, F(2, 68) = 4.28, p = .016,
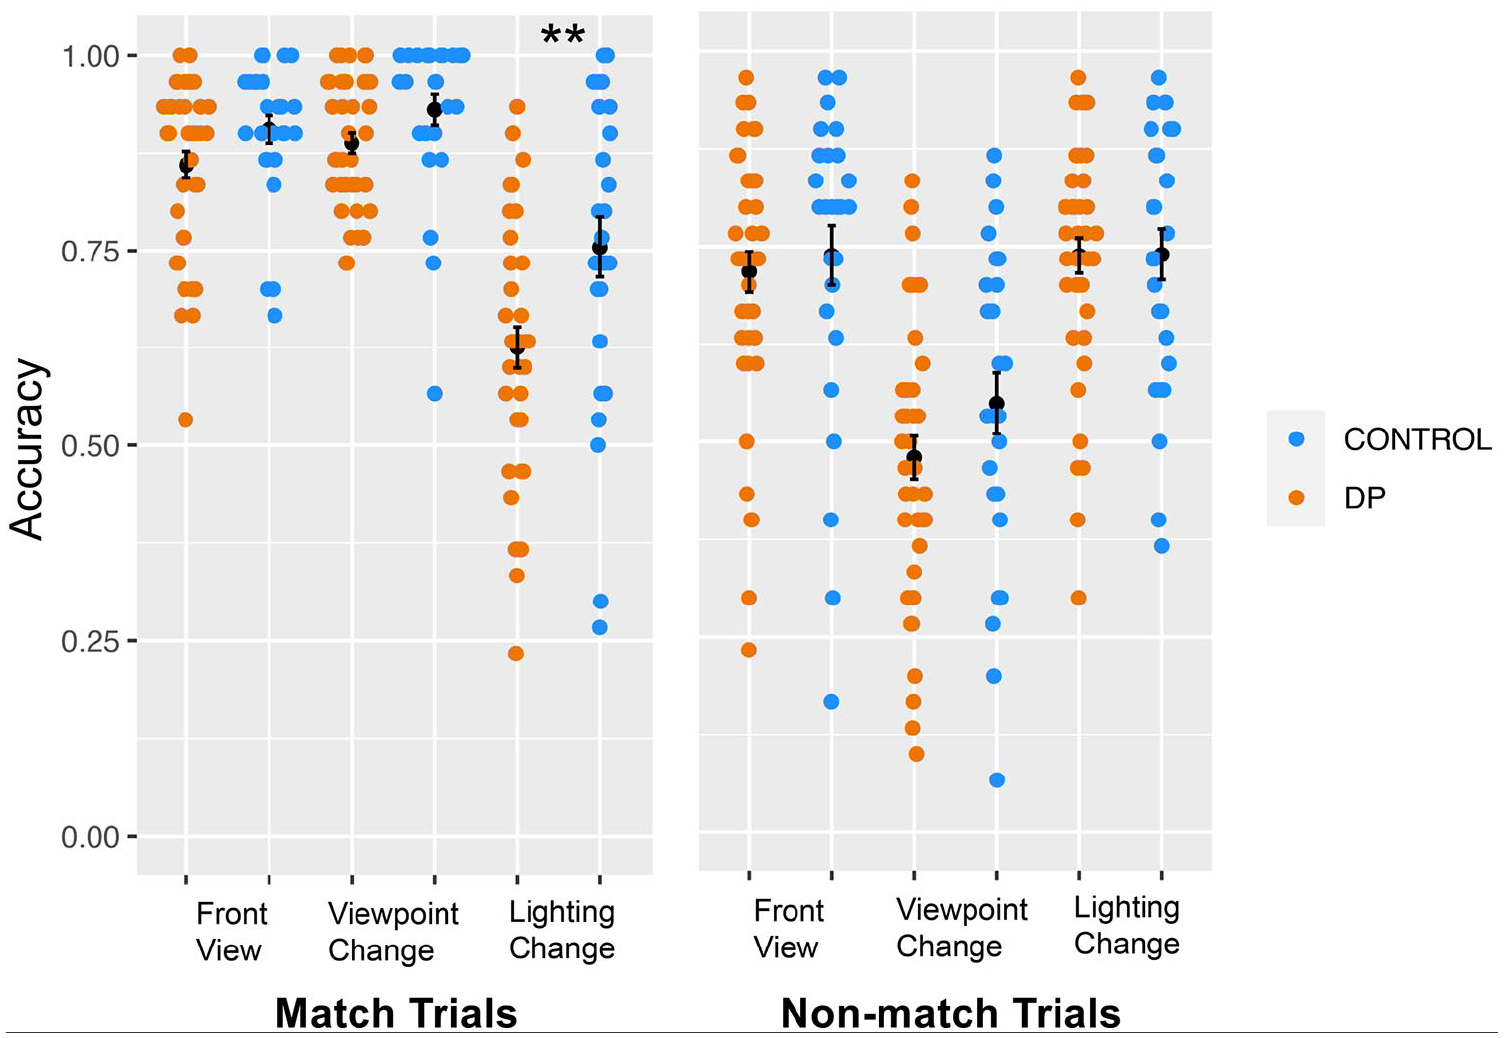
Match trial and non-match trial accuracy across front view, viewpoint change, and lighting change conditions in DPs and controls.
Match versus non-match trial reaction time
We next analysed reaction times to see if there was a Match/non-match × Group interaction (see Table 2). Two control participants were missing reaction times due to a computer error. Similar to previous studies (e.g., Ozbek & Bindemann, 2011), only correct trials were included in RT calculations. We conducted a 3-way ANOVA with Group (DP/control) × Trial type (match/non-match trials) × Condition (lighting, viewpoint, front view). We found a main effect of group, with DPs slower than controls, F(1, 66) = 14.09, p < .001,
Match trial and non-match trial mean reaction times in milliseconds (standard deviation) across front view, viewpoint change, and lighting change conditions in the control and DP groups.
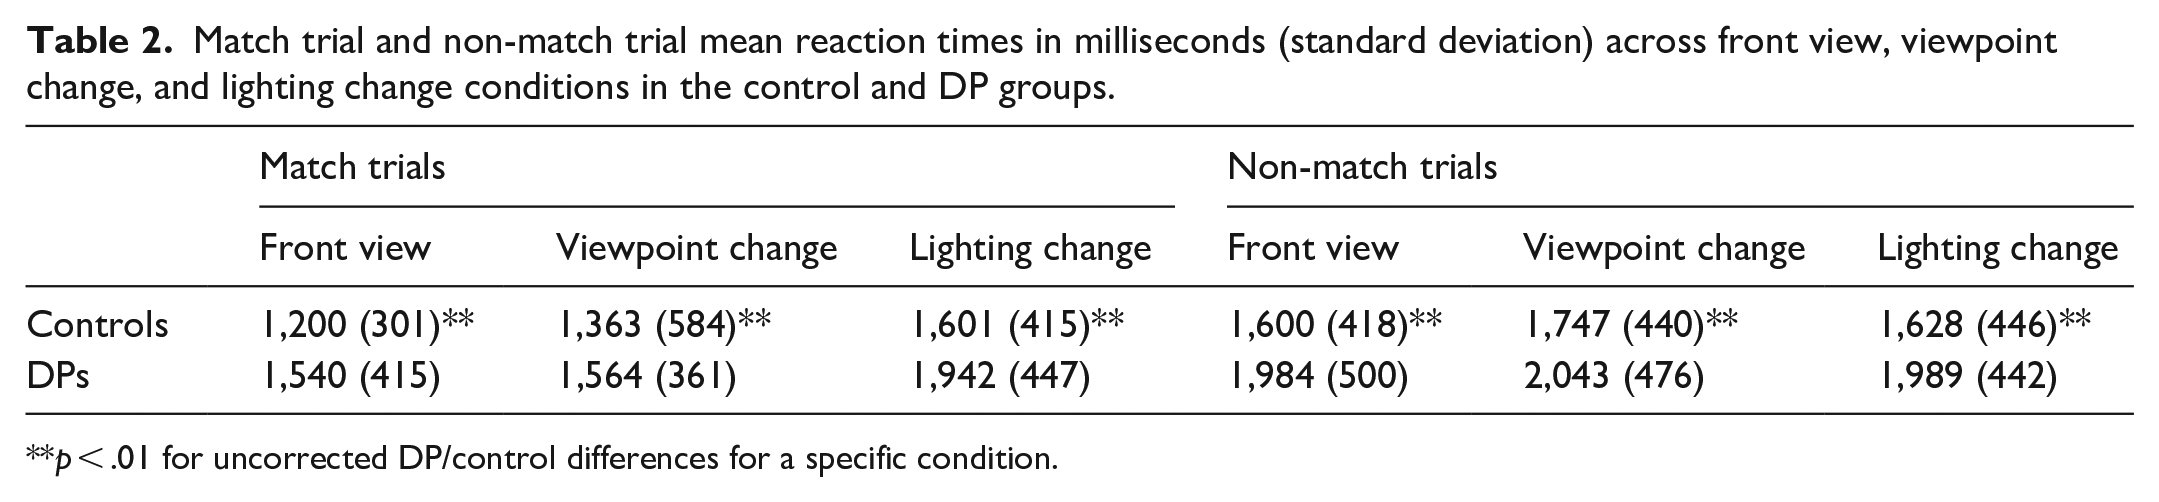
p < .01 for uncorrected DP/control differences for a specific condition.
Individual differences in feature/holistic processing associated with match/non-match accuracy
Reliability of measures
The second goal of the study was to measure associations between individual differences in feature and holistic processing abilities and match/non-match trials. Before quantifying these associations, we first wanted to determine whether our measures had adequate reliability. As can be seen in Supplementary Table 1, with regard to the face matching task, we found that the reliability was acceptable (.75 or greater) for overall accuracy (Cronbach’s α = .94/Guttman’s lambda 2 = .94), match trials (Cronbach’s α = .89/Guttman’s lambda 2 = .90), and non-match trials (Cronbach’s α = .92/Guttman’s lambda 2 = .93). The eye composite also had adequate reliability (Cronbach’s α = .71/Guttman’s lambda 2 = .75), whereas the mouth composite showed modest reliability (Cronbach’s α = .61/Guttman’s lambda 2 = .65). Finally, part–whole holistic processing residuals showed modest reliability (Cronbach’s α = .61/Guttman’s lambda 2 = .65), consistent with previous part–whole task studies (e.g., DeGutis et al., 2013; Rezlescu et al., 2017). However, this is quite good for a derived measure (i.e., residuals or subtraction scores), which typically have reduced reliability compared with measures of a single process.
Using these measures, we calculated the theoretical upper bound of the match/non-match correlations (similar to Verhallen et al., 2017). Computed as the geometric mean of the reliabilities of the measures being correlated (Schmidt & Hunter, 1996), the upper bound is the correlation that would be expected between these measures, once measurement error is taken into account, if their true correlation was 1.0. Using these reliabilities, we calculated the upper bound correlations for match trials with eye processing composite (Cronbach’s α: .79, Guttman’s lambda 2: .82) and holistic processing (Cronbach’s α: .74, Guttman’s lambda 2: .76). We also calculated upper bound correlations for non-match trials with eye processing composite (Cronbach’s α: .81, Guttman’s lambda 2: .84) and holistic processing (Cronbach’s α: .75, Guttman’s lambda 2: .78).
Performance on part–whole and Georges tasks
Before examining individual differences associations, we sought to validate that the part–whole and Georges tasks performed similarly to previous studies (e.g., Barton, 2008; DeGutis et al., 2013; Rezlescu et al., 2017). For the part–whole task, we focused our analysis on the whole trials after residualising out the part trial accuracy as our measure of holistic advantage, as this better reflects the proposed mechanism behind the part–whole task and has been shown to be more reliable than subtraction scores (DeGutis et al., 2013). We found that across all participants, there was significantly greater accuracy on the whole trials compared with part trials, t(69) = 6.37, p < .001. When comparing the holistic advantage residual scores between groups, we found that controls had a significantly greater holistic advantage than DPs, t(68) = 3.13, p = .003.
When analysing feature change accuracy on the Georges task, we replicated previous work showing that DPs perform worse than controls at discriminating internal features (Barton, 2008). We performed a 2 (group) × 6 (condition) repeated-measures ANOVA and found a main effect of feature, F(5, 335) = 10.38, p < .001, with more accurate performance across groups on the forehead size and poorer performance on the mouth size (see Supplementary Figure 2). We also found an interaction between feature accuracy and group, F(5, 335) = 5.10, p < .001, where DPs performed worse than controls at the eye size, eye spacing, and mouth spacing trials, while performing better than controls on chin trials (see Supplementary Figure 2).
In assessing internal facial feature processing abilities, to create the most reliable measures possible we focused on the average of the eyes and mouth conditions from the Georges task (combining both size and spacing trials) and eyes and mouth trials from the part–whole task. We did not assess nose trials from the part–whole task due to floor effects. When comparing DPs and controls on the eyes and mouth composite average, we found DPs performed worse than controls on the eyes (DP M = .65, SD = .11; control M = .75, SD = .12) and similarly on the mouth (DP M = .63, SD = .08; control M = .65, SD = .09). Performing a 2 × 2 ANOVA, we found a main effect of group, with DPs performing significantly worse than controls, F(1, 68) = 9.68, p = .003, a main effect of feature, with eye accuracy exceeding mouth accuracy, F(1, 68) = 14.42, p < .001, and a significant Group × Feature interaction, with DPs showing greater impairments on eye trials relative to the mouth trials, F(1, 68) = 5.12, p = .027.
Predicting match and non-match performance from feature and holistic processing
We began by correlating all the separate feature conditions with match/non-match trials separately for DPs, controls, as well as in the collapsed group (see Figure 2). Notably, with regard to the eye region, forehead, and holistic processing, DPs and controls demonstrated a very similar pattern of correlations with match/non-match trials, with DPs showing slightly stronger associations. This similarity between DPs and controls is consistent with recent findings showing that DPs and controls use very similar features to match facial identity (Abudarham et al., 2021). However, control participants’ mouth and chin trials correlated with match trials whereas DPs’ mouth and chin trial correlations were less consistent and were larger with non-match trials. Because of the inconsistency between DPs and controls in mouth associations, we chose to focus our individual differences analyses of the combined DP/control group on the eye composite and holistic processing. Furthermore, we found that the eye feature conditions were strongly correlated within DP, control, and combined DP/control groups whereas the mouth feature conditions were less correlated with each other (see Supplementary Tables 5–10).
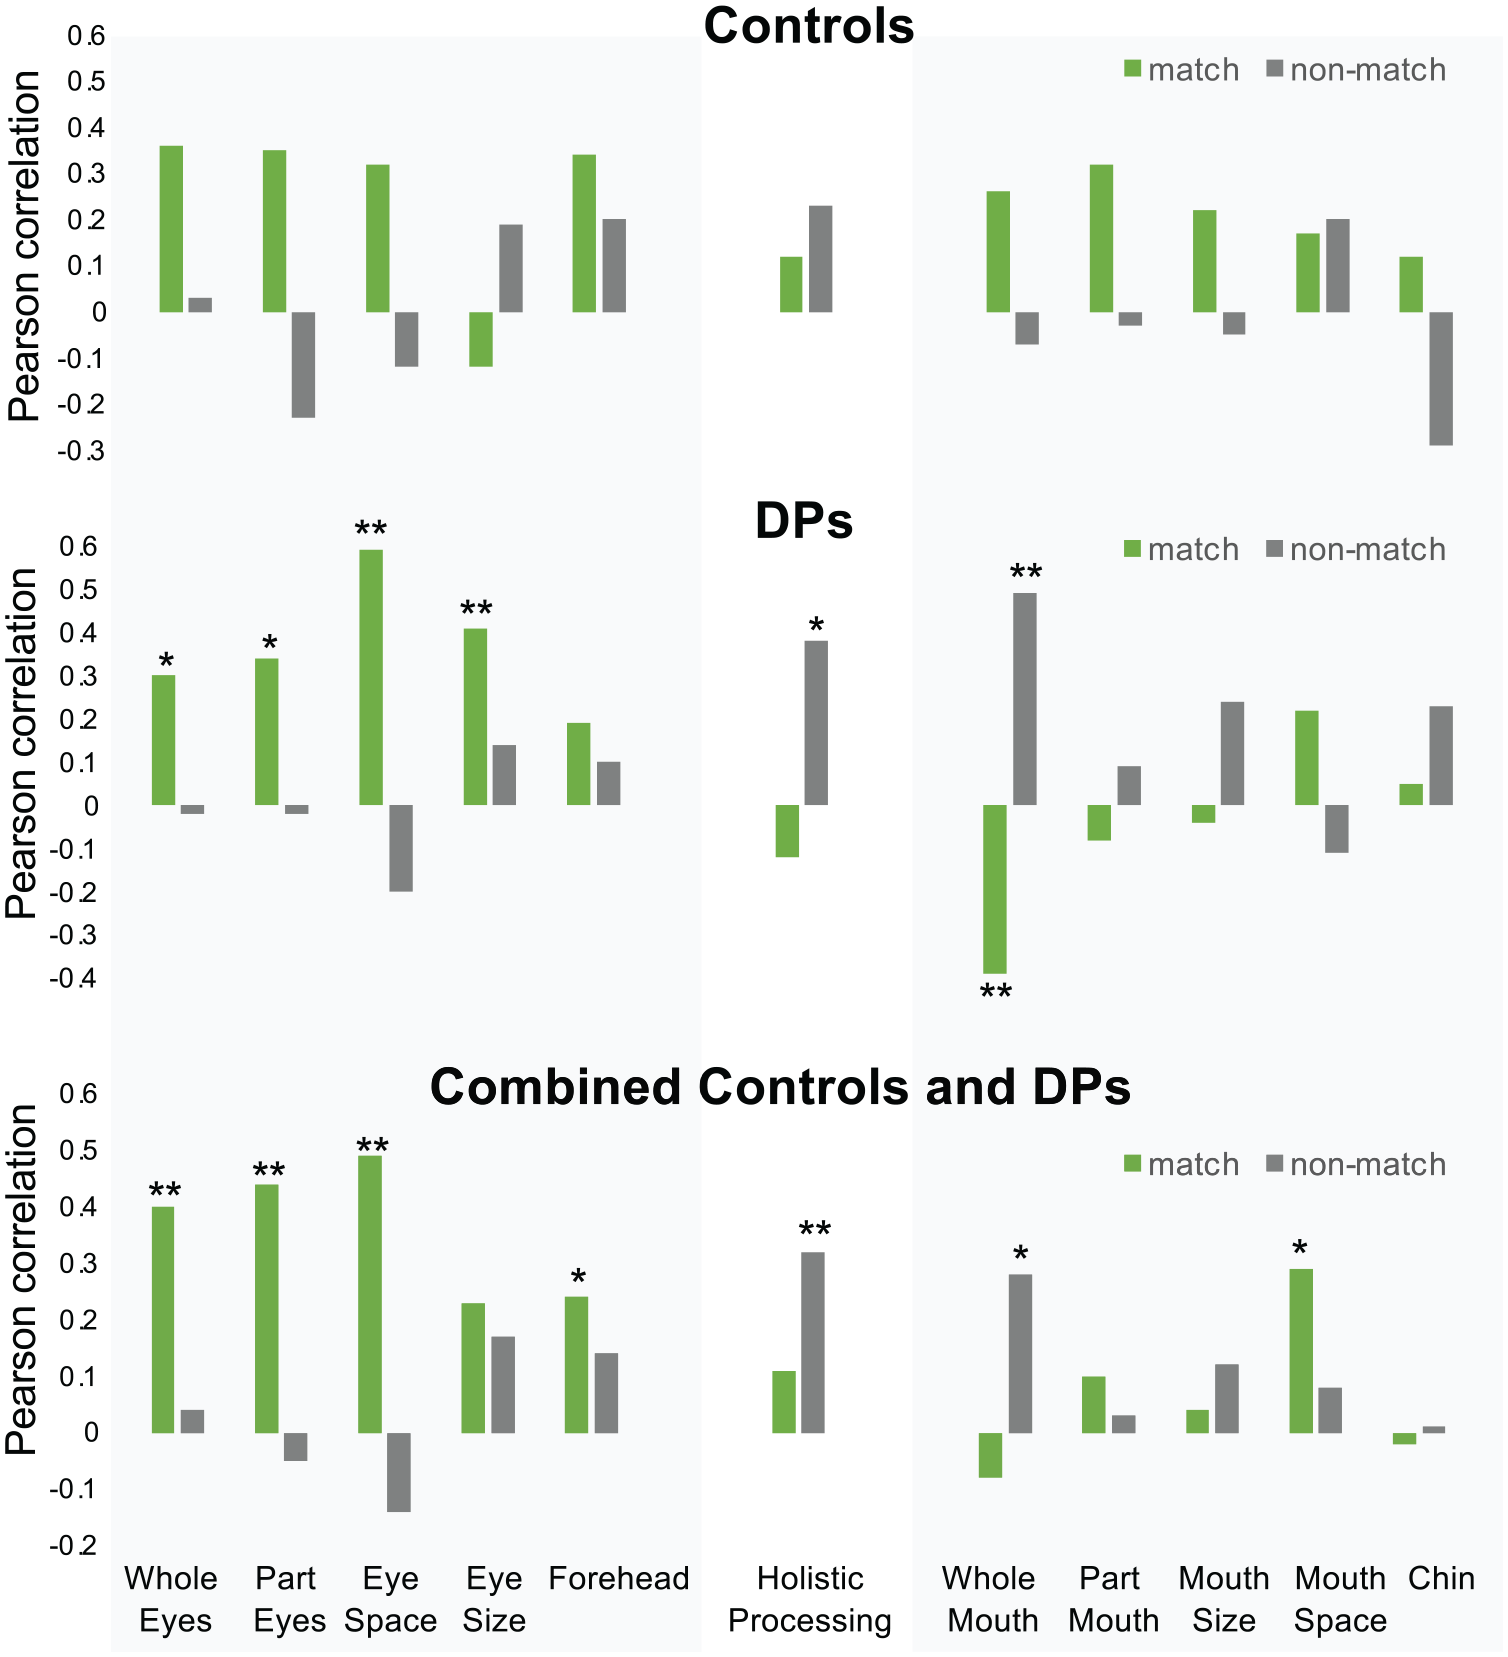
Match trial and non-match trial accuracy correlated with the different feature conditions and holistic processing for controls (N = 27), developmental prosopagnosics (DPs, N = 43), and the combined group of controls and DPs (N = 70).
We next separately examined match/non-match correlations in the combined DP and control group. As can be seen in Figure 3, for match trials we found a significant positive correlation between eye accuracy and match trial accuracy, r(69) = .482, p < .001, but did not find a significant correlation between holistic processing accuracy and match trials, r(69) = .108, p = .373. Notably, these correlation coefficients were significantly different from each other (z = 3.456, p < .001). For non-match trials, we found a complementary pattern, observing a significant positive correlation between holistic processing accuracy and non-match trial accuracy, r(69) = .320, p = .007, but no significant correlation between eye accuracy and non-match trials, r(69) = .027, p = .822. Again, these correlations were significantly different from each other (z = −2.564, p = .010). The observed correlation between eye processing/match trials and holistic processing/non-match trials are impressive when compared with their upper bound correlations (the maximum correlation one could observe considering measurement reliability) of .82 and .78, respectively. This suggests that, after correcting for measurement error, the correlation between eye processing and match trials is r = .588 and correlation between holistic processing and non-match trials is r = .410.
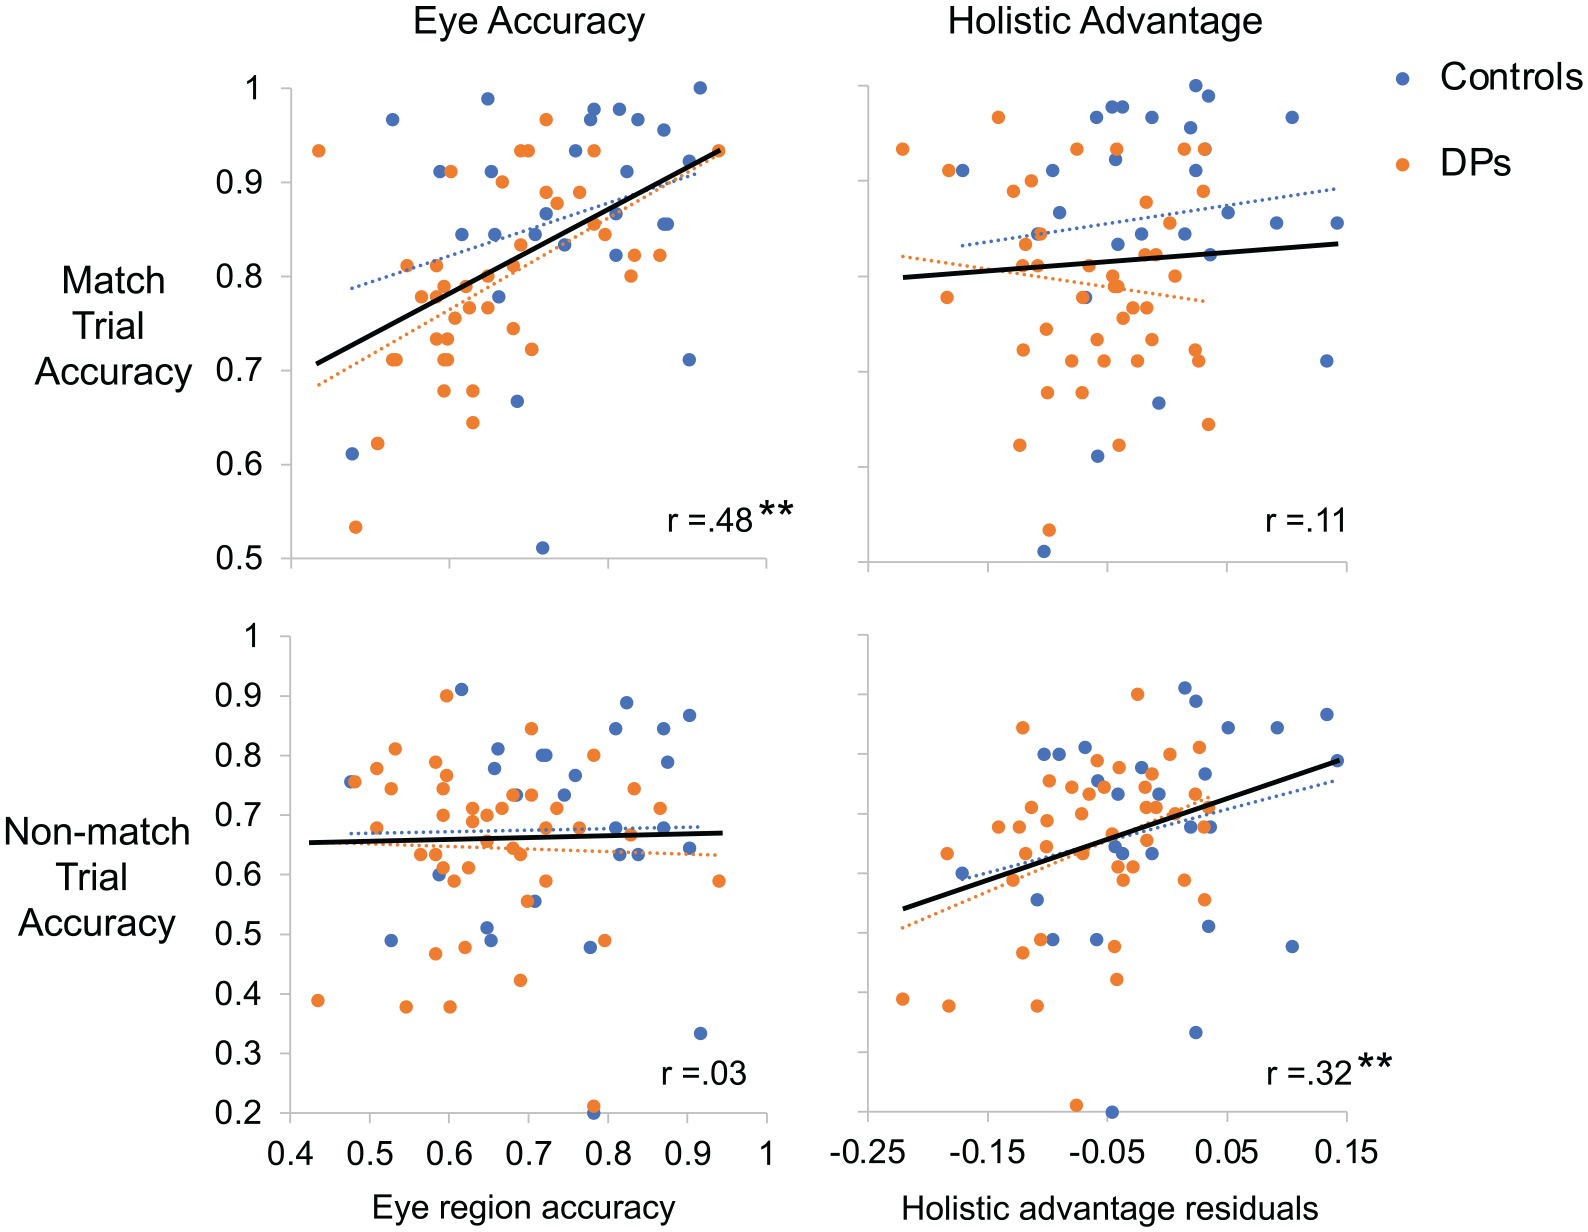
Average match trial and non-match trial accuracy correlated with either composite eye accuracy or holistic advantage from the part–whole task.
We next sought to examine the consistency of these relationships across conditions. We separately examined front view, viewpoint change, and lighting change conditions. We found a very similar pattern across conditions (see Figure 4) suggesting that these relationships are not specific to certain image variations.
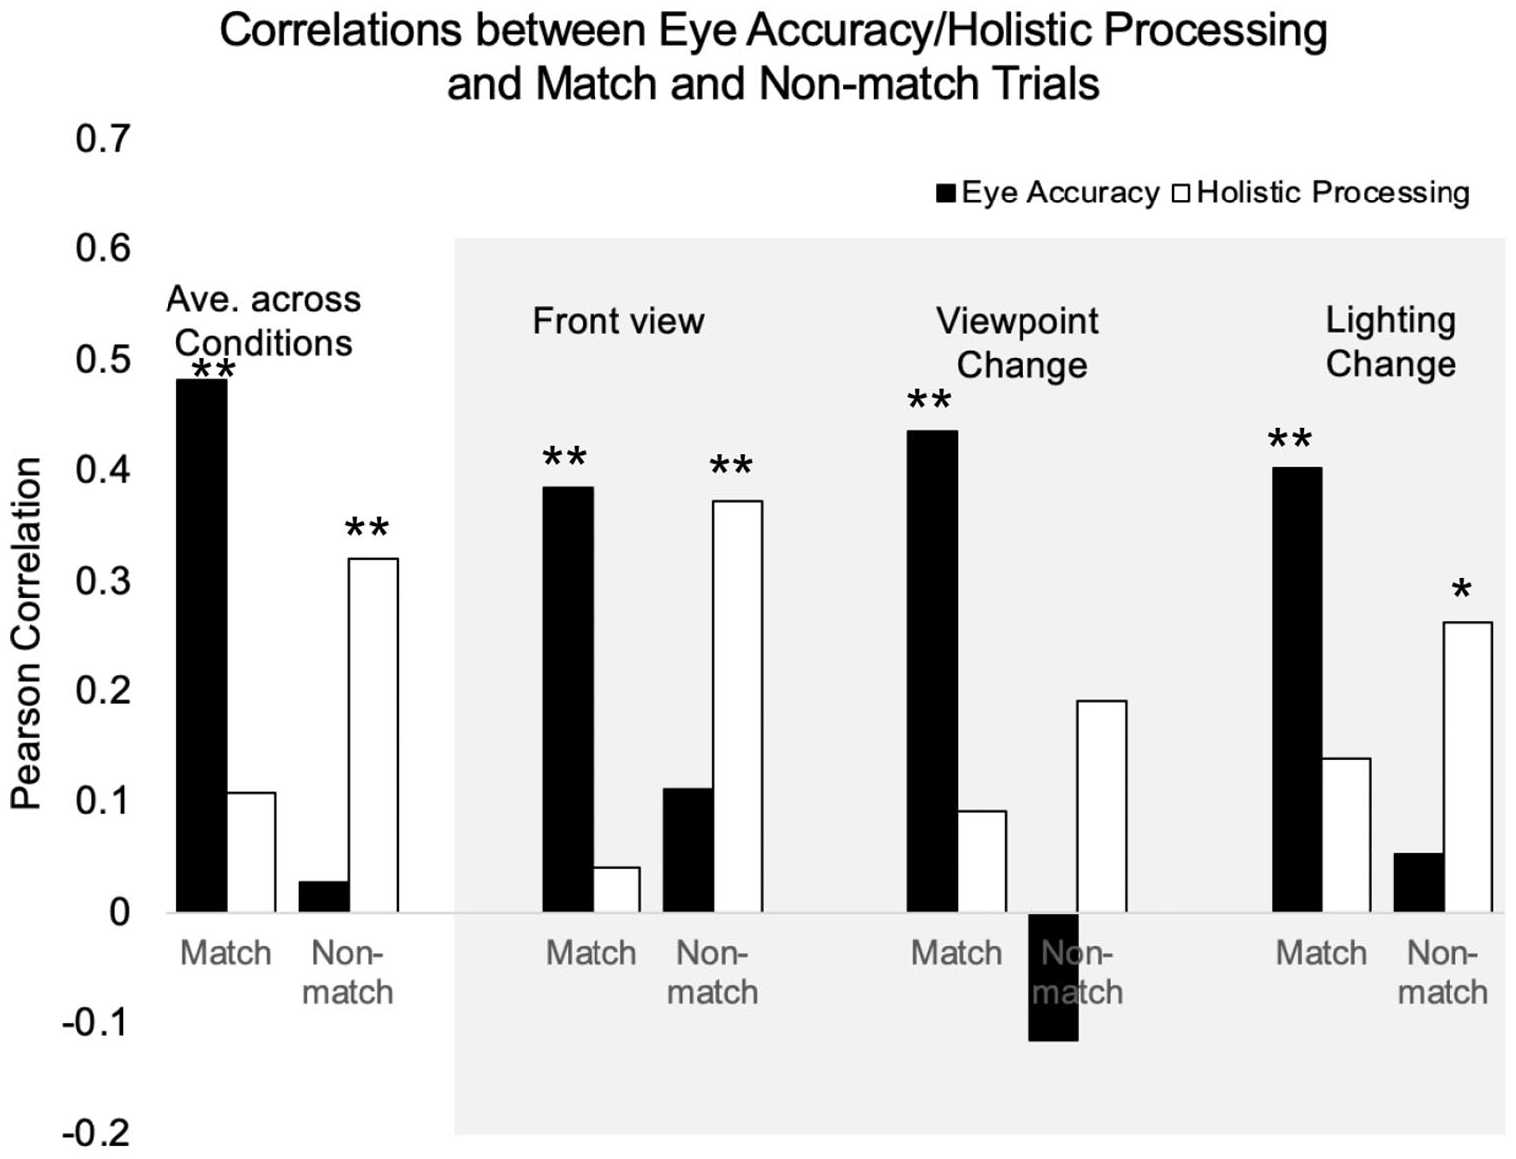
Match trial and non-match trial accuracy correlated with either composite eye accuracy or holistic advantage from the part–whole task for overall average, front view condition, viewpoint change condition, and lighting change condition.
Predicting overall face matching performance from eye processing and holistic processing
Because eye processing and holistic processing selectively predicted match and non-match performance, respectively, we sought to determine if these mechanisms uniquely predicted overall face matching performance and how much combined variance they predicted. In the first regression model predicting overall matching accuracy, we found that eye processing (t = 2.33, p = .023) and holistic processing (t = 2.26, p = .027) each significantly predicted unique variance and combined predicted 25% of the variance in matching accuracy, F(2, 67) = 11.19, p < .001. Similarly, when predicting overall d-prime, we found that eye processing predicted unique variance (t = 2.39, p = .02) and holistic processing trended towards predicting unique variance (t = 1.86, p = .067) and combined predicted 22% of the variance in d-prime, F(2, 67) = 9.66, p < .001.
Discussion
In the current study, we sought to better understand the mechanisms involved in match versus non-match judgements by studying individuals with face matching deficits and by examining individual differences associations between match/non-match trials and measures of feature and holistic processing. We recruited a large sample of 43 DPs and found that they had significantly worse overall face matching accuracy compared with controls. When examining match versus non-match trial performance, we found that DPs’ relative match versus non-match deficit depended on image variation condition, indicating that DPs do not consistently show match or non-match specific deficits. When examining individual differences associations predicting match and non-match performance across the entire sample of DPs and controls, we found a clear dissociation. In particular, match trials significantly correlated with eye processing ability but not holistic processing whereas non-match trials significantly correlated with holistic processing but not eye processing ability. Together, this suggests that matching same-identity faces relies more on the ability to detect differences in the eye region while discriminating different-identity faces relies more on holistic processing abilities. These findings have important implications for understanding face matching deficits in prosopagnosia as well as the mechanisms underlying face match versus non-match trial performance.
We found that DPs performed worse at face matching compared with controls, but we did not find that their impairment was specific to match trials, as previously reported in a small DP study (N = 6) by White et al. (2017). Interestingly, we found that DPs’ relative match versus non-match performance decrement varied as a function of the image matching condition, with no difference between match and non-match trials in the front view matching condition, a numerically larger deficit for non-match trials in the viewpoint change condition, and a trend towards a significantly larger deficit for match trials in the lighting change condition. This suggests that, as a group, DPs do not consistently show deficits specific to either match or non-match trials. This aligns with self-reports from DPs suggesting that they struggle with both matching identities and distinguishing identities (Murray et al., 2018). Although the results suggest that DPs generally do not have match or non-match specific deficits, our individual differences findings suggest that some DPs may be more likely to have deficits with match trials whereas others may be more likely to have deficits with non-match trials, depending on the individual underlying impairment(s). Specifically, our results suggest that DPs with worse eye processing abilities are more likely to have reduced performance on match trials whereas DPs with worse holistic processing abilities (and possibly worse mouth processing abilities) are more likely to have reduced performance on non-match trials. It would be informative in future studies to test whether DP interventions shown to improve holistic processing (e.g., DeGutis et al., 2014) or eye processing (e.g., oxytocin, Bate et al., 2014) would differentially enhance match versus non-match trial performance.
Beyond providing insights into DP, the current results provide compelling evidence that successfully matching same identity faces is associated with the ability to detect feature changes in the eye region but is not significantly related to holistic processing ability. This is consistent with studies showing that the eye region provides important identity diagnostic information (Royer et al., 2018) and that humans have high perceptual sensitivity to detect differences in the eye region between different identities for both familiar and unfamiliar faces (Abudarham et al., 2019). The current results extend these studies by showing that individual differences in eye region discrimination ability are specifically related to the ability to match images of the same identity.
Our findings showing a specific relationship between eye processing and match trials seem potentially at odds with instructional intervention face matching studies. For example, Megreya and Bindemann (2018) found that specifically instructing participants to pay attention to the eyes did not lead to improvements in matching same identity faces, although instructions to attend to eyebrows did. Further, Towler et al. (2021) found that instructions to pay attention to ears and markings improved non-match trials but not match trial performance. It could be that instructions to attend more to the eyes may not improve matching because most individuals may already be at ceiling in their attention to the eyes and that instructional interventions involving slightly less attended features (e.g., ears or eyebrows) may be more effective in improving overall face matching performance. For example, Ozbek and Bindemann (2011) showed that, during a face matching task, the average first fixation across participants was to the eye region. That being said, recent studies have shown that individuals reliably vary in their face preferential face fixation location (PFL, Peterson et al., 2013), the area where one generally fixates on a face, with some individuals having PFLs closer to the eye region and others closer towards the mouth. It would be interesting to examine how these PFLs relate to features used during match and non-match performance and if individuals with different PFLs respond more or less to instructional interventions.
The non-match trial results showed a complementary pattern to the match trial results, demonstrating a strong association with holistic processing abilities but little-to-no association with eye processing ability. This is consistent with a previous study that found greater holistic processing abilities, as measured by both the part–whole effect (similar to the current study) and face inversion effect, were associated with better overall face matching ability (Rezlescu et al., 2017). However, the face matching measure used in that study did not allow for separate analysis of match and non-match trials. This suggests that non-match trials may depend on analysis across the whole face in contrast to match trials, which may depend more on a feature-by-feature analysis and an accumulation of feature similarities with less regard for the overall facial gestalt. It may be that holistic processing provides enhanced sensitivity to the spatial configuration of features (Mckone & Yovel, 2009), which could be particularly useful for efficiently determining whether two face images are different identities when particular features are similar (e.g., in the current study, target and foil faces had generally similar verbal feature descriptions). Holistic processing abilities may be less useful for determining an exact match between images of the same identity because these judgements may rely more on matching the intricacies of diagnostic features.
There are several reasons why the current study is the first study, to our knowledge, to find a significant association between holistic processing abilities and non-match accuracy. First, previous studies have typically allowed participants unlimited viewing time during face matching tasks (e.g., Bindemann & Burton, 2020), which may foster a more feature-based approach over holistic processing. Indeed, when given unlimited time, unfamiliar face matching performance has often correlated highly with object performance (e.g., Burton et al., 2010), suggesting a more parts-based approach rather than a holistic approach. Notably, Rezlescu et al.’s (2017) face matching/holistic association was found using a matching task with time pressure. Relatedly, Ozbek and Bindemann (2011) found that match trial performance reached peak accuracy with a shorter viewing duration than non-match trials. With shorter viewing duration, comparing non-match faces feature-by-feature across all the features is challenging and holistic processing may allow for more features and their configuration to be efficiently concurrently compared. Another possible reason why holistic processing/non-match associations have not been previously observed could be because studies used the composite effect to measure holistic processing, which has failed to show significant associations with overall face matching accuracy (e.g., Konar et al., 2010; Rezlescu et al., 2017; Verhallen et al., 2017). Notably, Rezlescu et al. (2017) found significant face matching associations between the face inversion and part–whole effects but not the composite effect. This could either be because the particular version of the composite effect was less reliable than the part–whole and inversion effects (e.g., Rezlescu et al., 2017; Richler et al., 2014) or rather it measures different aspects of holistic processing. For example, the composite effect operationalises holistic processing as “a failure of selective attention” whereas the part–whole effect measures holistic processing as “the whole is greater than the sum of its parts” (Richler et al., 2012).
Perhaps unsurprisingly, eye processing and holistic processing each contributed unique variance and together predicted 25% of the overall face matching accuracy variance. The standardised betas of eye processing and holistic processing in the regression model were very similar, suggesting that these mechanisms are equally important for face matching accuracy. Notably, the current results suggest that eye processing and holistic processing are not competing mechanisms to one another in terms of their contribution to face matching, but rather seem to represent important complementary processes that underlie successful face matching judgements for the different trial types. The importance of both eye processing and holistic processing is consistent with studies of the N170 event-related potential, a face-selective marker of perceptual encoding (Bentin et al., 1996). The N170 has been shown to be both sensitive to processing eyes alone (Bentin et al., 1996; Itier et al., 2007; Nemrodov et al., 2014) as well as holistic face processing (Jacques & Rossion, 2010; Nemrodov et al., 2014). Similarly, fMRI has revealed that coordination between the face-selective occipital face area, which responds more to facial features (Henriksson et al., 2015), and the fusiform face area, which has been implicated in holistic processing (Andrews et al., 2010; Zhang et al., 2012), is important for face perception. Indeed, damage to either area or their connections can result in profound face perception deficits and prosopagnosia (Barton, 2008; Steeves et al., 2006).
Although the current findings are compelling, they have limitations that should be addressed in future studies. First, our individual differences sample included a large proportion of DPs, which increased the range of performance and likely improved our sensitivity to detect significant associations. Notably, rather than being a distinctly separate distribution from controls, we found that DPs’ perceptual performance across tasks greatly overlapped with controls, albeit slightly shifted towards impairment (as others have reported, Biotti et al., 2019). Yet, it would be important to replicate the current findings in a normally distributed control sample to better measure the strength of associations in the general population. In addition, it would also be important for future studies to measure feature processing beyond the eye region to understand whether the eye processing/match trial relationship represents a special case or a more general feature phenomenon. Also, we chose to present faces in our matching task for 3 s and it is unclear whether the current findings generalise to situations where people have less than 3 s to view an image (e.g., a rushed bartender) or situations where people have more than 3 s to view an image (e.g., forensic examiners). Using a similar task with both shorter and longer presentation times would be useful to understand how eye processing and holistic processing change in their contribution to match and non-match trials with viewing time. An additional limitation is that some trials from our face matching task included cropped images, which excluded the ears. This was done to prevent individuals from solely matching faces based on external features. However, this study should be replicated with uncropped images and more external feature abilities should be assessed to examine whether external feature abilities, such as with the ears, improves face matching as recent studies have suggested (e.g., Towler et al., 2021). Finally, we found individual difference associations that were similar across lighting changes, viewpoint changes, and front-view conditions for unfamiliar faces, yet it is unclear whether this would extend to familiar faces or other image translations and face variations, such as across emotions. This would be important to investigate in future research.
Conclusion
Overall, our findings provide novel evidence for distinct mechanisms involved in match versus non-match trial judgements. Although we did not find that DPs have specific deficits in matching images of the same person, our results clearly show that eye region discrimination ability is related to better match performance whereas enhanced holistic processing ability is related to better non-match performance. Future research would be useful to determine whether these findings generalise to more real-world face matching circumstances (e.g., passport control officers) and to further examine the complementary nature of eye processing and holistic processing in face matching tasks and perceptual abilities in general.
Supplemental Material
sj-docx-1-qjp-10.1177_17470218221076817 – Supplemental material for Distinct abilities associated with matching same identity faces versus discriminating different faces: Evidence from individual differences in prosopagnosics and controls
Supplemental material, sj-docx-1-qjp-10.1177_17470218221076817 for Distinct abilities associated with matching same identity faces versus discriminating different faces: Evidence from individual differences in prosopagnosics and controls by Amy Berger, Regan Fry, Anna K Bobak, Angela Juliano and Joseph DeGutis in Quarterly Journal of Experimental Psychology
Footnotes
Acknowledgements
The authors thank the developmental prosopagnosics and control participants for completing our challenging battery of tasks.
Declaration of conflicting interests
The author(s) declared no potential conflicts of interest with respect to the research, authorship, and/or publication of this article.
Funding
The author(s) disclosed receipt of the following financial support for the research, authorship, and/or publication of this article: This study was funded by R01 from the National Eye Institute grant #R01EY026057 awarded to J.D. A.K.B. is funded by the Leverhulme Trust Early Career Fellowship; Grant No. ECF-2019-416.
Data accessibility statement
Upon acceptance of the manuscript, all data will be made publicly available on Dryad in accordance with NIH policy and with the approval of the VA Boston Healthcare System and Harvard Medical School IRBs.
References
Supplementary Material
Please find the following supplemental material available below.
For Open Access articles published under a Creative Commons License, all supplemental material carries the same license as the article it is associated with.
For non-Open Access articles published, all supplemental material carries a non-exclusive license, and permission requests for re-use of supplemental material or any part of supplemental material shall be sent directly to the copyright owner as specified in the copyright notice associated with the article.