
Abstract
Vogt et al. (2011) investigated the role of goal-relevance in attention. Specifically, they induced the emotional state of disgust and showed an attentional bias (AB) to goal-related stimuli (i.e., cleanliness pictures) using the dot-probe task. In two experiments, we tested (a) an alternative interpretation and (b) the role of an important methodological feature of the dot-probe task. As the effect can be interpreted alternatively as affective counter-regulation (i.e., cleanliness-related pictures attracted attention because they are positive in the negative disgust state), we added positive stimuli to test whether the AB in the disgust state extends to these stimuli. In Experiment 1, we used the location dot-probe task. That is, participants had to categorise the location of the target. It can be argued that this task confounds attentional processes with response priming processes. In Experiment 2, we used a discrimination dot-probe task, that is, participants had to categorise a target feature that varied orthogonally to location, thus eliminating the confound. In Experiment 1, we did not replicate the effect of emotional state on AB for cleanliness stimuli, whereas in Experiment 2, we did. Mean AB scores for positive stimuli were not affected by emotional state. Two conclusions were drawn: First, the result of Experiment 2 supports the motivational account of Vogt and colleagues. Second, the results support the use of the discrimination task for both theoretical reasons (i.e., effects can be more clearly interpreted as based on attentional processes) and empirical reasons (i.e., the location task did not replicate the expected pattern).
Many researchers emphasise the effects of current goals on attentional processes, especially that goal-relevant stimuli capture attention (Brosch et al., 2008; Folyi et al., 2020; Wentura et al., 2014). In previous studies, the goal-relevant processes typically were manipulated by changing contextual or situational parameters such as the motivational outcome focus (e.g., wins or losses; Wentura et al., 2018) or participants’ physiological needs such as hunger or thirst (e.g., Tapper et al., 2010). In addition to these manipulations, goal-directed processes can be caused by emotion itself (e.g., Moors et al., 2017; Roseman, 2001). For example, fear triggers the goal of reaching safety. To achieve this goal, it will be adaptive to quickly detect threat stimuli and seek a safe environment (Roseman, 2001). However, a few studies examined the effects of goals on the attentional process directly by experimentally varying the motivational state (e.g., Vogt et al., 2017).
An important step forward was the study by Vogt and colleagues (2011), who hypothesised that actual motivational goals induce ABs for goal-related stimuli. Specifically, they examined ABs to cleanness-related stimuli (e.g., a washbasin) induced by the motivation to get rid of hand contamination. According to the motivational account, cleanliness stimuli are instrumental in achieving this goal, whereas disgust stimuli represent an additional burden that may need to be monitored to be avoided (Derryberry & Tucker, 1994). Thus, in this study, the authors defined both cleanliness and disgust stimuli as goal-relevant.
After participants were induced into a disgusted (versus neutral state) by touching disgusting materials, they completed a dot-probe paradigm as a tool to assess ABs. On each trial, they were presented (briefly) with pairs of cue pictures: either a disgusting versus a neutral picture or a cleanliness-related versus a neutral picture. The cue pictures were followed (with a cue-target onset asynchrony of 350 ms) by a target that either replaced the disgusting, the cleanliness-related, or the neutral picture. The target location (above or below fixation) had to be categorised (location task). In line with the literature on the dot-probe paradigm, the authors argue that faster responses to targets that replace the disgusting or cleanliness-related picture relative to the neutral picture indicate an AB towards disgusting or cleanliness-related stimuli, respectively.
Contrary to the authors’ expectations, they observed an AB towards disgusting pictures regardless of the emotional state. This result does not clearly indicate whether ABs are driven by goal relevance; however, it can be explained by the existing literature on biases towards aversive stimuli (Öhman et al., 2001). Most importantly, however, the results showed an AB towards cleanliness-related images that were restricted to the disgust condition. The authors suggested that the attentional shift to cleanliness pictures was motivationally caused by the disgust condition; they emphasised the importance of the effects of current goals on attention.
However, the authors acknowledged that alternatively, a process of affective counter-regulation could be responsible for the main finding. This mechanism means that ABs respond to current motivational states in a counter-regulative way (Rothermund, 2011; Rothermund et al., 2008; Wentura et al., 2018). That is, in a negative affective-motivational context, there is a stronger bias towards (generally) positive stimuli (compared with negative ones), whereas in a positive affective-motivational context, the bias towards (generally) negative stimuli is stronger. This incongruency effect of ABs functions to prevent affective-motivational escalation. Evidence for a counter-regulation mechanism has been found for motivational manipulations, such as anticipating gains versus losses or failures versus successes (Rothermund et al., 2011; Wentura et al., 2018).
Counter-regulation has also been investigated via induced emotional states. For example, Schwager and Rothermund (2013) reported that in a negative emotional state, participants recognised positive words more accurately than negative words in a visual search task; this asymmetry was numerically reversed in a positive emotional state. In a subsequent experiment, a comparable incongruency effect was found in the emotional Stroop task. These results suggest that counter-regulation mechanisms may also be triggered by emotional states (for further evidence, see Greving et al., 2015; Schwager & Rothermund, 2014; Zhang et al., 2016). Thus, the AB towards cleanliness-related stimuli in a state of disgust (as found by Vogt et al., 2011) may alternatively result from a counter-regulation process (Rothermund et al., 2008; see also Schwager & Rothermund, 2013). We acknowledge that Vogt and colleagues could argue against this alternative on two levels: First, the alternative explanation loses some plausibility when the cleanliness results of Vogt et al. (2011) are interpreted in line with other studies in their research programme. For example, Vogt et al. (2017) found that an initially neutral stimulus attracts attention in an aversive state when responding to this stimulus (apparently) helps to reduce the aversive state (“instrumental safety signal”). An explanation of this as counter-regulation (i.e., the stimulus became positive and therefore attracted attention) can be countered by the result of another experiment in which a particular stimulus functioned as both a threat signal and an instrumental safety signal; this stimulus also attracted attention. However, applying the counter-regulation assumption to the cleanliness results means questioning the analogy to the later results (which were obtained in a different experimental setting).
Second, Vogt and colleagues (2011) already argued that their results fit better with a motivational goal-relevance account than with a counter-regulation account because the AB was found for both negative (i.e., disgusting) and positive (i.e., cleanliness-related) stimuli in the disgust state. Although this is certainly a plausible argument, one can still debate whether the specific congruency in content—that is, the presentation of disgusting stimuli in a disgusting emotion condition—might have enhanced a specific disgust bias in this condition (e.g., caused by semantic activation), whereas a more general negativity bias might have decreased due to the counter-regulation mechanism. Therefore, it is worth replicating the study of Vogt and colleagues (2011), while adding generally positive stimuli as a control for the cleanliness pictures. Thus, our primary goal was to examine whether the bias is driven by goal-relevance processes (motivational effects) or by a counter-regulation mechanism.
In summary, we examined the AB to cleanliness stimuli in a disgusted emotional state. This bias could be a motivational effect, as suggested by Vogt and colleagues (2011). However, this bias might be a counter-regulation effect (Rothermund et al., 2008; Schwager & Rothermund, 2013). To investigate this issue, we included a positive stimulus condition in our experiments.
In all aspects, we closely followed the experiment by Vogt and colleagues (2011). A priori, we should highlight one detail of Experiment 1 that differs from our own earlier research with the dot-probe paradigm (Wentura et al., 2024; Wirth & Wentura, 2018, 2020). As mentioned above, Vogt et al. used the location task (i.e., the location of the target has to be categorised). Although often used in dot-probe research, the location task can be criticised for confounding processes of an AB with response priming. The location cueing task might induce response preparation because the location feature (i.e.., right/left) of the critical cue (i.e., the disgust picture) is either compatible or incompatible with the target-related response. We will elaborate on this issue in the “Discussion” section of Experiment 1. Therefore, in our previous research, we used a discrimination task (i.e., the target had to be categorised according to a binary feature orthogonal to the location). In Experiment 1, we used the location task because of replication concerns; however, in Experiment 2, we used the discrimination task to investigate potential task confounds.
Experiment 1
We preregistered Experiment 1 on aspredicted.org. The preregistration can be accessed via the following link: https://aspredicted.org/B4Z_6RM.
Method
Participants
The sample size was calculated based on the between-participants difference in the AB score for the cleanliness-related stimuli between the disgust and the neutral group found by Vogt et al. (2011). In their experiment, the AB towards cleanliness pictures was M = 9 ms, SD = 20 ms, in the disgust condition and M = −1 ms, SD = 15 ms, in the neutral condition. Taking these values—except 0 ms instead of −1 ms for the expected null bias in the neutral condition—results in an effect size of d = 0.51 (i.e., roughly a medium effect of d = 0.5). To detect an effect of d = 0.50 with a power of 1 − β = .95 (α = .05, two-tailed), N (= 2 × 10⁵) = 210 participants were required for the experiment (G*Power; Faul et al., 2007). With N = 105 for the subsamples, the cleanliness effect (dz = 0.45 in Vogt et al.) in the disgust condition can be detected with 1 − β = .995, (α = .05, two-tailed). If counter-regulation processes cause the cleanliness effect, we also expected to find a corresponding pattern for positive pictures. Therefore, the same power analyses apply to the positivity effect. Besides, the disgust effects (dz = 0.39 for the disgust condition; dz = 0.43 for the neutral condition in Vogt et al.) can be detected with 1 − β = .98 and 1 − β = .99, respectively (α = .05, two-tailed).
We initially aimed to recruit a total of N = 230 participants to account for potential outliers. However, we had to increase this number to N = 297 because we had to discard more participants than expected due to our preregistered exclusion criteria (see below).
The study was conducted via the online platform Prolific (www.prolific.co). Vogt and colleagues (2011) recruited solely female participants because disgust could be more easily elicited compared with males. Therefore, we recruited only female participants as well. We restricted the age range of 18–35. All participants were from resident in the United States or the United Kingdom. To present stimuli with the same size as in Vogt and colleagues’ experiment, we recruited participants with a standardised screen size (at least 15.6 inches or larger).
There were three exclusion criteria for our final data set. Similar to Vogt and colleagues (2011), we excluded participants with a disgust level of below 5 on a 9-point scale in the disgust condition (n = 18). In addition, participants with an accuracy rate below 75% in the dot-probe paradigm were excluded (n = 5). Besides these criteria, participants with an accuracy rate below 70% in an attention control task (i.e., the “number task,” see “Procedure” section for explanation; n = 56) were excluded. The final sample included 218 participants (NNeu = 108; NDis = 110) and they received £2.7 for participation. Median age was 23.0 years (range from 18 to 35 years).
Design
This study followed a 2 (emotional state group: disgust vs. neutral) × 2 (cue validity: valid vs. invalid) × 3 (emotional cue: cleanliness-, disgust-, general positive-related) mixed factorial design. The emotional state group was a between-participants factor, while emotional cue and cue validity were varied within participants.
Materials
Imagination text for emotion elicitation procedure
We used an imagination procedure to induce a disgust (or neutral) emotion. For the disgust condition, we adapted a text from Jabbi et al. (2008) about cleaning a toilet and touching faeces (see Supplementary Material). In addition to the text, participants were asked to put some creamy material (either mustard sauce, pesto sauce, or dark jam) on their hands. We expected that coloured sauces (Curtis et al., 2004) and wet forms (Oum et al., 2011) could be associated with faeces. Thus, we aimed to increase the vividness of imagination and the motivational effect of disgust (i.e., trigger to wash one’s hands). In the neutral condition, the text described using hand cream on their dry hands after being outside on a rainy and windy day (see Supplementary Material), and participants were asked to put some hand cream on their hands.
To validate the procedure, we conducted a pilot study on the online platform Prolific (N = 80). Results are reported in Supplementary Material. In a nutshell, participants in the disgust condition had markedly higher disgust ratings compared with the neutral condition. A comparison between a group that was asked to imagine only the disgusting situation and a group that was additionally asked to apply a creamy substance to their hands revealed a higher motivation to wash their hands in the latter group.
Selection of emotional pictures
We used the same pictures as Vogt et al. (2011) for disgust (e.g., a dirty toilet, vomit, and insects; 10 pictures), cleanliness (e.g., washbasin, waterfall, and soap; 10 pictures) and the neutral category (e.g., a bus, a hair dryer, and mushrooms; 10 pictures). We added 10 positive pictures to assess a possible positivity effect. Moreover, we had to add 20 more neutral pictures to balance repetition for all categories (see “Procedure” section). All positive and additional neutral pictures were taken from the International Affective Picture System (IAPS; Lang et al., 2008) and the Open Affective Standardised Image Set (OASIS; Kurdi et al., 2017). 1 When selecting positive images, care was taken not to include images with water so as not to signal cleanliness. Instead, positive pictures contained, for example, cute animals, happy couples, food, and flowers. We also attached importance to balancing the amount of human and non-human content in the positive and new neutral pictures. The complexity, contrast, and luminance values of the images were calculated using the R Imagefluency package (Mayer, 2021) to ensure that these visual properties were matched between stimuli categories (for analyses, see Supplementary Material).
Procedure
We announced that a small amount of creamy material needed to be used depending on the experimental condition to participate in the study, so we asked participants to have one of the specified materials on hand. Participants were informed of their assigned emotional condition at the beginning of the study. They were asked to turn off all audio and video devices. Presentation sizes of stimuli were calibrated using a credit card (or any card of the same size) as a reference; participants had to adjust the size of an image on their screen until it matched the size of the actual credit card. They then completed a consent form and started the main phases of the experiment.
There were three main phases: practicing the dot-probe, the emotion elicitation procedure, and the dot-probe paradigm.
Practice phase
The practice task was described to participants as a separate stage of the experiment, similar to Vogt et al. (2011). Participants completed a word dot-probe task with 72 trials. In each trial, animal-related (bird, fox, etc.) and sport-related words (baseball, glove, etc.) were presented simultaneously as a cue. The words were taken from Sutton and Altarriba (2011). The procedure remained exactly the same as in the main dot-probe phase (reported below), except that two words were presented as cues instead of two pictures. In addition, to improve learning of the dot-probe task, participants received feedback on their response accuracy and timing after each trial during this phase.
Emotion elicitation procedure
Participants read a text and were instructed to imagine the described situation; the text had either disgusting or neutral content, depending on the emotional condition to which participants were assigned (see Supplementary Material). Although reading the text, participants in the disgusting group also applied either mustard sauce, pesto sauce, or dark jam to their hands, whereas participants in the neutral condition used hand cream. We encouraged them to try to evoke the target emotion based on the procedure by Vogt et al. (2011; see also Marzillier & Davey, 2005). This phase lasted 60 seconds; afterwards, participants rated their current level of disgust (1 [“not at all”] to 9 [“very much”]).
Dot-probe task
Then, participants completed the dot-probe task. Figure 1 illustrates a typical trial in the location dot-probe task. Each trial started with a fixation point presented for 500 ms, which remained at the centre of the screen throughout the trial. An emotional cue (disgusting, cleanliness-related, or positive) and a neutral cue were presented above and below the fixation point. Pictures had a size of 9.3 cm × 7.1 cm. Cues were presented for 350 ms. Subsequently, a square as a target was presented at the top or bottom location until a response was given. Participants were asked to categorise the target location as above (“S”) or below (“L”) the fixation point. The inter-trial interval was 200 ms. Participants were instructed to look at the fixation cross throughout all trials.
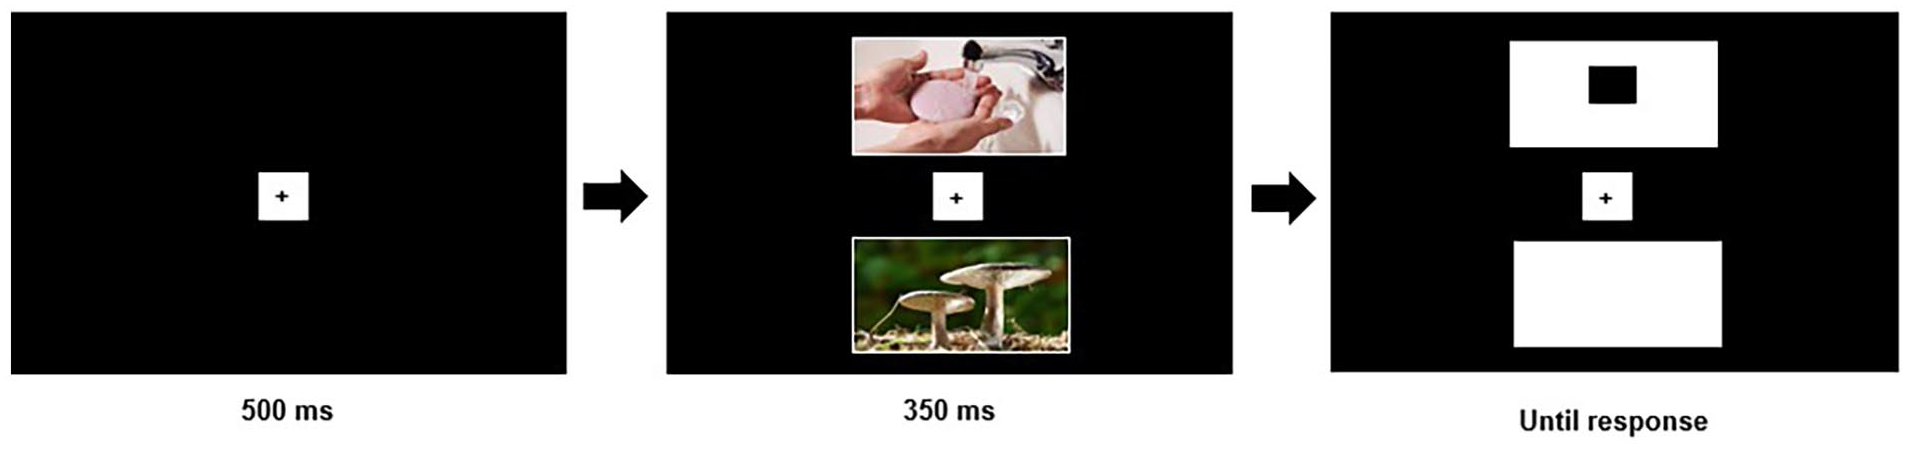
The example of location dot-probe task.
The dot-probe task also included ten number trials. In these trials, the fixation cross was followed only by a randomly selected number between 1 and 9 (except 5) at the fixation location. The numbers were presented very briefly (100 ms). Participants indicated whether the number presented was above 5 or below 5 by pressing either the “S” or “L” keys, respectively. Vogt et al. (2011) used these trials to reduce participants’ strategic monitoring of one area of the screen. They did not have any exclusion criteria regarding performance on these number trials. However, as our experiment was conducted online, we wanted to ensure that participants were looking at the centre. For this reason, we instructed them to reach a high accuracy rate on the number trials. 2
The task consisted of 250 trials, with 240 trials for the dot-probe task (80 disgust-neutral trials, 80 cleanliness-neutral trials, and 80 positive-neutral trials) and 10 number trials. The AB score was calculated by subtracting reaction times on valid trials (emotional cue and target were at the same location) from reaction times on invalid trials (emotional cue and target were at opposite locations). There were an equal number of valid and invalid trials for each stimulus category. In addition, each emotional picture was presented equally often at the top and bottom positions and in valid and invalid positions. Finally, each picture was presented only once every 30 trials; therefore, we needed 30 neutral pictures (see “Materials” section). 3
At the end of the study, participants reported their (a) disgust level, (b) whether they wanted to wash their hands, (c) other emotions (anger, fear, happiness, sadness, and surprise), and (d) their motivation during the study (“I believe I was careful and motivated during the experiment”) (1 [“not at all”] to 9 [“very much”]). The study lasted between 15 to 20 minutes.
Results
Manipulation check for emotion elicitation procedure
Participants rated their disgust level directly after the emotion elicitation phase and at the end of the experiment (see Table 1). At both time points, the disgust level in the disgusting group significantly exceeded that in the neutral group, t(216) = 33.17, p < .001, d = 4.49; t (210.02) = 8.65, p < .001, d = 1.17, respectively. In addition, after the attention task was completed, participants in the disgust condition reported a significantly greater desire to wash their hands compared with the neutral group, t(196.75) = 10.51, p < .001, d = 1.42.
Manipulation check (Experiment 1; mean ratings; standard deviations in parentheses).
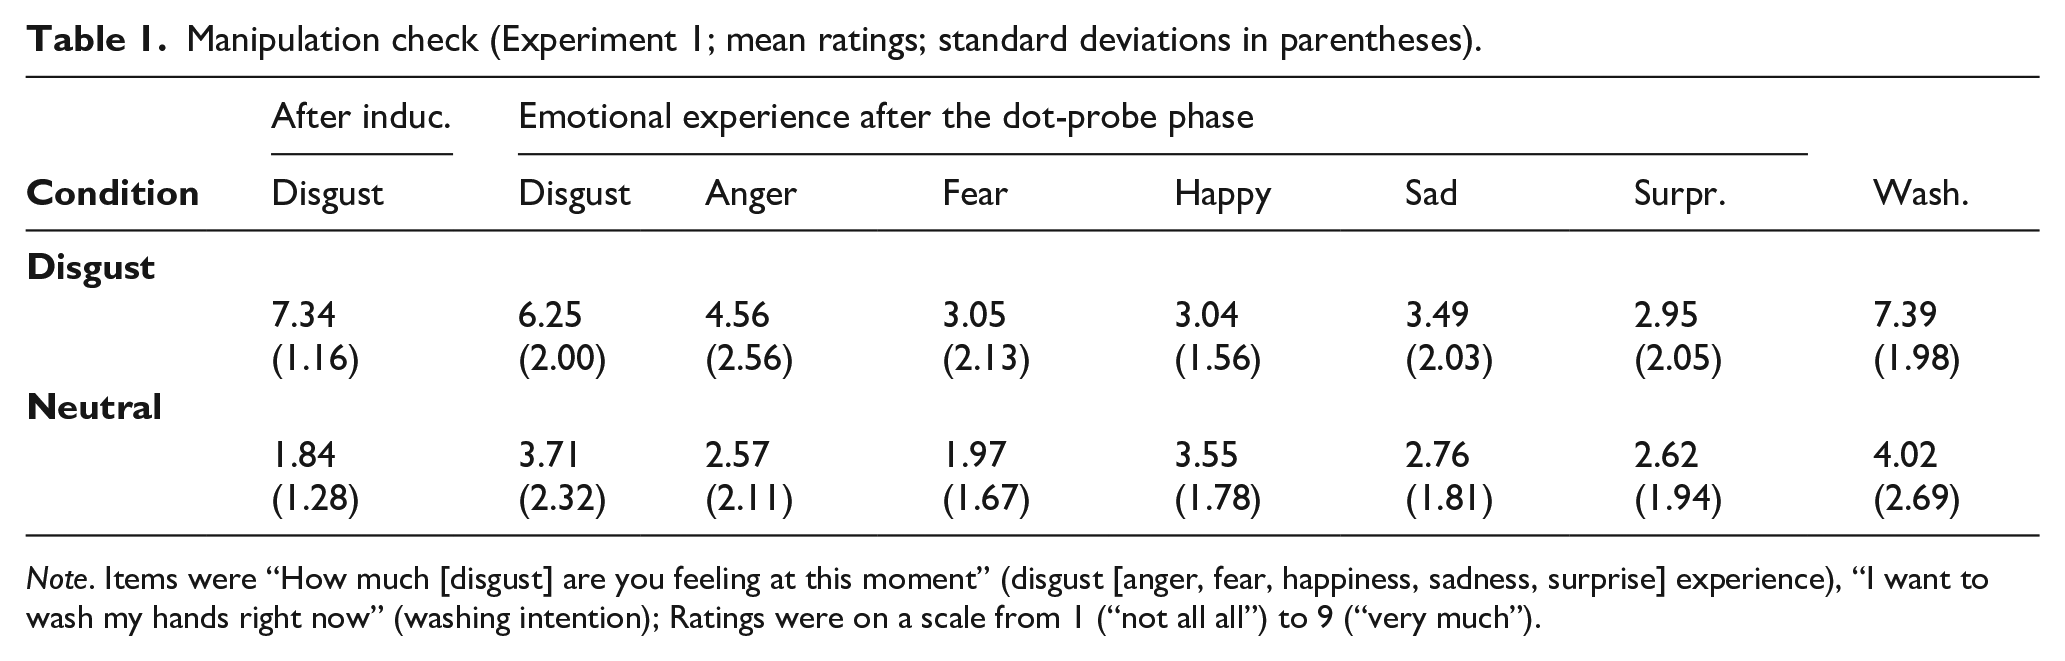
Note. Items were “How much [disgust] are you feeling at this moment” (disgust [anger, fear, happiness, sadness, surprise] experience), “I want to wash my hands right now” (washing intention); Ratings were on a scale from 1 (“not all all”) to 9 (“very much”).
To examine the specificity of the emotion induction, we conducted a 2 (emotional state: disgust vs. neutral) × 6 (emotion rating: disgust, anger, fear, happiness, sadness, surprise) multivariate analysis of variance (MANOVA) for repeated measures (O’Brien & Kaiser, 1985) with planned orthogonal contrasts (Helmert) for the emotion rating factor. Main effects of emotion, F(5, 212) = 74.44, p < .001, ηp2 = .64, and state, F(5, 212) = 34.46 p < .001, ηp2 = .14, were qualified by an interaction, F(5, 212) = 15.82, p < .001, ηp2 = .27. As expected, the first Helmert contrast of the interaction test—that is, disgust vs. the average of the remaining emotions—was significant, F(1, 216) = 55.90, p < .001, ηp2 = .21. That is, the disgust level is not only higher in the disgust condition (see above); it is specifically higher for disgust, in comparison to the average group difference for the other emotion ratings. The remainder of the interaction test (i.e., the four remaining Helmert contrasts taken together) is still significant, F(4, 213) = 9.68, p < .001, ηp2 = .15, indicating that other emotions are affected as well, but to different degrees. We report here t-tests with Bonferroni correction (i.e., p criterion .05/5 = .01). Significant group differences were found for anger, fear, and sadness, t(209.70) = 6.26, p < .001, d = 0.85, t(205.91) = 4.15, p < .001, d = 0.56, and t(216) = 2.81, p = .005, d = 0.38, respectively. There were no significant differences between groups for happiness and surprise, t(211.37) = 2.25, p = .026, d = 0.31, and t(216) = 1.24, p = .217, d = 0.17, respectively.
Finally, we asked whether participants were careful and motivated during the experiment, and they reported high levels of motivation (M = 8.37, SD = .99 for the disgust condition; M = 8.28, SD = 1.0 for the neutral condition) in both groups, t(216) = 0.70, p = .483, d = 0.10.
Dot-probe task
Only reaction times of correct responses were analysed. (The error rate was 2.1%.) Vogt et al. (2011) used individual RT medians to handle the RT outlier problem; we routinely use individual RT means after outlier exclusion (e.g., Wirth & Wentura, 2020). We used both variants in our analyses and found essentially the same results. In the following, we report only RT means analyses. For these analyses, we excluded RTs below 150 ms and RTs larger than 1.5 interquartile ranges above the third quartile of the individual participant’s distribution (6.7 % of the remaining trials; Tukey, 1977). Table 2 shows the mean RTs for each condition.
Mean RTs (in ms; error rates in % in parentheses) as a function of cue validity, cue type, and emotion group; attentional bias scores (AB; standard errors in brackets); Experiment 1.
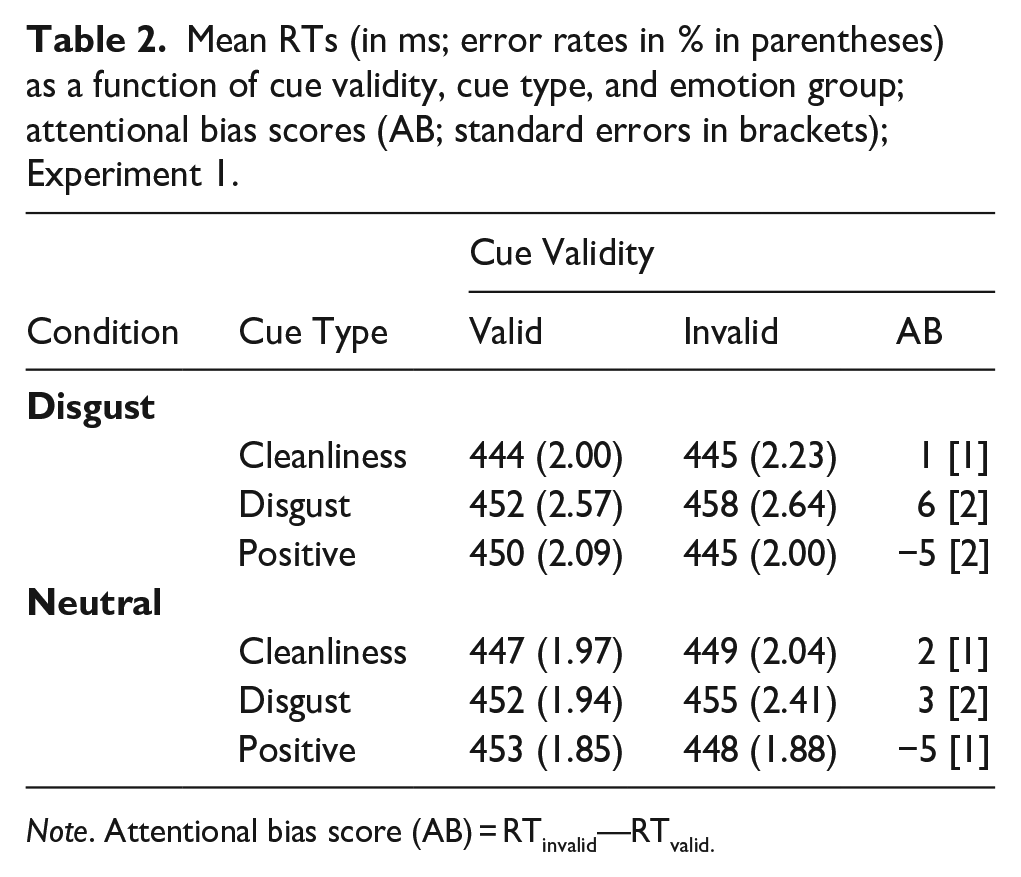
Note. Attentional bias score (AB) = RTinvalid—RTvalid.
We conducted a series of planned analyses; dependent variables are always attentional bias (AB) scores, that is, the difference of RTinvalid minus RTvalid. According to our preregistration, we conducted three independent samples t-tests to examine the differences in AB scores for cleanliness pictures, disgust pictures, and positive pictures between the disgust and neutral emotional state groups. In addition, for each emotional group, one-sample tests were conducted to examine whether the AB scores for cleanliness, positive, and disgust pictures differed from zero. Our preregistration also specified that for hypothesis-congruently signed outcomes, one-tailed significant results will be accepted as valid.
For cleanliness pictures, we expected to replicate an effect of emotional state on the AB. However, the AB in the disgust condition was numerically smaller than that in the neutral condition; the difference was not significant, t(216) = 0.67, p = .506, d = 0.09., Overall, the average AB effect for cleanliness pictures did not significantly deviate from zero, t(217) = 1.39, p = .167, dz = 0.09.)
For disgust stimuli, we expected to find no effect of emotional state on the AB. This was the case, t(216) = 1.40, p = .163, d = 0.19. In line with Vogt et al. (2011), we found an overall AB to disgust stimuli, t(217) = 4.39, p < .001, dz = 0.30.
For positive stimuli, we wondered whether the corresponding AB will be different for the emotion conditions. If so, this would lend support to the counter-regulation hypothesis. If not, this would support the motivational hypothesis of Vogt et al. (2011). In fact, there is no effect of group on the AB, t(216) = 0.26, p = .795, d = 0.04. Unexpectedly, we observed an overall negative bias for positive stimuli, t(217) = −4.91, p < .001, dz = 0.33.
Error rates were analysed in line with the RT analyses. Mean error rates for Experiment 1 are presented in Table 2. For the ABs of cleanliness, disgust, and positive stimuli, there is no effect of emotion, all|t| < 1. Similarly, there is no overall AB to cleanliness, disgust or positive stimuli,|t| < 1.06.
Discussion
We aimed to replicate the AB to cleanliness stimuli in a disgust emotional state, as found by Vogt et al. (2011), and to examine whether this bias is caused by a motivational process (as Vogt et al. hypothesised) or affective counter-regulation (Rothermund et al., 2008). However, we were unable to replicate the AB to cleanliness-related stimuli in the disgust condition.
What might be the reasons for not finding the cleanliness bias in the disgust condition? First, were our study settings (e.g., our experimental programme, the online assessment procedure) not sensitive enough to find ABs? No, this explanation does not fit because we were able to replicate the overall disgust bias. Admittedly, the bias in our experiment was halved in terms of milliseconds (11 ms in the Vogt et al., 2011, experiment versus 5 ms in the present experiment). However, in terms of effect sizes, the difference is less extreme (dZ = 0.39 in Vogt et al. versus dZ = 0.30 in the present experiment).
Second, might our induction procedure not have been effective enough to induce a state of disgust strong enough to alter the AB towards cleanliness stimuli? With regard to our manipulation check, we can say that the manipulation was effective in terms of eliciting disgust and the motivation to wash one’s hands. The means and differences between conditions are comparable to those of Vogt et al. Thus, we do not believe that a failed manipulation was the reason for our null finding regarding to an AB for cleanliness-related stimuli.
Third, could the introduction of another cue type (i.e., the positive stimuli) have changed the overall character of the experiment? Note that the introduction of positive stimuli also changed other basic parameters of the experiment as well. In the experiment by Vogt et al. (2011), one-third of all presented pictures were cleanliness-related, as either disgust vs. neutral, cleanliness-related vs. neutral, or disgust vs. cleanliness-related cue pairs were presented throughout the trial sequence. In our experiment, only one-sixth of all pictures presented were cleanliness-related. Moreover, instead of three categories of 10 pictures each, as in the previous experiment, we used four categories, three of 10 pictures each and one (i.e., the neutral category) of 30 pictures. If we assume for the sake of the argument that the attentional system must somehow process the categorical nature of the image arrangement before a bias occurs, the 10 images in the category that is a priori closest to neutral (i.e., the cleanliness images) may be the most difficult to separate from the 30 neutral images. However, if this explanation were valid, we would be faced by a very fragile and limited mechanism. Here, we would like to draw attention to another point. Despite the hypothesis-congruent result of Vogt et al. (2011), one methodological detail of their experiment can be questioned. The authors used the location dot-probe task; that is, participants had to categorise the location of the target. It can be argued that the location task has two problems. One is that participants might adopt a strategy to attend dominantly one of the two possible target locations throughout the experiment. If the target appears at that location, they can quickly respond by pressing the appropriate key; if the target does not appear within the expected time frame, they can press the alternative key. We should hasten to add that Vogt et al. introduced the number task to prevent such a strategy as participants had to focus on the centre of the screen to perform well on this task.
The other issue is more fundamental. It can be argued that the use of the location task confounds attentional processes with response priming processes. The easiest way to explain this problem is to take a small detour. A close cousin of the dot-probe paradigm is the emotional spatial cueing task (Fox et al., 2001). In this paradigm, only a single cue is presented in a trial; moreover, it predicts the target location with, for example, 75% accuracy. Thus, attention switches to the cue location with the highest probability. 4 However, when the target location task is used, it is clear that the location of the single cue is either congruent or incongruent with the target-related response. Thus, cueing effects may not necessarily be based on the allocation of spatial attention but may be due to response facilitation and/or interference processes. Fox et al. (2001) have already addressed this issue (see also Weierich et al., 2008). Imhoff et al. (2019), Mulckhuyse and Crombez (2014), and Wentura et al. (2024) found evidence for response priming processes in the emotional spatial cueing task.
In the dot-probe paradigm, this problem is not as obvious as in the emotional spatial cueing task. Nevertheless, it is present in principle. If the cue pair is processed in terms of the discriminative feature, such as the presence of disgusting content in one location but not in the other, one can assume that the location feature is also processed, at least if the task is to categorise the location of the target. Thus, if one wants to unambiguously capture spatial attentional processes, one should switch to a different type of task. Thus, in Experiment 2, we change the target to either “p” or “q,” and participants have to categorise accordingly.
Before turning to Experiment 2, we should briefly mention the surprising reversed effect for positive stimuli. We will postpone discussion of its possible interpretation until we determine whether it is replicated in a second experiment.
Experiment 2
We preregistered Experiment 2 on aspredicted.org. The preregistration can be accessed via the following link: https://aspredicted.org/1KJ_499.
Method
Participants
We retained the power analysis from Experiment 1, that is, N (= 2 × 10⁵) = 210 participants were required for the second experiment. Note, with N = 105 for the subsamples, the effects that were factually found in Experiment 1 can be detected with high power. That is, the (reversed) positivity effects (dz = 0.33) and the disgust effect (dz = 0.30) can be detected with 1 − β = .997, and 1 − β = .991, respectively (α = .05, two-tailed). Initially, we decided to recruit a total of N = 230 participants to account for potential outliers. However, as in Experiment 1, we ultimately had to increase this number to N = 338 because we had to discard more participants than expected due to our preregistered exclusion criteria (see below).
The study was also conducted via the online platform Prolific (www.prolific.co). All other criteria were the same as in the first experiment. Similar to the first experiment, we excluded participants with a low level of disgust in the disgust condition (n = 13) and participants with an accuracy rate below 75% in the dot-probe task (n = 1). In addition, participants with an accuracy rate below 70% in the performance control task (i.e., the “number task,” see Procedure of Experiment 1; n = 114) were excluded. The final sample included 210 participants (NNeu = 105; NDis = 105) and they received £3 for participation. Median age was 23.0 years (range from 18 to 35 years).
Design, materials, and procedure
Everything was exactly the same as in Experiment 1 except that the target square was replaced by either a “p” or “q,” and participants had to categorise the target accordingly. The variation of “p” or “q” was orthogonal to all other variations (i.e., validity, location of emotional picture, and type of emotional picture).
Results
Manipulation check for emotion elicitation procedure
Participants rated their disgust level directly after the emotion elicitation phase and at the end of the experiment (see Table 3). At both time points, the disgust level in the disgust group significantly exceeded that in the neutral group, t(185.8) = 25.18, p < .001, d = 3.48; t (197.7) = 4.57, p < .001, d = 0.63, respectively. In addition, after the attention task was completed, participants in the disgust condition reported a significantly greater desire to wash their hands compared with the neutral group, t(200.1) = 7.98, p < .001, d = 1.10.
Manipulation check (Experiment 2; mean ratings; standard deviations in parentheses).
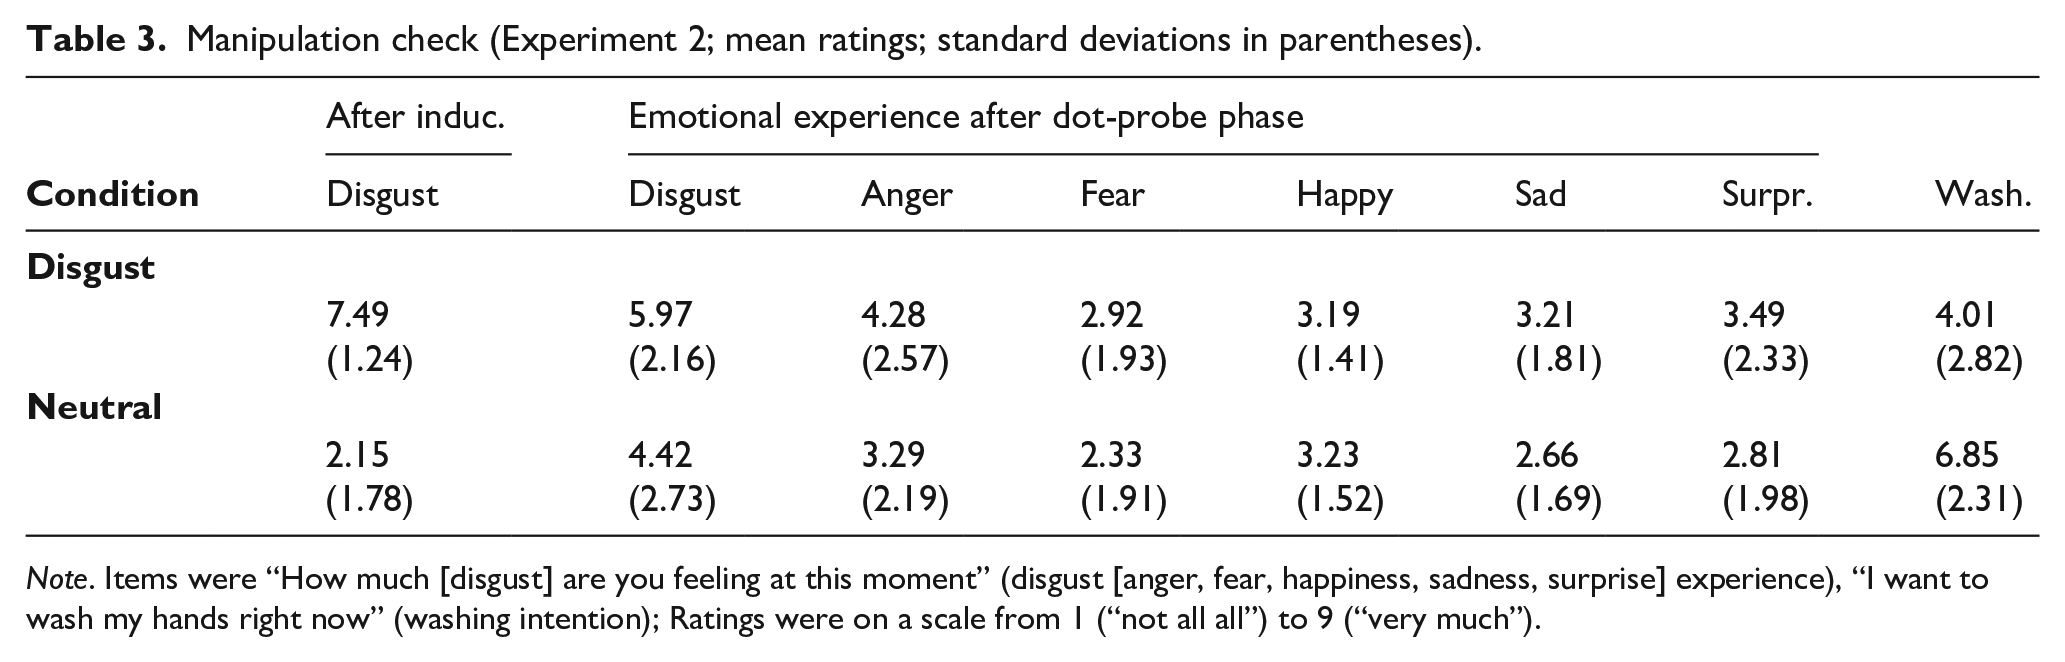
Note. Items were “How much [disgust] are you feeling at this moment” (disgust [anger, fear, happiness, sadness, surprise] experience), “I want to wash my hands right now” (washing intention); Ratings were on a scale from 1 (“not all all”) to 9 (“very much”).
To examine the specificity of the emotional induction, we conducted a 2 (emotional state: disgust vs. neutral) × 6 (emotion rating: disgust, anger, fear, sadness, happiness, surprise) multivariate analysis of variance (MANOVA) for repeated measures (O’Brien & Kaiser, 1985) with planned orthogonal contrasts (Helmert) for the emotion rating factor. Main effects of emotion, F(5, 204) = 55.45, p < .001, ηp2 = .58, and state, F(1, 208) = 15.38 p < .001, ηp2 = .07, were qualified by an interaction, F(5, 204) = 3.09, p = .010, ηp2 = .07. As expected, the first Helmert contrast of the interaction test—that is, disgust vs. the average of the remaining emotions—was significant, F(1, 208) = 12.05, p = .001, ηp2 = .05. That is, the disgust level was again specifically higher for the disgust group, in comparison to the average group difference for the other emotion ratings. The remainder of the interaction test (i.e., the four remaining Helmert contrasts taken together) was not significant, F(4, 205) = 1.88, p = .115, ηp2 = .04.
Finally, we asked whether participants were careful and motivated during the experiment, and they reported high levels of motivation (M = 8.15, SD = 1.05 for the disgust condition; M = 8.27, SD = 0.96 for the neutral condition) in both groups, t(208) = 0.82, p = .411, d = 0.11.
Dot-probe task
Data treatment was as in Experiment 1. The error rate was 4.3%. Outliers were 8.8% of the remaining trials. Table 4 shows the mean RTs for each condition.
Mean RTs (in ms; error rates in % in parentheses) as a function of cue validity, cue type, and emotion group; attentional bias scores (AB; standard errors in brackets); Experiment 2.
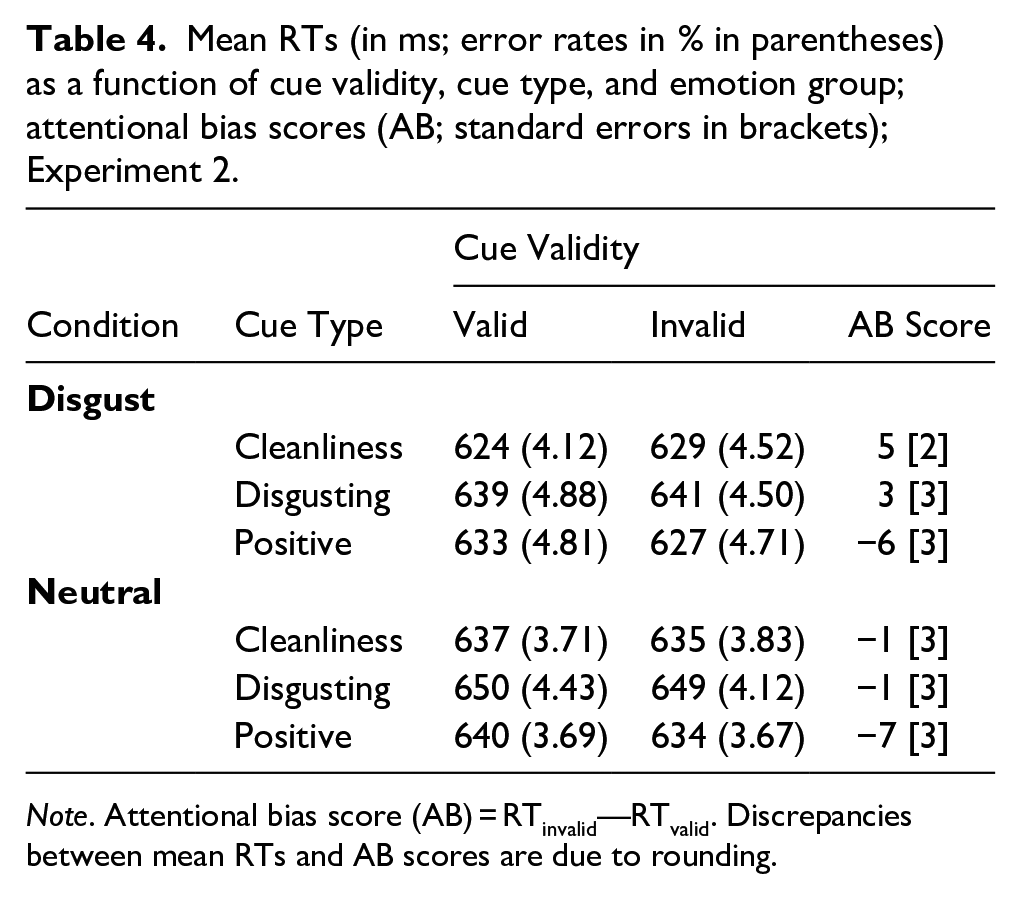
Note. Attentional bias score (AB) = RTinvalid—RTvalid. Discrepancies between mean RTs and AB scores are due to rounding.
Again, we conducted a series of planned analyses in Experiment 1 (see also preregistration); dependent variables are always AB scores. Note again, that we stated in our preregistration that for hypothesis-congruently signed outcomes, one-tailed significant results will be accepted as valid.
For cleanliness pictures, the AB in the disgust condition was significantly larger than that in the neutral condition, thereby replicating the main result of Vogt et al. (2011), t(208) = 1.75, p = .041 (one-tailed), d = 0.24. The AB in the disgust condition was significantly different from zero, t(104) = 2.03, p = .022 (one-tailed), dz = 0.20, whereas it was not in the neutral condition, t(104) = −0.54, p = .589, dz = 0.05.
For disgust stimuli, we expected to find no effect emotional state on the AB. This was the case, t(208) = 1.06, p = .292, d = 0.15. However, in contrast to Vogt et al. (2011) and in contrast to Experiment 1, we found no overall AB to disgust stimuli, t(209) = 0.31, p = .377 (one-tailed), dz = 0.02.
For positive stimuli, there was again no effect of emotional state on the AB, t(208) = 0.26, p = .795, d = .04. As in Experiment 1, we observed an overall negative bias for positive stimuli, t(209) = 3.25, p = .001, dz = 0.22. Although the AB’s sign for positive stimuli and the complete lack of an effect of emotional state on the AB refute an interpretation of the group effect on the AB for cleanliness-related stimuli in terms of counter-regulation, we follow our preregistration: “To test whether the difference in AB for cleanliness pictures and positive pictures is different for the two emotional conditions, we will conduct a two-sample t-test with this difference as the dependent variable.” Not unexpectedly, given the small between-participant differences in the AB for cleanliness pictures (see above), this test was not significant, t(208) = 1.01, p = .156 (one-tailed), d = 0.14.
Error rates were analysed in line with the RT analyses. Mean error rates for Experiment 2 are presented in Table 4. For the ABs of cleanliness, disgust, and positive stimuli, there were no effects of emotional state, all|t| < 1. Similarly, there was no overall cleanliness, disgust, or positivity effect,|t| < 1.11.
Discussion
With our modified task, we were able to replicate the focal result of Vogt and colleagues (2011): In the disgust condition, there was an AB towards cleanliness-related pictures that was completely absent in the neutral control condition; the difference was significant. Moreover, given the new task, this result can be clearly attributed to a shift in spatial attention.
Surprisingly, the bias towards disgust pictures was now completely absent. This result is further supported by the fact that this AB was significantly lower than the corresponding AB in Experiment 1 (z = 2.50, p = .012 in a Mann–Whitney U-Test, because of non-normality). Therefore, we should discuss this difference as a possible consequence of the changed task. We will return to this issue in the General Discussion.
The unexpected negatively signed effect for positive pictures found in Experiment 1 was replicated in Experiment 2. Thus, we should consider it a robust result that needs interpretation. Again, we will leave this to the General Discussion.
General discussion
In the present study, we investigated the effect of emotional state on the AB to cleanliness-related stimuli (i.e., the hypothesis that the AB occurs in a disgust emotional state but not in a neutral state), as found by Vogt et al. (2011). Our primary goal was to investigate whether the mechanism of the AB to cleanliness stimuli in a disgust state is driven by motivational processes (as suggested by Vogt et al., 2011) or affective counter-regulation (Rothermund et al., 2008; Schwager & Rothermund, 2013). The motivational account suggests that cleanliness stimuli are instrumental in eliminating the disgusting situation; therefore, they could become motivationally relevant and gain attentional priority (Vogt et al., 2011, 2017). Conversely, the counter-regulation mechanism suggests that attention allocation to cleanliness-related stimuli was observed because they represent positive stimuli in this context and, therefore, reduce the negative effects of the disgust experience and prevent the escalation of the current affective state (Rothermund, 2011; Rothermund et al., 2008; Wentura et al., 2009, 2018). To examine the cleanliness effect, we added a positive stimulus category to the design: If affective counter-regulation is the critical mechanism, the effect of emotion on the AB should generalise to positive stimuli. If it is a motivational process (as suggested by Vogt et al.), the effect of emotional state should be specific to cleanliness-related stimuli.
The results showed that the AB to cleanliness stimuli was indeed observed in the disgusted emotional state but not in the neutral emotion group; that is, the main result of Vogt et al. (2011) could be replicated. (The fact that this result was replicated only with the discrimination version of the dot-probe paradigm but not the original location task version will be discussed in a later section.) No corresponding moderation of an attentional bias towards general positive stimuli was found in the two experiments, even though positive valence was processed, as evidenced by the robust overall AB to positive stimuli. (Again, the fact that this AB was negative will be discussed in a later section.) Overall, this finding supported the hypothesis that the attention allocation to cleanliness stimuli in a state of disgust is driven by motivational relevance rather than a counter-regulation mechanism.
Note that in the current study, goal-relevant and counter-regulation processes were considered as separate processes. However, some researchers suggest that although these processes are separate, they can be triggered together in a supportive manner (Moors et al., 2017). Tamir (2009) argued that goal-directed processes may result from the organism’s desire to maximise its pleasure; therefore, goal-directed processes may be part of the regulatory process. From this perspective, both cleanliness-related and general positive stimuli are instrumental in achieving a positive state. However, in our Experiment 2, the AB was found specifically for cleanliness stimuli but not for positive stimuli. Thus, although it may be the case that the two processes occur together in the regulation of other emotional processes, such as sadness, for the regulation of the disgust state, the cleanliness AB effect seemed to be caused solely by the motivational process and not by the counter-regulation process.
Location task versus discrimination task
In the present study, our secondary aim was to investigate the consequences of using the location task in the dot-probe paradigm. Previous studies have highlighted the confounding of spatial attention processes with response priming processes when using the location task in spatial cueing studies (Imhoff et al., 2019; Mulckhuyse & Crombez, 2014; Wentura et al., 2024). Typically, this discussion is limited to the emotional spatial cueing paradigm (Fox et al., 2001; see also “Introduction” section) but can also be considered for the dot-probe paradigm (Wentura et al., 2024; Wirth & Wentura, 2018). Therefore, we conducted two experiments with two different versions of the dot-probe paradigm: the version with the location task (Experiment 1) as used by Vogt et al. (2011), and the version with the discrimination task (Experiment 2). We observed different results for the cleanliness AB effect as well as for the disgust AB effect: The attentional bias to cleanliness-related stimuli was replicated with the discrimination task (Experiment 2) but not with the location task (Experiment 1). Moreover, the general disgust effect (i.e., not affected by state) was found in both Vogt et al. (2011) and our Experiment 1 (i.e., in the experiment with the location task); it was not observed with the discrimination version. These inconsistent results strengthen our claim that the processes in the two tasks may be different (but, of course, do not necessarily have to be). The location task has the advantage of simplicity, typically reflected in faster RTs and fewer errors. For this reason, Mogg and Bradley (1999) favoured the location task after an experiment that yielded comparable results for location and discrimination. However, when results differ between the two tasks—as in our experiments—and the focal hypothesis is about spatial attention processes, it would be wise to place more trust in the confound-free discrimination task. In this task, the result of Vogt et al. (2011) was replicated.
Interestingly, we consistently observed a negative bias for positive stimuli regardless of emotional state and regardless of task. Therefore, the negative bias for positive stimuli should be attributed to spatial attention processes. We will discuss this issue in the next section.
The negative bias for positive stimuli
The negative bias for positive stimuli was surprising, as the debate has typically focused on whether or not there is a positively signed bias in the dot-probe paradigm. For example, there have been several null findings (e.g., Baum et al., 2013; Bradley et al., 1997; Klumpp & Amir, 2009; Mogg & Bradley, 1999; Pourtois et al., 2004; Puls & Rothermund, 2018), while other authors have reported a positive bias with baby faces (Brosch et al., 2008), happy faces (Wirth & Wentura, 2020), or stimuli with induced valence (Müller et al., 2016). However, using IAPS pictures as cues, there are indeed two published studies reporting a negative bias for positive pictures, albeit only in clinical samples (Mingtian et al., 2011; Shane & Peterson, 2007). Thus, our results are not without precedent. In principle, there are three types of explanations for negative effects.
The counter-category argument
In principle, a negative effect might be explained by attentional capture for the counter category (here: the neutral pictures). The sobering version of this argument would focus on the quasi-experimental nature of the study: The “positive versus neutral” variation was realised by specific stimuli with a priori valence. Despite careful selection, the unintended presence of attention-grabbing perceptual features could be correlated with this variation. For the present experiments, we do not consider this a viable argument because the same neutral pictures were used as counterparts for cleanliness, disgust-related, and positive pictures, but we observed a negatively signed effect only for positive stimuli. A different version of this argument was made by Cooper and Langton (2006), who found a negative effect on happy faces. As they found a parallel positive effect for angry faces, they argued that attention is always captured by the relatively more negative stimulus in a pair, that is, by angry faces in angry/neutral pairs but by neutral faces in happy/neutral pairs. This argument has some plausibility for face stimuli in that neutral-looking faces may indeed have an air of negativity, especially in the context of friendly-looking faces. However, this idea seems rather far-fetched for the present pictorial materials.
Avoidance
In the dot-probe literature, negatively signed effects are often characterised as an avoidance process (e.g., Gronchi et al., 2018; Mogg & Bradley, 1999). For negative stimuli, this characterisation has intuitive plausibility. Moreover, by examining effects with rather long cue-target asynchronies (above 200 ms), which allow for the assumption of an early attentional allocation followed by avoidance, potential conceptual inconsistencies that might arise for very short cue-target asynchronies are avoided (“How can something be avoided that is still only pre-attentively processed?”). However, this argument has little intuitive plausibility for positive stimuli. What is functional about avoiding positive pictures?
Inhibition of return
For a process sequence like “early allocation of attention followed by a withdrawal of attention,” we can avoid using a term like “avoidance” with its implausible connotations (for positive stimuli). It is known from basic attention research that positive cueing effects caused by abrupt onset cues are only found with very short cue-target asynchronies (up to app. 200 ms; Samuel & Kat, 2003). For longer asynchronies, the effect is reversed, a phenomenon known as inhibition of return (IOR; see, e.g., Klein, 2000). The functionality of this process can be seen in the facilitation of visual search behaviour: Previously inspected locations should not be revisited during the search process (Klein, 1988). Although typically shown with abrupt onset cues, there are studies showing IOR for multiple cue situations where a specific type of cue is believed to attract early attention (e.g., colour singletons, Priess et al., 2012; Theeuwes & Godijn, 2002, or faces, Theeuwes & Van der Stigchel, 2006). Of course, the IOR interpretation assumes that positive stimuli attract early attention. This needs to be tested in future research and may lead to a new story. It was beyond the scope of the present study.
Limitations and future directions
We followed Vogt and colleagues (2011) in using a cue-target asynchrony (CTA) of 350 ms because—except for the introduction of a positive condition and the task variation—we wanted to stay as close to the original study as possible. A CTA as long as 350 ms is not atypical for dot-probe studies; often 500 ms (or even more) is used. Nevertheless, it is a rather long CTA compared with basic exogenous cueing experiments. Therefore, we used a CTA of 100 ms in our previous dot-probe research with facial stimuli (e.g., Wirth & Wentura, 2020) to more plausibly address early capture processes and avoid distortion of the effects by eye movements (Petrova et al., 2013). Especially in light of our results for positive stimuli (see above), a replication with a shorter SOA seems worthwhile to see whether our speculation about IOR has some value.
Although the dot-probe task is a widely-used method to measure spatial attentional processes in both clinical (e.g., anxious patients and alcohol addicts; e.g., MacLeod et al., 1986, see Bar-Haim et al., 2007, for a meta-analysis) and non-clinical samples (e.g., Wirth & Wentura, 2018; see van Rooijen et al., 2017, for a review), it was in general criticised for having low reliability (e.g., Chapman et al., 2019; Jones et al., 2018; Schmukle, 2005; Sharpe et al., 2022). Of course, this critique dominantly addresses the assessment of individual differences with the task; it does not directly address basic research that aims at finding a robust mean cueing effect. The present research is a borderline case in this regard. Although we did not search for meaningful individual differences (in the sense of stable traits), we wanted to find differences between two samples (i.e., the disgust state sample and the neutral state sample). Thus, the devil’s advocate might still ask: How can this be achieved with a measure that has no reliability? This criticism, however, would miss the point. The hypothesis by Vogt et al. (2011) is about a moderator of a general attentional effect: Whereas cleanliness stimuli can be regarded as neutral in most circumstances (and therefore should not capture attention), they are motivational relevant in the disgust state (and hence should cause capture effects). Thus, if the hypothesis comes true, the state manipulation induces a sufficient amount of true variance—sufficient enough to confirm that the mean differences between states are large enough in contrast to the within-group variance. It does definitely not matter whether this within-group variance contains reliable individual differences. However, individual differences might affect the goal-relevance process. In fact, Vogt and colleagues (2011) found that for participants of the disgust sample having a high level of disgust sensitivity the attention bias to cleanliness stimuli was decreased. Thus, by not measuring the disgust sensitivity of participants, we lost the opportunity to find evidence of an AB in Experiment 1 after removing participants with a high level on this trait. However, the overall cleanliness AB of 1 ms in the disgust sample of Experiment 1 does not suggest that this result would have been found.
Supplemental Material
sj-docx-1-qjp-10.1177_17470218241281694 – Supplemental material for The assessment of attentional bias to cleanliness stimuli in different versions of the dot-probe task: Evidence for a motivational account
Supplemental material, sj-docx-1-qjp-10.1177_17470218241281694 for The assessment of attentional bias to cleanliness stimuli in different versions of the dot-probe task: Evidence for a motivational account by Merve Boğa and Dirk Wentura in Quarterly Journal of Experimental Psychology
Footnotes
Acknowledgements
We thank Julia Vogt for sharing the stimulus set with us. We would like to thank Emre Gurbuz for his support with the coding of the experimental programme.
Declaration of conflicting interests
The author(s) declared no potential conflicts of interest with respect to the research, authorship, and/or publication of this article.
Funding
The author(s) disclosed receipt of the following financial support for the research, authorship, and/or publication of this article: This research was supported by TUBITAK—BIDEB—2214 International Doctoral Research Fellowship Programme (53325897-115.02-152823) and by a grant from the German Research Foundation to Dirk Wentura (WE 2284/16-1).
Data accessibility statement
The data and programme code for all experiments are publicly available at the Open Science Framework website: https://osf.io/cajhp/. The experiments were preregistered at aspredicted.org. The documentation of this preregistration can be accessed via the following links: https://aspredicted.org/B4Z_6RM and ![]() for Experiments 1 and 2, respectively.
for Experiments 1 and 2, respectively.
Supplementary material
The supplementary material is available at qjep.sagepub.com.
Notes
References
Supplementary Material
Please find the following supplemental material available below.
For Open Access articles published under a Creative Commons License, all supplemental material carries the same license as the article it is associated with.
For non-Open Access articles published, all supplemental material carries a non-exclusive license, and permission requests for re-use of supplemental material or any part of supplemental material shall be sent directly to the copyright owner as specified in the copyright notice associated with the article.