
Abstract
Distinguishing between serial and parallel processing modes in visual search tasks remains a challenge in cognitive psychology. The multiple target search (MTS) paradigm, which utilizes target redundancy gains to identify parallel searches, is currently one of the promising approaches for this distinction. Despite being proposed five decades ago, this method has not gained widespread acceptance among researchers in visual search area, potentially due to two limitations. One is its inability to reliably detect redundancy gains in established parallel searches (e.g., the distinct popout color search). The other is the presence of redundancy gains in pure-target-absent trials, which are apparently incompatible with the MTS’s explanation of redundancy gains. In this study, we tested a modified version of the traditional reaction-time-based MTS (rt-MTS) by developing an accuracy-based MTS (acc-MTS). The results suggested that the acc-MTS successfully overcomes the aforementioned limitations of the rt-MTS paradigm while maintaining significantly greater efficiency. These findings established the acc-MTS as a reliable and efficient methodological advancement for determining the serial or parallel nature of visual search tasks.
Keywords
Introduction
Understanding the principles and mechanisms of visual information processing is a fundamental issue in cognitive psychology. The field primarily distinguishes between two prototypical modes: parallel processing (the simultaneous handling of multiple information units) and serial processing (the sequential handling of information units). Cognitive scientists have endeavored to elucidate the fundamental principles of visual information processing by investigating these serial-parallel processing characteristics in elementary visual tasks, notably visual search paradigms (e.g., the seminal work by Treisman & Gelade, 1980).
Intuitively, in parallel search, processing of all search items occurs simultaneously, so that the response time (RT) for the search task should not increase with the number of search items. In contrast, in serial search, processing of each item occurs sequentially, so that the response time would increase with the number of search items. Thus, early studies often used the slope of RT × Set size function to distinguish between serial and parallel search. A favorite strategy was to use 10 ms/item as a threshold. Searches with slopes below this threshold are often recognized as parallel searches, and those above it are serial searches.
Problems with the search slope approach
However, the way of distinguishing serial and parallel searches by search slopes is problematic. First, if the search slopes of all serial searches are above a threshold and the search slopes of all parallel searches are below that threshold, we may expect that the occurrence-probability distribution of search slopes for different search tasks (this distribution reflects the occurrence-probability of a particular search slope value under a large number of, ideally all, different search task conditions) should have two peaks, one peak corresponding to the mean search slope of all serial searches while the other to the mean slope of all parallel searches. However, this theoretical prediction does not match the empirical findings. Wolfe (1998) analyzed a large amount of search data (i.e., 1 million data points) and found that the occurrence-probability distribution of search slopes has only one peak.
Moreover, researchers have long recognized that even unlimited-capacity parallel processors can produce increasing mean RT functions (Townsend, 1974; Townsend & Ashby, 1983). This occurs partially because parallel searches may suffer costs of divided attention, and RTs can be influenced by the decision processes. Specifically, if the time required for decision-making increases with the number of items in a parallel search, the resulting RT × set size function may resemble that of a serial search, even though the search itself is parallel.
According to Thornton and Gilden (2007), the lack of a method to discern whether a particular data set of a visual search task arises from a serial or parallel process has led to this distinction (between parallel and serial searches) being largely abandoned, as if this question is either theoretically insignificant or unrelated to the functioning of an active visual system. However, abandoning the serial versus parallel distinction is both hasty and unjustified. As proposed by Townsend and Wenger (2004; see also Townsend, 1990), this issue (serial vs. parallel) will not, and should not, go away, and the question actually can be answered.
Promising methods of testing serial versus parallel processing
Townsend (1990) summarized six promising methods for distinguishing between serial and parallel processing: three based on reaction time (namely, the Method of Factorial Interactions, Parallel-Serial Tester, and the Method of Redundant Targets) and three based on accuracy rate (namely, Tests by Time Delimitation, the Second Response Paradigm, and the Similarity and Confusion Technique). Below is a brief introduction to each of these methods.
Methods based on reaction time
Method of factorial interactions
This method studies how different experimental factors influence separate cognitive subprocesses by analyzing their combined effects on reaction time. If the factors show additive effects (no interaction), they likely affect distinct subprocesses, whereas interactions suggest shared influences. This approach helps identify mental processing architectures, such as serial or parallel systems, based on patterns of subadditivity or superadditivity (e.g., Eidels et al., 2015; Townsend, 1984; Townsend & Wenger, 2004).
Parallel-serial tester
The parallel-serial tester (PST) is an experimental method that distinguishes between parallel and serial cognitive processing by comparing RTs across different test conditions: single-feature detection, conjunctive judgment, and disjunctive judgment (Snodgrass, 1972; Townsend, 1976). The PST is based on a self-terminating processing assumption (i.e., the participants will stop processing once they find a target), and the RT patterns in PST could reveal whether processing is parallel or serial. In other words, PST designs tasks where serial and parallel architectures produce measurably different RT patterns (order sensitivity, distribution shapes), then it uses statistical tests to infer underlying processing modes.
Method of redundant targets
This method involves trials with either no targets (requiring a “no” response) or one/more targets (requiring a “yes” response), assuming self-terminating processing. It assesses processing models by varying target numbers or display sizes to test parallel versus serial theories. In the second paradigm form, where target number scales with display size, parallel models predict that RTs to pure-target trials (where all items are target) will decrease as the number of targets increases (due to redundancy gains), while serial models predict constant RTs (as only the first target is processed). This contrast in RT patterns distinguishes the two processing modes (e.g., van der Heijden, 1975).
Methods based on accuracy
Tests by time delimitation
This method distinguishes between parallel and serial processing by controlling the presentation mode and duration of stimuli, involving two types of paradigms. The first (Eriksen & Spencer, 1969) compares accuracy under two conditions: simultaneous presentation of all items (total duration is t) versus sequential presentation of individual items (each item duration is t). If performance is comparable under the two conditions, it supports parallel processing (because serial processing reduces each item’s processing time during simultaneous presentation). The second (Townsend, 1981) keeps the total time constant, comparing simultaneous presentation (total duration t) with sequential presentation (the sum of all individual item durations equals t). Serial models predict similar performance in the two conditions (identical per-item processing time), whereas parallel models predict a decline in accuracy under sequential presentation.
Second response paradigm
The second response paradigm is a technique where participants provide a second response for each processed item, allowing researchers to distinguish serial and parallel processing based on accuracy patterns (Townsend & Evans, 1983). The core logic hinges on the fact that serial models predict at most one item is partially processed when interrupted, whereas parallel models (or hybrid ones) allow multiple items to be in partial states, reflected in second-response accuracy. This paradigm exploits the differential processing states, that is, strictly one-at-a-time (serial) versus overlapping (parallel), to test theoretical predictions. However, potential confounds (e.g., potential second responses relying on initial guesses) necessitate complementary methods for validation.
Similarity and confusion technique
This method examines the error patterns by analyzing how often similar items are confused with each other, with higher confusion rates suggesting parallel processing rather than serial processing (Luce, 1963; Shepard, 1958). A core logic relies on the expectation that parallel models predict more frequent confusions between similar items due to overlapping partial processing, whereas serial models predict at most one confusion per trial. While effective, this technique cannot distinguish between pure parallel processing and hybrid models that also allow partial processing of multiple items.
The multiple-target search paradigm
Among the six methods mentioned above, the one that researchers have used to distinguish between serial and parallel visual search tasks is primarily the “method of redundant targets” (Thornton & Gilden, 2001, 2007; van der Heijden, 1975; Zheng et al., 2025). While the method of redundant targets is less common in visual search, it is widely applied to study processing modes in a variety of perceptual tasks, ranging from simple stimulus detection (including the detection of lights and discrimination of colors, orientations, and motion directions, such as Corballis, 2002; Donkin et al., 2014; Egeth et al., 1989; Ridgway et al., 2008; Schwarz, 2006; Thornton & Gilden, 2001), auditory information processing (e.g., Schröter et al., 2007), and bimodal stimulus processing (e.g., Hershenson, 1962; Miller, 1978, 1982), to those more complex tasks such as face recognition (Fitousi, 2021).
In visual search studies, the paradigm based on the method of redundant targets is referred to as the multiple-target search (MTS) paradigm (Thornton & Gilden, 2007; Zheng et al., 2025). The MTS tasks require participants to judge whether a particular target stimulus is present in a search display. In some trials, the search display contains only one target. In other trials, the search display contains redundant targets. The most important trials are the so-called “pure-target trials” where all items in the search display are targets. The distinction between serial and parallel nature of visual search can be obtained by comparing reaction times in pure-target trials across set sizes. For serial searches, the first item identified during search in the pure-target trials is always the target, so the reaction time of the pure-target trials would not change with the set size of the search display. Therefore, if the reaction time of the pure-target trials does not change with search set size, we can conclude that the search is serial. Meanwhile, it can also be concluded that a search is parallel if the reaction time of pure-target trials reduces with search set size.
There are two parallel processing models that can account for target redundancy gains. The separate-activation model (also known as the race model) assumes that all items are processed simultaneously and independently, and all the redundant targets race for the response (i.e., the time required by the first target to finish processing will determine the reaction time). The processing time for each item varies, so the greater the number of redundant targets, the greater the probability that there will be a target that is processed in a shorter time, leading to the target redundancy gains (Raab, 1962). In contrast, the coactivation model posits that recognition of targets is an accumulative process over time and that the information processing from redundant targets can be integrated to accelerate the accumulation process, which also leads to the redundancy gains (Miller, 1982).
The technique of using target redundancy gains to identify parallel searches relies on two prerequisite assumptions. First, the search is self-terminating (i.e., the search stops when a target is found). Second, the identification time for the first target is not affected by the number of redundant targets. For the first hypothesis, there is a large body of evidence to support it. The most well-known evidence is the fact that the ratio of search slopes for the target-present trials to the target-absent trials in single-target search tasks is approximately one to two (e.g., Townsend & Colonius, 1997; Van Zandt & Townsend, 1993). If search is exhaustive, not self-terminating, this ratio should be one to one. For the second hypothesis, although there is no direct evidence for it, it follows logically that if the time to process the first target is reliably affected by the number of redundant targets, the affection itself would reflect a mechanism of parallel processing; otherwise, the visual system cannot know in advance that there are redundant targets in the search array.
Limitations of the MTS paradigm
Obviously, the MTS paradigm shows theoretical advantages over the search slope-based approaches in differentiating serial and parallel search. However, its application in visual search area is limited for two reasons. One is that current visual search studies focus more on factors affecting search slopes, such as stimulus features or attentional window size, rather than processing modes (Hulleman & Olivers, 2017; Wolfe, 2021). For example, the guided search model suggests search efficiency depends on guidance from priority maps. Since priority maps are driven by stimulus features, researchers prefer building models to explain search efficiency rather than distinguishing serial versus parallel processing. Notably, this trend may change in the future. For example, a recent study discovered a time-dependent two-stage mechanism in visual selection 1 (Zheng et al., 2025). Within 150 ms after the search display onset, visual selection operates as a capacity-limited parallel process. After this period, it switches to serial processing. If confirmed, this finding has a potential to renew researchers’ interest in serial/parallel mechanisms of visual search.
Another factor limiting the application of the MTS paradigm is its methodological limitations. For example, it has been shown that it is insensitive to some parallel search tasks (e.g., high-contrast color pop-out searches). These tasks have very short reaction times, making it difficult to detect the redundancy gain (Thornton & Gilden, 2007). In addition, redundancy gains also occur in pure-target-absent trials (Thornton & Gilden, 2007; Zheng et al., 2025). That is, it has been shown that an MTS exhibiting redundancy gains in pure-target conditions also consistently showed reductions in reaction times with increasing set size in pure-target-absent trials. This result cannot be explained by the race model. Thornton and Gilden (2007, pp. 73) claimed that “both standard serial and parallel models of processing predict that target-absent RTs should increase with set size,” and so “until redundancy gains in the target-absent conditions are understood, making inferences about processing style from the redundancy gains in the pure targets is simply not possible.” They attributed this pattern in their data to the accuracy-speed tradeoff, as evidenced by higher miss rates in single-target trials (interleaved with pure target-absent trials) that scaled with set size. Opposing this, in Zheng et al. (2025), pure target-absent trial RTs decreased with set size without corresponding increases in the single-target trial miss rates.
Zheng et al.’s (2025) findings significantly undermine the plausibility of explaining redundancy gains in the target-absent conditions through accuracy-speed tradeoff, let alone the fact that sometimes MTS paradigm fails to detect redundancy gains in well-established parallel search tasks (high-contrast color pop-out search). These problems inevitably raise doubt about whether the MTS paradigm can really distinguish between serial and parallel search. In this study, we aim to investigate this question by modifying the MTS paradigm.
How to resolve these limitations?
What causes the aforementioned limitations of the MTS paradigm and could these limitations be resolved? We suspect that these limitations primarily stem from the RT-based measurement of the MTS paradigm. In fact, Thornton and Gilden (2007, pp. 75) noted “. . . in an earlier pilot study using highly discriminable color differences, the pure-target RTs were so fast as to preclude any observable redundancy gains.” It is likely that the MTS failed due to insufficient statistical power. Statistical power depends on effect size and data variance. For a fixed effect size, high variance reduces power. RT typically exhibits larger variance than accuracy, as it is more strongly affected by response-stage factors (e.g., Xin & Li, 2020).
The redundancy gains seen in pure-target-absent trials may also result from factors related to RT measurements. In theory, the redundancy gains in the pure-target-absent trials can be explained by the super capacity effect typically found in Gestalt/configural processing under exhaustive processing (typical in target-absent trials). Townsend and Wenger (2014) employed systems factorial technology and general recognition theory to show that in Gestalt perception, violations of decisional separability (i.e., processing of a stimulus dimension is not unaffected by other dimensions during decision-making) occur more frequently than violations of perceptual independence (i.e., processing of a stimulus dimension depends on other dimensions during perceptual encoding). This suggests that Gestalt’s holistic effects may be driven by decision integration rather than perceptual fusion. In line with this, Zheng et al. (2025) also suggested the RT decrease with set size in pure target-absent trials may primarily reflect the effects of set size on decision-making confidence.
To resolve these limitations, we propose modifying the MTS paradigm. Instead of using RT as the dependent variable, accuracy could serve this role. This adapted version would achieve two goals. First, because accuracy measures exhibit less variability than RT measures, the accuracy-based MTS (acc-MTS) should have greater statistical power compared to the reaction-time based MTS (rt-MTS). Second, as mentioned earlier, the redundancy gains observed in pure-target-absent trials are probably the manifestation of Gestalt holistic processing, which primarily operates during the decision stage and is thus detectable in the rt-MTS. In contrast, accuracy measures are less influenced by decision-stage processes. As demonstrated by Xin and Li (2020), the Simon effect was clearly observable in RT paradigms but absent in accuracy-based paradigms. Therefore, we hypothesize that the redundancy gains in pure-target-absent trials may not emerge in the acc-MTS. If this holds true, it would resolve the aforementioned limitations and well indicate that the acc-MTS paradigm can effectively distinguish between serial and parallel search modes.
The present study
The purpose of this study is to examine whether the acc-MTS can resolve aforementioned limitations of the rt-MTS. For this purpose, we compared performance of the two MTS paradigms. We anticipate that these limitations will manifest in rt-MTS paradigm but not in acc-MTS paradigm. We planned to employ a popout color search task because it is an established parallel search that should exhibit target redundancy effects. We expect acc-MTS to be more sensitive than rt-MTS in detecting these effects (i.e., requiring fewer observers to obtain stronger evidence). More importantly, we also predict that rt-MTS will exhibit significant redundancy gains in pure-target-absent trials, while acc-MTS will not.
Method
Participants
We cared about whether there is a difference in the mean accuracy rates (for the acc-MTS paradigm) or the mean RTs (for the rt-MTS paradigm) of the pure-target trials between two search set sizes (1 or 4). Because it is difficult to support a null hypothesis with the traditional frequentist analysis, we relied on Bayes factors. In Bayesian analysis, the intention of data collection is irrelevant to the interpretation of the evidence. Thus, the Bayes factors can be monitored while data come in, and the data collection can be terminated at any point (see Berger & Wolpert, 1988; Rouder, 2014). Therefore, for the two experiments of the present study, we planned to collect data from a minimum of 20 participants for each testing condition and monitor the Bayes factor until the critical hypothesis test reached a Bayes factor that can be considered as strong evidence (i.e., BF10 > 5 or BF10 < 0.2) or until the participants’ number reached a preset maximum value (i.e., 40 in the present study). It turned out that 20 participants were sufficient for the acc-MTS paradigm, and 40 participants were necessary for the rt-MTS paradigm. So, we recruited a total of 60 students from Zhejiang University to participate in the present study. Participants ranged from 18 to 30 years of age (with mean age of 22; 39 females) and had normal or corrected-to-normal vision. None had symptoms of color weakness. Informed consent was obtained from each participant. Experimental procedures were conducted following the Declaration of Helsinki and were approved by a local research ethics committee.
The rt-MTS paradigm
Task description
The rt-MTS paradigm essentially followed the MTS paradigm used in Thornton and Gilden’s (2007) study. Participants performed a visual search task, in which they judged whether a particular target color was presented in the search display (Figure 1a). The identity of the target color was fixed throughout the experiment for each participant, but it was varied across different participants. Three types of trials were used: target-absent trials, single-target trials, and pure-target trials. In the target-absent trials, no item in the search display had a color matching the search color. If the display contained identical nontarget colors, it was classified as a pure-target-absent trial. In the single-target trials, only one item in the search array matched the target color, while the other items in the search array were not. In the pure-target trials, all the items in the search display matched the target color. Participant judged whether any of the items matched the target color. The candidate colors and RGB values are: Red [255, 0, 0], Orange [255, 128, 0], Yellow [255, 255, 0], Green [0, 128, 0], Cyan [0, 255, 255], Blue [0, 0, 255], and Purple [128, 0, 128].
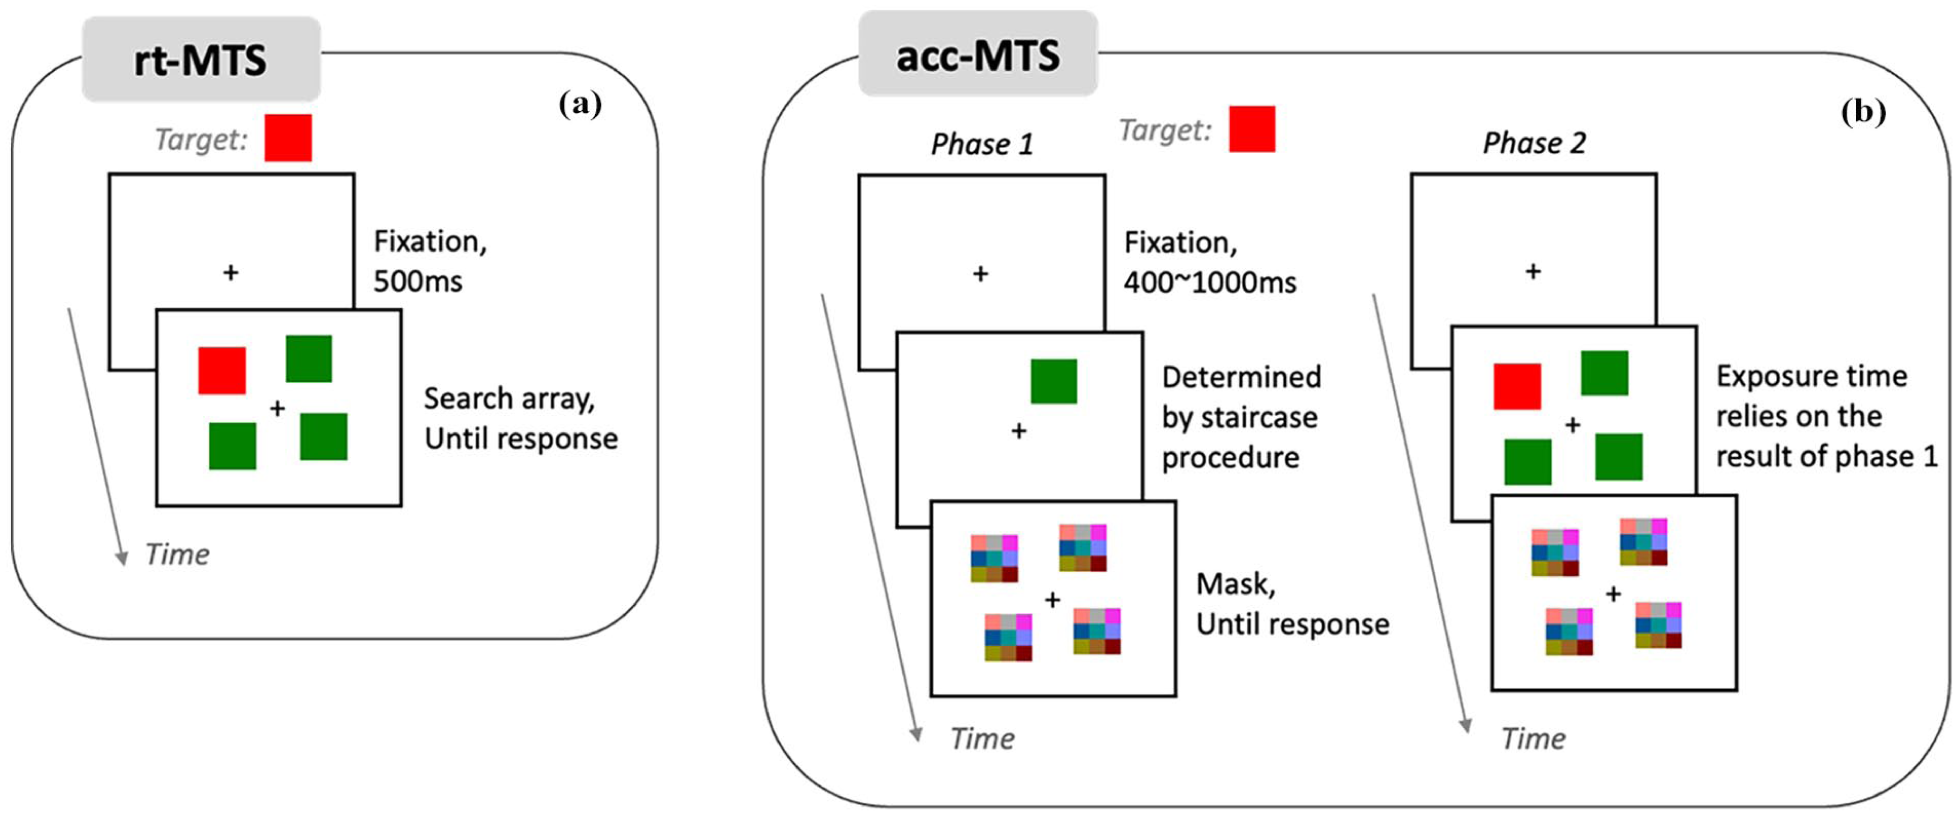
Diagrams depicting the stimuli and procedures used in the rt-MTS (a) and the acc-MTS (b) in the present study.
Display spatial arrangement
The search display used in this study contained one or four elements. Each element subtended a visual angle of about 1°×1°. We used only small set sizes to avoid artifacts caused by crowding or loss of acuity in the periphery (Geisler & Chou, 1995). All the elements were arranged on an invisible circle centered at a fixation point. The center-to-center distance between the fixation point and each element varied from 2.1° to 2.5°. The fixation point was shown throughout each trial, and the participants were required to fixate on it throughout the trial. The elements were randomly presented on four possible locations evenly spaced on the invisible circle (for set size 1, only one of the locations were used). To eliminate configural effects, the possible locations were not fixed. Every trial, they rotated clockwise or counterclockwise around the fixation point at an angle that is an integral multiple of 25°, following the method of Thornton and Gilden’s (2007).
Display configurations
As mentioned earlier, the critical conditions in the rt-MTS paradigm were the pure-target trials. To examine target redundancy gains, one only need to compare response times across different set-size conditions of the pure-target trials. However, if only the pure-target trials were presented to the participants, they may easily find out that the target is always present and thus anticipate the correct response. To make it impossible to anticipate the correct response, three types of trials (i.e., target-absent trials, single-target trials, and pure-target trials) were randomly mixed during the test. There were five types of search display configurations (Figure 2a). The percentage for each type of configuration (Figure 2b) was carefully designed to make sure that the probability of target presence was the same as that of target absence, and that the homogeneity of the search display could not be used as a reliable cue to determine whether the target was shown or not.
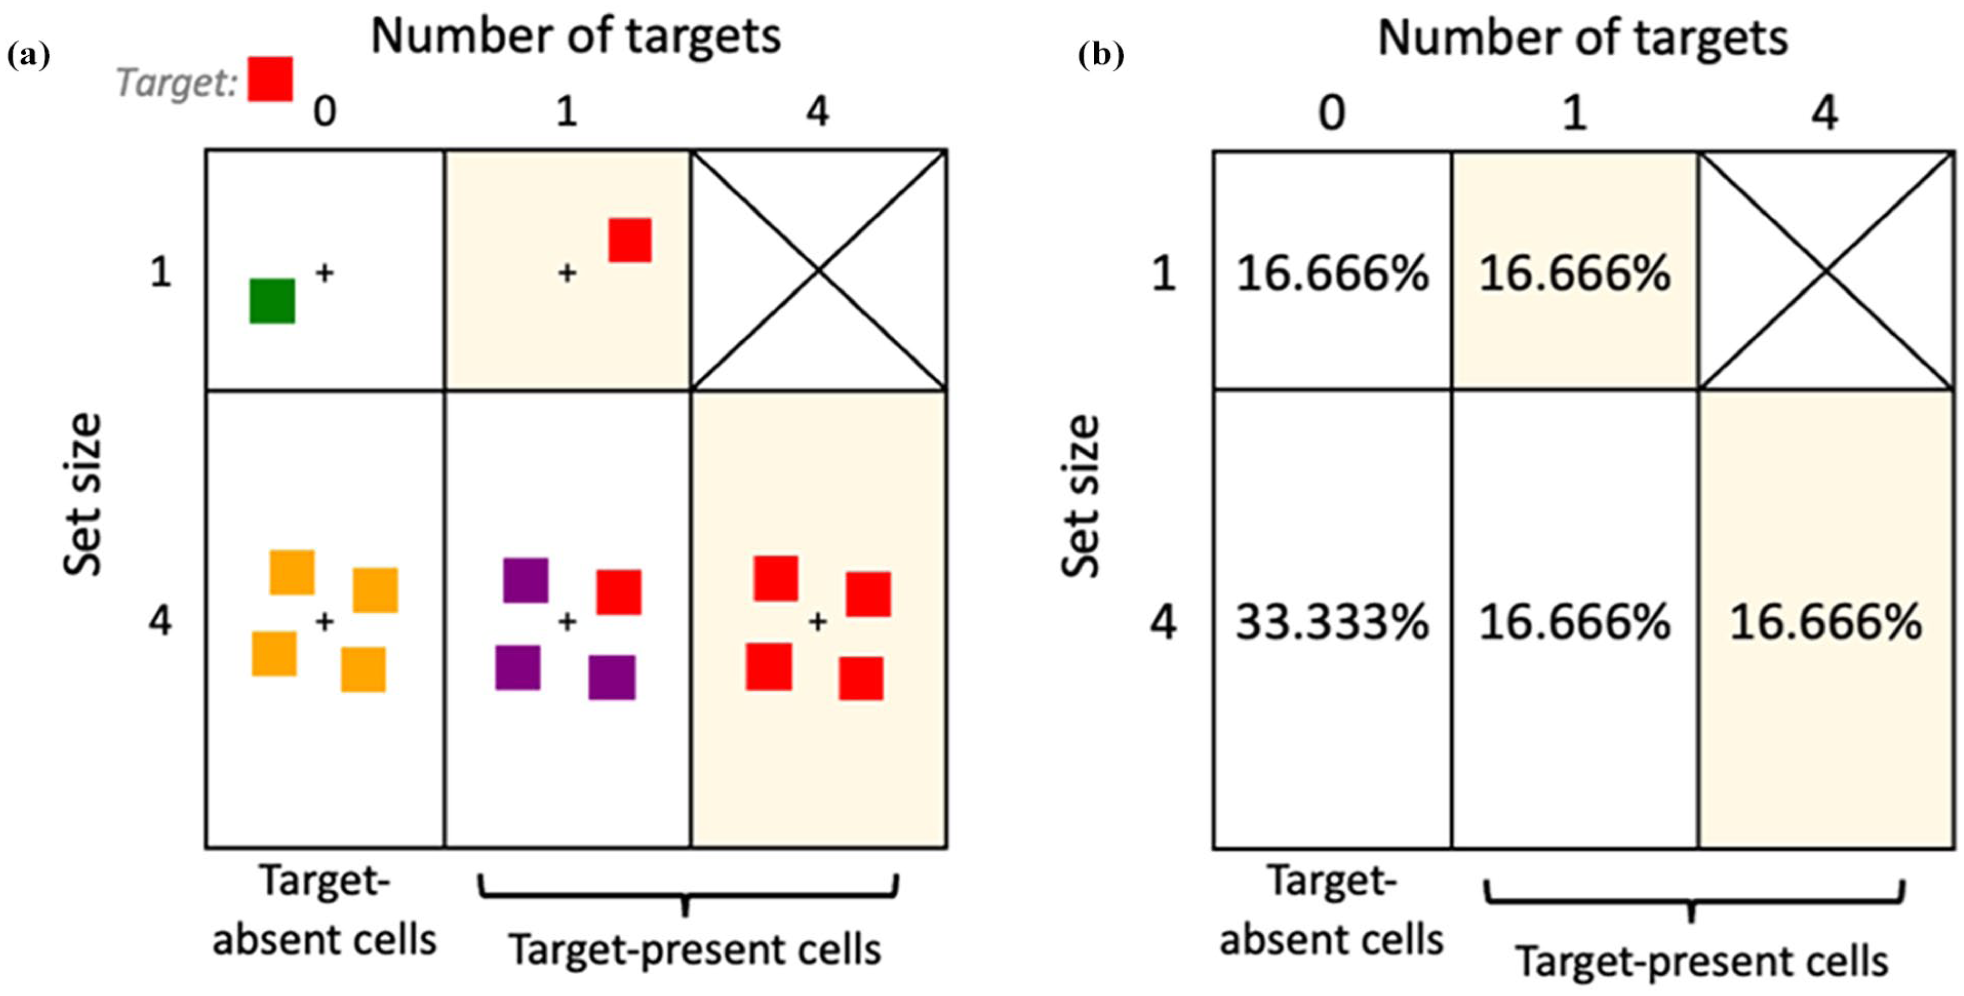
Examples of the five different search display configurations (a) and percentage for each type of configuration (b) employed in the present study. Pure-target trials are shaded by yellow.
Task procedure
The procedure of the rt-MTS paradigm is fairly simple. Each trial begins with a 500-ms fixation cross. Then, the search display is presented and remains on the screen. The participants’ task is to indicate whether the target is presented or not, by pressing one of two keys (e.g., left-arrow key for target presence, right-arrow key for target absence). Participants are told to respond as quickly and accurately as possible, and the response times are measured.
Practice session
Because the dependent variable of the rt-MTS paradigm is the response time, and the effect size of the target redundancy gains is fairly small (around 20 ms), in order to have enough measurement precision, participants need plenty of practice. In Thornton and Gilden (2007), each participant performed 50 to 150 practice trials to keep their error rates below 10%. In this study, each participant did at least 144 practice trials. An accuracy rate of 90% is required to pass the practice; otherwise, the practice session is repeated.
Data analysis
In the rt-MTS paradigm, target redundancy gains are the main indicator for parallel processing (i.e., the parallel processing models predict that the response times should decrease as the number of redundant target increases). Thus, the primary data analysis is a statistical test (e.g., a Bayes t-test) comparing the mean RTs across the pure-target trials with different set sizes. If the mean RT decreases with set size of pure-target trials, it indicates a parallel search. If the mean RT does not change with set size, it indicates a serial search.
The acc-MTS paradigm
Task description
In the acc-MTS paradigm, participants performed a visual search task that is nearly identical to that in the rt-MTS paradigm, with two exceptions: (a) the search display is shown for a brief time that we refer to as display exposure duration (DED); (b) the dependent variable of the task is accuracy rate rather than response time. The experiment has two phases (Figure 1b). In phase 1, the DED is obtained. In phase 2, the search task is conducted. We describe how to obtain the DED in the next session.
Display exposure duration
In order for the acc-MTS paradigm to function properly, a suitable DED needs to be set. If the DED is set too long, the accuracy rates may reach a ceiling (i.e., close to 100%). By contrast, if the DED is set too short, the accuracy rates would reach a floor (i.e., close to 50%, the guessing rate). Both scenarios would not be favorable to the observation of target redundancy gains. In theory, for a parallel search, the accuracy rate for the pure-target conditions should be smallest at set size 1, and it should increase with set size. Therefore, the DED should ideally be set to a value such that the accuracy rate for set size 1 under this DED is around 75% (i.e., midway between 50% and 100%).
Considering the individual differences, the DED was set for each participant before the formal search trials. A staircase procedure was used to determine the DED because the staircase procedure is a very efficient approach to find a threshold processing time that corresponds to a certain performance accuracy-rate level. The accuracy-rate level cannot be set freely but is determined by the staircase structure. According to Karmali et al. (2016), a 2-down 1-up staircase structure corresponds to an accuracy rate of 70.7%; a 3-down 1-up structure corresponds to a rate of 79.4%; 4-down 1-up, 84.1%; 5-down 1-up, 87.1%.
In this study, we chose to use the 3-down 1-up staircase to determine the DED. Therefore, in theory, the accuracy rate corresponding to this DED is around 79.4% when there is only one item in the search array. This would provide a perfect baseline, not too low, not too high. Thus, in the acc-MTS paradigm, if the redundant targets can improve the accuracy rate, that is, if the search process is parallel, there would be enough elevation space (20%) for the task performances, thus ensuring that target redundancy gains can be seen.
The procedure for obtaining the DED is as follows: Each trial begins with a 400- to 1000-ms fixation cross. Then, a color square randomly appears at one of four possible locations which are identical to those employed in the rt-MTS paradigm. After a certain exposure duration (ED), the color square is masked by a color grid. The task is to judge whether the color of the square is the target color (which is fixed for each participant). The target present rate is 50%. Participants give the responses by pressing one of two keys on the keyboard. There are two staircases for each participant, one has a short (30 ms) initial ED, and the other has a long (120 ms) initial ED. Trials of the two staircases are randomly mixed. The ED increases by 10 ms when an incorrect response is made, and it decreases by 10 ms after three consecutive correct responses are made. A “turn” is defined when two consecutive changes made to the ED differ (e.g., from a decrease change to an increase change, or vice versa). Each staircase requires ten turns to be completed. To obtain the final DED, we first calculate the mean ED across the last four turns for each staircase, and then average the two mean EDs of the two staircases to get the ideal DED.
It is worth mentioning that the highest frame rate of the monitors we used is 100 Hz, which means that the smallest step size of the DED adjustment is 10 ms. However, the DEDs obtained for individual participants (with the staircase procedure mentioned earlier) are normally not integer multiples of 10 ms. Therefore, the actual DED we used has to be an integer multiple of 10 ms that is closest to the ideal DED obtained by the staircase procedure. That is, the actual DED used is either rounded up or rounded down from the ideal DED.
Display spatial arrangement
The display spatial arrangement in the acc-MTS paradigm is identical to that used in the rt-MTS paradigm.
Display configurations
The display configurations in the acc-MTS paradigm are also identical to those used in the rt-MTS paradigm.
Task procedure
Each trial begins with a central fixation cross, followed by the search display which is presented for only a limited time (i.e., the DED measured for each participant). The fixation cross was shown for a random duration (between 400 and 1,000 ms). Then, the search array is masked. After that, the participants need to determine whether the target color is shown in the search array. The participants are instructed in advance that they should give top priority to the response accuracy rate and never worry about their response times. They are also required to fixate on the central fixation cross throughout a whole trial. The eye movements of the participants are monitored and also recorded with an eye tracker.
Eye movements control
Although the search display is masked after a short duration of presentation, there is a strategy to keep the search display visible much longer than its actual presentation time. The strategy is to make a saccade after the presentation of the search display but before the presentation of the post mask. Saccades are the rapid eye movements that bring objects of interest onto the central, highly sensitive part of the retina. A stunning phenomenon associated with saccades is the saccadic suppression, which removes the stimulus from awareness (Krekelberg, 2010). Saccadic suppression begins just before (~75 ms) the eye starts to move, and it rapidly weakens once the eye has landed in its new position. During the saccadic suppression, we retain in our awareness the stimuli that preceded the onset of saccadic suppression. In other words, by making a saccade at an appropriate time, participants may retain the image of the search array for about 100 ms. This would completely ruin the acc-MTS paradigm. To eliminate the potential effect of the saccadic suppression, we used a twofold approach. First, the participants were asked to fixate on the fixation cross during search, and their eye movements were monitored by an eye tracker (SR Eyelink II). If, in a trial, the position of the fixation point deviated more than 1.4° from the central fixation cross, the data of this trial would be excluded from data analysis. Second, the time interval between onset of the fixation cross and onset of the search display was varied (randomly between 400 to 1,000 ms) across different trials. This made it impossible for the participants to predict when the search display would show up, and so, prevent them from making the appropriate saccadic eye movements.
Practice session
Each participant only needs to complete 24 practice trials.
Data analysis
In the acc-MTS paradigm, target redundancy gains refer to the increase in accuracy rate as a result of the increase in the number of redundant targets. So, the primary data analysis is a statistical test (e.g., Bayesian t-tests) comparing mean accuracy rates across the pure-target trials with different set sizes. If the mean accuracy rate increases as set size of pure-target trials increases, it indicates a parallel search. Otherwise, it indicates a serial search.
Experimental design
The rt-MTS and acc-MTS paradigms were examined between participants. The rt-MTS task contained at least 144 practice trials and 432 formal trials. The acc-MTS task contained 24 practice trials and 360 formal trials. Participants were seated at a distance of 57 cm from a 24-inch CRT monitor (Sony Co., Japan). The stimuli were displayed at a frame rate of 100 Hz.
Results
The rt-MTS task
The accuracy rate of the search performance was 98.3% for the rt-MTS task. Only the RTs of trials with correct responses were analyzed. Moreover, the trials with an RT shorter than 150 ms or longer than 1,500 ms (about 0.1% of total trials) as well as trials with an RT outside three standard deviations from the mean (about 3.1% of total trials) were also excluded from data analysis. We examined the RTs in both the pure-target trials (i.e., set size 1 with 1 target, and set size 4 with 4 targets) and pure-target-absent trials (i.e., set size 1 with 1 nontarget, and set size 4 with 4 identical nontargets). Mean RTs for the two types of trials at the two different set sizes are shown in Figure 3 (left). Mean RTs for the pure-target trials were 424.9 ms (set size 1) and 420.5 ms (set size 4). Mean RTs for the pure-target-absent trials were 474.4 ms (set size 1) and 451.5 ms (set size 4). The redundancy gains (RTset size 4 − RTset size 1) of the two types of trials are shown in Figure 3 (right).
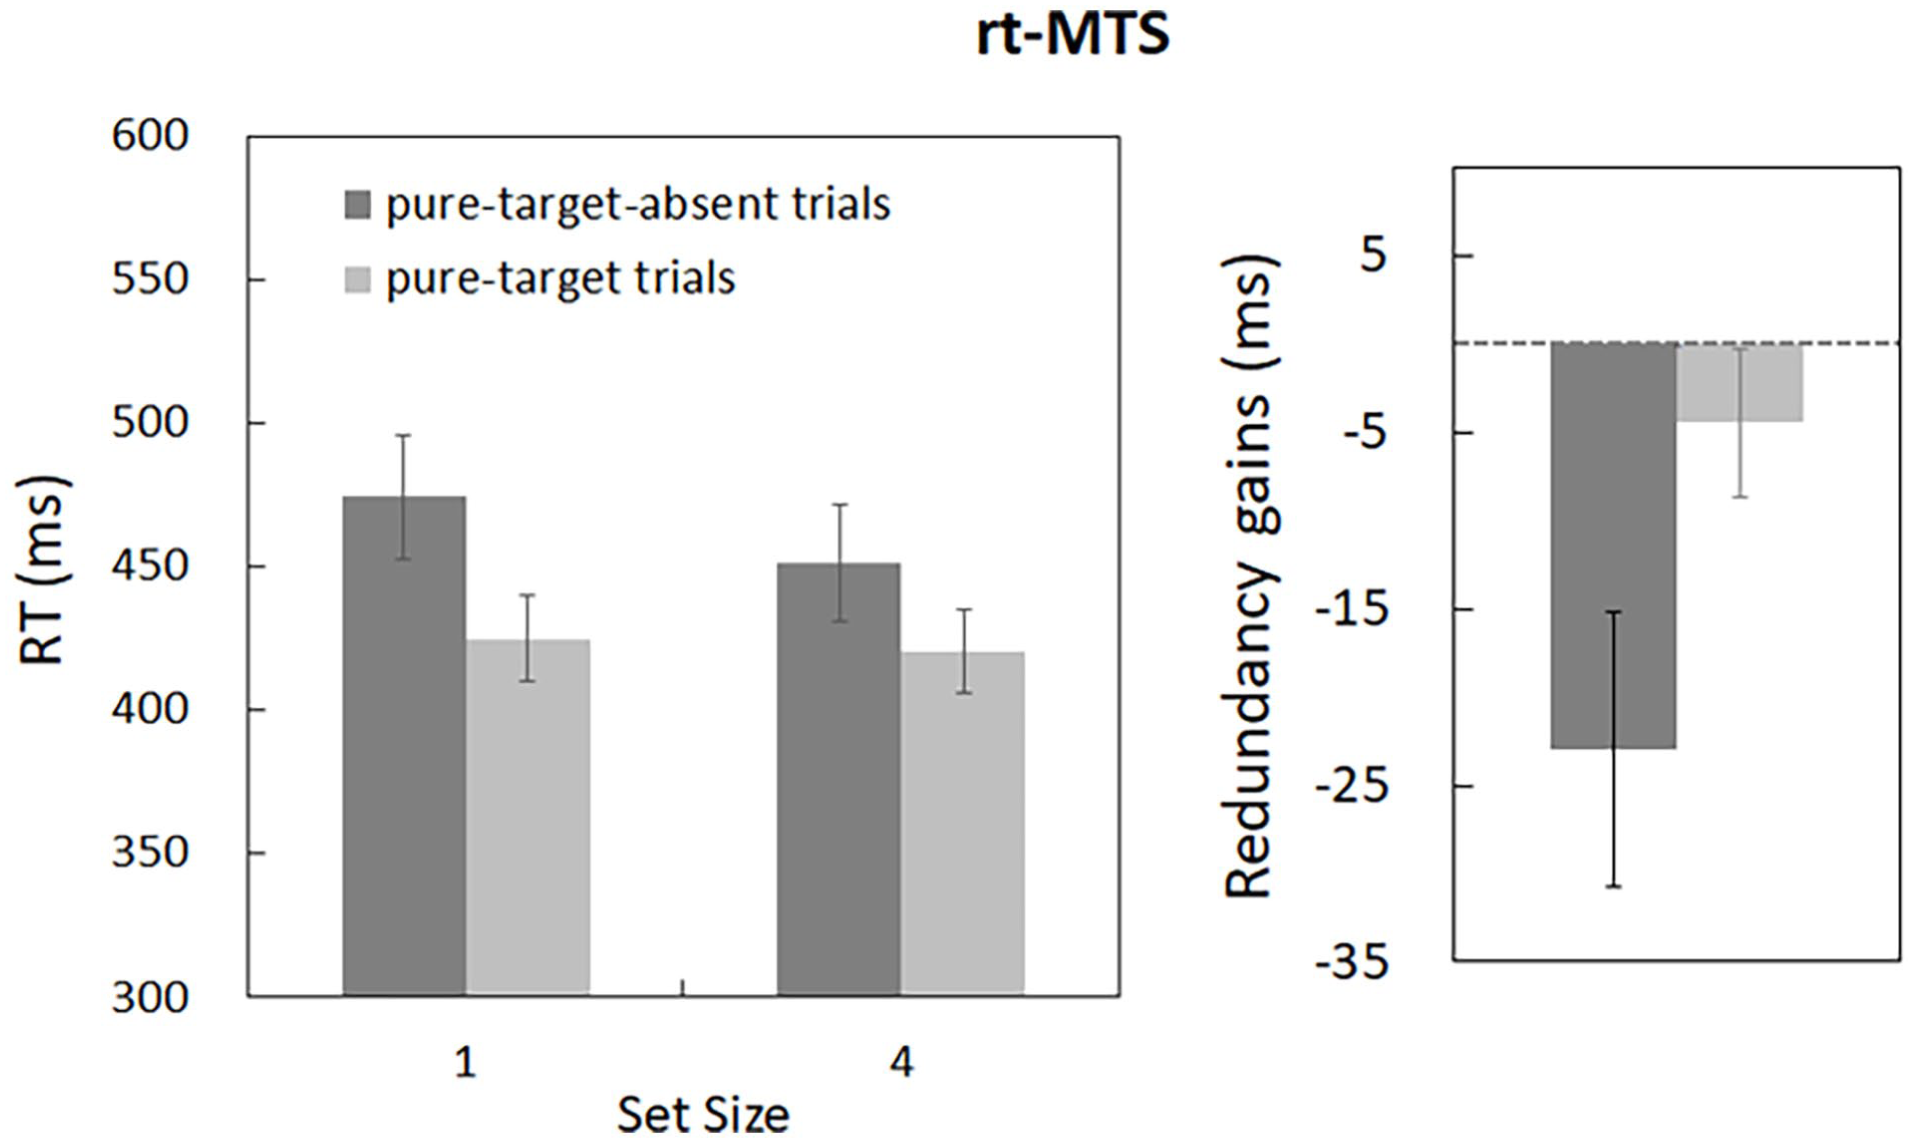
Results of rt-MTS. Mean RTs of pure-target and pure-target-absent trials at set size 1 and 4 (left). Mean redundancy gains of pure-target and pure-target-absent conditions (right).
We conducted a Bayesian paired sample t-test to compare RTs between the two set sizes of pure-target trials. The H1 hypothesis was the RT is longer for set size 1 than set size 4. An increase in pure-target set size from 1 to 4 yields a target redundancy gain of −4.4 ms with only anecdotal evidence (BF10 = 2.47). This suggests that the rt-MTS tends to categorize popout color search as a parallel process, but the evidence is weak even after testing 40 participants. We also conducted a Bayesian paired sample t-test to compare RTs between the two set sizes of pure-target-absent trials. H1 hypothesis: the RT is longer for set size 1 than set size 4. An increase in pure-target set size from 1 to 4 yields a redundancy gain of −22.9 ms, with strong evidence (BF10 = 3.1 × 10⁴). These results closely replicated findings of previous studies 2 (e.g., Thornton & Gilden, 2007; Zheng et al., 2025).
The acc-MTS task
Only the formal trials in which no eye movement occurred during the presentation of the search array were analyzed (about 3.4% of total trials were excluded from data analysis due to eye movements). For the threshold measurement in the acc-MTS tasks, the mean DED across the 20 observers was 21.0 ms. We examined the accuracy rate in the pure-target trials and in the pure-target-absent trials. Mean accuracy rates of the two types of trials at the two different set sizes are shown in Figure 4 (left). Mean accuracy rates for the pure-target trials were 74.6% (set size 1) and 90.0% (set size 4). Mean accuracy rates for the pure-target-absent trials were 88.3% (set size 1) and 90.5% (set size 4). To calculate the redundancy gain for the pure-target trials and pure-target-absent trials, the difference in accuracy rate between set size 1 and set size 4 of the pure-target trials and the pure-target-absent trials were calculated (see Figure 4, right).
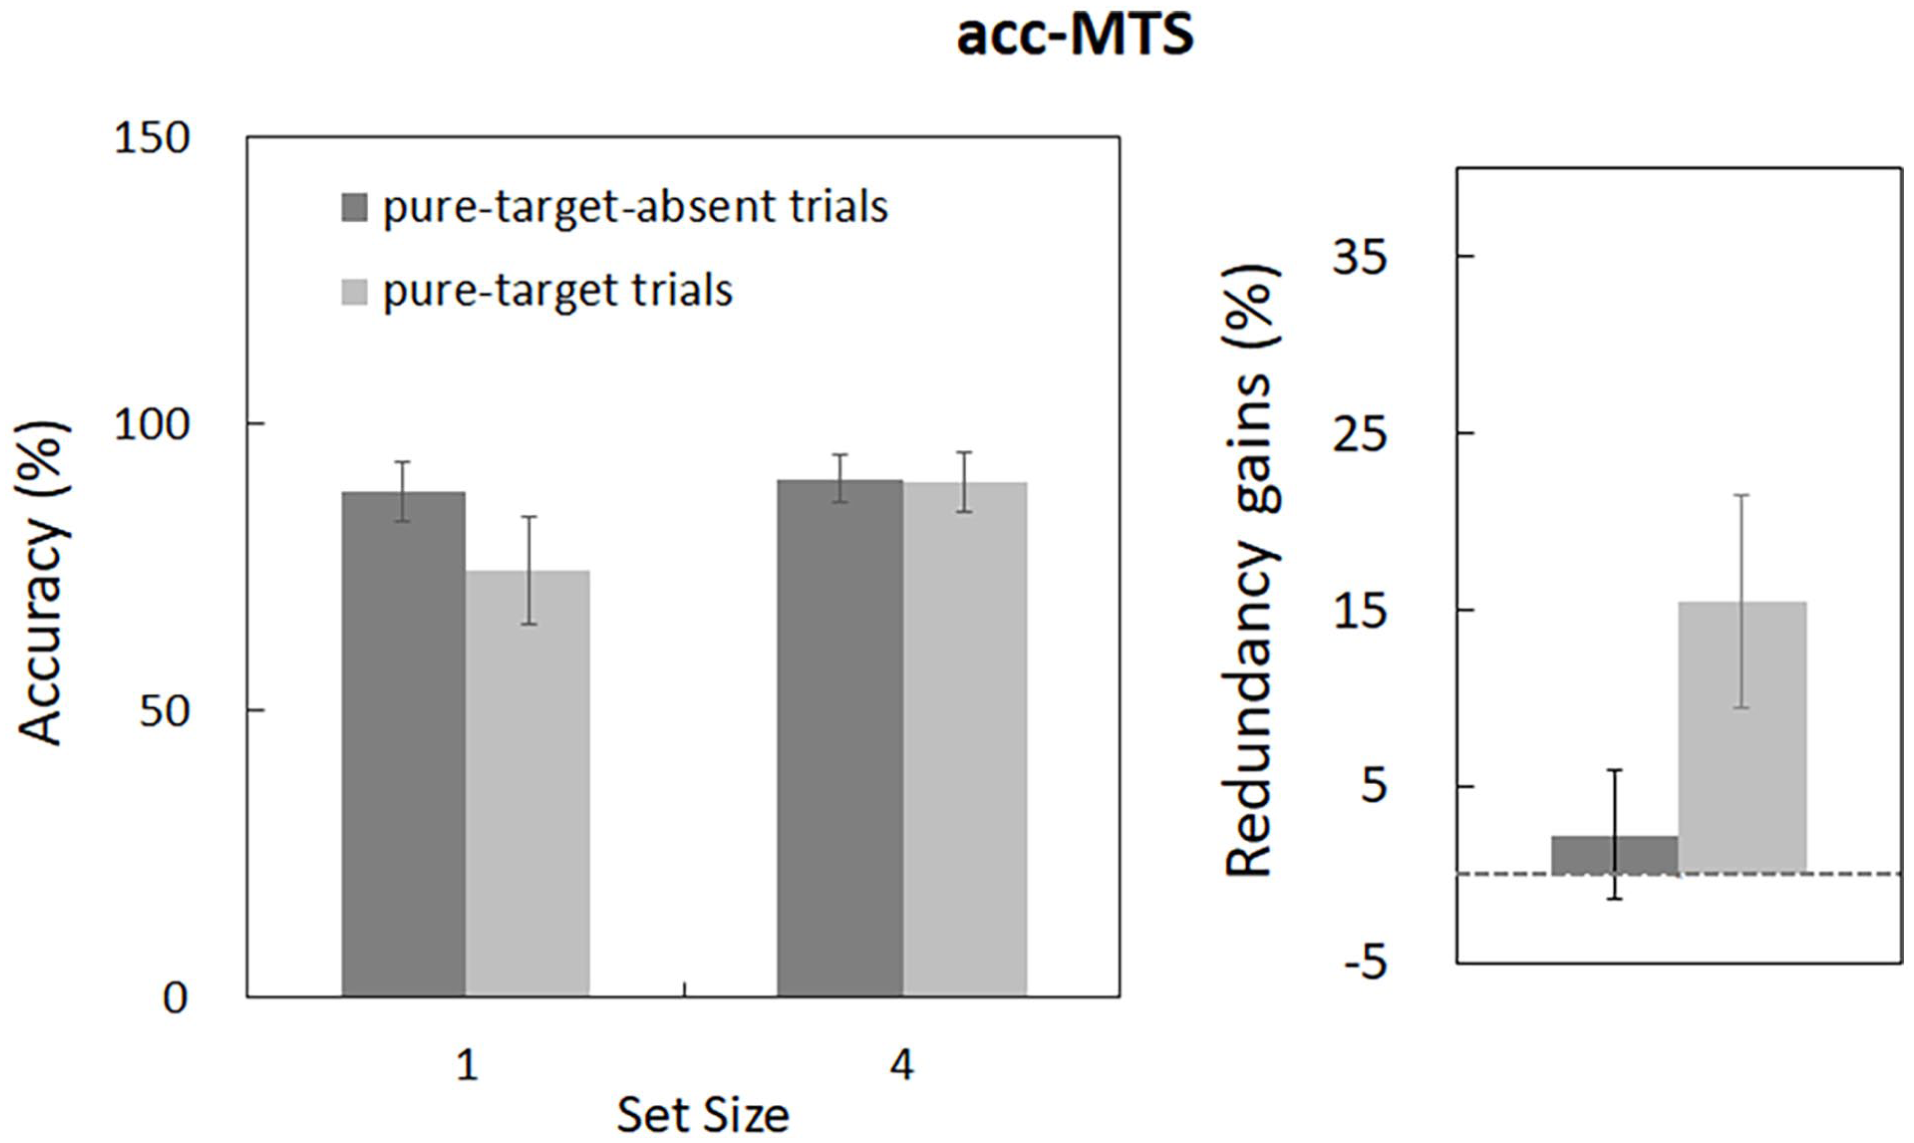
Results of acc-MTS. Mean accuracy rate of pure-target and pure-target-absent trials at set size 1 and 4 (left). Mean redundancy gains of pure-target and pure-target-absent conditions (right).
We conducted a Bayesian paired sample t-test to compare accuracy rates between the two set sizes of pure-target trials. The H1 hypothesis was: accuracy is lower for set size 1 than set size 4. An increase in pure-target set size from 1 to 4 yields a target redundancy gain of 15.4%, BF10 = 6.79 × 10². This means that acc-MTS identifies popout color search as a parallel search. We also conducted a Bayesian paired sample t-test to compare accuracy rates between the two sizes of the pure-target-absent trials. The H1 hypothesis was: accuracy rate is lower for set size 1 than set size 4. An increase in pure-target-absent set size from 1 to 4 yields a target redundancy gain of 2.2%, BF10 = 0.45. This suggests that, in the acc-MTS paradigm, pure-target-absent trials do not exhibit redundancy gains.
Bayesian sequential analysis
The above results show that while the rt-MTS paradigm failed to obtain convincing evidence to support the existence of redundancy gains after testing 40 people, the acc-MTS paradigm obtained strong evidence to support the existence of redundancy gains (BF > 600) after testing only 20 people. This suggests that the acc-MTS paradigm is much more sensitive than the rt-MTS paradigm in detecting the redundancy gain. To provide better demonstration of the efficiency of acc-MTS paradigm, we performed a Bayesian sequence analysis, which tracks changes in Bayes factors as the experimental sample size increases, revealing how evidence develops as data accumulate. We then analyzed the effect of the number of trials completed by participants on the statistical result. In the acc-MTS paradigm, each participant completed a total of 360 trials. We calculated the change of Bayes factors with sample size for the first 120 trials, the first 240 trials, and all 360 trials, respectively. The results are plotted in Figure 5, in which the vertical axis represents the value of the Bayes factor, whereas the horizontal axis represents the sample size. It is obvious that, as the sample size increases, the BF value increases steadily and quickly reaches a statistical criterion (BF >5 or <0.2). Moreover, a minimum of 12 participants is required to obtain strong evidence when analyzing the accuracy data of the first 120 trials for each participant. When analyzing the first 240 trials, a minimum of 10 participants is required. When analyzing 360 trials, the sample size is further reduced to 9 participants. In contrast, the rt-MTS tested 40 participants (each completed 432 trials) and only yielded a Bayes Factor of 2.47, which demonstrates the advantage of acc-MTS.
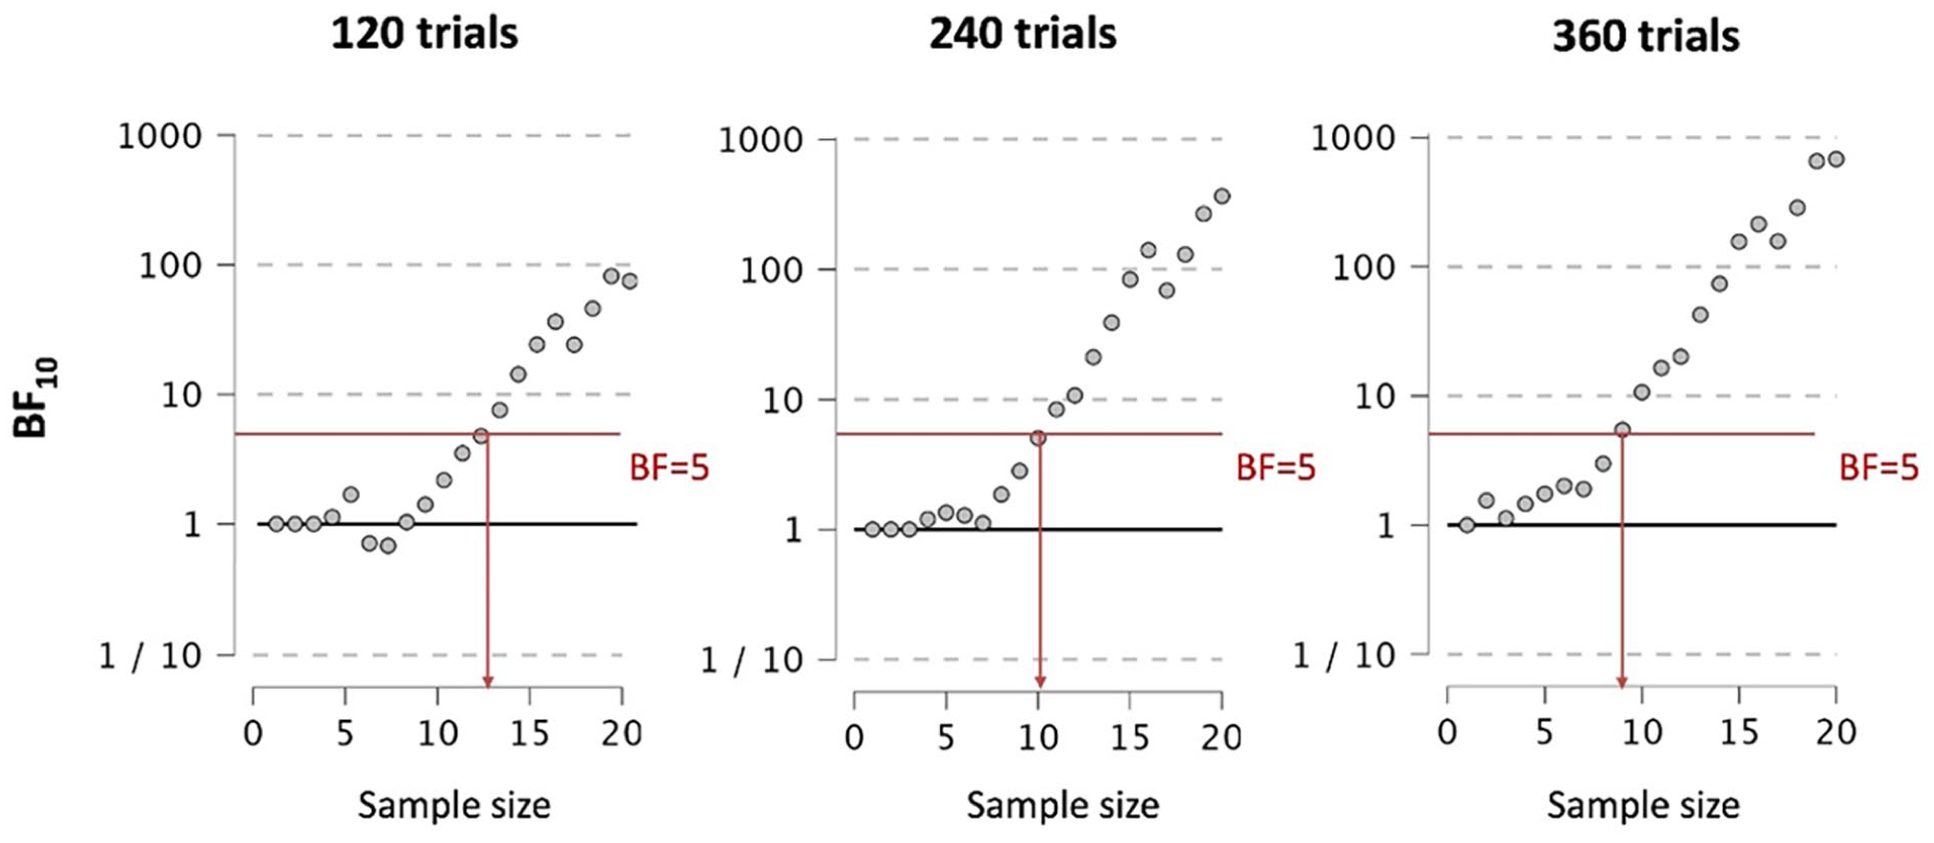
Results of the Bayesian sequential analysis on the accuracy data of the acc-MTS paradigm in the present study. Bayes factors change with each participant, showing sequential development of the statistical evidence as the data accumulate. The three panels show, respectively, the condition under which each individual participant completed different numbers of trials (i.e., 120 trials, 240 trials, and 360 trials).
Discussion
After Anne Treisman proposed her famous feature integration theory (Treisman & Gelade, 1980), many researchers in cognitive psychology became interested in studying the serial-parallel nature of visual search tasks (Bergen & Julesz, 1983; Dick et al., 1987; Duncan & Humphreys, 1989; Eckstein, 1998; Egeth & Dagenbach, 1991; Humphreys & Müller, 1993; Nakayama & Silverman, 1986; Pashler, 1987; Treisman & Souther, 1985). However, since it was recognized that search slopes cannot distinguish between serial and parallel processes (Townsend, 1974; Townsend & Ashby, 1983; Wolfe, 1998), this dichotomy of search modes gradually faded from the focus of visual search researches. The reason the community chose to avoid this issue, however, was not because it had become less important, but rather because the field lacked a simple and effective tool for making such distinctions (see Thornton & Gilden, 2007; Townsend, 1990; Townsend & Wenger, 2004).
To their credit, some researchers have remained dedicated to studying serial and parallel search mechanisms (e.g., Egeth, 1966; Lee et al., 2021; Liesefeld & Müller, 2020; Moore & Wolfe, 2001; Moran et al., 2016; Sung, 2008; Townsend & Wenger, 2004; White et al., 2018; Woodman & Luck, 2003; Zheng et al., 2024, 2025). Some have been improving the approaches for distinguishing serial-parallel searches (van der Heijden, 1975; van der Heijden et al., 1983), while others proposing relevant theories (parallel search models: Cameron et al., 2004; Eckstein, 1998; Eckstein et al., 2000; Eriksen & Spencer, 1969; Hulleman & Olivers, 2017; Palmer, 1995; Palmer et al., 2000; Verghese, 2001; capacity-limited parallel search models: Snodgrass & Townsend, 1980; Ward & McClelland, 1989).
Among the various task paradigms that hold promise for distinguishing between serial and parallel processing (Townsend, 1990), the MTS paradigm (under the Method of Redundant Targets) has been most frequently used in visual search studies (Adkins et al., 1979; Gilden et al., 2010; Thornton & Gilden, 2001, 2007; Zheng et al., 2025). This may be due to two reasons: First, although the MTS paradigm cannot discriminate between the standard parallel models and the coactive models, it effectively separates the two parallel processing modes from serial processing mode (Miller, 1982; Mordkoff & Egeth, 1993; Mordkoff & Yantis, 1991; Raab, 1962). Since researchers in visual search primarily debated whether visual search involves a serial component that is not caused by eye movements (see Zheng et al.’s, 2025 introduction for a brief review), the MTS paradigm is adequate. Second, compared to other task paradigms, MTS offers simpler implementation and more intuitive results interpretation, while being more adaptable to search tasks with large set sizes. For instance, Zheng et al. (2025) used an MTS task with a set size of 12.
If a target redundancy gain is observed in a particular MTS search task, it is certain that the search is a parallel process. But, if no target redundancy gain is observed in a search task, can it be concluded that the search is a serial rather than a parallel process? For the rt-based MTS paradigms, the answer sometimes is “No.” The rt-MTS paradigms are unable to reliably detect target redundancy gains even when measuring the color popout search (Thornton & Gilden, 2007) which is a well-established parallel search. This casts doubt on whether MTS paradigms really can distinguish between serial and parallel search. Additionally, if one explains the redundancy gains in pure-target trials (of the rt-MTS paradigm) using the race model, it becomes particularly challenging to account for the redundancy gains observed in pure-target-absent trials (which clearly does not fit the logic of race model). These limitations of the rt-MTS motivated us to develop the acc-MTS. The present findings demonstrate that the acc-MTS successfully classifies color pop-out search as parallel processing (consistent with the established understanding of pop-out search), while also eliminating the redundancy gains in pure-target-absent trials. This confirms that the acc-MTS effectively resolves the limitations of the rt-based MTS.
Moreover, in the acc-MTS paradigm, participants were only required to complete about 20 practice trials, which is much less than the number of practice trials required by the rt-MTS paradigm (which is more than 100 trials). Meanwhile, the results of the sequence analysis indicate that in the acc-MTS paradigm, a minimum of 9 participants (each completing 360 trials) are sufficient to obtain strong evidence for the existence of redundancy gains. Of course, the number of repeated measurements can be further reduced if the number of participants is increased. For example, when the number of participants reaches 12, each participant only needs to complete 120 trials to obtain strong evidence for redundancy gains. The results suggest that the acc-MTS paradigm is an effective method for measuring redundancy gains and that the acc-MTS is a more efficient paradigm.
There are two things to keep in mind when using the acc-MTS paradigm. First, the DED is critical. If this threshold is not set appropriately, the obtained accuracy rate of acc-MTS could reach the floor or ceiling, which would make it difficult to observe the redundancy gains (even there is one). Of course, this problem is easy to detect. If the observed accuracy rate of acc-MTS at set size 1 is too high (more than 90%) or too low (less than 60%), it means the DED is not set appropriately, and it is necessary to re-measure the DED. Another thing that we need to pay attention to when using the acc-MTS is that we must control for the participants’ eye movements, since saccadic suppression could be used by participants as a strategy to improve their accuracy rate. Therefore, ideally, participants’ eye movements should be monitored. If eye-movement monitoring is not performed, the tendency (and effectiveness) of using the eye-movement strategy can still be reduced by randomly adjusting the time interval between the start of the trial and the presentation of the search array, or by excluding problematic participants by means of a post-hoc questionnaire (asking what strategies they were used).
Readers familiar with Systems Factorial Technology may have concerns regarding the capability of acc-MTS to distinguish between serial and parallel search. Researches have shown that methods based on accuracy measurement would sometimes struggle to effectively differentiate between serial and parallel processing modes (e.g., Eidels et al., 2015). Townsend and Nozawa (1997) even found that certain serial search models can also predict redundancy gains. However, it is important to note that these research conclusions are scientifically valid, but those limitations of accuracy-based paradigms they revealed are primarily related to the stopping rules of the tasks. Specifically, Eidels et al. suggested that when an exhaustive stopping rule (i.e., the AND rule) is employed, accuracy measurements fail to capture temporal dynamic features (e.g., the processing order), making it difficult to distinguish between serial and parallel processing modes. This view aligns with Townsend and Nozawa’s findings, which demonstrated that serial models with limited-capacity exhaustive stopping rules could also produce predictions of redundancy gains.
While the above concerns do not impact the conclusions of this study, they are particularly important for researchers who intend to employ the acc-MTS paradigm to distinguish between serial and parallel search. The critical consideration lies in the necessity of explicitly confirming that the search task adheres to a self-terminating rule before applying this approach (as exemplified in the present study, where participants were explicitly instructed to respond upon detecting any single target among multiple potential targets). However, when the stopping rule governing the search task remains ambiguous or uncertain, it would be methodologically prudent to complement the acc-MTS paradigm with alternative reaction time-based paradigms or the systems factorial technology to achieve more robust and definitive conclusions regarding the underlying processing architecture.
Conclusion
In conclusion, in this study, we demonstrated that the MTS paradigm based on the accuracy rate is a reliable and efficient method to distinguish between serial and parallel searches. This approach is free from the limitations inherent in the traditional rt-MTS paradigms.
Footnotes
Data accessibility statement
Declaration of conflicting interests
The author(s) declared no potential conflicts of interest with respect to the research, authorship, and/or publication of this article.
Funding
The author(s) disclosed receipt of the following financial support for the research, authorship, and/or publication of this article: This study was supported by a grant from the National Natural Science Foundation of China (32071043).
Ethics approval
The experimental procedures reported in the present article were all conducted following the Declaration of Helsinki and were all approved by the local research ethics committee.
Consent to participate
Informed written consent was provided prior to participation.