
Abstract
Perceptual representations of objects are modulated by the semantic consistency between the object and its context, such as the background scene in which it is embedded. In this registered report, we examined the universality of this semantic consistency effect (SCE) by comparing it across two cultures that are conventionally considered to differ in their tendencies to incorporate context in perception and cognition: White-British and Malaysian-Chinese participants. We measured SCEs by comparing the perceived sharpness of objects embedded in semantically consistent and inconsistent scenes. Malaysian-Chinese participants demonstrated SCEs akin to those observed in the literature, but White-British participants experienced no effect. This cultural difference was not mediated by individual differences in cognitive styles (holistic vs. analytical tendencies in visual processing) and/or self-construals that are commonly believed to bias cognitive styles. We speculate that fundamental differences in predictive coding may account for the observed cultural differences, but more research is required to confirm this hypothesis.
Introduction
Humans are adept at forming perceptual representations of objects and making perceptual decisions about them. It is a remarkably rapid process, where the presence of an object (e.g., animal) in a natural scene can be detected by viewing a scene just for 20 ms (Fize et al., 2005). With an additional 10 ms, people can even assign a basic-level semantic label to the detected object, like classifying the picture of an animal as a dog (Wiebel et al., 2013). These findings highlight a remarkable feat of the human visual system, and empirical work conducted in this area has tremendously improved our understanding of object representations in the brain. However, the ecological validity of many of these studies can be questioned. While humans typically encounter objects in meaningful contexts—within specific times and places, alongside preceding and co-occurring perceptual information—many previous studies have largely overlooked the role of this contextual information in shaping object representations. We are not claiming that these studies present objects separated from their context (e.g., the background scene), but rather they fail to consider how the context in which objects are embedded influences the representation of such objects.
Object-Scene Consistency Effects
The background scene in which an object appears is a form of context, and regularities in scenes play a crucial role in object processing. One such regularity is that objects (e.g., flowers) frequently occur in specific categories of scenes (e.g., gardens), which gives rise to the semantic consistency between an object and a background scene. This semantic consistency is well-known to affect various aspects of object processing. In this regard, Palmer’s (1975) initial findings prompted scientists to objectively measure the influence of scenes on object processing. Palmer (1975) presented (and primed viewers with) line drawings of scenes, which were followed by line drawings of objects. Participants classified objects more accurately when they were primed with semantically consistent scenes (e.g., a loaf of bread preceded by a kitchen) than inconsistent scenes (e.g., a mailbox preceded by a kitchen). Following this, several studies have extensively quantified the influence of context and have generally demonstrated an advantage for semantic consistency. When viewers are tasked with classifying objects, semantic consistency often facilitates classification (Biederman et al., 1982; Davenport & Potter, 2004). Similarly, when the task is to locate an object of a specific category, viewers are also quicker if objects are placed in their most naturally likely locations (i.e., a semantic consistency in spatial locations within scenes) than when they are not (Malcolm & Henderson, 2010). Moreover, the deployment of overt attention (fixations) is also guided by the same consistency (Castelhano & Henderson, 2007). In brief, when tasks involve processing categorical attributes of objects, semantic consistency appears to result in improved performance.
Conversely, when tasks do not involve explicit classification and rely heavily on perceptual analyses of objects, the effects of semantic consistency are highly task- and stimulus-dependent. On the one hand, semantic consistency can incur a cost or a benefit depending on the task at hand. For instance, when participants have to detect if an object in a scene has changed (e.g., from being present in the scene to being absent) by pointing to the spatial location of the change, semantic consistency incurs a cost (LaPointe et al., 2013). There is also a cost when perceptually matching an isolated object to one that was presented previously in a scene (Ortiz-Tudela et al., 2023; Spaak et al., 2022). However, instead of locating the change or performing a perceptual matching task, if participants have to identify which object changed (e.g., whether it was a glass that disappeared), semantic consistency facilitates (LaPointe et al., 2013). Another example of task-dependency is that, in the absence of an explicit task to search for an object, effects of semantic consistency on gaze deployment have produced mixed results. While some find that gaze is attracted by semantically consistent objects, others find attraction to inconsistent objects, but it is somewhat clear that viewers fixate longer on semantically inconsistent than consistent objects (see Cornelissen & Võ, 2017 for experimental findings and Wu et al., 2014 for a brief overview of the relevant literature). On the other hand, semantic consistency can enhance or suppress perceptual representations of objects depending on the reliability of the object’s visual signal. For example, both behavioural and neuroimaging evidence demonstrate that semantic consistency increases the perceived sharpness of objects when the object’s signal is unreliable (i.e., blurry), but it decreases the perceived sharpness when the signal is reliable (i.e., not blurry; Brandman & Peelen, 2017; Rossel et al., 2022, 2023).
Semantic consistency effects (SCEs), regardless of whether it is beneficial or costly, are often explained by invoking predictive coding theories, which provide a compelling account (Peelen et al., 2024; Rao & Ballard, 1999). Here, the gist extracted from a scene activates expectations (i.e., prior knowledge) we hold about such scenes, and these expectations are formed from exploiting regularities in the environment through perceptual experiences (Bar, 2004; Peelen et al., 2024). The timescale of such experiences sometimes extends beyond the life experiences of an individual, as we see that some expectations that match regularities of the environment are hardwired in the human brain (Furmanski & Engel, 2000; Girshick et al., 2011). Regardless of their origin, the activation of expectations (e.g., by the gist of a presented scene) results in predictions about what objects should be present in the scene. The disparity between the predicted signal (e.g., expected object) and the actual sensory signal (e.g., the presented object) is conventionally referred to as the prediction error, whereby semantic consistency between a presented object and its background scene would lead to smaller prediction errors.
As highlighted above, the consequences of smaller prediction errors (i.e., high semantic consistency) are highly task dependent, but predictive coding can explain consequences that are both advantageous and costly. For instance, when the prediction error is low for objects that meet the predictions, it may allow the visual system to easily integrate—and therefore, process—those objects (Bar, 2004; Peelen et al., 2024). Integration would be difficult for objects that do not fit the predictions, resulting in greater prediction error. This could explain why semantic consistency facilitates classification (Biederman et al., 1982; Davenport & Potter, 2004) and sharpens perceptual representations when the signal is unreliable (Rossel et al., 2022, 2023). Alternatively, we may allocate greater processing capacity and prioritise objects that result in greater prediction errors than those that result in smaller errors, presumably an attempt to resolve the prediction error in the former case (Peelen et al., 2024). This could explain why, in some cases, perceptual representations are relatively salient for objects that are semantically inconsistent with scenes (Rossel et al., 2023; Spaak et al., 2022), as well as why gaze is sometimes attracted by inconsistent objects, and why people spend more time viewing inconsistent objects (see Wu et al., 2014).
While SCEs take many facets, we were curious whether such effects are uniform across individuals, and more importantly, whether predictive coding based on prior expectations would operate uniformly. When considering potential sources of individual differences, we believe culture is an appropriate candidate to examine, an individual characteristic that semantic consistency studies do not really mention when reporting their participant sample. One possibility is that individuals from different cultures hold different expectations based on their distinctiveness in long-term visual experience, and these differences can contribute to differential perception (e.g., Tse & Cavanagh, 2000). The other possibility that we were interested in is that individuals from different cultures may share similar expectations but may differ in the extent to which those expectations are employed to guide perception.
Culture as a Modulator
Several studies have shown cross-cultural differences in the modulatory effect of context in visual processing. For example, individuals from Eastern cultures (e.g., Japanese) are often influenced by contextual information to a greater extent than those from Western cultures (e.g., Americans), when judging the perceived length or orientation of a line (target) that appears within a square-shaped frame surrounding it (context; Ji et al., 2000; Kitayama et al., 2003; but see Willey & Liu, 2022 for contradicting evidence). Such cultural differences are not limited to the contextual effect of low-level attributes (i.e., a square) on the perception of another low-level attribute (i.e., a target line). For instance, some studies have demonstrated that the classification of expressions conveyed by a target face is altered by its spatial context (e.g., the background scene and emotions expressed by individuals surrounding the target) in Easterners more than Westerners (Ito et al., 2013; Masuda et al., 2008). This is an example of cultural differences in the effect of a high-level semantic attribute in the context (e.g., the emotion of surrounding individuals) on the interpretation of the same attribute in the target. What we do not know is whether cultures differ in the influence of high-level attributes of context (e.g., semantic meaning of a scene) on the perception of lower-level attributes of a target object (e.g., the perceived sharpness of objects), specifically when predictive coding operates through top-down effects.
These cultural differences in integrating the target with the context obviously cannot arise from a nominal distinction between cultures. Accordingly, one of the popularly scrutinised explanations of these cultural differences originates from the relationship between social structures archetypal of cultures and cognition. Traditionally, Western cultures are considered individualistic (e.g., American and many European cultures) and Eastern cultures are considered collectivistic (e.g., Japanese, Chinese, and other East Asian cultures); based on national-level indicators, this segregation still remains true (see Pelham et al., 2022). Individualism places greater emphasis on the individual as an entity separated from the rest of society, while collectivism emphasises the individual in relation to society. Individuals raised in different social structures differ in their self-construals, with individualism promoting independent self-construals and collectivism promoting interdependent self-construals (Markus and Kitayama, 1991a; Matsumoto, 1999).
The idea that social structures and resulting self-construals may influence cognition is not new (see Markus & Kitayama, 1991b) and has also been proposed to explain cultural differences in susceptibility to context. Differences in social structures and self-construals foster different types of thinking, and therefore modulate perception and cognition too (Hong et al., 2000; Ji & Yap, 2016; Markus & Kitayama, 1991a, 1991b; Nisbett & Miyamoto, 2005). Westerners, such as Americans who come from a predominantly individualistic culture with independent self-construals, have a tendency to process visual information in an analytical manner (Nisbett & Miyamoto, 2005). This tendency would make them process a visual target with minimal influence from its context. Easterners, such as Japanese who come from predominantly collectivistic cultures with interdependent self-construals, have a tendency to process visual information in a holistic manner (Nisbett and Miyamoto, 2005). This would make them process a visual target in relation to its context. This logic is what makes some researchers attribute East-West differences in contextual effects to culture-specific cognitive styles, namely holistic and analytical thinking (e.g., Kitayama et al., 2003; Masuda et al., 2008). Surprisingly, the culture specificity in this attribution is made by assuming that cognitive styles originate from socio-cultural constructs such as self-construals, which is controversial. Sometimes, even when Westerners and Easterners exhibit analytical and holistic cognitive styles, respectively, individuals from these two cultures do not necessarily differ in their self-construals (e.g., McKone et al., 2010). Therefore, measuring social constructs is crucial, and in fact, should be mandated, to attribute culture-specific cognitive styles to socio-cultural constructs.
Proposed Study
Since cognitive styles are believed to be different between cultures, we reasoned that individuals coming from an Eastern culture (e.g., Malaysian-Chinese), likely with a holistic cognitive style and interdependent self-construals, would rely more on the scene context when perceiving an object in it. In contrast, individuals coming from a Western culture (e.g., White-British living in the United Kingdom), likely with an analytical cognitive style and independent self-construals, would rely less on the scene context. More specifically, we expected that Easterners would use predictions arising from (the activation of prior knowledge related to) a scene’s gist to guide perception of objects to a greater extent than Westerners, resulting in stronger SCEs in Easterners. Our expectation is also backed by a comparable principle suggested for individuals with autism spectrum disorder, whose bias to perceive visual information analytically may reflect impaired top-down guidance from expectations (Happé & Frith, 2006).
We aimed to test this possibility by measuring SCEs on perceptual representations (i.e., perceived sharpness) in a sample of White-British living in the United Kingdom and in a sample of Malaysian-Chinese living in Malaysia, after ensuring that they had lived in their respective countries since birth. We found SCEs on perceived sharpness of objects (Rossel et al., 2022, 2023) particularly intriguing because they inform how cognition—in the form of predictions—penetrates perception, and how perception is therefore constrained by cognitive functions. To this end, we used a paradigm initially designed by Lupyan (2017) and later adapted by Rossel et al. (2022, 2023) to measure SCEs on perceived sharpness.
Rossel et al. (2023) presented two images side-by-side to participants. Each image had the same object (e.g., a boat) that was filtered to have an identical level of blur objectively, but the background scene was different. One had a background that was semantically consistent with the object (e.g., a harbour scene), while the other had a background semantically inconsistent with the object. Participants were asked to adjust the blur level of one of the two images until the objects in both images appeared equally blurry (or sharp) to them. Despite objects in both scenes having the same objective level of blur, participants perceived the object in the semantically consistent scene as relatively less blurry (i.e., sharper), because they increased its blur level to match the object in the inconsistent scene. It is worth noting here that this effect only occurred when the objects’ blur level was high (i.e., the signal was unreliable) and not when it was low (i.e., the signal was reliable). Accordingly, we followed Rossel et al.’s (2023) method, but selectively presented objects only at a high-level of blur. Based on participants’ adjustments of blur, we calculated the difference in adjusted blur levels between the object in the consistent scene and that in the inconsistent scene. This was our measure of the SCE.
First, we compared mean SCEs between the nominally distinct cultures in our participants at the group level. Second, we examined whether the influence of culture on SCEs is mediated by our participants’ cognitive styles and self-construals. Cognitive styles were measured using a computerised equivalent of Kitayama et al.’s (2003) frame-line task. It is a behavioural task that measures the extent to which context (a square-shaped frame) interferes with judging the perceived length of a line inside the frame (Kitayama et al., 2003). The greater the interference, the more holistic an individual is thought to be. We expected that greater tendencies to process information holistically would predict larger SCEs.
Self-construals were initially measured using the self-construal scale originally proposed by Singelis (1994). This popularly used scale conceptualises self-construals as two orthogonal and unitary dimensions, namely interdependence and independence. However, some critics of this conceptualisation argue that it is oversimplified and that it does not comprehensively capture the nuances of cross-cultural and inter-individual variability in self-construals (e.g., Hardin et al., 2004; Vignoles et al., 2016). Addressing these issues, more recent research has shown that self-construals are multifaceted and that it is more informative to model self-construals as multiple dimensions that are bipolar in nature (Vignoles et al., 2016). While one end of each dimension would characterise independence, the other end would characterise interdependence. Accordingly, we also measured self-construals using some relevant dimensions extracted from Vignoles et al.’s (2016) multi-dimensional model (and its later developments) of self-construals. For all dimensions measured, we expected that the degree of polarity towards the interdependent pole of a dimension would predict stronger SCEs.
Methods
Participants
An a priori estimation of sample size was carried out using G*Power 3.9.1.7 (Faul et al., 2007). We intended to perform two types of analyses to assess cultural differences. One was an independent-samples t-test comparing contextual effects between the 2 distinct groups of participants (Asians and Caucasians), for which G*Power estimated a sample size of 128 participants (64 per group) to obtain a medium effect size of
To ensure sufficient statistical power for both analyses, we recruited 130 participants with normal or corrected-to-normal vision and with no known diagnosis of Amblyopia. Sixty-five of those were White-British participants (age: mean [M] = 21, standard deviation [SD] = 3; sex: 15 males) recruited at Bournemouth University, United Kingdom. They had lived in the United Kingdom since birth. The remaining 65 participants were Malaysian-Chinese participants (age: M = 21, SD = 3; sex: 27 males), recruited at the University of Nottingham Malaysia, and they had lived in Malaysia since birth. White-British participants were compensated with course credits. Malaysian-Chinese participants were compensated with course credits and/or 10 Malaysian Ringgits.
Materials
Object Perception Task
This task was designed to measure perceived sharpness (or blur) of objects that are presented in consistent and inconsistent scenes. To identify appropriate stimuli for this task, we extracted some images under the Creative Commons license from Pixabay and Google. First, 40 images of objects were extracted. Second, for each object (e.g., jeep), we extracted one scene that appears to have high semantic consistency (e.g., road) and another one that appears to have low semantic consistency (e.g., kitchen). This resulted in a total of 80 scene images extracted. These initial extractions were based on the authors’ subjective impressions from visual inspection.
Each scene (e.g., a scene of a river) extracted was cropped to a square, ensuring that the cropped-out regions of the scene do not compromise its semantic content. Scenes were then resized to have a height of 500 pixels and converted to greyscale by independently weighting and summing the red, green, and blue channels of the image according to the Commission internationale de I‘éclairage (CIE) procedure (0.299 × R + 0.587 × G + 0.114 × B). In greyscale images, pixel intensities ranged between 0 (black) and 255 (white), with 256 potential grey levels.
Each object (e.g., a boat) extracted was first cropped such that the object’s outline abuts the image borders. Next, each object was resized so that the maximum of its two dimensions (height and width) does not exceed 85 pixels, while maintaining the same aspect ratio as the originally cropped image. Objects were then converted to greyscale using the same CIE procedure as above, and pixels outside the object’s outline were replaced with transparent pixels. Finally, objects were centred on a uniformly grey (pixel intensity = 128) square-shaped image with a height of 85 pixels. Matlab 2024a (Mathworks, Massachusetts, United States) was used for resizing images and converting them to greyscale, but for all other image processing steps mentioned above, we used Adobe Photoshop CS6.
The two groups of participants in this study came from different cultures. Their familiarity with the objects we present may have differed, and this could extend to the perceived semantic consistency between objects and scenes as well (see Weigl et al., 2024). To minimise potential influences of these factors on participants’ adjustments of blur levels in the object perception task (see below), we conducted a process of stimulus validation online, using Testable (https://testable.org; Rezlescu et al., 2020). This validation involved 20 White-British (age: M = 21, SD = 3; sex: 5 males) and 20 Malaysian-Chinese (age: M = 22, SD = 1; sex: 8 males) participants, who did not participate in other tasks of the main study. Each participant viewed 80 experimental trials on their own computers. At the beginning of each trial, a unique object was presented alone on the left-hand side of the screen. Participants indicated on a 5-point Likert scale how familiar they are with the object (1—not at all, and 5—absolutely). Once they completed it, a scene appeared on the right-hand side of the screen (interval 1). Participants indicated the semantic consistency between the object and the scene on a 5-point Likert scale (1—not at all, 5—absolutely). The scene was then replaced with another scene (interval 2), and participants also rated that object-scene combination for semantic consistency. One interval presented a semantically consistent scene, and the other a semantically inconsistent scene; consistency in both cases was pre-determined by the authors. The order of presenting those scenes was randomised across intervals.
Participants’ responses were first used to exclude objects with significant differences in familiarity between groups, determined via two-tailed Mann-Whitney U-tests. All 40 object images we validated produced non-significant differences in familiarity ratings between the 2 groups and mostly had ceiling levels of familiarity (see Supplemental Table S1). Next, the semantic consistency of object-scene combinations (i.e., two scenes per object) was evaluated. For any given object, object-scene combinations were identified as suitable for the object perception task if two criteria were met (see Supplemental Tables S2–S6): (a) consistent combinations have significantly higher mean semantic consistency ratings than inconsistent combinations in both participant groups (two-tailed Wilcoxon signed-rank tests), and (b) mean consistency ratings do not differ between groups for either combination type (two-tailed Mann-Whitney U-tests). Both criteria were met for 39 out of 40 objects validated. Among those, we selected 20 objects with high differences in semantic consistency ratings between their consistent and inconsistent combinations, and those that looked conspicuous to the authors when the least amount of blur is applied (see Supplemental Material for the final list of objects). These object-scene combinations were retained for the object perception task. We used non-parametric comparisons to assess all validation criteria as the data were not normally distributed.
Following a similar (but not identical) method to that of Rossel et al. (2022, 2023), we created filtered duplicates of each object image retained from the validation. This involved convolving a two-dimensional Gaussian kernel with the object images, using the imgaussfilt function in MATLAB (Mathworks, Massachusetts, United States). In the experimental task, we presented two different versions of each object, one labelled as the “target” and the other labelled as the “sample.” To create filtered targets, we always used an SD of 5.8 for the Gaussian kernel. The SD here is different from what was used by Rossel et al. (2023) to demonstrate an advantage of semantic consistency for highly blurred objects. This is because the SD has been adjusted to suit the size of our objects, as our objects were smaller than what they used. For each filtered sample that was presented to participants, the initial SD was selected randomly from a set of values ranging from 4.6 to 7.4 with a spacing of 0.4. As described in the “Procedure” section below, the SD of the sample can change based on the participant’s response. Both filtered targets and samples were only superimposed on scenes after being inserted in the centre of a uniformly grey square-shaped background with a height of 177 pixels. The resulting image was multiplied by a circularly symmetric tapered-cosine window of 60-pixel radius to ensure that objects are visible through a soft-edged circular aperture. With these stimuli, we created two unique combinations of objects superimposed on scenes, characterised by the version of the object (target vs. sample) and the semantic congruency of the object to the scene (congruent vs. incongruent): sample-consistent (SC) paired with target-inconsistent (TI), and sample-inconsistent (SI) paired with target-consistent (TC). An example of one of these object-scene pairings is provided in Figure 1a.
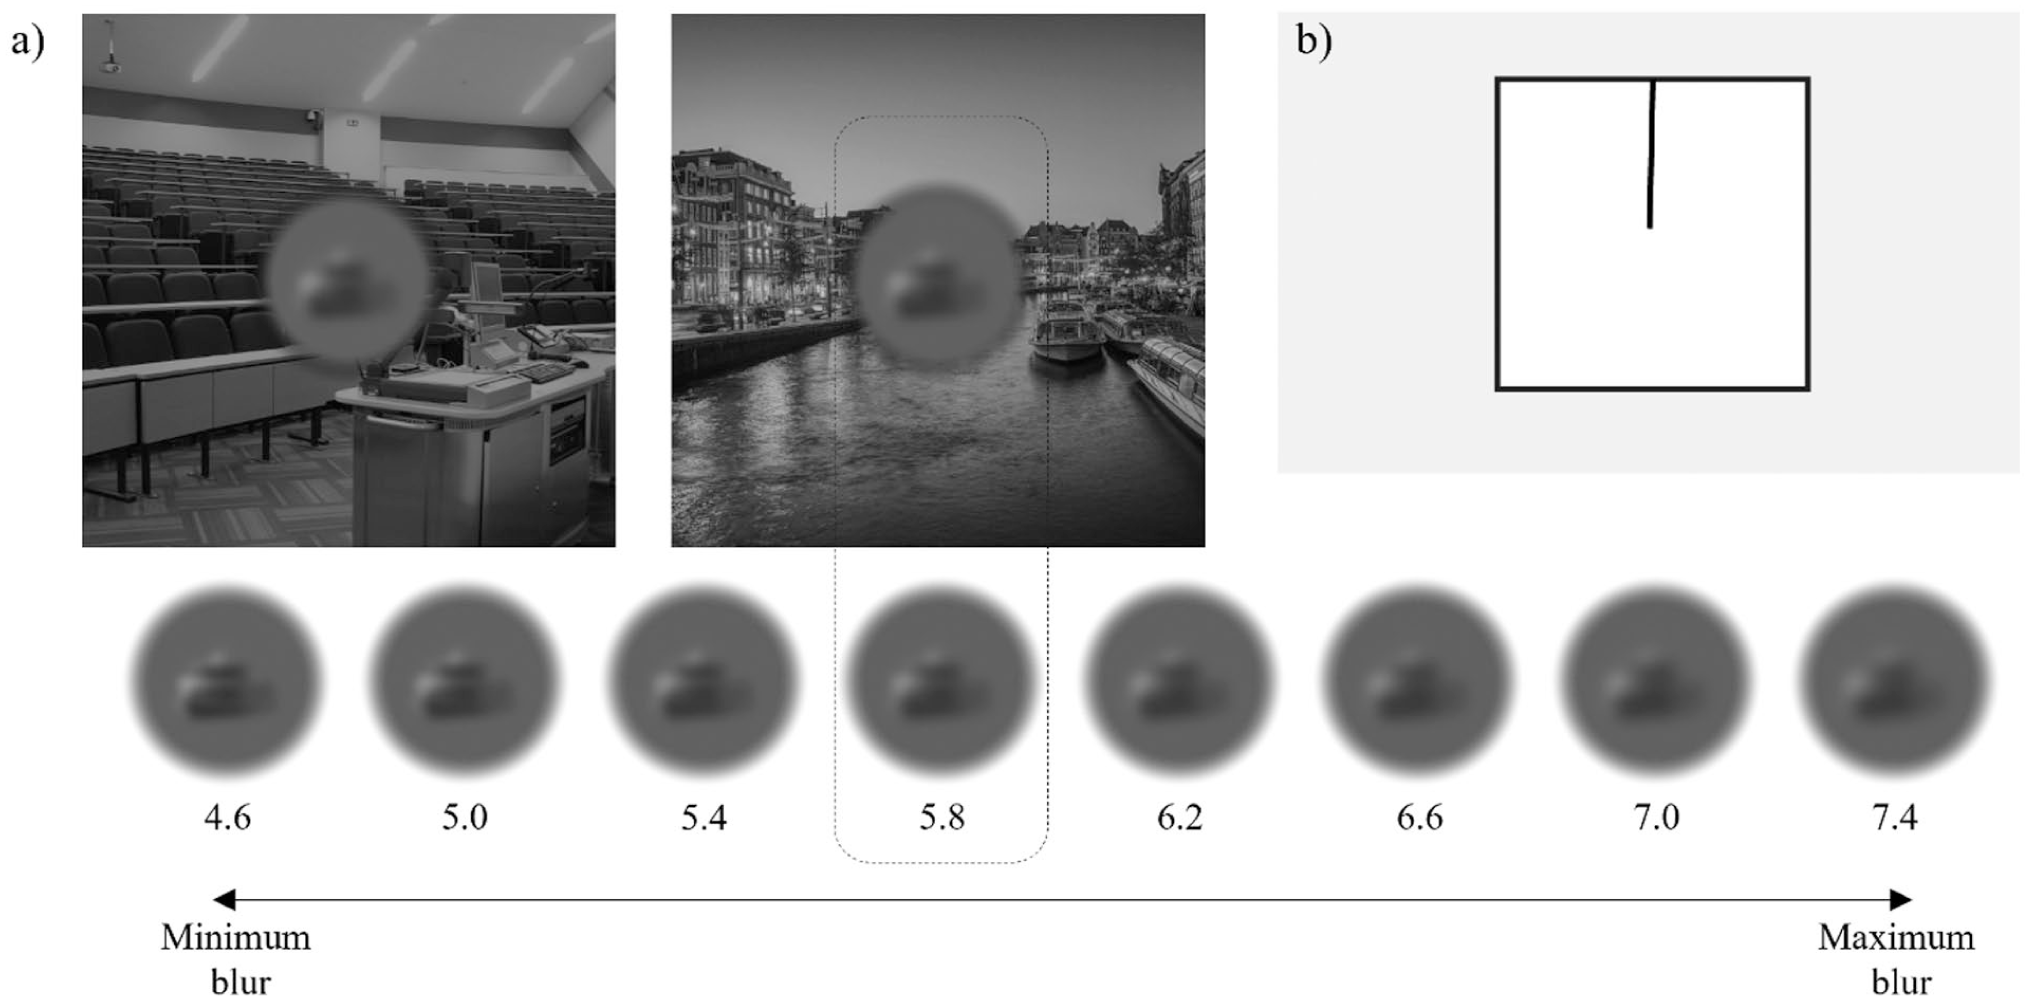
Examples of stimuli used in (a) the object perception task and (b) the frame-line task.
Moreover, our main measure with regards to these visual stimuli was how subjective perception of blur in objects differed depending on whether they were placed in semantically consistent or inconsistent scenes. Accordingly, to ensure that there are minimal objective differences in low-level visibility between various scenes and between various objects, we used MATLAB and equated all the scenes and all the objects (separately) to have the same low-level visibility. To do that, we first calculated each scene’s (or each object’s) visibility using a method proposed by Hussain Ismail et al. (2019). In this method, visibility is calculated as the dot product between an image’s power spectrum and a window of visibility that models contrast sensitivity as a function of spatial frequencies. The visibility index here gives a measure of the effective contrast of an image, after taking into account the human visual system’s non-uniformities in contrast sensitivity to various spatial frequencies. After calculating the visibility of all images in a set (scenes or objects), we found the average visibility across all (unfiltered) images within a set, and defined half of this value as the “reference visibility.” The amplitude spectra of all the images in a set (except the image that holds the reference visibility) were uniformly adjusted to reach the visibility of the reference image, thereby equating all images for low-level visibility. Amplitude spectra of all filtered target objects were also adjusted to reach the reference visibility of unfiltered objects, and variants of the sample were created by simply manipulating the level of Gaussian blurring of these adjusted targets.
Frame-Line Task
This task, originally developed by Kitayama et al. (2009), was used as a behavioural measure of cognitive styles. Specifically, this task evaluated participants’ abilities to integrate (in the “relative” version) or ignore (in the “absolute” version) contextual information. Details about both versions are provided in the “Procedure” section, but the basic stimulus for both tasks is a square frame and a vertical line that originates from the top edge of the frame and extends into the frame’s interior space (see Figure 1b).
Questionnaires Measuring Self-Construals
Two self-report questionnaires were used to measure self-construals in our participants. The self-construal scale (Singelis, 1994) is a 24-item questionnaire that measures self-construals along the two orthogonal and separate dimensions, interdependence and independence (Supplemental Material Section S2). The scale has 12 items per dimension, and for each item, participants’ responses were obtained on a 7-point Likert scale (1 = strongly disagree and 7 = strongly agree). The second multi-dimensional scale included items taken from a selected number of dimensions in Vignoles et al.’s (2016) seven-dimensional model of self-construals (Supplemental Material Section S3). We first included dimensions for which Vignoles et al. (2016) demonstrated statistically significant differences between Westerners (which included people from the United Kingdom) and Southern/Eastern Asians (which included Malaysians). These dimensions were difference versus similarity (six items measuring how self is distinguished from others), self-direction versus receptiveness to influence (six items measuring how decisions as made with reference to self and others), consistency versus variability (six items measuring how an individual operates in difference contexts), self-expression versus harmony (six items measuring how individuals communicate with others). For these dimensions, the reliability across nations (United Kingdom and Malaysia) ranges between acceptable (Cronbach’s α = 0.68) to good (
Apparatus
All the questionnaires were delivered online using the survey platform Qualtrics (Provo, UT, USA). To present the behavioural (object perception and frame-line) tasks to the Malaysian-Chinese participants, we used a gamma-linearised Samsung 27-inch W-LED screen with a spatial resolution of 1,920 (width) × 1,080 (height) pixels, and a refresh rate of 60 Hz. To present the same tasks to the White-British participants, we used a gamma-linearised BenQ 24-inch LCD screen with a spatial resolution of 1,920 (width) × 1,080 (height) pixels, and a refresh rate of 60 Hz. To maintain identical visible sizes of stimuli (in degrees of visual angle), Malaysian-Chinese were seated 63 cm from the screen, and White-British participants were seated 55 cm from the screen, both using the support of a chin rest. Participants completed the two behavioural tasks in a dark room. For the frame-line task, stimuli on the screen were viewed through a circular aperture placed on the screen to occlude the vertical and horizontal borders of the screen, while displaying as much of the screen as possible. For both the object perception and frame-line tasks, stimulus presentation and response collection were controlled via MATLAB, using the Psychophysics toolbox v3.0.19 (Brainard, 1997; Pelli, 1997).
Procedure
Experimental procedures were approved by the Faculty of Science and Engineering Faculty Research Integrity and Research Ethics Committee at the University of Nottingham Malaysia (approval code: AMHI090425), and the Ethics Committee of Bournemouth University (approval code: 61979). All participants began participation by providing informed consent, followed by completing the two self-construal questionnaires on Qualtrics. Next, after a 2- to 3-min break, participants completed the object perception task. In this task, participants were presented with 80 experimental trials. Twenty of those trials presented the SC_TI pair, with the sample stimulus containing an object semantically consistent with its background scene and the target stimulus containing an object semantically inconsistent with the background. Another 20 trials presented the SI_TC pair, where the sample’s object was semantically inconsistent with its background and the target’s object was semantically consistent with its background. The third set of 20 trials presented an SC_TC pair, while the fourth set presented an SI_TI pair. Within each set of 20 trials, a unique combination of object and scene was only used once. Trials from the 4 unique pairings (SC_TC, SI_TI, SC_TI, and SI_TC) were fully randomised and intermixed within a single sequence of the 80 experimental trials. Trials with SC_TI and SI_TC pairings allowed us to assess SCEs, while SC_TC and SI_TI pairings allowed us to estimate the presence of response biases, if any.
Each of the 80 experimental trials commenced with a white fixation cross shown in the centre of a mid-grey screen for 1,000 ms. This was followed by the sample-target combination presented on the screen until a confirmation response (see below) was received from the participants. The sample and target were presented on either side of the vertical meridian of a mid-grey screen, but along the same horizontal meridian. Above each image, a label indicated to the participant which stimulus is the sample and which one is the target. The sample (and the target) could appear on the left- or right-hand side of the screen randomly. Participants were instructed to adjust the blur level of the sample’s object to match the blur level of the target’s object by pressing the “up” or “down” arrow keys on the keyboard to decrease (make it sharper) or increase (make it blurrier) the blur level, respectively. Each keypress adjusted the blur level at an SD of ±0.4. The adjustments were not allowed to go outside the permitted range of adjustments (i.e., below a blur level of SD = 4.6 or above SD = 7.4). Once participants were satisfied with their adjustment, they pressed the space bar as a confirmation response to terminate the trial. Participants were required to make a minimum of two adjustments before proceeding to the next trial (e.g., increasing and then decreasing the blur level, or vice versa, even if they perceived equal blur levels in the sample and target from the very beginning of the trial).
Lastly, after another 2 to 3 min break, participants completed the frame-line task. This task consisted of two versions, which participants completed in a counter-balanced order. Regardless of the version, each trial started with the presentation of a white fixation cross in the centre of a mid-grey screen for 500 ms. Next, a single frame-line stimulus (Figure 1b) was presented for 1,000 ms. This (“reference” stimulus) was followed by the presentation of a noise mask for 1,000 ms. The mask was a uniform distribution of grey values between black and white, freshly generated for each trial. The purpose of the mask was to interfere with any afterimages the frame-line stimulus would leave, as afterimages can serve as a reference for the task that the participants are going to do. After the mask, participants were shown a second frame-line stimulus (the “test” stimulus), which remained on the screen until a response was confirmed. In the absolute version of the task, participants adjusted the line of the test to have the same exact absolute line length as the reference. In the relative version of the task, participants also adjusted the length of the line, but to ensure that the proportion of the line to the frame’s height in the test was identical to the same proportion in the reference. The length was adjusted by using the up, down, left, and right arrows. Pressing up or right arrows increased the length by ± 10 or 1 pixel(s), respectively. Pressing the down or left arrows decreased the length by ±10 or 1 pixel(s), respectively. Once participants were satisfied with the adjustment, they pressed the space bar to continue to the next trial. Participants were required to make a minimum of two adjustments before proceeding to the next trial (e.g., increasing and then decreasing the line length, or vice versa, even if they perceived equal line lengths/proportions between the test and the reference stimuli from the very beginning of the trial).
As shown in Table 1, we used five unique combinations of reference and test stimuli, and the same combinations were used in both versions of the task. To obtain these combinations, we increased the line lengths and frame heights used by Kitayama et al. (2003) by two folds and converted those values from millimetres to pixels. Within a given version of the task, each combination was presented 5 times, which led to a total of 25 trials per version (5 combinations × 5 repeats). The 25 trials were presented in a fully randomised sequence. As can be seen in Table 1, the starting line length of the test stimulus was either 10 pixels (in half the trials) or 10 pixels less than the test frame’s height (in half the trials).
Combinations of Reference and Test Stimuli Used in the Frame-Line Task.
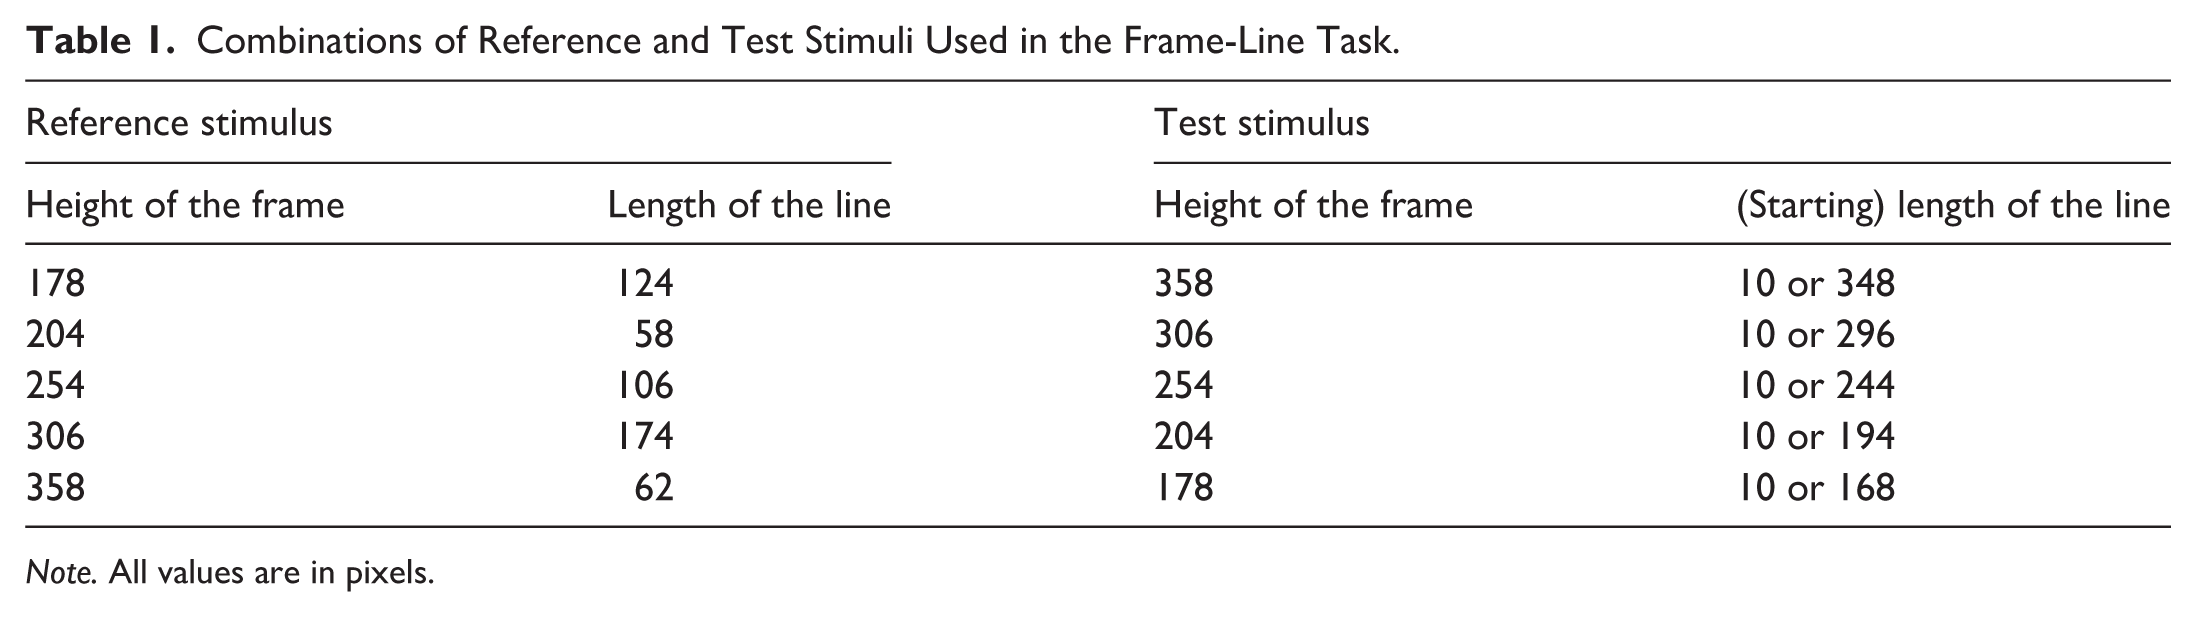
Note. All values are in pixels.
Data Analyses (Based on Stage 1 Registration)
Cross-Cultural Comparison of SCEs
Our primary aim was to compare SCEs between the two nominally distinct cultures. Prior to that, we examined whether there were any response biases in assigning blur levels to objects in semantically consistent or inconsistent scenes. To do these, we first obtained the difference between the blur level assigned to the sample and the blur level of the target for each participant separately. This difference was obtained across all trials within pairings of SC_TC (consistent sample_consistent target), SI_TI (inconsistent sample_inconsistent target), SC_TI (consistent sample_inconsistent target), and SI_TC (inconsistent sample with consistent target), separately. To calculate, we subtracted the blur level of the target from the blur level assigned to the sample. At this point, we intended to minimise the inclusion of data coming from participants passively responding to stimuli without active engagement and effort. Accordingly, if a response in any given trial (starting from the third trial onward) marked the third consecutive instance where a participant had utilised extreme bounds of the adjustment range (SD of 4.6 or 7.4), those trials were excluded from the subtraction procedure. However, an exception was made to this criterion if the trial involved the same exact stimulus being presented for the third consecutive time. If this exclusion criteria resulted in excluding data from more than 20% of trials in any experimental condition, the participant’s data was meant to be removed from further analyses, and a replacement participant was meant to be recruited to meet the intended sample size.
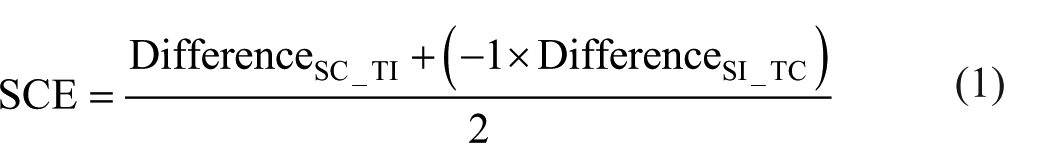
If there were no response biases, the calculated difference scores should not deviate from zero for SC_TC and SI_TI pairings. However, participants from one or both cultures may have had response biases, such as a tendency to overestimate blur when objects and scenes are inconsistent, and/or underestimate when they are consistent. We confirmed the presence of such biases in each culture separately by conducting two-tailed one-sample t-tests on the difference scores derived from SC_TC and SI_TI pairings. Response biases aside, we expected the calculated difference score to be positive for SC_TI pairs and negative for SI_TC pairs, as objects in semantically consistent scenes are perceived to be sharper. Based on these two difference scores, we calculated an overall SCE for each participant, using Equation 1 below. We then ran a one-tailed independent-samples t-test to assess whether the mean SCE score in White-British participants is significantly lower than that of Malaysian-Chinese.
Mediations from Cognitive Styles and Self-Construals
Our secondary aim of this study was to assess whether the influence of culture on SCEs was mediated by cognitive styles (holistic vs. analytical thinking) and/or self-construals. For this assessment, we ran a series of mediation analyses following Baron and Kenny’s (1986) regression-based method. As shown in Figure 2, the mediation model in each analysis had nominal culture (White-British and Malaysian-Chinese) as the independent variable and SCEs as the dependent variable. The mediator was unique to each analysis. To confirm whether a complete mediation is present, we followed four criteria: (a) differences in culture has a direct effect on SCEs (τ), (b) differences in culture significantly account for variations in the mediator (α path in Figure 2), (c) variations in the mediator significantly account for variations in SCEs after controlling for culture (β path in Figure 2), and (d) there is no direct effect of culture on SCEs (
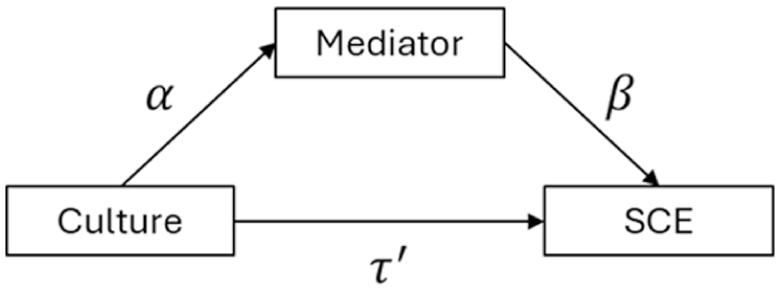
Path diagram for the mediation model.
First, for cognitive styles, we obtained measures of tendencies to process information holistically and analytically from the frame-line task. For each participant, we obtained the mean error (in pixels) in reproducing the absolute line lengths for the absolute version of the frame-line task (“absolute error”). Errors here are due to a tendency to incorporate the context frame when judging absolute lengths (Kitayama et al., 2003), and therefore, it represents a bias towards holistic processing. For each participant, we also calculated the error in reproducing the proportion in the relative task (“relative error”). Errors occur here because of a tendency to ignore the context when estimating the proportion (Kitayama et al., 2003), and therefore, it represents a bias to process information analytically. For both tasks, when obtaining mean errors, we utilised the same data exclusion criteria that we used for the object perception test. If a response in any given trial (starting from the third trial onward) marked the third consecutive instance where a participant had utilised extreme bounds of the adjustment range (10 pixels or 10 pixels less than the test frame’s height), that was meant to be excluded from estimating mean errors. However, an exception was made to this criterion if the trial involves the same exact stimuli being presented for the third consecutive time. If this exclusion criteria results in excluding data from more than 20% of trials in either of the two tasks, the participant’s data were meant to be removed from further analyses, and a replacement participant was meant to be recruited to meet the intended sample size. Once we have assessed this, we will run a mediation analysis for errors from each of the two tasks.
Second, we obtained individual measures of self-construals. For the Singelis’ (1994) self-construal scale, we obtained the difference in scores between the interdependence and independence dimensions. We labelled this difference score as Singelis’ interdependent score (SIS), with positive SIS indicating greater interdependence (Kitayama et al., 2009; Park & Kitayama, 2014). The SIS were included as a mediator in the next mediation analysis. Lastly, for the dimensions extracted from the multi-component model of self-construals, we obtained a score for each of the five dimensions (e.g., difference vs. similarity). Positive scores for each dimension represent greater independence. To test the role of each of the five dimensions, we ran a mediation analysis with the respective dimension scores.
Results
Semantic Consistency Effects
First, when calculating SCEs for individual participants, we identified trials to exclude based on recurrent use of extreme bounds in adjusting blur levels as outlined above. Trials were excluded from 15 Malaysian-Chinese participants (an average of 5.92% of trials, with an SD of 5.76%, range = 1.25%–17.25%), and none of them had more than 20% of their trials excluded within a given experimental condition. So, no participants were removed from analyses. Trials were also excluded from 15 White-British participants (an average of 5.92% of trials, with an SD of 5.76%, range = 1.25%–17.5%), and 2 of those participants had more than 20% of trials (i.e., 25%) excluded from within an experimental condition. However, since these were SC_TC and SI_TI conditions that do not affect calculations of the SCE, we retained those two participants in the analyses.
Using only included trials, for every participant, we calculated mean difference scores for the SC_TC (both sample and target in consistent scenes) and SI_TI (both sample and target in inconsistent scenes) conditions. In both the Chinese and White samples (Figure 3a), participants consistently underestimated the blur level of the sample in both conditions (see Table 2). Participants were generally biased in perceiving the sample as blurrier when it objectively had an equal blur level as the target. In addition to what we proposed in the stage 1 report, to rule out potential differences in response biases between the two groups, we conducted independent-samples t-tests (uncorrected for multiple comparisons) comparing their difference scores. For the SC_TC condition, mean difference scores were comparable between the White-British and Malaysian-Chinese, t(128) = 0.363, p = .717. The test for the SI_TI condition also produced a statistically non-significant difference between the two groups, t(128) = 1.711, p = .090. We also assessed whether response biases differed between conditions within each group using paired-sample t-tests (uncorrected for multiple comparisons). Mean difference in blur scores did not differ between SC_TC and SI_TI conditions, for Malaysians-Chinese (t[64] = −0.883, p = .380) as well as for White-British (t[64] = 0.984, p = .329). Accordingly, response biases appeared to be consistent across conditions and groups.
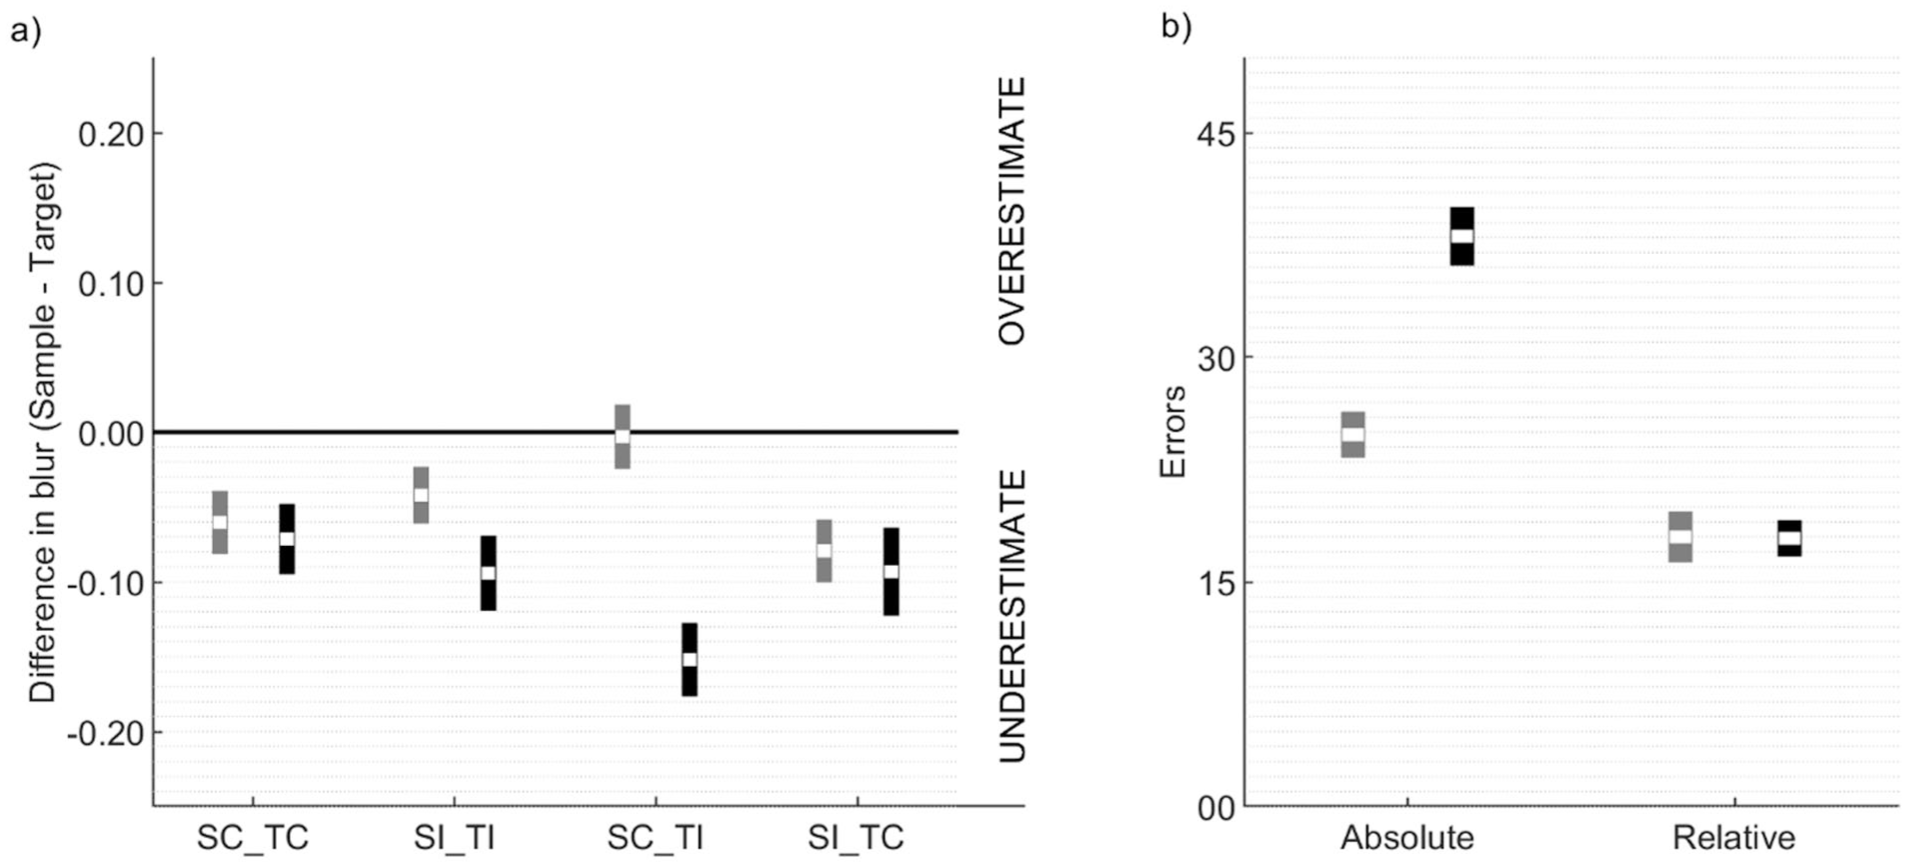
Summary of data obtained for the two cultural groups in (a) the four experimental conditions of the object perception task, and (b) the two versions of the frame-line task.
Statistics Associated with Biases in Estimating Blur.
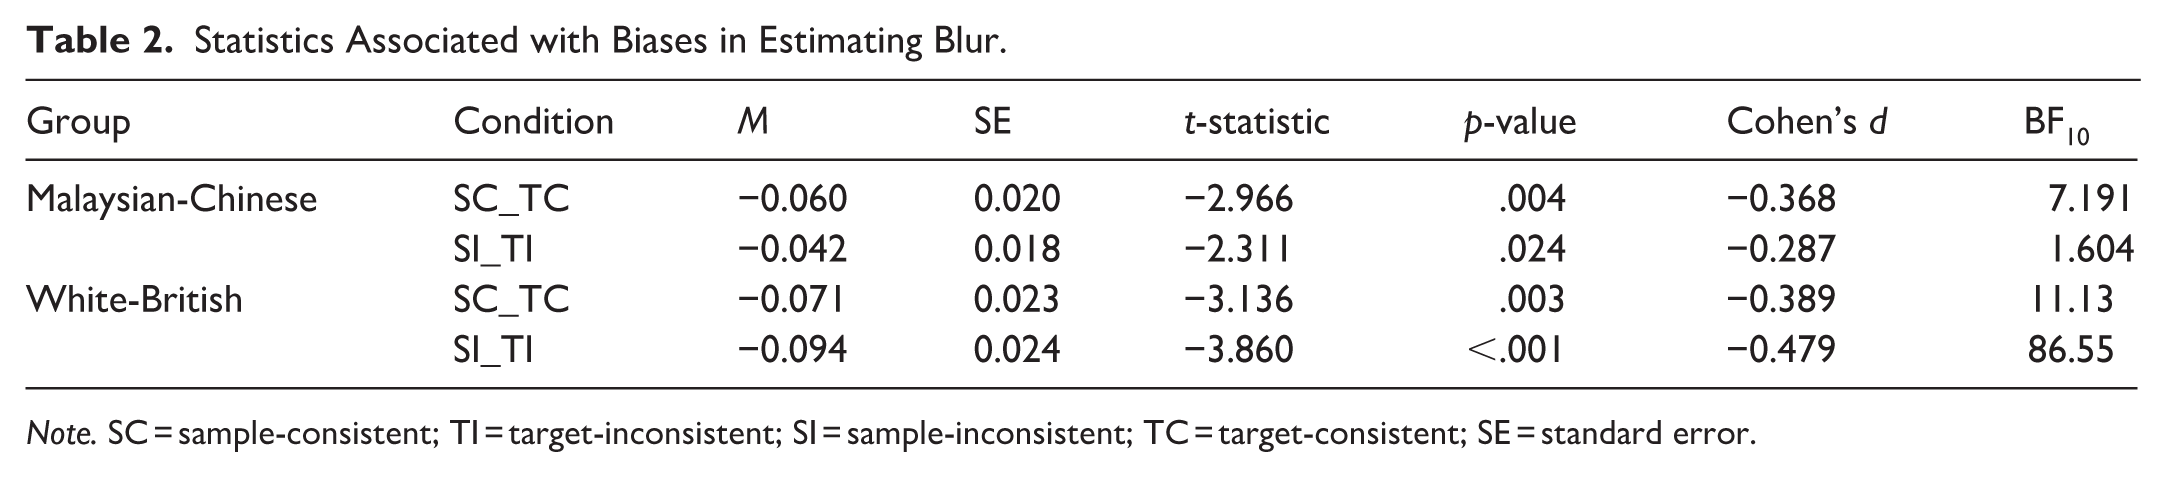
Note. SC = sample-consistent; TI = target-inconsistent; SI = sample-inconsistent; TC = target-consistent; SE = standard error.
Next, we calculated difference scores for SC_TI (sample-consistent and target-inconsistent) and SI_TC (sample-inconsistent and target-consistent) using included trials for each participant. In the Malaysian-Chinese sample (Figure 3a), SC_TI produced higher difference scores (M = −0.003, standard error [SE] = 0.021) than SI_TC (M = −0.079, SE = 0.020; Figure 3a). In White-British participants, SC_TI produced lower difference scores than (M = −0.152, SE = 0.024) than SI_TC (M = −0.093, SE = 0.029; Figure 3a). We then calculated SCE scores using included trials for every participant by following Equation 1. The SCE scores were higher in the Chinese sample (M = 0.038, SE = 0.013) than in the White sample (M = −0.029, SE = 0.015), as revealed by a one-tailed independent-samples t-test, t(123) = 3.449, p < .001, Cohen’s d = 0.605, with the Bayes factor showing very strong evidence in favour of the alternative hypothesis (BF10 = 35.98). In addition to what we proposed in stage 1 registration, we went one step further to confirm whether SCEs were in fact present in each culture, by comparing SCE scores against zero using Bonferroni-corrected two-tailed one-sample t-tests (adjusted significance criterion
Mediations from Cognitive Styles and Self-Construals
Although the stage 1 registration only intended to run mediation analyses, we also examined whether cognitive styles and self-construals indeed differed between the two cultural groups, as would be expected based on the literature. Before comparing errors in the two versions of the frame-line task between the two groups (Figure 3b), we checked whether any of the participants’ responses met the exclusion criteria, and none did for either group. The mean errors calculated for the two versions of the task from each participant were then subjected to a
Summary of Scores and Statistical Analyses Outcomes for Measured Dimensions of Self-Construals.
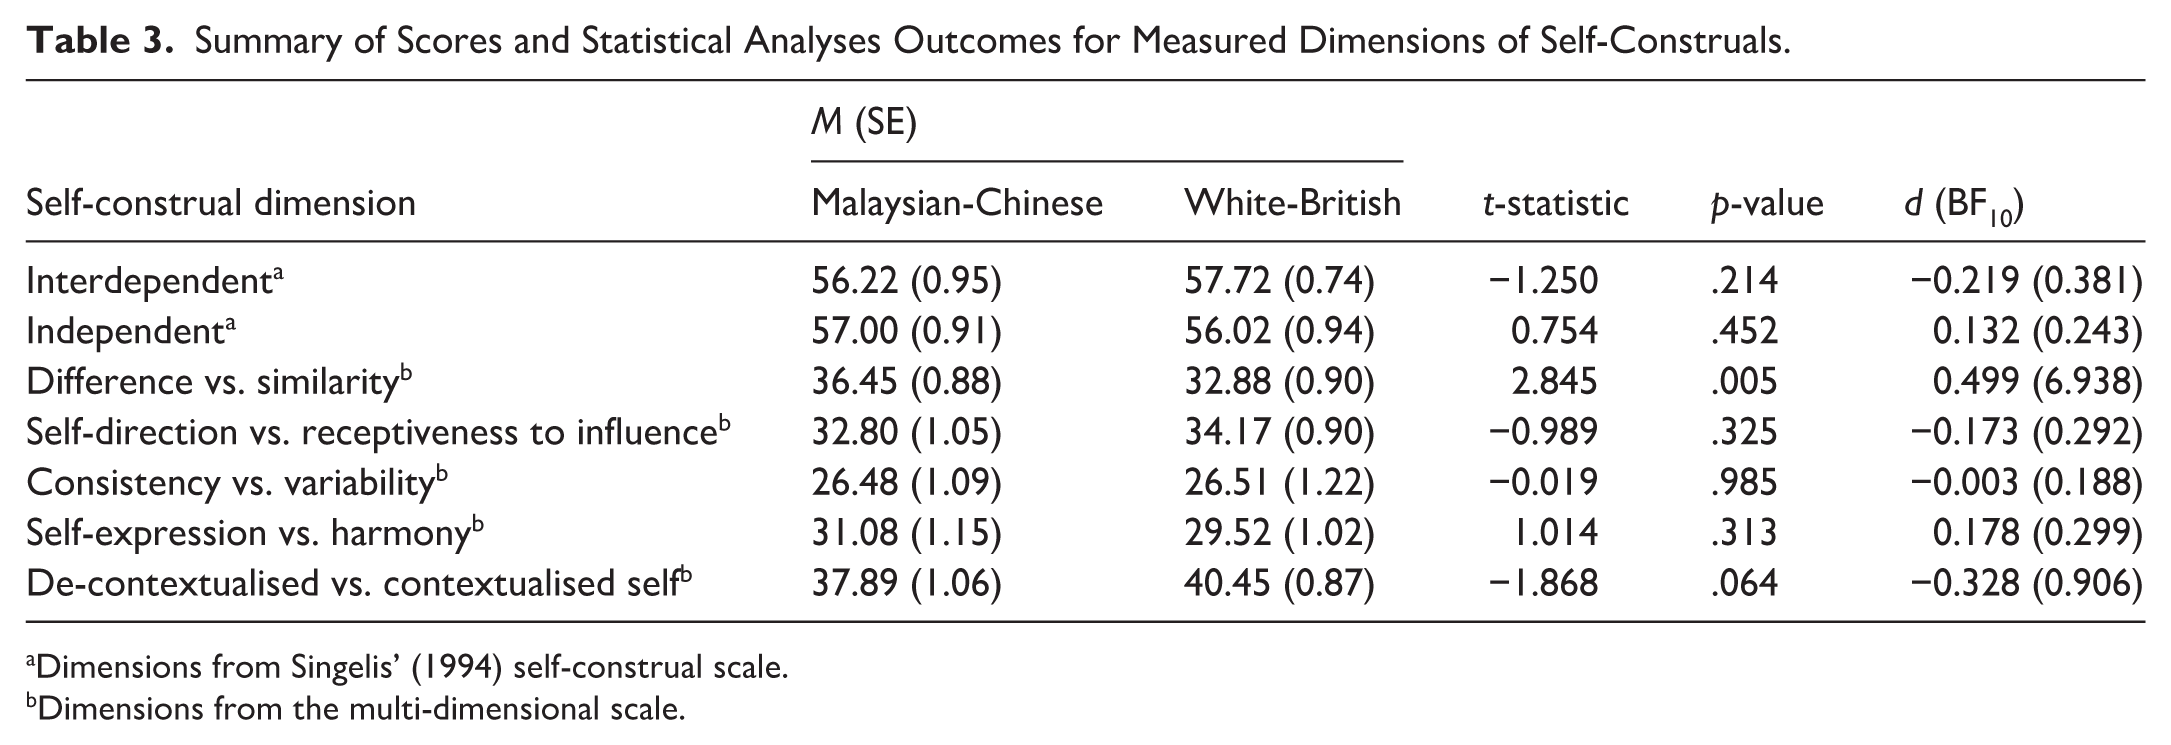
Dimensions from Singelis’ (1994) self-construal scale.
Dimensions from the multi-dimensional scale.
Next, we report the outcomes of the series of mediation analyses that were conducted with bias-corrected bootstrapping (1,000 iterations). Across all our mediation models (Table 4), the direct effect of culture on SCE scores reached statistical significance (
Statistics from the Mediation Analyses.
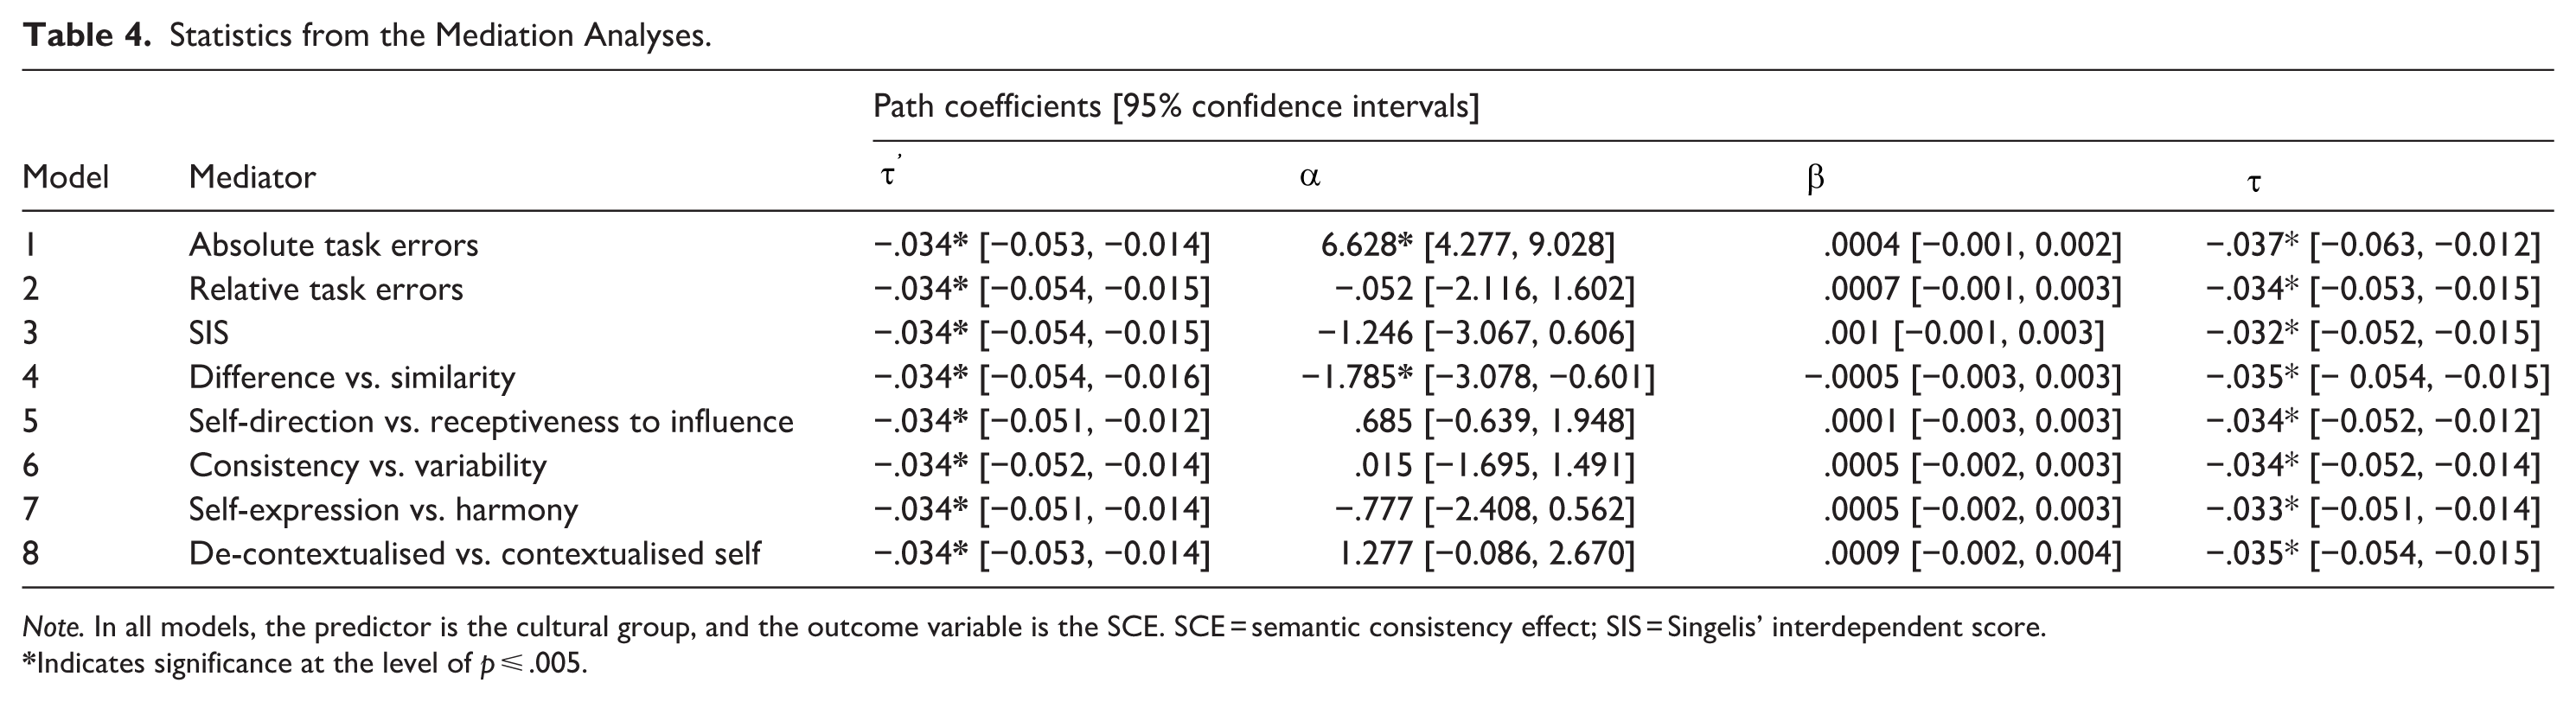
Note. In all models, the predictor is the cultural group, and the outcome variable is the SCE. SCE = semantic consistency effect; SIS = Singelis’ interdependent score.
Indicates significance at the level of p ⩽ .005.
Discussion
The predictability of an object in a scene is known to influence how that object is perceived. When an object’s signal is unreliable or noisy, its perceptual representation is enhanced if it occurs in a predictable rather than an unexpected scene. However, when the same object is conspicuous, its perceptual representation is enhanced if it occurs in an unexpected scene. This interaction between object-scene semantic consistency and signal reliability is generally supported by both behavioural and neuroimaging evidence (Brandman & Peelen, 2017; Leticevscaia et al., 2024; Rossel et al., 2022, 2023). However, it is unclear if this particular SCE manifests similarly across different cultures. Our study was the first to question this, as it would shed some insights on the extent to which different cultures rely on expectations when perceiving objects. We compared SCEs on perceived sharpness of noisy objects between adult participants from two distinct cultures: White-British and Malaysian-Chinese. We expected Malaysian-Chinese participants to experience stronger SCEs on perceived sharpness than White-British participants, and our findings confirmed this expectation.
In our study—which closely followed the experimental design of Rossel et al. (2023)—we presented participants with two object-scene composites side-by-side. Participants adjusted the blur level of an object (the “sample”) in one composite to match the blur level of the same object in the second composite (the “target”). When both composites contained identical scenes, participants from both cultures similarly underestimated the blur level of the sample, regardless of the semantic consistency of the scene to the object. This was clearly a response bias. However, in Malaysian-Chinese participants, we also observed a systematic shift in matched blur levels between the two composite pairs that were designed to capture the SCE. Specifically, when the sample’s scene was semantically consistent with the object and the target’s scene was semantically inconsistent, participants overestimated the blur level of the sample. In contrast, when the sample’s scene was semantically inconsistent and the target’s scene was consistent, participants underestimated the blur. This shift indicates that Malaysian-Chinese participants perceived the object in the consistent scene as sharper when the objects in both composites had identical blur levels. Although we anticipated weaker SCEs in the White-British participants, our results did not support this hypothesis. While we managed to replicate the SCE in a Malaysian-Chinese sample, we could not replicate it in a White-British sample.
When we examined the role of culture, we considered SCEs to be a result of a top-down effect, where expectations/knowledge about semantic consistencies guide object perception. Several past studies demonstrate that East Asians (compared to Westerners) have a greater tendency to perceive a visual target in relation to its context. The logic here is a cascadic effect. An independent self-construal is thought to encourage individuals to engage in an analytical approach to processing visual information, while an interdependent self-construal encourages holistic processing (Kitayama & Salvador, 2024; Markus & Kitayama, 1991a, 1991b). The analytical tendency would make an observer less sensitive to contextual information (Ito et al., 2013; Ji et al., 2000; Kitayama et al., 2003; Masuda et al., 2008). On this basis, we hypothesised (and found) that Easterners demonstrate a stronger SCE, insofar as scene-related expectations provide a context that guides perceiving an object (Bar, 2004). However, when East-West dichotomies in context sensitive perception are reported in past studies, the sources of this cultural difference (i.e., social constructs and/or associated cognitive styles) are in many cases assumed rather than explicitly measured. Therefore, we first quantified social constructs and cognitive styles, and then we assessed whether these two mediate the relationship between culture and SCEs (if any).
Contrary to what is expected from cultural differences reported in the literature, we generally found self-construals to be comparable between our White-British and Malaysian-Chinese participants. The most popularly used measure of self-construals, Singelis’ (1994) scale, found no difference in independence or interdependence between the two cultures. The comprehensiveness of this scale is unlikely to account for the absence of a cultural difference, because we also employed a multi-dimensional scale that captures nuanced variations in self-construals, with demonstrated cross-cultural reliability (Krys et al., 2021; Vignoles et al., 2016). Even across several distinct dimensions, we found no clear group-level cultural differences in self-construals, with one surprising exception. Malaysian-Chinese participants reported a higher tendency to consider themselves as unique or different from others in society (i.e., independent self-construal). Therefore, we cannot make a binary claim that the White-British participants are independent and the Malaysian-Chinese are interdependent. Next, we compared our participants’ performance in the two versions of the frame-line task that were aimed at distinguishing holistic versus analytical tendencies in visual processing. Both groups of participants made more errors in the absolute version than the relative version, suggesting that both groups presented holistic tendencies. Interestingly, holistic processing tendencies were higher in White-British participants.
Our findings on self-construals contradict some large-scale research reporting clear east-west differences (e.g., Vignoles et al., 2016), but also direct comparisons between smaller convenience samples of British and (mainland) Chinese participants (Yang & Vignoles, 2020). This may not be surprising because the literature also highlights inconsistencies in demonstrating conventionally expected cultural differences in self-construals (e.g., Kitayama et al., 2009; see Cross et al., 2011 for a review). Several factors can lead to the mixed findings. First, although culture plays a dominant role in shaping one’s self-construal, other factors such as socioeconomic development, religious heritage, and exposure to other cultures can influence it too (Lim & Ma-Kellams, 2025; Vignoles et al., 2016). Second, implicit measures of self-construals (e.g., implicit social orientation questionnaire; Kitayama & Park, 2007) may sometimes capture cross-cultural differences that are otherwise missed by explicit measures such as scales (Kitayama et al., 2009; Lim & Ma-Kellams, 2025). Third, collectivism, which seems to encourage interdependent self-construals, might be reducing in Asian cultures, which would inevitably dilute East-West cultural differences in self-construals (Kim, 2024). Lastly, a convenience sample (as in our case) may not always be representative of a culture.
Findings from the frame-line task were rather counterintuitive, contradicting the classic east-west dichotomy in cognitive styles (Ji et al., 2000; Kitayama et al., 2003; McKone et al., 2010; Nisbett & Miyamoto, 2005; S. Y. Chua et al., 2022). However, the frame-line task faces a replication crisis too. There are many instances where comparable holistic tendencies are reported between Easterners and Westerners, for instance between Americans and Chinese (Hakim et al., 2017), or between Germans and Japanese (Kitayama et al., 2009). These mixed findings could be due to the variability in the convenience samples selected or could, in fact, be because of the malleability of culture-distinguishing factors such as holistic tendencies (Hakim et al., 2017). More importantly, despite self-construals being largely comparable between the two cultures that we tested, the British demonstrated stronger holistic tendencies, contradicting the conventional mapping between self-construals and cognition. We found the qualitative parallel between our British participants’ greater holistic tendencies and their lower scores for one self-construal dimension (difference vs. similarity) worthy of further exploration, as it suggested a positive relationship between holistic tendencies and interdependent self-construals. However, when we correlated the two, we did not find any associations (Pearson’s r = −.110, p = .211). Overall, we believe it is safe to conclude that we observed no clear relationships between self-construals and holistic tendencies in visual processing (see Kitayama et al., 2009; McKone et al., 2010 for similar findings).
Of more pertinence to our study is the finding that neither self-construals nor the behavioural measures of cognitive styles mediated the relationship between culture and SCEs. Sometimes, assuming a mean difference between cultures can be problematic, as we have done in our mediation analyses, because it implies a dichotomy rather than a continuous relationship. For instance, in S. Y. Chua et al.’s (2022) study, Asian and European participants were indistinguishable in self-construals based on group-level comparisons, and yet, levels of independent self-construals predicted holistic tendencies in visual processing. However, when we explored path coefficients in the mediation models, the relationships between self-construals/holistic tendencies and SCEs (after controlling for culture) were negligible. We emphasise two things here: (a) cultural differences in SCEs that we observe cannot be reduced to individual differences in self-construals or holistic tendencies in cognition, and (b) it is highly problematic to make blanket assumptions and attribute any observed cultural difference in visual perception to self-construals and/or cognitive styles, unless the said characteristics are also measured.
In our case, nominal culture clearly exerted dissociable effects on context sensitivity in the frame-line and object perception tasks. White-British participants who were most sensitive to context in the frame-line task (demonstrating greater holistic tendencies) did not experience SCEs guided by contextual knowledge. Malaysian-Chinese participants who were less sensitive to the context in the frame-line task experienced stronger SCEs. Moreover, context sensitivity in the frame-line task (measured as errors in the absolute version) did not mediate the relationship between culture and SCEs either.
Often, the holistic tendency in the frame-line task is explained by invoking attentional control mechanisms, with those demonstrating greater context sensitivity (e.g., Eastern cultures) having a greater propensity to attend to contextual information outside of focal targets (Hakim et al., 2017; Hedden et al., 2008; Kitayama et al., 2003; Nisbett & Miyamoto, 2005). Whether such culture-specific attentional biases translate well into object processing within complex scenes is questionable. Some studies (e.g., H. F. Chua et al., 2005) indicate that Eastern observers distribute overt attention more evenly between focal objects and their surrounding scenes, rendering perception and memory for focal objects more dependent on background context. In contrast, Western observers tend to concentrate overt attention on focal objects, resulting in perception and memory that are relatively independent of context. However, such cultural distinctions are not always replicated (Evans et al., 2009). Of specific interest to us is a recent study by Leticevscaia et al. (2024), which involved decoding object categories from magnetoencephalography responses in temporal lobe regions such as visual cortex. They found that neural representations of objects are enhanced by expectations arising from the scene context—a typical SCE. Interestingly, this effect occurred even when participants did not pay attention to the scene, suggesting that they are purely driven by automatic influences from scene-related expectations rather than attention. This makes dissociable context sensitivities in the two tasks (frame-line and object perception) less surprising in our participants, as they can be mediated by distinct top-down mechanisms.
So, what could be driving stronger SCEs in our Malaysian-Chinese sample than the White-British sample? One possibility is that statistical object-scene regularities learnt by the two cultures may have been different. However, we minimised interference from this by conducting the stimulus validation process. All objects we used in the main study were equally familiar (and at the ceiling level) to participants from both cultures, and both cultures provided comparable semantic consistency ratings for all our object-scene pairs (consistent as well as inconsistent). However, comparable semantic consistency ratings do not strictly mean that prior expectations about object-scene regularities are identical between two groups of participants. An individual who has associated multiple objects with a scene may give similar semantic consistency ratings to a given object (e.g., A) as another individual who has associated only that given object (A) with the scene. This leads us to the second possibility—which is largely speculative at this point—that fundamental differences in aspects related to predictive coding (e.g., nature of prior expectations, sensitivity to prediction errors) may account for the observed cultural differences.
It must be noted that the second possibility is grounded on the assumption that the SCE is predominantly a result of statistical regularities informing object processing. This is plausible because: (a) scene selective regions (e.g., those part of the Parahippocampal cortex) do not just encode scenes, but they are also implicated in learning about object-scene associations, and (b) these scene selective regions have feedback pathways to object processing regions that are distinct from feedback pathways involved in other forms of top-down guidance, such as attentional control which is engaged during the frame-line task (Aminoff et al., 2013; Bar, 2004; Hedden et al., 2008; Leticevscaia et al., 2024). The engagement of distinct feedback mechanisms might also explain why overarching interpretive constructs, such as self-construals and/or holistic cognition, did not influence SCEs in our case.
Explaining cultural differences with regards to predictive coding is difficult because of the lack of findings and the mixed nature of existing findings. In some cases, individual differences in visual perception are attributed to differences in the nature of prior expectations. For instance, cultural differences in susceptibility to visual illusions arising from spatial context have been attributed to differences in prior expectations that mimic the statistical regularities in their respective (distinct) environments (Bremner et al., 2016). In addition, reduced susceptibility to visual illusions in autistic individuals is attributed to broader prior expectations (Pellicano and Burr, 2012), although autistic traits cannot always explain individual differences in visual perception involving prior expectations (e.g., Tulver et al., 2019). As far as sensitivity to prediction errors is concerned, we only found one study that explored cross-cultural differences, and they reported no differences (Wright et al., 2018). Nonetheless, whether fundamental differences in predictive coding can explain cultural differences in SCEs remains an open question that requires further inquiry.
Supplemental Material
sj-docx-1-qjp-10.1177_17470218261454680 – Supplemental material for Do Semantically Consistent Scenes Sharpen Perceived Object Representations Across Different Cultures?
Supplemental material, sj-docx-1-qjp-10.1177_17470218261454680 for Do Semantically Consistent Scenes Sharpen Perceived Object Representations Across Different Cultures? by Ahamed Miflah Hussain Ismail, Justin Samuel Wibowo, Bryan Qi Zheng Leong and Alejandro J. Estudillo in Quarterly Journal of Experimental Psychology
Footnotes
Funding
The authors received no financial support for the research, authorship, and/or publication of this article.
Declaration of Conflicting Interests
The authors declared no potential conflicts of interest with respect to the research, authorship, and/or publication of this article.
Data Availability Statement
References
Supplementary Material
Please find the following supplemental material available below.
For Open Access articles published under a Creative Commons License, all supplemental material carries the same license as the article it is associated with.
For non-Open Access articles published, all supplemental material carries a non-exclusive license, and permission requests for re-use of supplemental material or any part of supplemental material shall be sent directly to the copyright owner as specified in the copyright notice associated with the article.