
Abstract
Objective
To systematically assess imaging biomarkers on CT-based multimodal imaging for their being predictive versus prognostic biomarkers for intravenous and endovascular (IA) revascularization therapy, and for their prevalence.
Methods
Our retrospective study included patients suspected of acute ischemic stroke with admission work-up including a non-contrast head CT, perfusion CT, and CT angiography. Modified Rankin scores at 90 days were used as outcomes. For each imaging biomarker, the effect size of the test of interaction between the presence of the biomarker and the treatment effect was calculated, allowing the inference of a total sample size. The total sample size required was combined with the prevalence of the biomarker to determine the number needed to screen.
Results
In the 0–4.5-h time window, the two predictive biomarkers associated with the smallest number needed to screen were perfusion CT penumbra ≥ 20% (404 NNS) and CT angiography collateral score ≥ 2 (581 NNS). In the 3–9-h time window, the four predictive biomarkers associated with the smallest number needed to screen were clot burden score (CBS) on CT angiography (1181 NNS), clot length ≥ 10 mm (1924 NNS), CBS and clot length ≥ 10 mm (1132 NNS), and CBS and perfusion CT penumbra ≥ 100% (1374 NNS). Perfusion CT ischemic core was a prognostic biomarker in both time windows.
Interpretation
Predictive biomarkers need to be differentiated from prognostic biomarkers when being considered to select patients for a trial, and their prevalence should be assessed to determine the number needed to screen and overall feasibility of the trials.
Keywords
Introduction
The distinction between prognostic and predictive imaging biomarkers is very relevant to the design of clinical trials of acute revascularization therapy in stroke. A prognostic biomarker is associated with a specific clinical outcome, whether the patient is treated or not.
1
A predictive biomarker associated with a differential treatment effect, i.e. a more favorable clinical outcome exclusively in the treatment group
1
(Figure 1). In order to be successful, a clinical trial of acute revascularization therapy needs to use a predictive, not prognostic, biomarker in order to identify patients more likely to respond favorably to the tested therapy.2 Compared to a trial that does not use any selection biomarker, a clinical trial that uses a predictive biomarker should allow to magnify the effect size, and therefore reduce the sample size required to demonstrate a positive effect of the tested therapy on clinical outcome. This is, however, only true if the prevalence of the predictive biomarker is high enough that the enrollment rate into the trial is not hampered, and that the duration of trial is not unnecessarily increased because of the need to screen a very large number of stroke patients to find only a few positive for the predictive biomarker.
Plots of outcome versus present/absent biomarker in treated and untreated patients, for an ideal prognostic biomarker and an ideal predictive biomarker. An ideal prognostic biomarker is associated with a favorable clinical outcome, whether the patient is treated or not. An ideal predictive biomarker is associated with a differential treatment effect, i.e. a more favorable clinical outcome exclusively in the treatment group.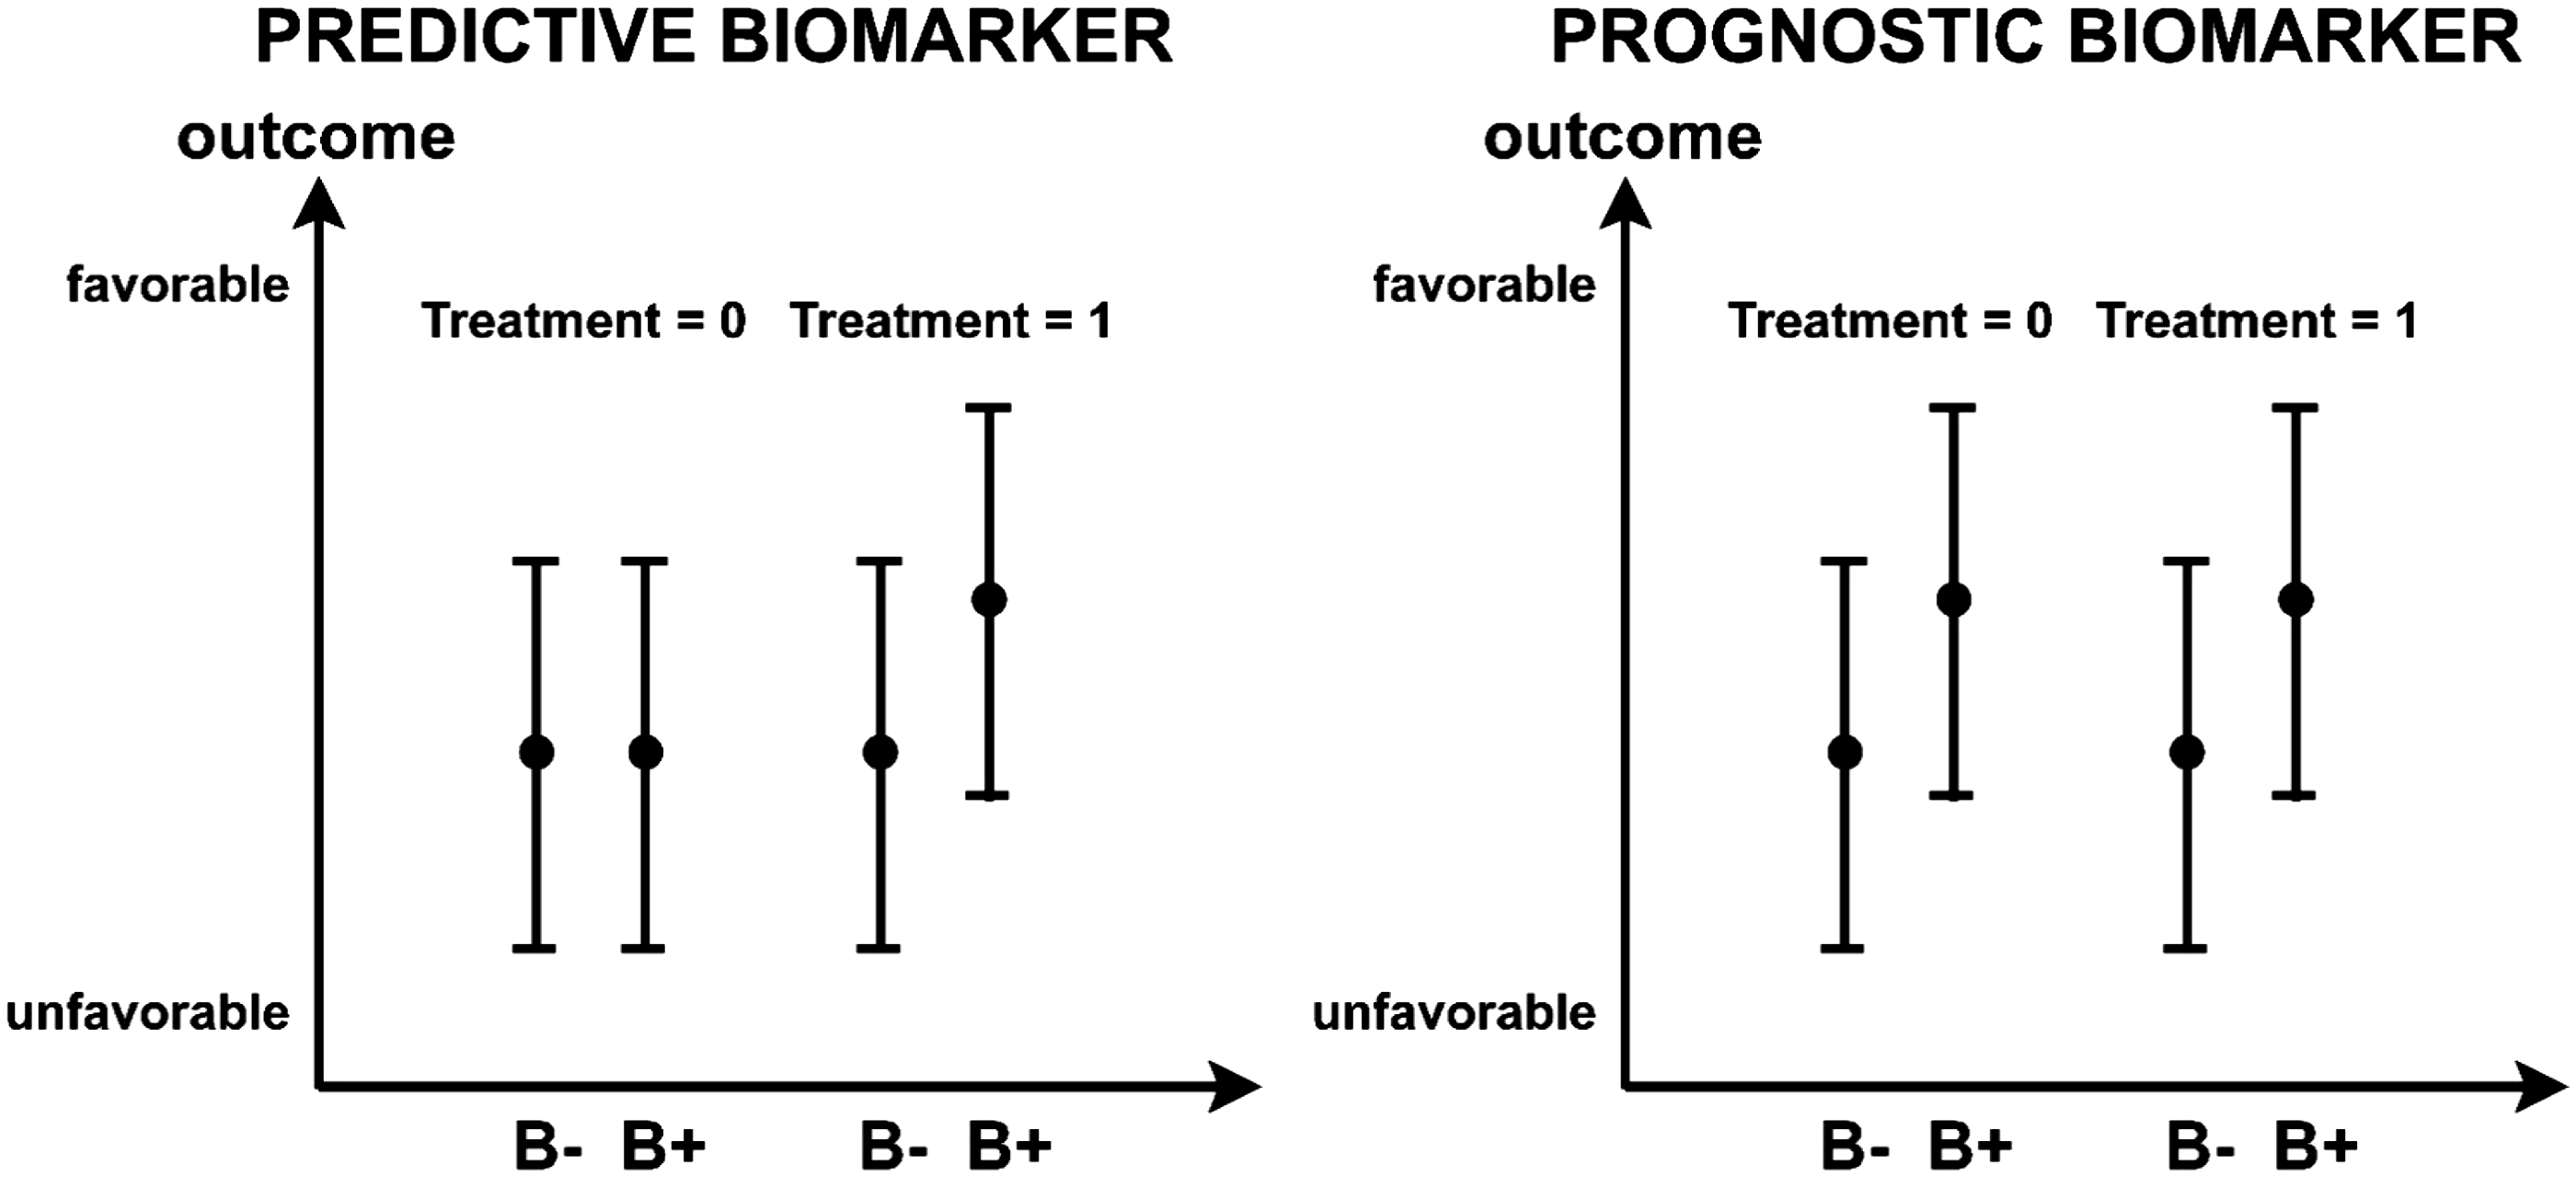
In the present study, we systematically assessed all currently investigated imaging biomarkers for their being predictive versus prognostic biomarkers for revascularization treatment in acute stroke. We also determined the theoretical sample size required for a clinical trial using such biomarker to be powered appropriately considering the effect size of the biomarker, and the number of patients needed to screen considering the prevalence of the biomarker. Because an imaging biomarker may behave differently depending on the type of therapy considered, we tested the biomarkers separately for intravenous (IV) and endovascular (IA) therapy.
Methods
Study population
Our retrospective study involves a repository of clinical and imaging data in acute stroke patients treated at two institutions between January 2008 and June 2013: Center Hospitalier Universitaire Vaudois (CHUV), Lausanne, Switzerland; and the University of Pittsburgh Medical Center, Pittsburg, PA, where similar imaging protocols were used to work up acute stroke patients. All data collection and analysis were approved by the institutional review boards of each institution involved.
All consecutive patients in this registry who met the following criteria were included in our study:
Suspicion of acute ischemic stroke with admission work-up including a non-contrast head CT (NCT), perfusion CT (PCT), and CT angiography (CTA); No subacute or chronic/remote infarct seen on baseline NCT; No hemorrhage on baseline NCT; National Institutes of Health Stroke Scale (NIHSS) score measured on admission and modified Rankin score (mRS) measured at 90 days after initial event.
Patients were grouped based on the time window they were admitted in:
#10–4.5-h time window: patients in this time window who were eligible based on their NCT ASPECT score with a cut-off of 7 received IV recombined tissue plasminogen activator (r-tPA) (treatment – ASPECT score 7–10; controls – ASPECT score<0–6); #2. 3–9-h time window: patients in time window who were eligible based on their NCT ASPECT score with a cut-off of 7 and the presence of an M1 clot on CTA received endovascular treatment (treatment – ASPECT score 7–10 and M1 clot present on CTA; controls – ASPECT score<0–6 or no M1 clot present on CTA).
Clinical data
Age, sex, time from symptom onset to baseline imaging, time from symptom onset to successful treatment (for IA), NIHSS score on admission, mRS at 90 days after initial event were recorded.
Imaging biomarkers
Alberta Stroke Program Early CT (ASPECT) score 3 and presence or absence of a dense artery sign 4 were assessed on the baseline NCT.
Clot involvement of the terminal internal carotid artery and M1 segment of the middle cerebral artery, clot length, 5 relative clot density, 6 clot burden score, 7 and modified M1-Boston Acute Stroke (M1-BASIS) score 8 were assessed on the baseline CTA. For characterizing the CTA Collateral Score circulation on baseline CTA images, we used the scoring system described by Tan et al. 9 : a score of 0 represents complete absence of CTA Collateral Score flow, and scores of 1–4 represent the ≤50%, >50% but <100%, =100%, and >100% (compared with the normal side) filling of the territory of the occluded artery, respectively.
Baseline brain ischemic lesion size was measured automatically on baseline PCT, using the deconvolution-based Philips Brain Perfusion software (version 4.5.2, Cleveland, OH, USA). The volumes of ischemic core and ischemic penumbra thresholds were calculated using previously validated thresholds: MTT > 145% of the contralateral side values and CBV < 2.0 mL/ g for ischemic core; MTT > 145% of the contralateral side values and CBV > 2.0 mL/ g for ischemic penumbra. 10 The volumes of ischemic core and penumbra were normalized to the total volume of the MCA territory to correct for the variable coverage of the PCT scans. 11 Different subgroups of patients were evaluated based on different cut-offs for the volume of ischemic core (more or less than 50 mL, more or less than 70 mL, more or less than 100 mL) and the volume of ischemic penumbra (more or less than 20%, more or less than 50%, more or less than 100%).
All the image interpretations were done by two neuroradiologists (one with 15 years of experience, one with 5 years of experience) in consensus in a blinded fashion with respect to the treatment groups and clinical outcome.
Biomarker analysis
The biomarkers used clinically to make treatment decisions (ASPECT score in 0–4.5-h time window – Group #1, ASPECT score and presence of an M1 clot on CTA in the 3–9-hour time window – Group #2) were not considered in the biomarker analysis as, only those patients with positive values for these biomarkers were treated (IV for Group #1, IA for Group #2).
On the other hand, the other biomarkers evaluated, which were not used to make treatment decision, were determined for each patient as being positive or negative (Supplemental Online Table I), and the likelihood of a positive clinical outcome (mRS of 0–2 at 90 days) was plotted for “positive” and “negative” values of the biomarker considered, and this both in the treatment group (IV for Group #1, IA for Group #2) and in the untreated group, in the corresponding time windows. These plots were compared to the typical plot appearance of predictive and prognostic biomarkers (Figure 1).
Statistical analysis
Summary statistics
Continuous scaled data (age, time from symptom onset to baseline imaging, time from symptom onset to successful treatment, baseline infarct volume, etc.) were summarized by the median and interquartile range (IQR) of the distribution, and the two sample non-parametric Wilcoxon Rank Sum test was utilized to compare continuous scaled variables between the treated (T = 1) and the untreated patients (T = 0). Frequency data (e.g. perfusion PCT Penumbra on baseline PCT, clot burden score, CTA Collateral score, etc.) were summarized by counts or percentages, and the Fisher’s exact test was utilized to compare frequencies between the treated (T = 1) and the untreated patients (T = 0).
Prevalence calculation
The proportion of patients in our data registry who were positive for the biomarker (B + ) was utilized as the estimator for the prevalence of the biomarker (B+) in the target population.
Power calculation
Using the mRS category data (i.e. mRS ≤ 2 versus mRS > 2) in the data registry, as well as the biomarker status (B−, B+) and treatment status (T = 0, T = 1) information in the data registry, for each biomarker, the effect size of the test of interaction between biomarker status (B−, B+) and the treatment (i.e. T = 0 versus T = 1) was estimated via multivariate logistic regression model (MLRM) adjusting for age, NIHSS score, and ASPECTS (as well as presence of M1 clot for Group #2). The effect size indicates the strength of the interaction between a predictive biomarker and a treatment. Based on the effect size associated with interaction term of the MLRM, Monte Carlo Simulation (MCS) was then used to estimate the total sample size that would be required in order to have at least 0.80 statistical power to reject the null hypothesis that there is no differential treatment effect between patients who are positive for the biomarker (B+) and patients who are negative for the biomarker (B−) for a study design in which the total sample size is equally divided between the two treatment arms (i.e. T = 1 and T = 0) and an equal number of biomarker positive (B+) and biomarker negative patients (B−) are assigned to each treatment arm. The required total sample size (N) was derived at by using an MCS search method, in which the total sample size specified in the MCS was systematically increased until the total sample size was sufficiently large enough to meet the threshold of having at least 0.80 statistical power to detect the empirical derived differential treatment-effect between biomarker positive (B+) patients and biomarker negative (B−) patients. Details regarding how the MCS power analyses were conducted are provided in the accompanying Supplemental Materials under Supplemental Methods.
Projected screening requirement
Based on the estimate for the total sample size (N), and the based on empirical estimate for the prevalence of the biomarker in the target population, we estimated an upper bound for the total number of patients that would have to be screened (Nscreened) in order to fulfill the total sample size requirement for a study design in which the total sample (N) is divided equally between the two treatment-arms (i.e. T = 1, T = 0) and an equal number of biomarker positive (B+) and biomarker negative (B−) patients are assigned to each treatment-arm. Details regarding how the number needed to screen was calculated are provided in the accompanying Supplemental Materials under Supplemental Methods.
Results
Group #1 included 162 patients, 113 of which received IV rt-PA and 49 of which did not. Group #2 included 173 patients with M1 occlusion, 107 of which received endovascular therapy and 66 of which did not. Patients who received IV rt-PA followed by endovascular treatment were excluded from both study groups.
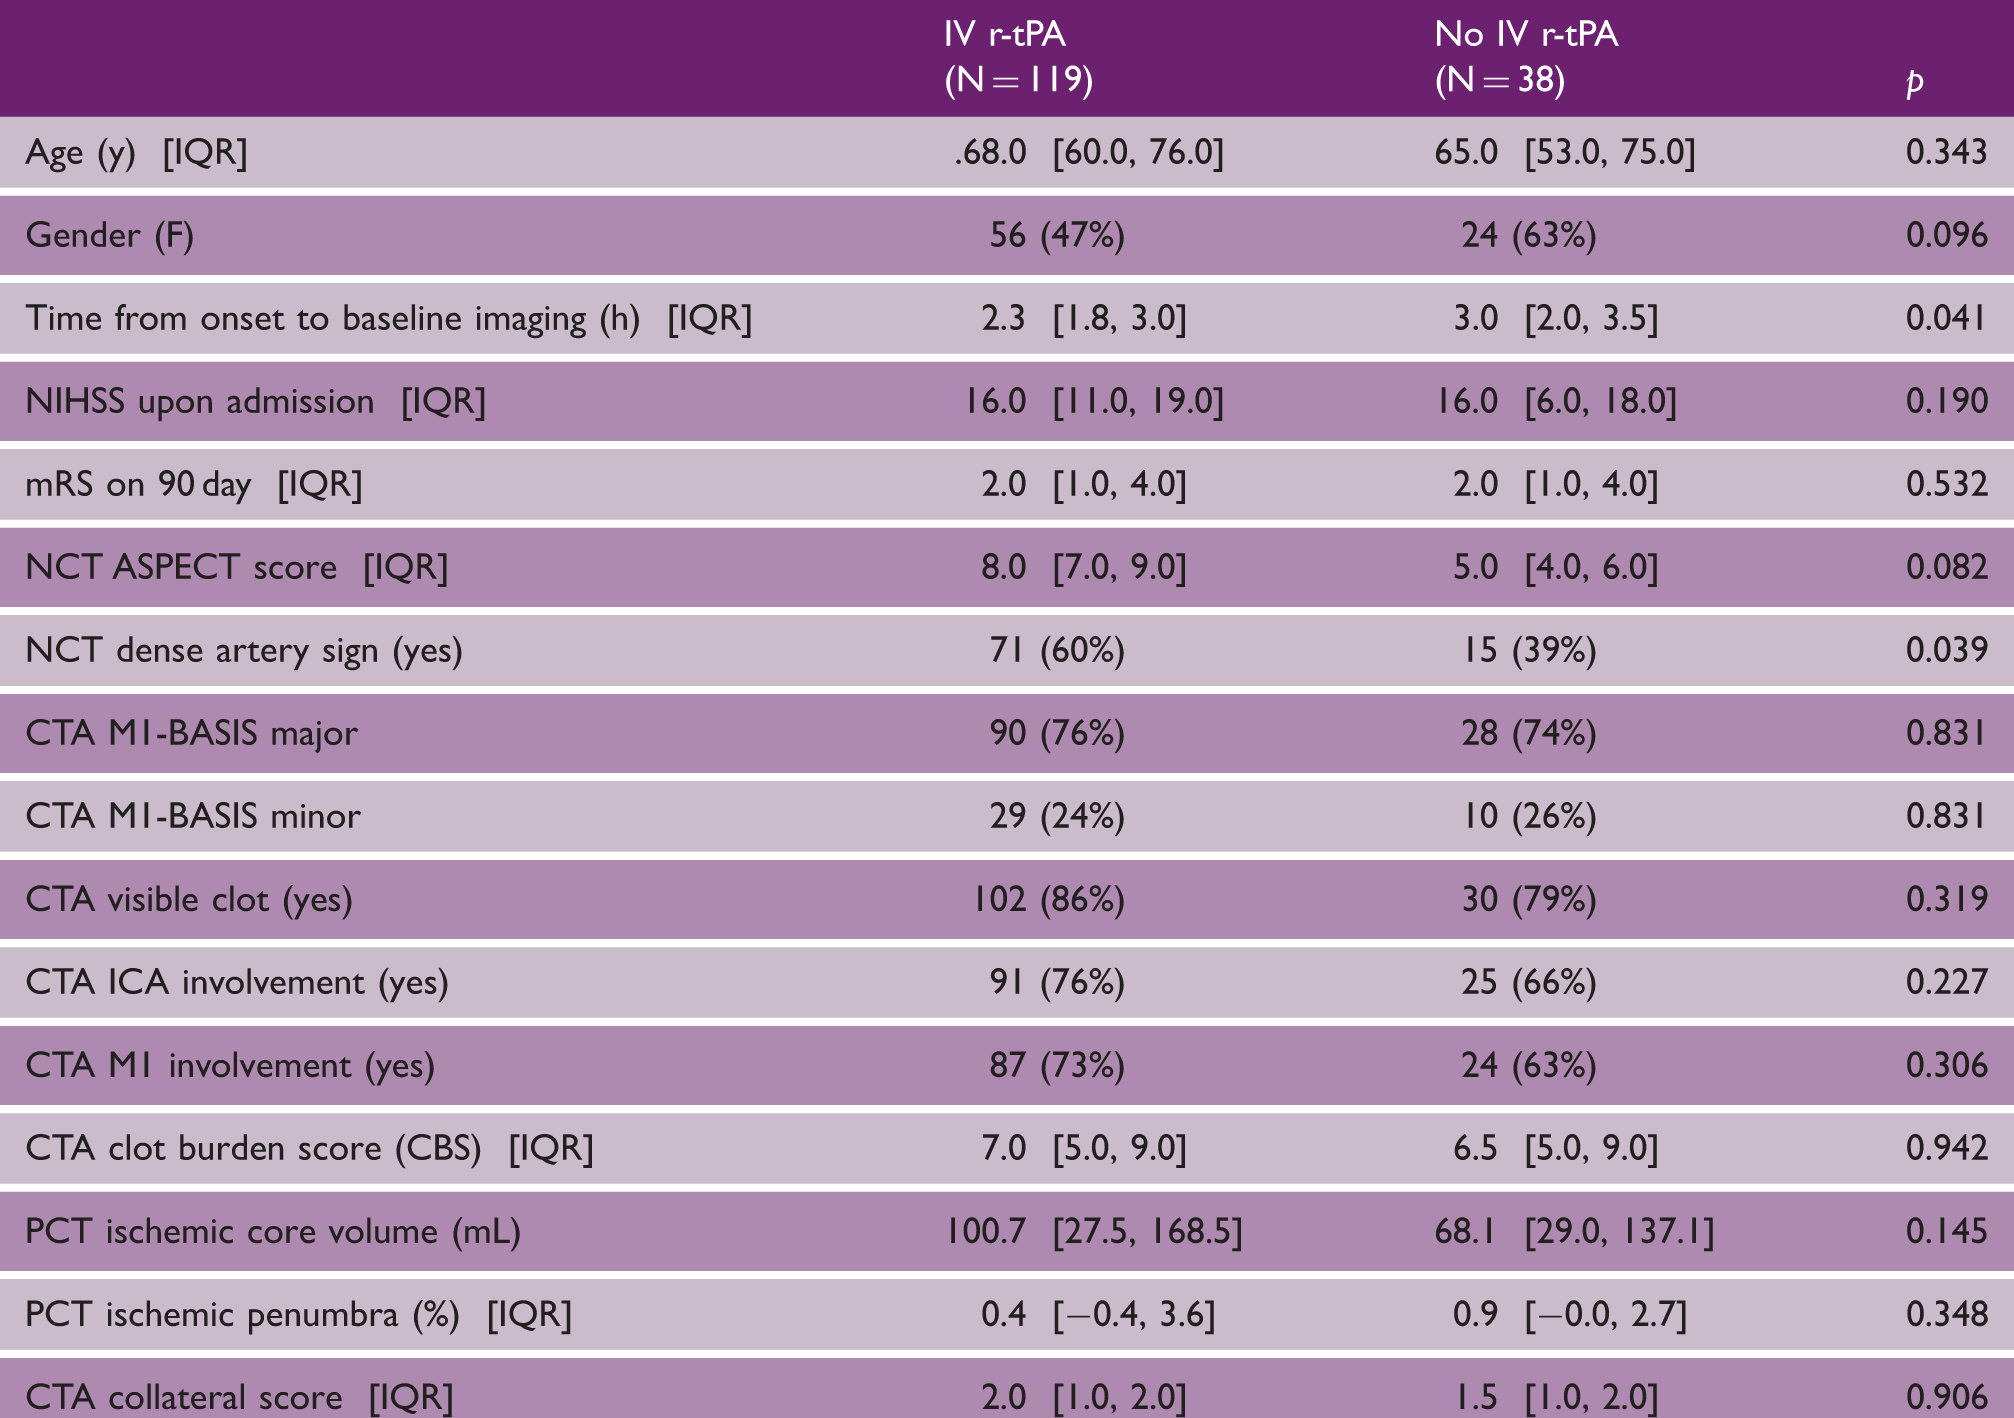
Group #1 – 0–4.5-h time window: Patients in this time window who were eligible based on their NCT ASPECT score received IV r-tPA
Demographics and imaging biomarkers in Group #1 (patients in the 0–4.5-h time window)
Sample size and number needed to screen for imaging biomarkers considered in isolation and in combinations in in Group #1 (patients in the 0–4.5-h time window)

PCT: perfusion CT; CT angiography; NCT: non-contrast head CT.
Group #2 – 3–9-h time window: Patient in time window who were eligible based on their NCT ASPECT score and the presence of an M1 clot on CTA received endovascular treatment
Demographics and imaging biomarkers in Group #2 (patients in the 3–9-hour time window)
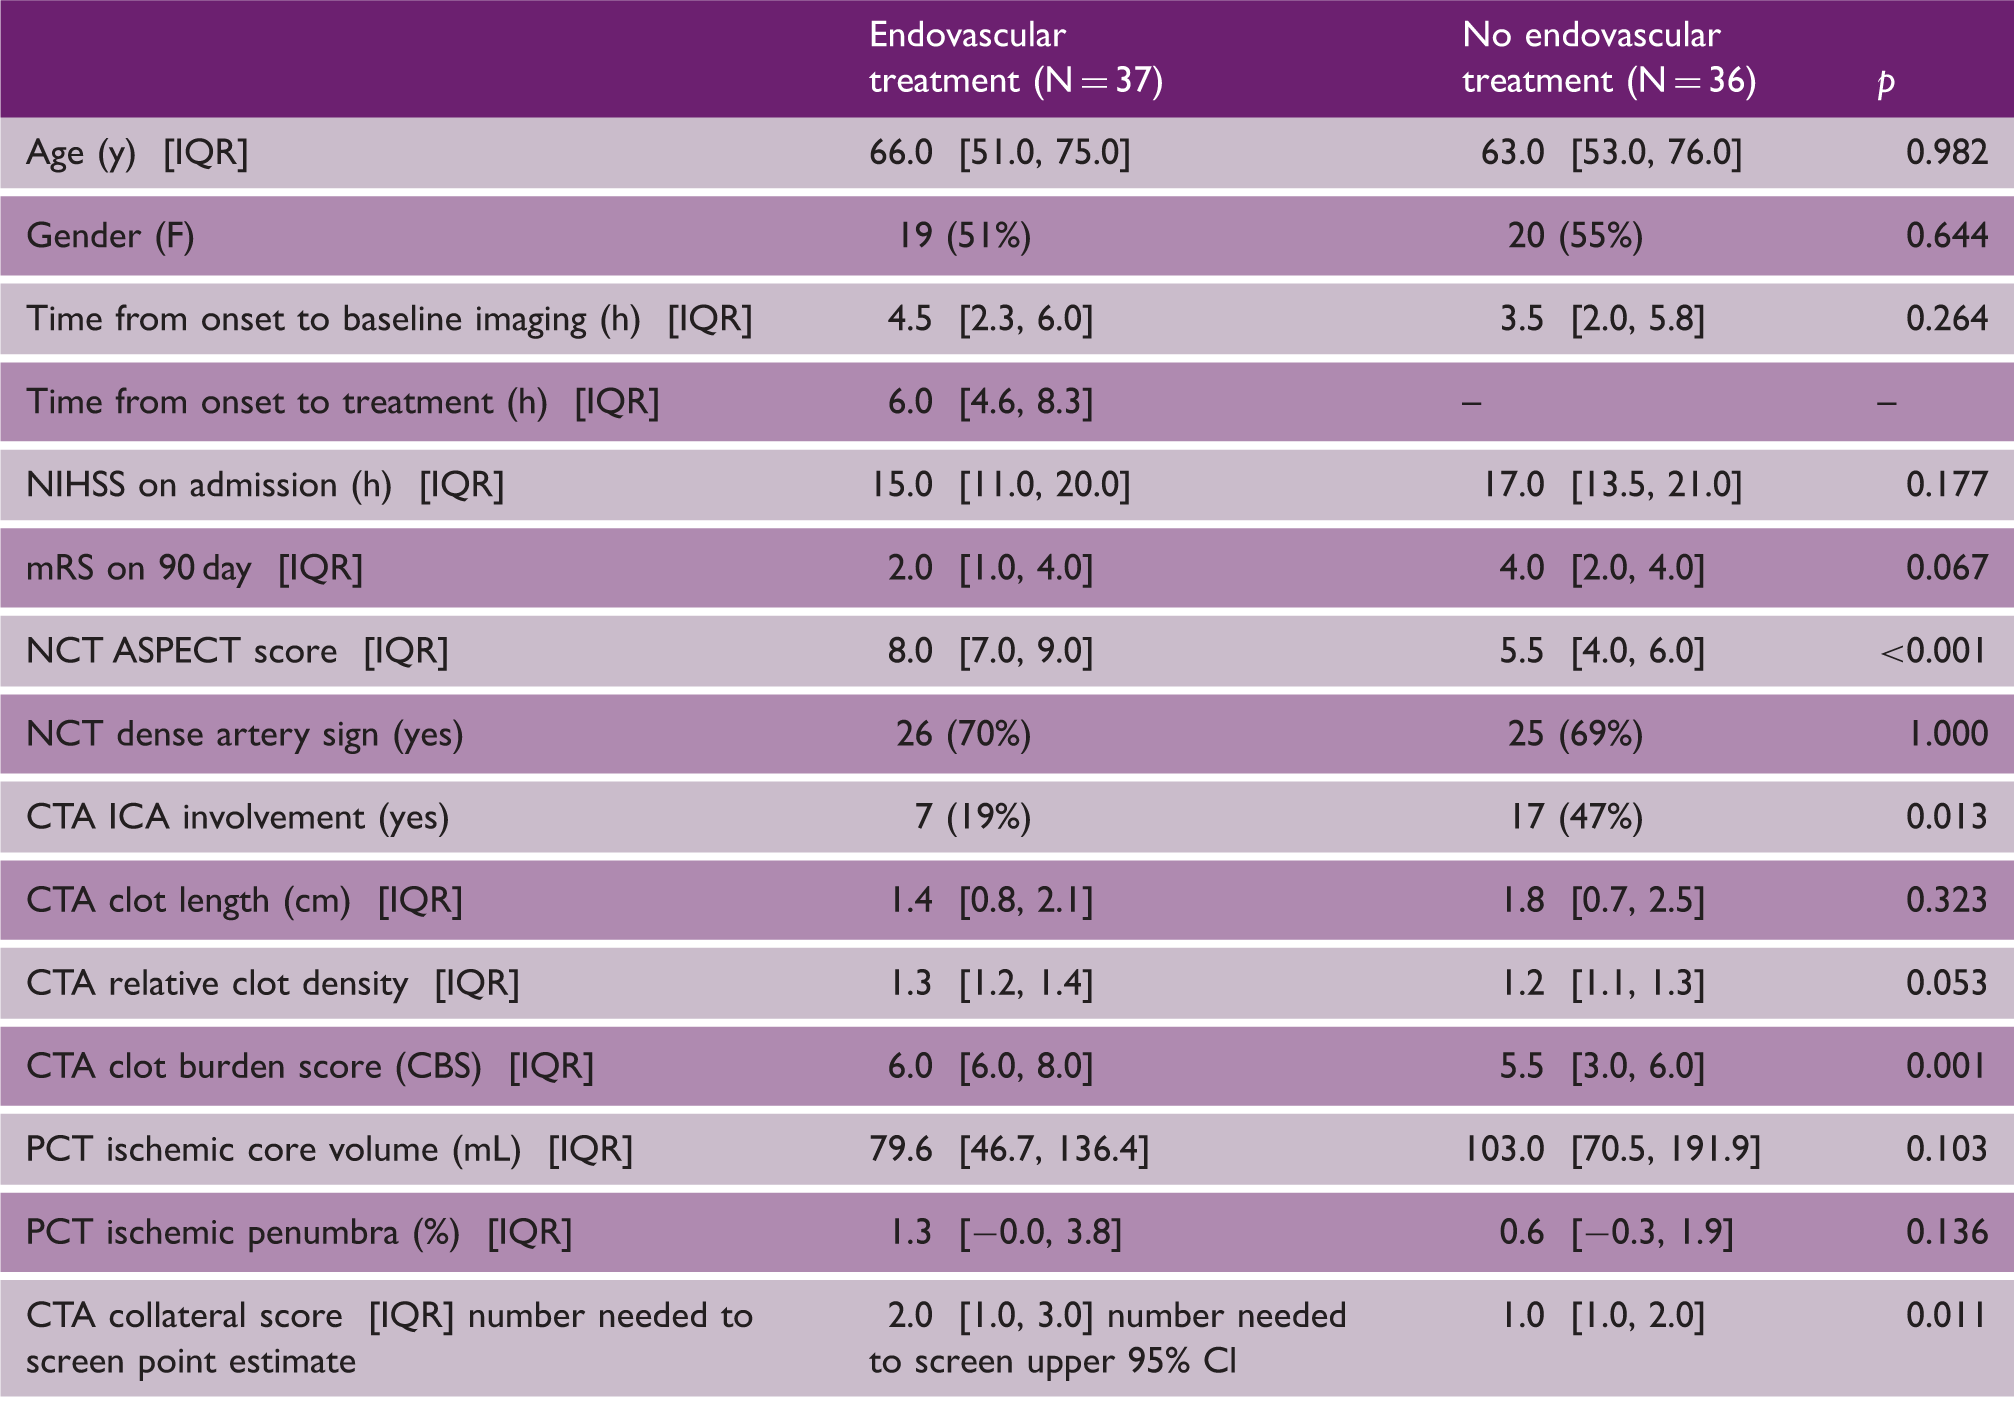
PCT: perfusion CT; CT angiography; NCT: non-contrast head CT.
Sample size and number needed to screen for imaging biomarkers considered in isolation and in combinations in in Group #2 (patients in the 3–9-h window)

Test of interaction less than 1 indicates wrong interaction direction, so discarded.
PCT: perfusion CT; CT angiography; NCT: non-contrast head CT.
We obtained similar relative ranking of the biomarkers when we repeated our analyses using an mRS 0–1 outcome.
Discussion
The distinction between prognostic and predictive biomarkers is critical to the design of clinical trials, not only for cancer, but also for stroke. 1 Patient selection using a biomarker for a clinical trial can be successful only if the considered biomarker is predictive of the effect of the treatment tested in the trial, but will be less successful if the biomarker is prognostic of the clinical outcome independently of whether the patients are in the treatment or control groups. In our systematic review of the imaging biomarkers studied in the field of stroke, we found that some are prognostic, others predictive and a lot of them in a mixed or intermediary situation. PCT ischemic core is typically a prognostic biomarker in the sense that a large ischemic core is associated with an unfavorable outcome, and this independently of whether the patient receives revascularization therapy or not. Others, such as the PCT ischemic penumbra, are predictive biomarkers, because, as demonstrated previously, 12 a large penumbra is only associated with a favorable outcome if there is early recanalization and this penumbra is salvaged. If there is persistent occlusion or late recanalization, the large penumbra becomes a large infarct associated with an unfavorable outcome. In MR RESCUE, the rate of recanalization was relatively low, 13 both in the treatment and control groups, perhaps explaining why penumbra did not show any significant treatment differential effect. Instead, the penumbra appeared in this setting, stripped of its predictive component, as a prognostic biomarker likely linked to the amount of collaterals, negatively related to the final infarct size and associated with a favorable outcome independently of treatment.
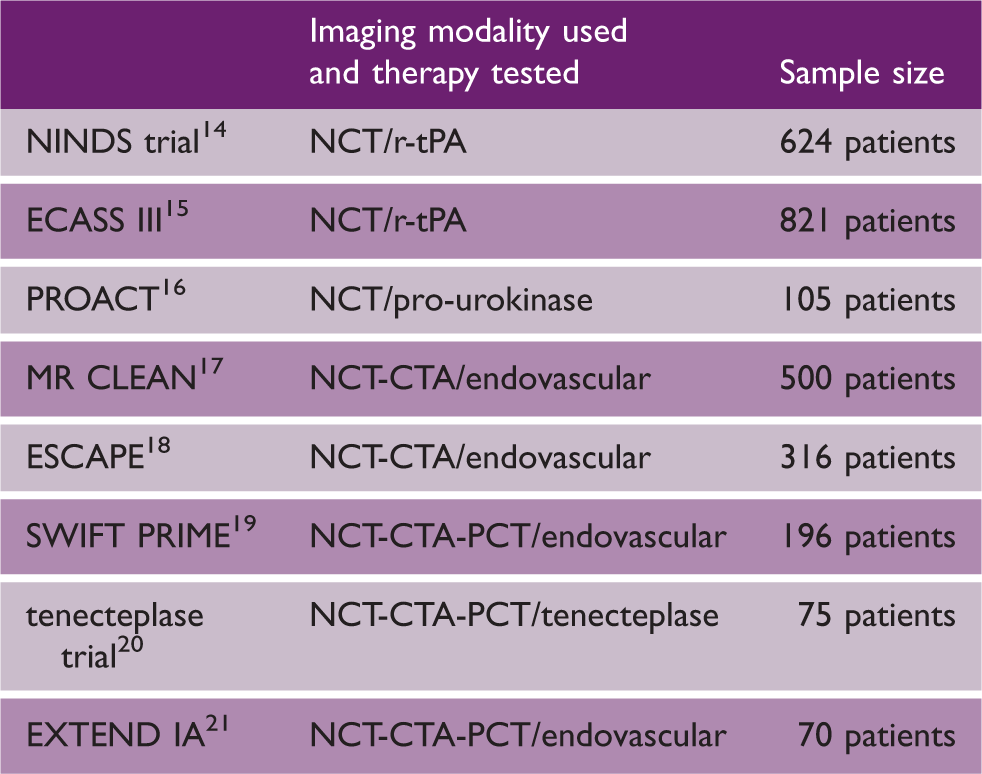
Sample sizes of representative acute stroke revascularization randomized clinical trials
We acknowledge a number of limitations to our study. Our results are restricted to CT analysis. Another limitation is that, ideally, the treatment decision would need to be essentially random and independent of the biomarkers tested. In our study, some imaging biomarkers (ASPECT score in 0–4.5-h time window – IV tPA Group #1, ASPECT score and presence of an M1 clot on CTA in the 3–9-h time window – endovascular treatment Group #2) were used to make treatment decisions. These biomarkers were not considered in the biomarker analysis as only those patients with positive values for these biomarkers were treated. Only those biomarkers not used for making treatment decisions were considered for this study. As long as the tested biomarkers are not correlated too strongly to the imaging biomarkers used in treatment decision, the validity of our study should be preserved. This seems to be the case as illustrated by the range of PCT ischemic core despite all patients having an ASPECT score ≥ 7. The results described above apply to our registry data, which carries a risk of selection bias as all registries, and may not be generalizable to the stroke population in general. However, our reported numbers should have internal validity and, while the absolute numbers needed to screen may be different in other study populations, their ranking relative to each other should hold even in different populations. It would be interesting to test an approach similar to the one used in this study in the pooled data from randomized clinical trials, in order to test the external validity and generalizability of our results. Another limitation is the possible interference of both clinical parameters or etiology of the infarct (not available). Finally, we did not have a sufficient number of patients with bridging r-tPA and endovascular therapy to conduct our analyses in this clinically important group.
In conclusion, predictive biomarkers need to be differentiated from prognostic biomarkers when being considered to select patients for a trial, and their prevalence should be assessed to determine number needed to screen and overall feasibility of the trials. We identified PCT penumbra and CTA collateral score as “feasible” predictive biomarkers for IV thrombolysis, and clot burden score, clot length, and PCT penumbra as “feasible” predictive biomarkers for endovascular revascularization.
Footnotes
Authors’ contribution
PM, TJ, and AE acquired the data.
QH performed the data processing and analysis.
JTP and WX performed the statistical analysis.
MW provided oversight for the study.
All authors were involved in manuscript writing and approved the final version of the manuscript.
Declaration of conflicting interests
The author(s) declared the following conflicts of interest with respect to the research, authorship, and/or publication of this article: TG Jovin has consulted for Codman Neurovascular and Neuravi, holds stock in Silk Road and Blockade; has acted as an unpaid consultant to Stryker as PI of the DAWN trial and served as an unpaid member of a Medtronic Advisory Board.
P Michel Co-investigator in ECASS-II, ECASS-III, DIAS trials, SWIFT-PRIME and BASICS.
Funding
The author(s) received no financial support for the research, authorship, and/or publication of this article.