
Abstract
Our study aimed to examine athletics, training characteristics, and prevalence of musculoskeletal symptoms of male junior tennis Davis Cup players (DC) in comparison with their regional counterparts, as well as to evaluate the impact of age and performance level on training characteristics. Twelve junior DC (male) and two samples of regional squad players (RS1 n = 60 males, n = 47 females; RS2 n = 59 males) participated in a physical testing, an interview for data evaluation on training characteristics, and a questionnaire survey of orthopedic injury frequency. Results indicate higher physical performance levels (effect size (ES) 0.75–1.26) and training volumes in DC (ES 1.23–1.66). In DC, significant relationships were found between total training volume and tennis ranking (r = −0.78), age and physical training volume (r = 0.82), and age and total training volume (r = 0.62). Injury frequencies showed moderate to high prevalence with no differences (p > 0.05) between DC and RS. Given the demands of elite tennis and the important role of service in the modern game, more efforts are necessary to develop training prescription for both performance enhancement and prevention strategies.
Keywords
Introduction
The modern game of tennis has evolved from a primary technical sport to the current explosive sport becoming increasingly dynamic and faster based on strength, speed, and power with higher stroke and serve velocities leading the service game to being a key factor in game success.1–3 Consequently, tennis is a complex sport requiring technical, tactical, psychological, and high-level physical skills to be successful.1,3
While technical skills are predominant factors, 4 the importance of the athletes’ physical fitness, including a complex profile of speed, agility, and power combined with medium to high aerobic and anaerobic capacity, is also well accepted.3,5 Functional links observed between muscular strength in the dominant upper and lower limbs and ranking position in competitive tennis players reinforce the notion that physical attributes have a strong influence on tennis performance and might be important determinants for successful participation in elite tennis.6–8 Nevertheless, it is debatable whether the impact of fitness on the complex tennis performance is crucial to detect differences in performance levels. With regard to this issue, there is a lack of information for tennis analyzing the effect of performance level on athletic characteristics.
Due to the intense demands of the modern tennis game, an increased strain on players in training and competition exists. Therefore, in order to be competitive, players must devote a great amount of time to improving their tennis skills and high demands of training workloads must be tolerated. A training workload of 15–20 hours per week (h/wk) of technical and tactical training is recommended to achieve high competitive levels, not including a further conditioning program.9,10 In addition, even though the important role of physical skills for tennis performance is known, it seems that only a minimum of specific physical training sessions can be programmed per week. This might be due to a lack of proposal time. 10 To date, very little information has been reported about the actual total training workload, including time spent for fitness improvement of the players, especially of young athletes, their distribution of training contents, and if there is a functional link to tennis performance. Further, it is reasonable to assume that players of a higher performance level would outperform players of a lower level with respect to training characteristics in both quality and quantity. Yet, there is no data comparing these items in elite and sub-elite players.
In addition, during the last few years there has been a subsequent steady rise in the number of injuries in tennis, most commonly overuse injuries. 11 The considerable high demands of elite tennis with high training volumes, full tournament schedules from an early age, as well as the repetitive nature of high-loading movement patterns (i.e., exertion of the serve motion, quick starts, stops, and changes of direction) along with the use of artificial surfaces, lead to high stress which may in turn result in an increased injury potential.6,12,13 In particular, the stroke production generates high repetitive forces; the serve has been reported to be the most traumatic and exhausting skill on the upper extremity.13,14 Consequently, the tennis serve could be described as a dominant limiting performance factor, accompanied by a higher risk of developing musculoskeletal disorders. 11 Nevertheless, there is less information about injury frequency in elite German junior players, especially regarding injuries directly related to the serve performance and specifically to different performance levels.
Thus, the aim of the study was to describe and examine athletic performance, training characteristics and prevalence of musculoskeletal injuries of junior tennis Davis Cup players (DC) in comparison with their regional counterparts (regional squads), as well as to evaluate the impact of age and performance level on given training characteristics.
Methods
Subjects
Individual characteristics of the players and classification to the experimental set up. Data are presented as mean ± SD.
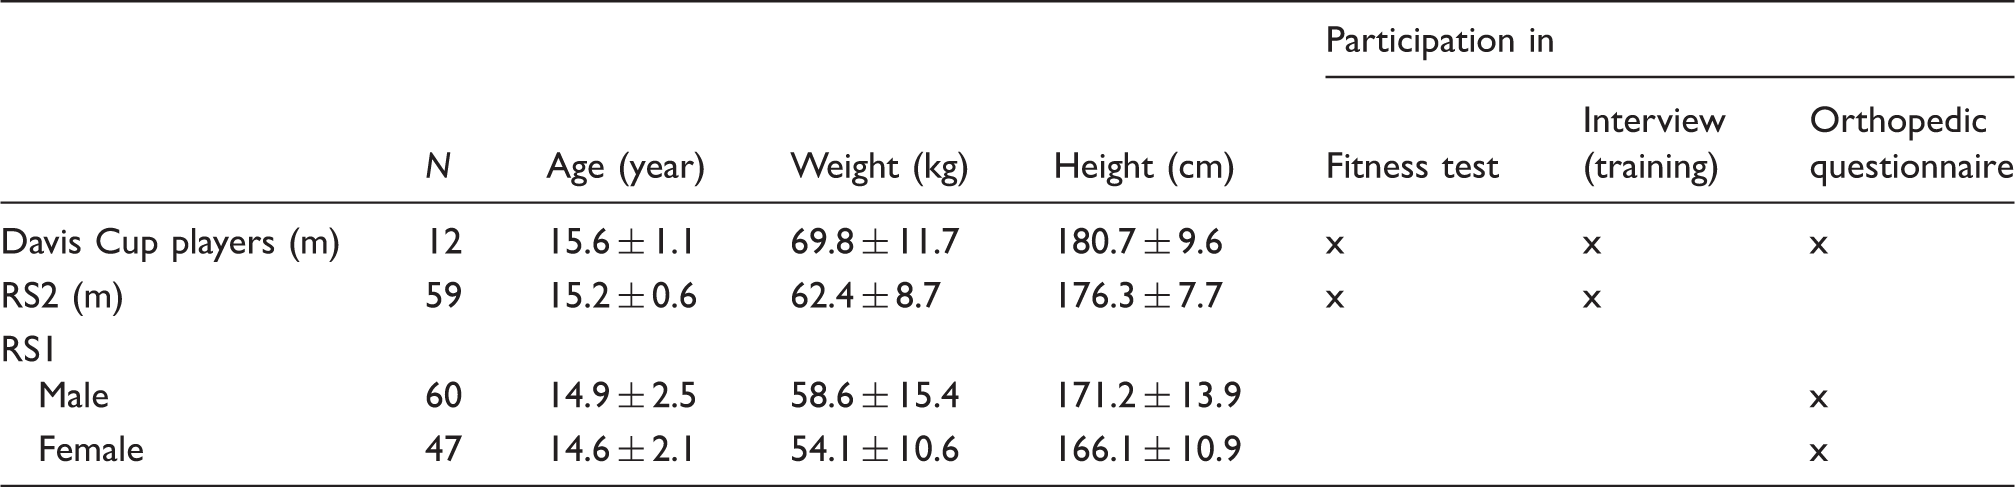
f: female; m: male.
Experimental set-up
This study examined athletic performance, training workloads, and orthopedic injuries of junior DC in comparison with their regional counterparts. The experimental design was divided into different parts (Table 1):
Athletic performance measurements: For assessment of athletic performance, subjects (DC, RS2) performed the German Physical Condition Tennis Test.
10
Data of DC were obtained during a training workshop in laboratories at the Department of Training and Exercise Science at Ruhr University Bochum, while data for regional squads were gathered at the players’ respective federation base over a three-week period of time. Training characteristics: All athletes (DC, RS2) participated in an interview for data collection on training characteristics, respectively at the Department of Training and Exercise Science and at the regional federation base. Orthopedic assessment: To obtain an orthopedic status (orthopedic injury prevalence), a self-reported questionnaire was used in total of 107 regional squad players (RS1) as well as in DC (n = 12).
Athletic performance and anthropometric measurements
Physical performance was assessed using the standardized fitness test battery of the German Tennis Federation. 10 Using the German Physical Condition Tennis Test Protocol, an assessment of athletic performance can be conducted by norm values and percentiles as described by Ulbricht et al. 10 and Fernandez-Fernandez et al. 15 The percentiles can be used to obtain norm-referenced interpretations of the performed fitness score within a distribution consisting of scores from a comparable section. 16 By means of this fitness-testing concept, individual profiles of the players with their respective strengths and weaknesses in comparison with their peers could be obtained. 10 Physical performance tests were conducted in an indoor tennis court (Rebound Ace surface) and began after a 15-minute individual warm-up, consisting of low-intensity forward, sideways, and backward running, acceleration runs, hopping exercises, and jumps of increasing intensity. 10
Anthropometry and maturity status
Testing sessions started with a measurement of the athlete’s body dimensions. Anthropometrical measurements included body height, body mass, and sitting height. Athletes’ body height was obtained with a fixed stadiometer (±0.1 cm, Holtain Ltd., Crosswell, UK) and sitting height with a purpose-built table (±0.1 cm, Holtain Ltd., Crosswell, UK) to the nearest millimeter. Body mass to the nearest 0.1 kg was recorded with a digital balance (±0.1 kg, ADE Electronic Column Scales, Hamburg, Germany). 10 In addition, leg length was calculated by subtracting sitting height from body height. 17 Status of maturity was calculated according to the biological age of maturity of each individual as described by Mirwald et al. 17 The age at peak height velocity is a commonly used indicator of somatic maturity representing the time of the fastest rate of growth in stature during adolescence.17,18 By subtracting the chronological age at the time of measuring from the chronological peak-velocity age, the biological age of maturity (in years) was estimated.17–19
Service velocity
First serve velocity was measured using a radar gun (Stalker Professional Sports Radar, Radar Sales, Plymouth, MN). The radar was located on the center of the baseline, 4 m behind the server, aligned with the height of 3 m, and pointing down the center of the court. Right-handed participants served from the deuce court and left-handed players from the ad court. After a brief warm-up consisting of serves with increasing velocity, eight first serves were performed. The average service speed was used for further analysis. 10
Medicine ball throws (MBT). Overhead, forehand, and backhand
Players were required to perform an overhead, a forehand, and a backhand MBT. 15 Holding a 2-kg medicine ball with both hands, the players stood on a line facing the throwing direction. After the ball was brought back behind the head, it was thrown forward as far as possible. Players were allowed to cross the line after tossing the ball. For performing the fore- and backhand MBT, players stood sideways on the starting line and simulated a forehand/backhand stroke. Distance was measured between the starting line and the point where the ball landed. Each player performed two repetitions on each side, and the best performance was recorded to the nearest 5 cm. 10
Grip strength
Maximal hand grip strength was measured with a hydraulic hand dynamometer with a handle width of 5 cm (Baseline®, Irvington, NY). Dominant and non-dominant hand grip strength was assessed in a standing position, elbow extended, and the arm positioned with the dynamometer parallel to the subject’s side. Participants were asked to perform a maximal voluntary contraction, squeezing the dynamometer as hard as possible for three seconds.10,20 The maximum force (in kilograms) achieved among two trials for each side was recorded.
Push-up test
All subjects were required to perform as many push-ups as possible. 21 For their starting position, the players placed their hands approximately 0.1–0.2 m wider than shoulder width while maintaining a horizontal spinal position. After diffracting the elbows, in order to lower the body until the chest was approximately 5 cm from the ground, subjects extended the elbows thereby returning to the initial position. 10 Speed of movement was controlled with an audio pacer set to 2 s for each repetition, with 1 s for concentric and 1 s for eccentric movement. The maximum repetition number performed with an appropriate technique was obtained with a maximum number set to 50.
Back extension test
For the back extension test, players lay on a mat in a downward position holding 1 kg dumb-bells in their hands with the elbows bent at right angles and the lower limbs remaining on the ground. While maintaining an upright position of the upper body without contact with the ground, players were asked to extend their elbows before returning to the initial position. Speed of movement was controlled with an audio pacer set to 2 s for each repetition, with 1 s for extending and 1 s for bending the elbows. The maximum repetition number performed with an appropriate technique was obtained with a maximum number set to 50.
20 -m linear sprint
Time of a 20 -m sprint in a straight line was measured by means of double-beam photocell gates placed 1.0 m above ground level (Sportronic TS01-R04, Leutenbach-Nellmersbach, Germany). Split times were recorded for 5 m and 10 m. Players were asked to start without a starting signal from an individually chosen standing position, 50 cm behind the first photocell gate, thus triggering a digital timer. All subjects performed two maximal 20-m dashes interspersed with three minutes of passive recovery, and the fastest trial was recorded. 10
Countermovement jumps (CMJ)
Double-leg vertical jumps without arm swing (i.e., with the hands on hips) were performed on a contact platform (Haynl Elektronik, Schönebeck, Germany) according to Bosco et al. 22 Each player performed two maximal CMJs interspersed with 45 s recovery, and the best height determined by flight time was recorded.
Hit & Turn Tennis Test
The Hit & Turn Tennis Test is an acoustically controlled progressive on-court endurance test for tennis players. 23 The test, consisting of 20 levels, involves specific movement patterns along the baseline (i.e., sidesteps and running) combined with forehand and backhand stroke simulations at the doubles court corner. There is a decreasing time span, i.e., 0.1 s per level, between the forehand and backhand strokes starting from 4.9 s (level 1) and reducing to 3.0 s (level 20). The duration of each test level is about 47–50 s, including 12–16 strokes with a rest period of 10 s after each level. For optional blood sampling, a longer break of 20 s is established after levels 4, 8, 12, and 16. Each test level starts from an initial position, where the players stand with their rackets in a frontal position at the middle of the baseline. Upon hearing a signal, the players turn sideways and run to the prescribed backhand and forehand corner, making their shot and return to the middle of the court using sidesteps or crossover steps (while looking at the net). When passing the middle of the baseline again, players turn sideways and continue to run to the opponent’s opposite corner. The test was accomplished when the players failed to reach the corners in time or were no longer able to fulfill the prescribed movement patterns. The maximal completed test level was then recorded. Equations were determined and evaluated describing the relation between test levels and VO2, which enables the estimation of VO2max. 23
Shoulder flexibility
Shoulder flexibility was measured using the shoulder mobility test of the Functional Movement Screen (FMS) according to Cook et al. 24 After making a fist with each hand, players were required to assume a maximally adducted and internally rotated position with one shoulder and a maximally abducted and externally rotated position with the other one. 24 The distance between both fists was measured. Each player was tested bilaterally and started with the dominant arm in an internally rotated position.
Stand-and-reach test
The stand-and-reach test was used to measure flexibility of the hamstrings and lower back. It was defined as having positive values when the players’ fingertips reached over the standing line (±0.5 cm). Each player performed one trial.
Training documentation
Data collection on training characteristics for each participant was undertaken during a standardized interview, the contents of which were determined by several experts in the field of tennis coaching and science. The isolated workloads of tennis training (TT), physical training, and of additional sport activities performed were retained for a normal training week (out of competition phase) and recorded in hours per week. Total training volume and the ratio of TT to physical conditioning (PT) was calculated. In addition, training history (years of practice, age of start playing tennis (years)), the organization form of tennis training (relation player: coach; 1:1, 2:1, 3:1, and 4:1 in percentage), and the distribution of training contents (warm-up, small-sided practice, technique, match training, and on-court physical training in percentage) throughout TT were obtained.
Orthopedic injury prevalence
Prevalence of musculoskeletal symptoms (MS) was recorded by a questionnaire developed in accordance with the standardized and validated Nordic Questionnaire. 25 The applied questionnaire includes (1) questions of limitations in the region of neck, shoulder, elbow, hand/wrist, thoracic spine, lumbar spine, hip, knee, and ankle/feet throughout the whole tennis career; (2) questions of limitations in upper extremities (shoulder, elbow, and hand/wrist) during the previous 12 months and in accordance with defined stroke performance (forehand, backhand, and serve); and (3) a pain score for the region of shoulder, elbow, and hand/wrist while performing the tennis serve. For pain severity measurement, the Numeric Pain Rating Scale was utilized, using ratings ranging from “0” indicating “no pain” up to “10” indicating the “worst possible pain.” 26 Non-standard questions were thoroughly pilot tested. Due to the fact that injury patterns are more likely to be sport than gender specific, it was decided to forego dividing the sample into males and females.
Statistics
All data are presented as mean values and standard deviations (±SD). Independent sample t tests were used to determine mean differences between junior DC and regional squads in anthropometric and physical performance as well as training characteristics. Further, the standardized difference or ES of changes in each parameter between the two groups was calculated using the pooled standard deviation. Threshold values for Cohen ES statistic were <0.2 (small), 0.5 (moderate), and >0.8 (large). 27 Injury prevalence between groups was compared using chi-square statistics. For analyzing the correlation between training volume and age, as well as athletic performance, the Pearson product–moment correlation coefficient (r) was used. Spearman’s rank correlation coefficient was calculated between training volume and tennis performance (i.e., national youth ranking). The magnitude of correlation was classified as trivial (0–0.1), small (0.1–0.3), moderate (0.3–0.5), large (0.5–0.7), very large (0.7–0.9), nearly perfect (0.9), and perfect (1.0). The p ≤ 0.05 criterion was used to constitute statistical significance. Data analyses were performed using the SPSS statistical software package (version 18, SPSS Inc., Chicago, IL, USA) and Open Office (version 3.2.1; Oracle).
Results
Athletic performance of junior Davis-Cup players (n = 12) in comparison with regional squad players (n = 59).
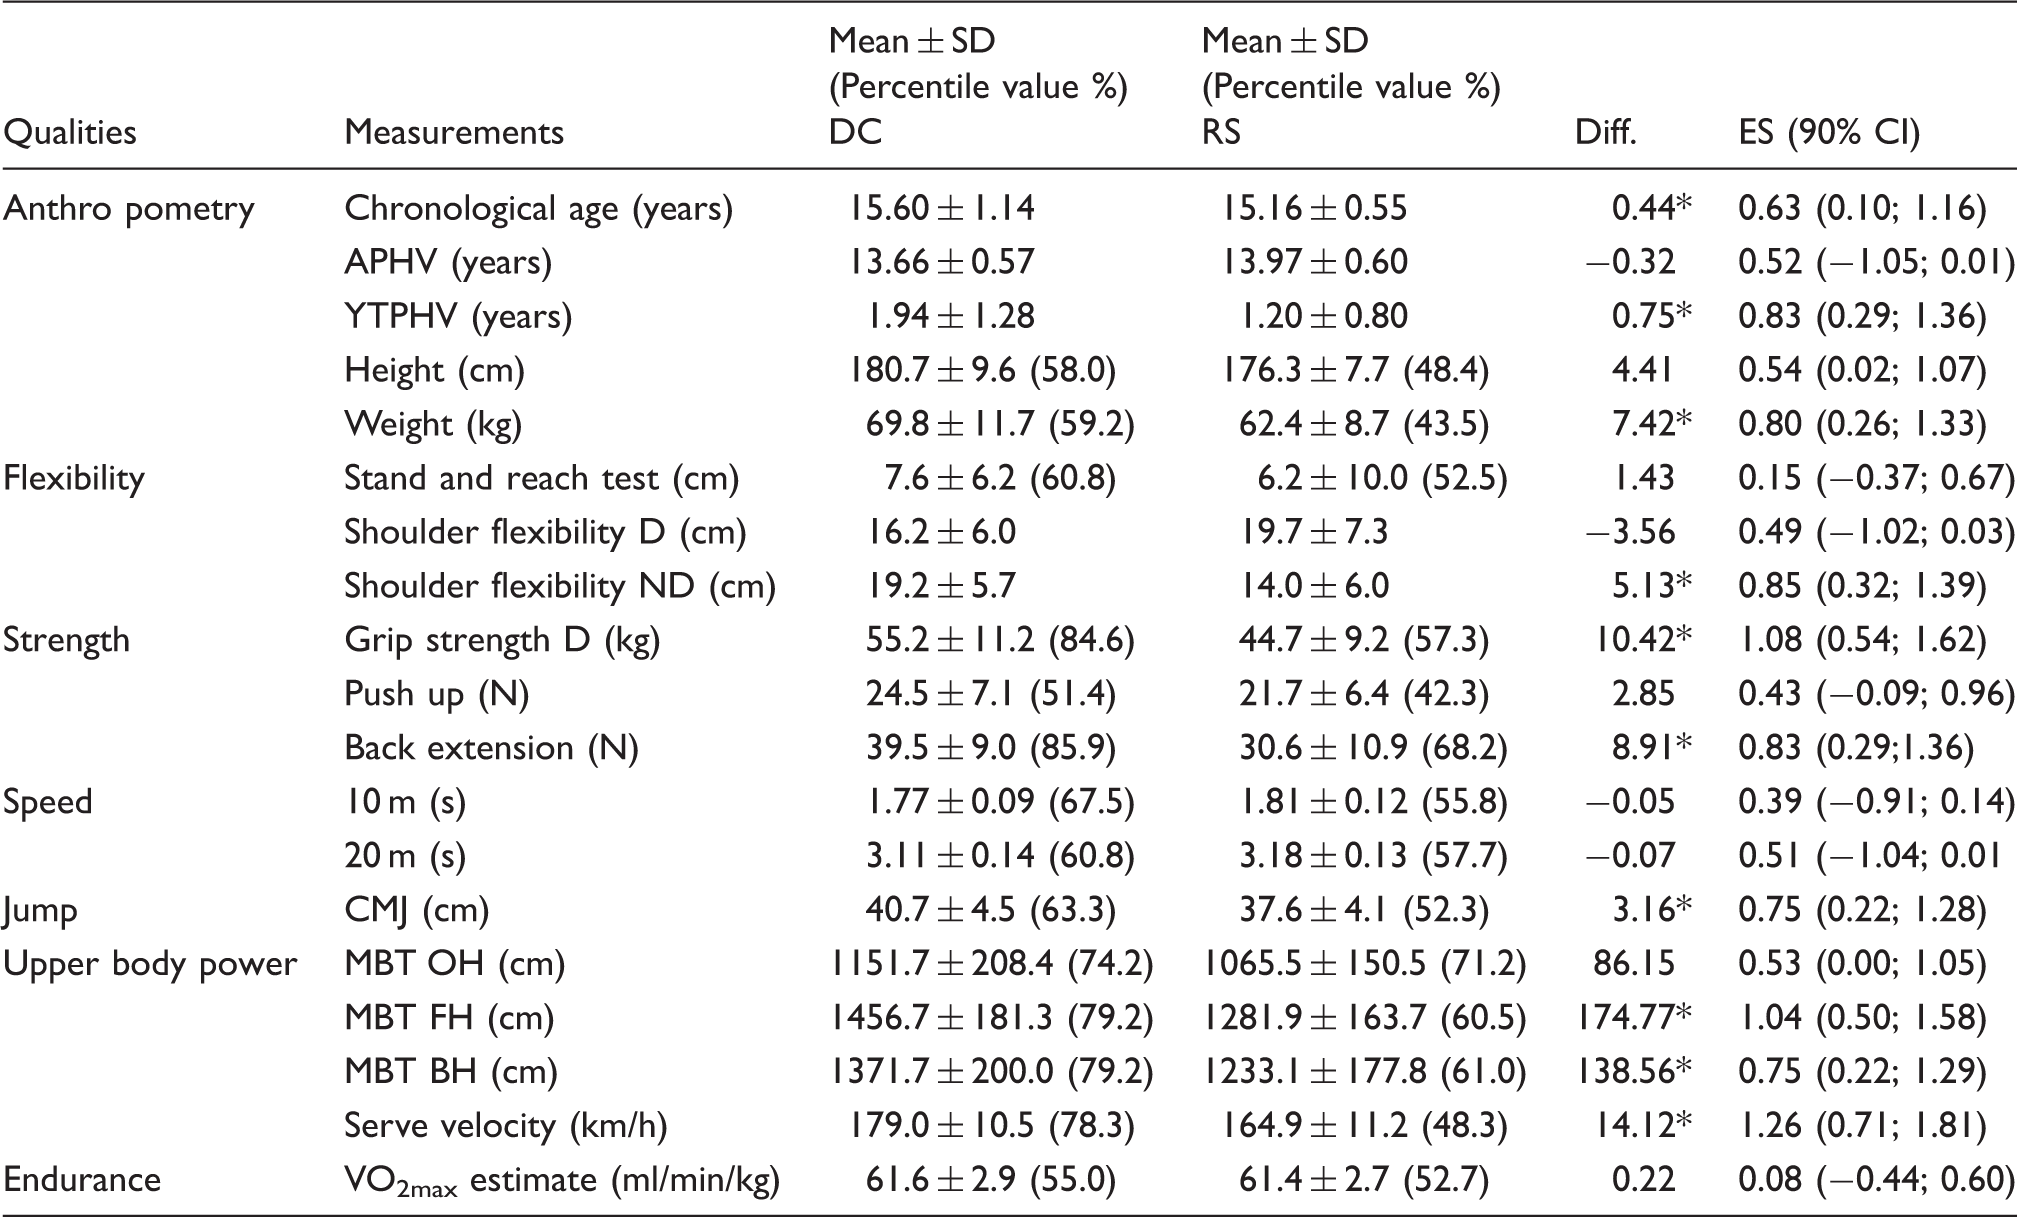
APHV: estimated age at peak height velocity; BH: backhand; CMJ: counter movement jump; Diff.: difference; D: dominant hand; DC: Davis Cup players; ES: effect size; FH: forehand; 90% CI: 90% confidence intervals; MBT: medicine ball throw; ND: non-dominant hand; OH: overhead; RS: regional squad players; YTPHV: estimated age from/to peak height velocity.
p < 0.05 for differences between DC and RS.
Training characteristics of junior Davis Cup players in comparison with regional squad players (mean ± SD).
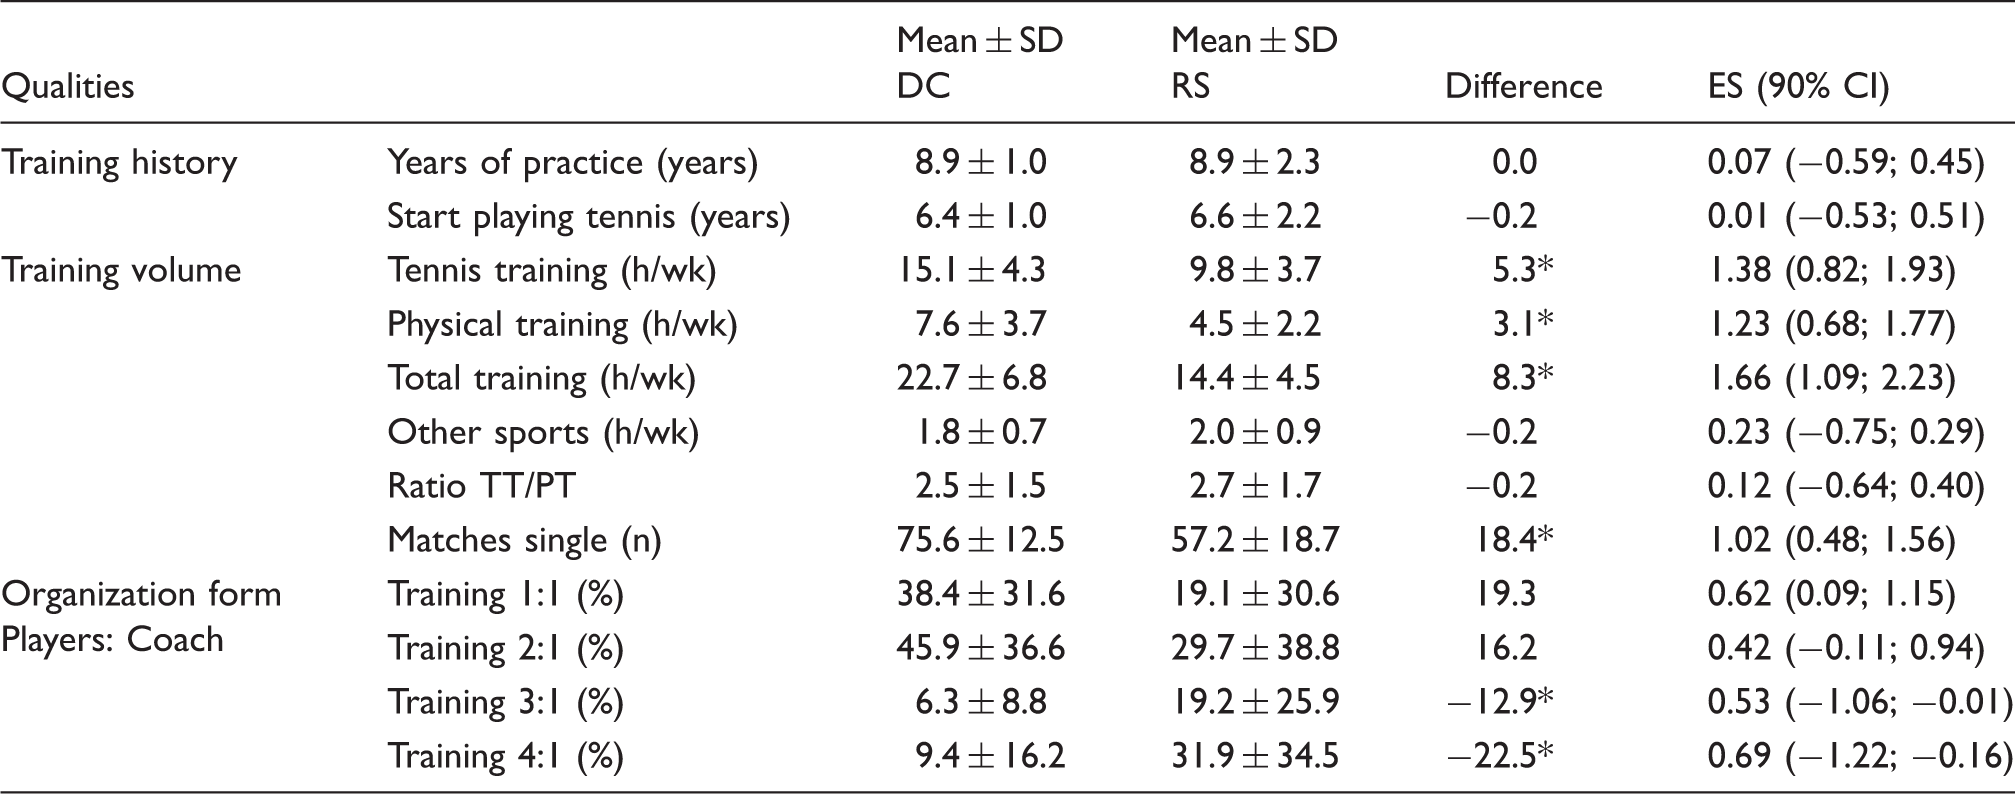
DC: Davis Cup players; RS: regional squad players; PT: physical training; TT: tennis training.
p < 0.05 for differences between DC and RS.
Correlations between training characteristics, age, and tennis performance in junior Davis Cup players.
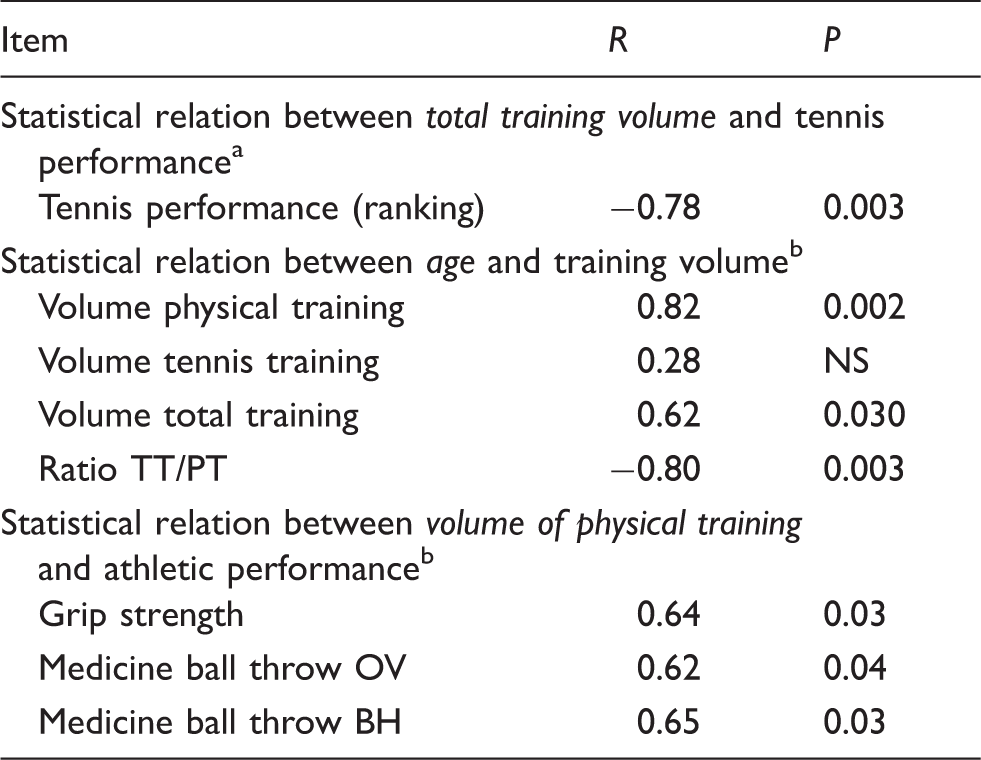
BH: backhand; OV: overhead.
Spearman’s ρ.
Pearson’s product–moment correlation coefficient.
Prevalence of musculoskeletal symptoms in DC and RS.
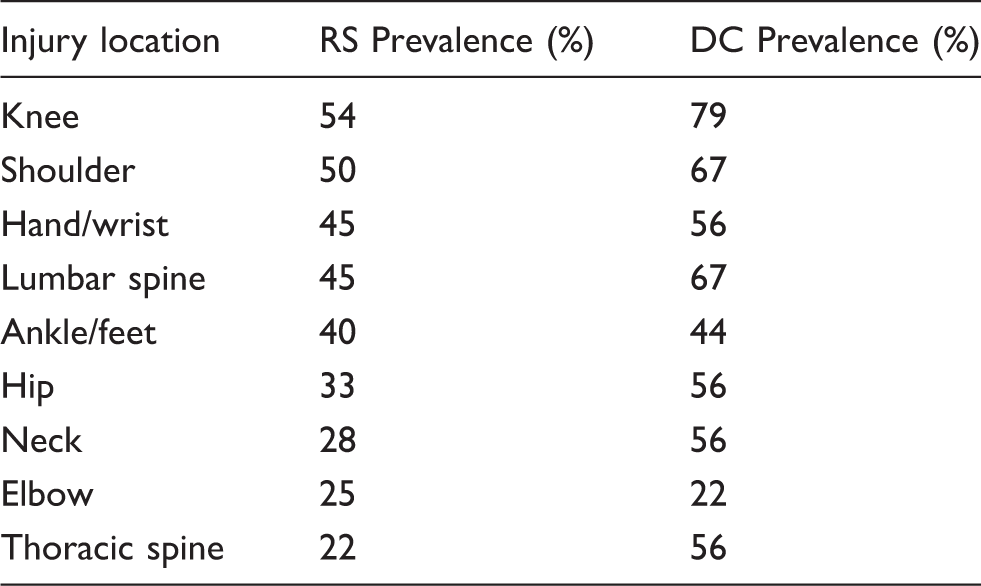
p > 0.05 for analysis between DC and RS. DC: Davis Cup players; RS: regional squad players.
Upper extremity injury rate throughout the last 12 months in DC and RS.
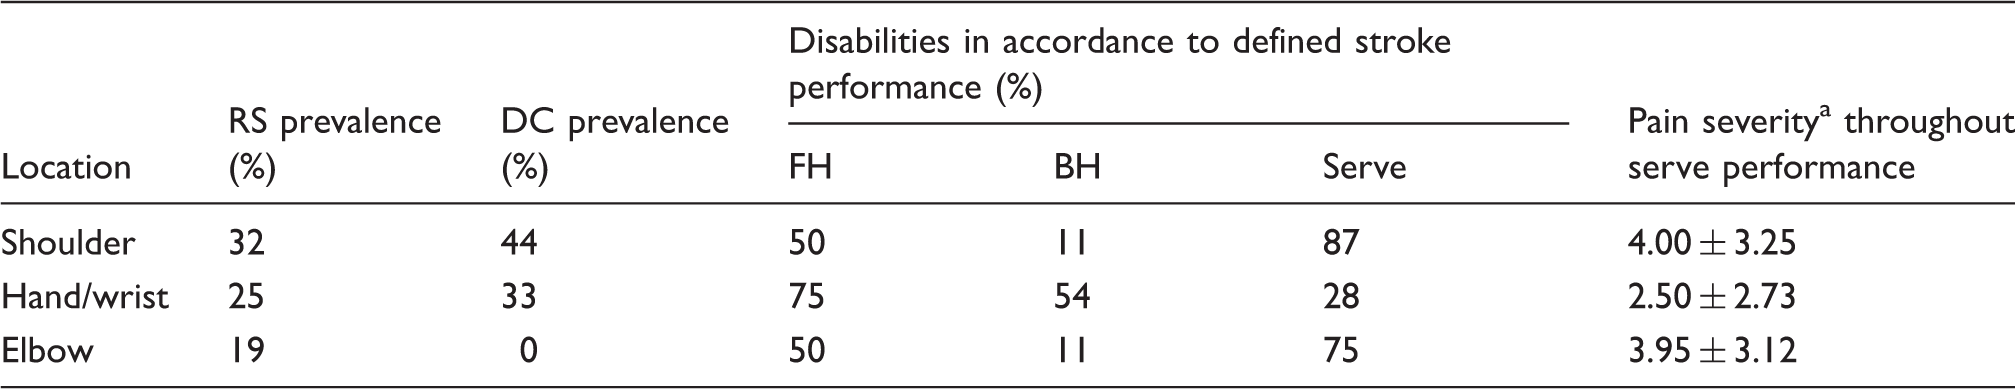
BH: backhand; DC: Davis Cup players; FH: forehand; RS: regional squad players.
p > 0.05 for analysis between DC and RS.
Numeric pain scale 0–10.
Discussion
The main aim of this study was to examine athletic performance, training characteristics, and orthopedic status of junior DC in comparison to their peers (RS). The present results (1) show a high physical performance level in DC, notably in upper body power and strength, (2) underline the need for high training volumes to compete at a high level, and (3) reveal moderate to high injury prevalence in both DC and RS with no differences between performance levels.
Training characteristics
The data obtained reflect that players devote a great amount of time to improving their tennis performance throughout training interventions. Junior DC start playing tennis at a young age (6.4 ± 1.0 years) and spend 22.7 ( ± 6.8) h/wk for total training workout (tennis training and physical training). Because of the predominance of techniques and tactics in tennis, 4 training priority is focused on the improvement of these skills with an average of 15.1 h/wk, while 7.6 h/wk are spent for improvements of athletic performance. These data differ significantly in comparison to the training volume of the RS (Table 3), thus supporting the idea that high training volumes are necessary to compete at a high performance level. This fact is also reflected by the high correlation (r = −0.78, p < 0.05) observed between the total training volume and player’s ranking position (Table 4). However, comparing these findings to the previous research is difficult since data on training characteristics in tennis do not receive much attention. Although the importance of intervention programs has not been questioned, there is less information about training characteristics compared to other sports, i.e., endurance-based sports.28,29 However, a few studies reported total training volumes, not evaluating a separate physical training. In adult elite tennis players (age 21.4 ± 2.6 years), Hornery et al. 30 found a total training workload of 32 h/wk during out of competition phases. In the investigation by Sanchez-Munoz et al., 31 23.2 h/week of training volume were recorded in elite male junior players (age 16.2 ± 0.4 years); the sample and results are in agreement with our findings in DC. Furthermore, training data of DC are in line with the recommendation of the International Tennis Federation (ITF) to spend 15–20 h/wk on technical and tactical skills. 9 Consequently, due to the fact that high training volumes seem to be indispensable for competing on an elite level even at a young age, training interventions must be organized as efficiently as possible to achieve an optimum cost–benefit ratio.10,15 Taking into account the abovementioned distribution of limiting performance factors (i.e., predominance of techniques and tactics), 4 the application of specific diagnostics, notably of physical parameters, helps to design individualized training programs according to the respective needs, thus leading to a minimized training volume focused on fitness training thereby saving time for tennis-specific training.10,15
Correlation analysis between training volume and the players’ age refers to an increased importance of physical training in older players (Table 4). While the volume of tennis training (i.e., techniques and tactics) is at a high level also in young players, physical training volume is enhanced in older ones. Consequently, and not surprisingly, there is also a positive moderate correlation between total training volume and age, as well as a high correlation between the ratio of tennis training and physical training and the age of players (Table 4). This might be due to fundamental changes in the biological system (i.e., hormone status) during and after maturity where some physical parameters (i.e., strength) are more likely to be enhanced. 32 For example, with increasing age (11–15 with girls and 13–17 with boys), the influence of the strength region is increased through hormone distribution (testosterone and estrogen) and resultant muscular growth. 32 Nevertheless, interindividual variation has to be considered since the physical development of athletes in particular differs during the process of maturation (i.e., retardation and acceleration), independent of age.17,33 We suggest that the interindividual stage of maturation, which is reflected by our results of estimated age from/to peak height velocity ranging from −0.67 to + 3.9 years, could also be one reason impeding general training guidelines and recommendations for physical training volume.
Athletic performance
In spite of the limited training time for physical training, data obtained for physical fitness indicate a moderate to high athletic performance level in junior DC according to norm values established by Fernandez-Fernandez et al. 15 and Ulbricht et al. 10 The qualities of the upper body strength and power-related characteristics (i.e., MBT and serve velocity) especially have to be highlighted with percentile values up to 85%; this data differed significantly when compared to RS (Table 2). In this regard, results are in line with previous research reporting differences in physical performance measures between athletes with different performance levels in soccer players.34,35 In agreement with Ulbricht et al., 8 analyzing the effect of performance level in tennis players, results reinforce that players require well-developed physical fitness for competing on elite levels, and it is reasonable to assume that the qualities of upper body power and strength are one of the determining factors in tennis performance as supported by previous research.8,36,37 Therefore, greater upper body power allows for the chance to improve tennis performance with higher stroke velocities. Since the modern game becomes faster, with the tennis serve being the most powerful and potentially dominant shot that influences the match results in the game of tennis, the implementation of high-serve velocities where 210 km/h serves are common, has led to an advantage in winning the rally either through an ace or indirectly due to a defense situation of the opponent because of the given time pressure.1,2,38 In conclusion, the development and evaluation of upper body intervention programs for improving tennis performance is of great interest and utility. 8
Medical orthopedic status
Results of medical orthopedic assessments refer to moderate and high injury prevalence in young athletes with no differences between performance levels, but with a tendency toward higher rates in DC (Table 5). Notwithstanding, comparisons are difficult since we are not aware of similar studies evaluating the effect of performance level on medical orthopedic status in elite junior tennis players. Concerning the effect of performance level, there is no consensus in the literature whether there is an increased or decreased risk of injury with increasing skill level. Baxter-Jones et al., 39 contrary to widely held opinion found, reported that while elite youth athletes do not appear to be at increased risk of injury, there is an increased risk of injury with increasing skill level in wrestling, as reported in a review of Emery. 40 Further, Jayanthi et al. 41 reported no differences in prevalence rates across different skill levels in recreational competition adult tennis players. We suppose that the tendency of higher injury rates in DC could occur due to the evidently higher demands in DC, particular in training volume and match participation (Table 3). This assumption is supported by previous research. In this regard, DiFori and colleagues 42 summarized that the volume and intensity of training is strongly related to overuse injury risk.
With respect to an entire tennis career, the highest frequencies of MS are observed in the upper (i.e., shoulder with 67% in DC and 50% in RS) and lower extremities (i.e., knee with 79% in DC and 54% in RS), and also in the lower back (Table 5). These findings are in line with previous research.43–46 Epidemiologic studies evaluating tennis injuries reported that the lower and upper extremities are the body areas where injuries occur most frequently, with the shoulder, elbow, and knee being the most widely involved joints. 44 In agreement with this, Priest and Nagel 47 recorded that over 50% of the world’s best tennis players had experienced shoulder symptoms during their career, mostly secondary to overuse injuries with muscle imbalances being a risk factor for developing disorders.14,48 For prevention strategies and performance enhancement, it is of great importance to identify and monitor these predisposed body areas so that prescribed limitations can be considered by coaches, conditioning professionals, and physiotherapists.44,46
Concerning the 12-month prevalence of MS of the upper extremities, results indicate that nearly 55% of athletes had at least one disability in this body region during the last year. Shoulder injuries (with values up to 44%) were the most common, followed by injuries to the hand/wrist (33%) and elbow (19%) (Table 6). The assumption that shoulder pain and injuries are often related to the serve is reported by many authors13,14,49 and confirmed by our results, which indicate that 87% of the players with shoulder disabilities throughout the last 12 months have discomforts notably during serve performance and less during forehand (50%) and backhand strokes (11%). Moreover, the highest pain scores for pain severity during the tennis serve is related to the shoulder (4.00) followed by the elbow (3.95) and wrist (2.50) (Table 6). The actual high injury rate of the upper extremities, especially of the shoulder and in relation to the serve motion, could be explained by the strenuous repetitive forces during stroke production. 13 Serve performance in particular generates a high load on tennis players’ shoulders, 14 and in addition to the shoulders’ natural hypermobility and the excessive laxity of the glenohumeral joint, 44 make the joints prone to injury. Johnson and McHugh 13 emphasized that the shoulder plays an essential role in the kinetic chain to transfer the forces to the hand and the racket. The serve inherently requires repetitive powerful concentric internal shoulder rotation for power generation followed by eccentric forces to the external rotators to decelerate the overhead arm motion. 44 Rotation velocities of 2420°/s (internal rotation) 50 and large range of motion demands, especially in external rotation during the cocking phase, intensify the high stress on the serving shoulder. 13 Taking the high repetitive nature of this stroke into consideration, only an adequate service technique and optimal strength and conditioning status for stabilizing the shoulder joint may prevent injuries, since improper serve techniques could result in increased loading of the upper limb joints.14,44,51
Conclusion
Due to the evolution of tennis over the last years from a preliminary technical sport to the explosive sport it is today, tennis has become increasingly dynamic and faster, with considerably high demands on young athletes to compete at an elite level.1,4 This is reflected in our results from analyzing athletic performance, training characteristics, and medical status in high-performance youth tennis. Results obtained in the present study indicate a higher physical performance level, especially in upper body power and strength (i.e., serve velocity, MBT, and grip strength) as well as higher training volumes (i.e., technique and tactics and physical conditioning) with differences of up to 8 h/wk in junior DC. The observed differences in athletic performance between elite players and RS highlight the remarkable role of upper body power and strength in adolescent tennis. In this regard, we recommend upper body intervention programs to enhance performance levels due to the important role of serve performance in the modern tennis game. Moreover, there are moderate to high injury prevalences in DC and RS. The highest prevalence of MS was found in the body regions of the knee and shoulder. The high demands (i.e., scope with high physical stress, high training volume, and full tournament schedule) of successful participation in high-level youth tennis make it a challenge for coaches to have a player competing on the elite level with a low risk of injury. This has to be considered by coaches in planning their intervention programs: training interventions must be individualized according to the athlete’s needs and limitations with respect to efficiency and saving time. 10 Therefore, specific diagnostics are recommended at least twice a year (i.e., physical fitness tests). In addition, more effort is needed to develop training prescriptions for prevention strategies. The implementation of a high-quality tennis-specific prevention program (e.g., strengthening the external rotator for prevention of shoulder injuries which are due to serve performance) during training is required, as it may lessen the severity of overload injuries and enhance a player’s performance.44,46
Footnotes
Declaration of Conflicting Interests
The author(s) declared no potential conflict of interest with respect to the research, authorship, and/or publication of this article.
Funding
The author(s) received no financial support for the research, authorship, and/or publication of this article.