
Abstract
Limited information is available regarding the training loads of adolescent rugby union players. One-hundred and seventy male players (age 16.1 ± 1.0 years) were recruited from 10 teams representing two age categories (under-16 and under-18) and three playing standards (school, club and academy). Global positioning systems, accelerometers, heart rate and session-rating of perceived exertion (s-RPE) methods were used to quantify mean session training loads. Session demands differed between age categories and playing standards. Under-18 academy players were exposed to the highest session training loads in terms of s-RPE (236 ± 42 AU), total distance (4176 ± 433 m), high speed running (1270 ± 288 m) and PlayerLoad™ (424 ± 56 AU). Schools players had the lowest session training loads in both respective age categories. Training loads and intensities increased with age and playing standard. Individual monitoring of training load is key to enable coaches to maximise player development and minimise injury risk.
Keywords
Introduction
Rugby union is a collision team sport which elicits a variety of physiological responses during match play, due to the repeated high-intensity effort and collision nature of the sport. 1 The demands of match play have been frequently investigated,2–4 yet little information is available on the training loads (TLs), which are a major factor in the development of rugby players. 5 Despite England having the highest number of participants in rugby union, 6 to date, there is limited knowledge of the physical demands of English adolescent rugby union training. A recent study found that junior rugby union players were heavier (20%), stronger (50%) and faster (7%) than their counterparts 13 years previous. 7 Although the authors suggested that adaptation to the changing demands of the game and enhanced training methodologies have resulted in these physical changes, little is known about either suggestion in this population. Recently, training demands have been shown to relate to injury,8–10 performance 11 and physical development, 5 thus this is imperative information for the coach to make evidence-based decisions on how they structure training sessions for developing athletes.
TL is the product of training volume and intensity, and can be categorised as either internal or external. 12 The internal load is the relative physiological and psychological stress imposed on an individual by an activity, whereas the external load is the total work completed by the individual independent of internal factors. 12 Quantification of TL is an emerging research area and common practice in elite and professional sport, but limited information has been published in adolescent team sport athletes due to the protection of the data by sporting clubs and organisations. 13 For optimal athletic performance, a balance of training stimuli and recovery processes are required, which can be further complicated during adolescence due to the associated physiological and psychological changes. 14 Monitoring TL in adolescent athletes is critical to ensure that positive training effects are maximised and negative consequences such as injury, illness and/or overtraining are avoided. 5
To date, the quantification of TL in adolescent rugby union players is limited to a single research group in Australia.15–17 The research group found that although weekly training volumes were high, individual session intensities were significantly lower than those observed in competitive match play. 17 A major limitation of these studies is that there were no within-group comparisons, with respect to age categories, in a cohort of 14–18 year olds. Furthermore, previous research in adolescent soccer players identified a significant increase in both training volume and intensity between the ages of 14 and 18 years. 18 The differences in training frequency, volume and intensity between age groups in junior rugby union players are likely to differ but are yet to be determined.
Adolescent rugby union players may participate with teams in multiple age categories and playing standards simultaneously. As both excessive and insufficient TL during adolescence may impede optimal athletic development, understanding the specific TLs undertaken by adolescent rugby union players is clearly important for their athletic performance, injury prevention, playing progression and general wellbeing.14,16,19 A greater understanding of the demands of individual training sessions by coaches will help to optimise development, performance and progression, whilst simultaneously reducing the participants’ likelihood of exposure to negative training effects. 5 Therefore, the aim of the present study was to compare in-season field-based session TLs of adolescent rugby union players by age category and playing standard.
Method
Participants
Participant characteristics.
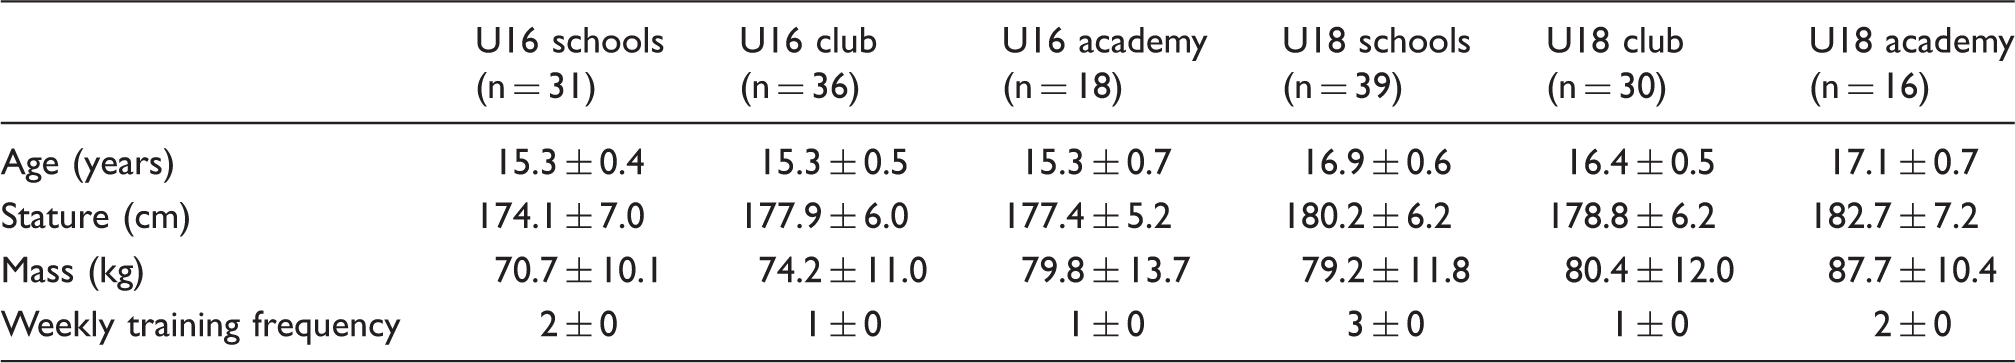
Data are presented as mean ± SD.
Design of study
In a prospective cohort design, each team was monitored during one complete in-season training week to quantify mean session TLs. Training practices were not altered or interfered with by the researchers at any time. All data were collected mid-season for each respective squad (between October 2014 and January 2015) to control for potential differences in TL due to the stage of season. The week was described as a “typical” training week (i.e. training frequency and intended intensity) by the coaches who were leading the sessions. Each training week was selected to provide the most representative microcycle for the respective teams in-season phase, in preparation for a single home competitive fixture.
During all training sessions, players wore a 10 Hz global positioning system (GPS) device (Optimeye S5, Catapult Innovations, Victoria, Australia) positioned on the upper back between the scapulae in a tight fitting custom-made vest. The mean ± standard deviation (SD) number of satellites connected was 14.4 ± 0.3 and horizontal dilution of precision was 0.82 ± 0.14 during data collection. Heart rate (HR) was captured using a portable HR monitor (T31c, Polar Electro, Kempele, Finland), which was fitted around the torso, level with the xiphoid process. All players wore the same GPS and HR monitoring devices for each session and the reliability and validity of the devices used in this study have been previously reported.20–22 Session-rating of perceived exertion (s-RPE) was also recorded post-training for all players. 23
Procedures
Perceptual intensity of training was quantified using a modified Borg Category Ratio-10 RPE scale. 23 All players were familiarised with the scale prior to commencement of the study. Approximately 30 min post-training, participants recorded their RPE, to minimise bias from the most recent phase of exercise. Recordings were taken non-verbally with each participant on their own and also blinded from previous scores to control for external influences. The RPE score was then multiplied by session duration (min) to provide an s-RPE value. Physiological intensity was quantified using mean exercise HR (HRmean) to provide an objective comparison for internal TL.
External TL was monitored using GPS and tri-axial accelerometer measures (total distance (TD), high speed running (HSR) distance and PlayerLoad™ (PL)). The threshold for HSR was defined as distance covered > 12 km·h−1 due to previously suggested population-specific movement classifications. 17 Tri-axial accelerometers within the GPS device provides a measure of combined anteroposterior, mediolateral and vertical accelerations (i.e. PL) to account for the additional non-locomotor activity demands of rugby union training. Accelerometer and GPS variables standardised for time were calculated to quantify external intensity (relative distance (m·min−1), relative HSR distance (HSR·min−1) and relative PL (PL·min−1)). Relative measures were calculated by dividing the total value by the duration of the session (min). Movement demands of training were also quantified using population-specific absolute velocity bands categorised as stationary (0–1 km·h−1), low (1–7 km·h−1), moderate (7–12 km·h−1), high (12–21 km·h−1) and very high (>21 km·h−1) speed running, as per previous adolescent rugby research. 17
Following each session, all GPS and HR data recorded were downloaded to the manufacturer’s software (Sprint 5.1.4, Catapult Innovations, Victoria, Australia). Once downloaded, all data were cropped so that only on-field activity for the recorded session time was included. Data were then exported to a customised Excel spreadsheet (Microsoft, Redmond, USA) for calculation of the selected variables.
Statistical analyses
Mean data were calculated for each participant from their respective weekly sessions to control for multiple and uneven observations. 24 After verification of normality, to assess the magnitude of between-group differences, Cohen’s d effect sizes (ES) were calculated with threshold values set at < 0.2 (trivial), 0.2–0.6 (small), 0.6–1.2 (moderate), 1.2–2.0 (large) and ≥ 2.0 (very large).25,26 Magnitude-based inferences were used to assess for practical significance. 26 The threshold for a change to be considered practically important (the smallest practical difference (SPD)) was set at 0.2× between subject standard deviation (SD), based on Cohen’s d ES principle. The probability that the magnitude of change was greater than the SPD was rated as 25–75%, possibly; 75–95%, likely; 95–99.5%, very likely; > 99.5%, most likely. 26 Where the 90% confidence interval (CI) crossed both the upper and lower boundaries of the SPD (ES ± 0.2), the magnitude of change was described as unclear. 26 All normally distributed data are presented as mean ± SD. Non-normally distributed data are presented as descriptive statistics only (i.e. median and interquartile range), and no further analyses were performed.
Results
Training load and intensity differences between age categories.
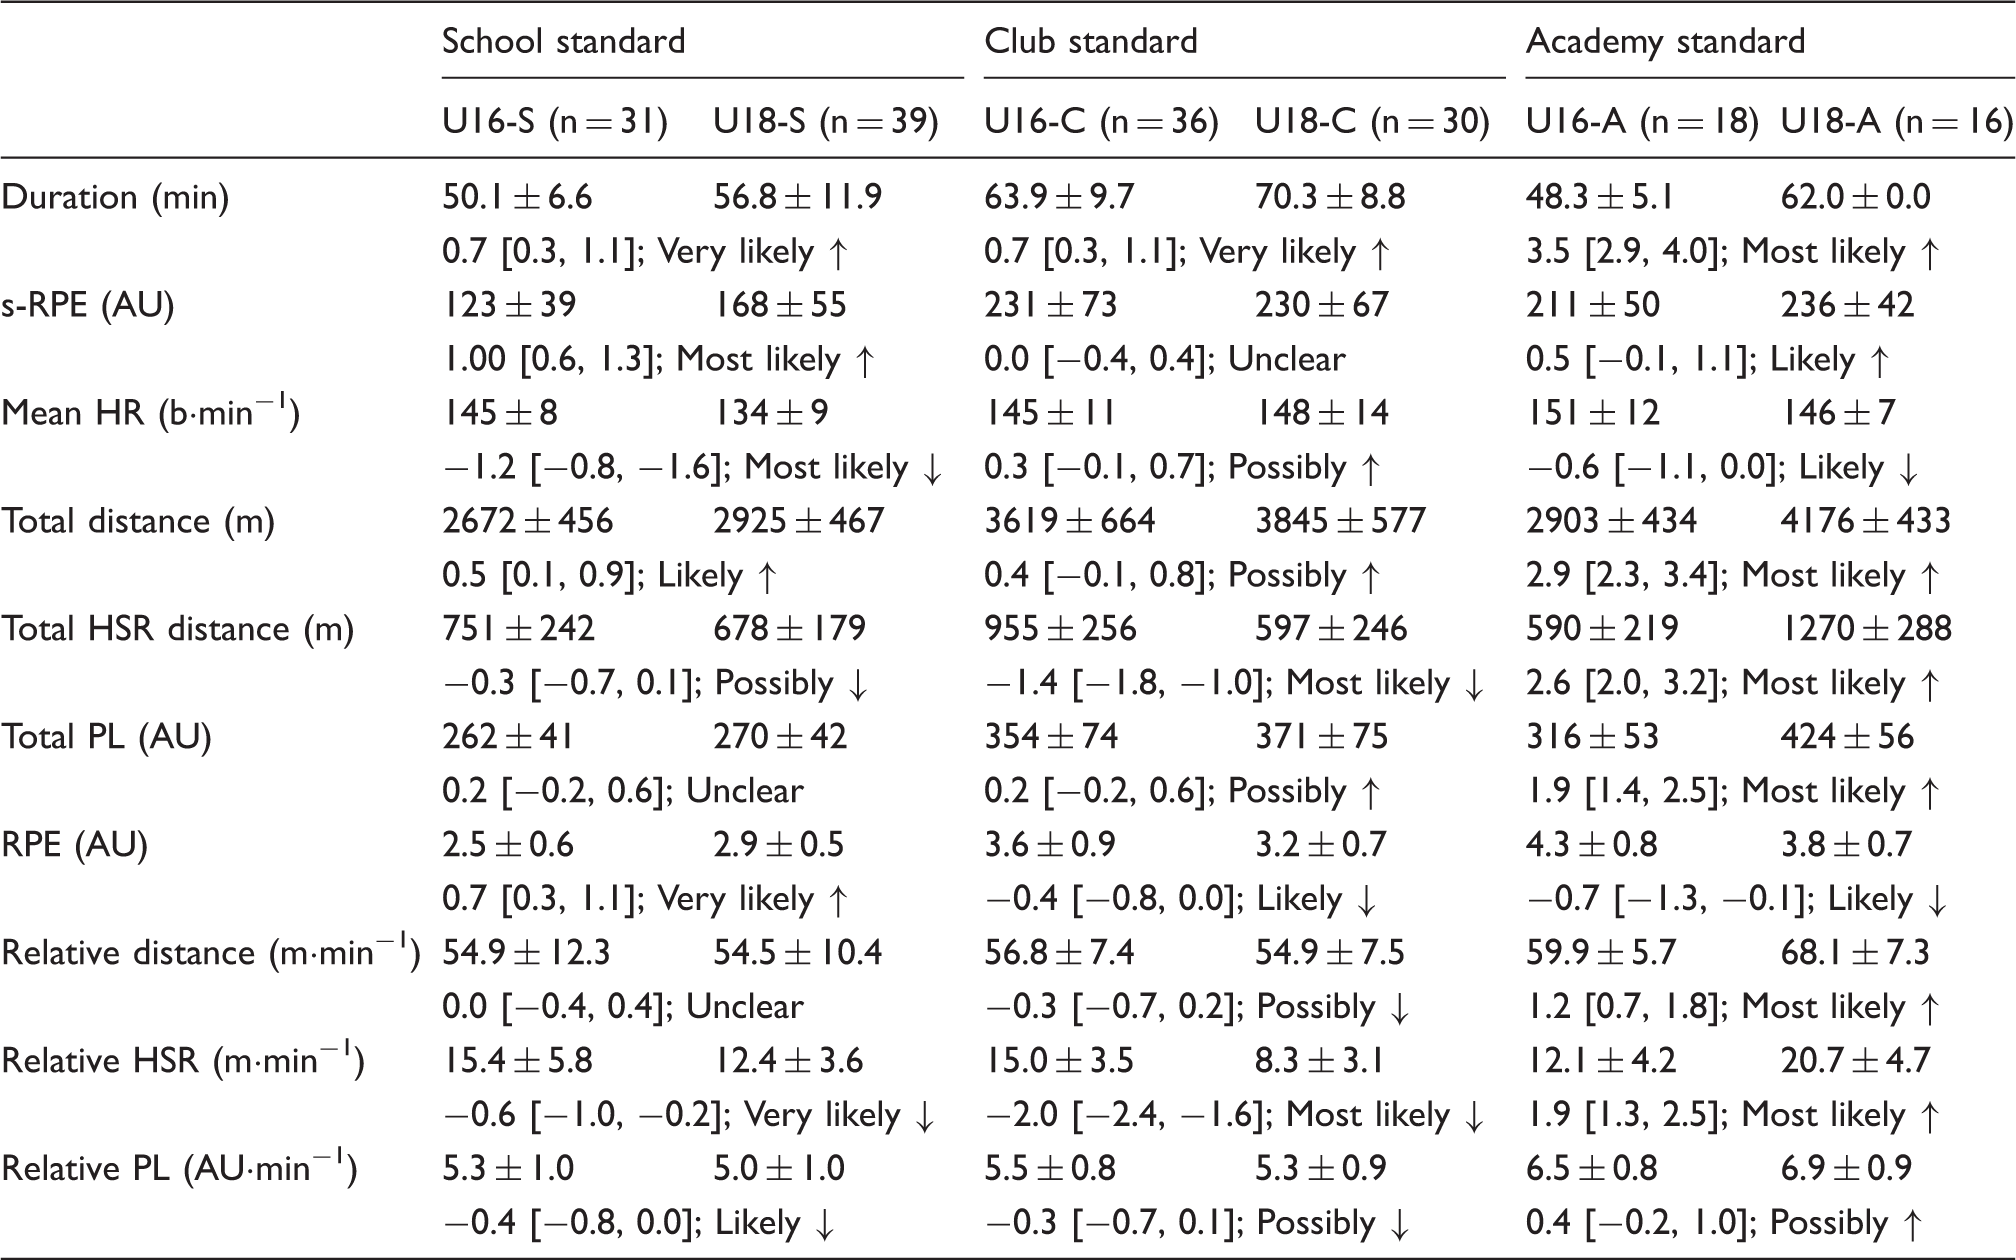
Data are presented as mean ± SD, Cohen’s d effect size [90% confidence intervals]; magnitude-based inference.
Training load and intensity differences between playing standards.
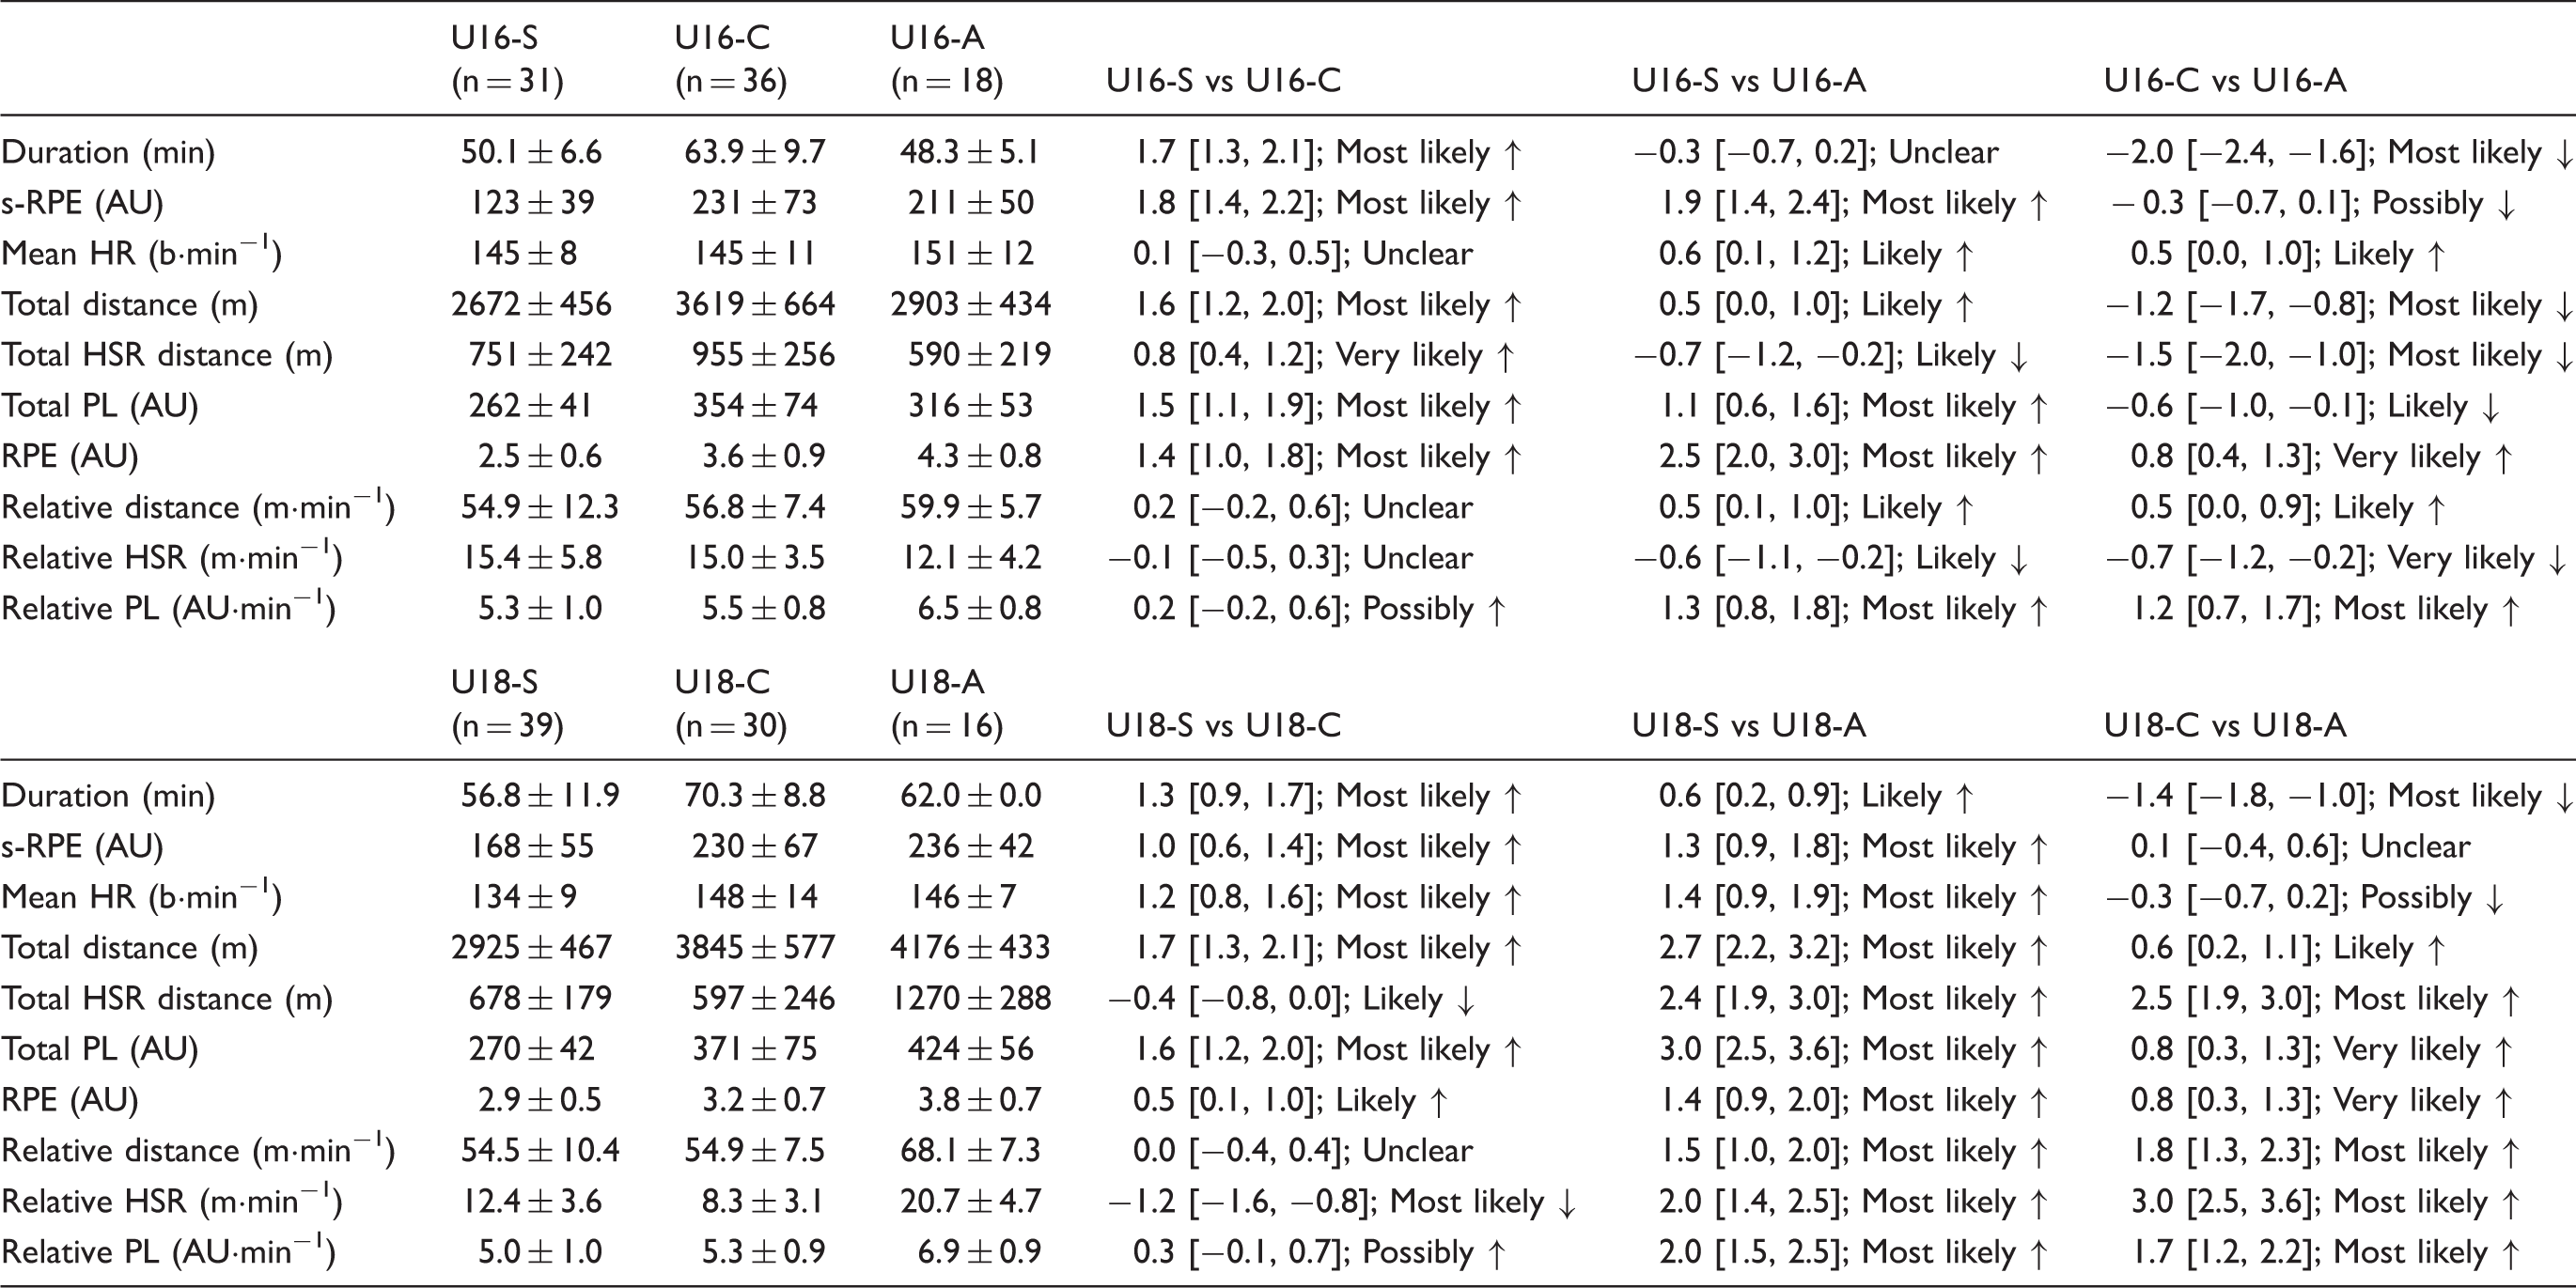
Data are presented as mean ± SD, Cohen’s d effect size [90% confidence intervals]; magnitude-based inference.
Within the school standard, U18-S were likely greater than U16-S for TD (small), very likely greater for training duration (moderate) and RPE (moderate), and most likely greater for s-RPE (moderate). However, U18-S were likely lower than U16-S for relative PL (small), very likely lower for relative HSR (moderate) and most likely lower for HRmean (large).
Within club standard, U18-C were very likely greater than U16-C for training duration (moderate), but likely lower than U16-C for RPE (small) and most likely lower for total and relative HSR (large to very large).
Within the academy standard, U18-A were likely greater than U16-A for s-RPE (small), and most likely greater for training duration (very large), total and relative distance (large to very large), total and relative HSR (large to very large) and total PL (large). Although U18-A were likely lower than U16-A for HRmean (moderate) and RPE (moderate).
Within the U16 age category, U16-C were likely greater than U16-S for total HSR (moderate) and most likely greater for training duration (large), s-RPE (large), TD (large), total PL (large) and RPE (large). U16-A were likely greater than U16-S for HRmean (moderate), TD (small) and relative distance (small) and most likely greater for s-RPE (large), total PL (moderate), RPE (very large) and relative PL (large). However, total and relative HSR were both likely lower (moderate) in the U16-A compared to the U16-S. The U16-A group were likely greater than U16-C for HRmean (small) and relative distance (small), very likely greater for RPE (moderate) and most likely greater for relative PL (large). Although U16-A were likely lower than U16-C for total PL (moderate), very likely lower for relative HSR (moderate) and most likely lower for training duration (very large), TD (large) and total HSR (large).
Within the U18 age category, U18-C were likely greater than U18-S for RPE (small), and most likely greater for training duration (large), s-RPE (moderate), HRmean, TD and total PL (all large). However, U18-C were likely lower than U18-S for total HSR (small) and most likely lower for relative HSR (large). U18-A were likely greater than U18-S for training duration (moderate) and most likely greater for all other measured variables (large to very large). U18-A were likely greater than U18-C for TD (moderate ES), very likely greater for total PL (moderate) and RPE (moderate), and most likely greater for total and relative HSR, relative distance and relative PL, with most likely lower training durations (all very large).
Total distance and percent time at various movement velocity bands during training.
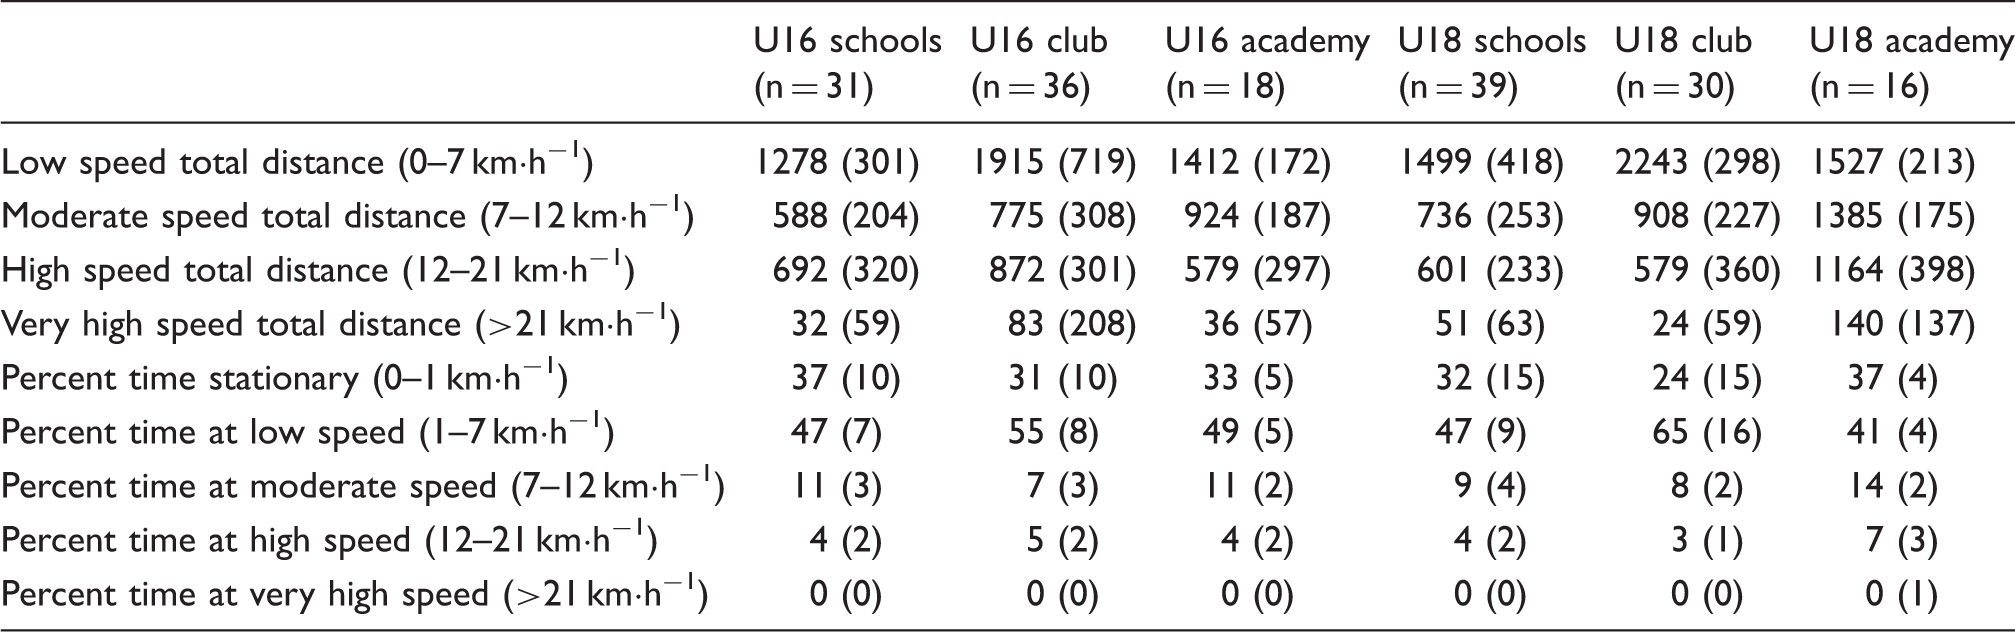
Data are presented as median (interquartile range).
Discussion
This is the first study to quantify and compare the physical outputs of adolescent rugby union players during training by both playing standard and age category. The U18-A group (i.e. highest age and standard) had the greatest s-RPE, TD, HSR and PL, while the U16-S group (i.e. lowest age and standard) had the lowest s-RPE, TD and PL of all groups. There was an increase in session durations (i.e. volume) between U16 and U18 age categories in all playing standards. When standardised for time, training intensities (i.e. RPE, m·min−1 and PL·min−1) were highest in academy groups and lowest in school groups for both respective age categories. The findings of this study suggest that the demands of field-based training sessions increase with age and playing standard in adolescent rugby union players.
Overall, subjective and objective measures of session TL were highest in the U18-A group, which is the highest playing standard and therefore may be expected to elicit the highest training demands. The U16-S and U18-S groups had the lowest subjective and objective measures of session TL in each respective age category. However, when standardised for time, objective measures of session intensity (i.e. m·min−1 and PL·min−1) were similar between school and club groups at both age categories suggesting that the differences in TL are predominantly due to increased session durations in the club groups. Interestingly, the subjective measure of intensity (i.e. RPE) did not follow the trend of the objective measures, but as RPE is an internal load measure it is influenced by individual psychological and physiological characteristics. At the academy standard, there was an increase in session durations between U16 and U18 age categories but also an increase in the objective measures of intensity. Club groups had the lowest weekly training frequencies in both age categories, which may explain the perceived requirement for these groups to have longer session durations. Coaches should aim to prepare players for the specific demands of match-play and not simply increase training volumes due to limited training availability. The intensity of the session may be more important for both physical development and injury prevention,10,17 thus coaches should look to prescribe specific sessions to elicit these positive outcomes. High training volumes may become problematic for players participating with multiple teams simultaneously resulting in excessive weekly workloads. 5
Training session durations increased with age in all three playing standards. This increase in training volume in association with age has also been observed in other adolescent team sports. 18 Optimal TL has been suggested to maximise athletic development whilst minimizing risk of illness and injury when structuring age appropriate training. 27 Adolescent athletes have been suggested to be at the greatest risk of microtrauma during times of peak physical growth. 28 This may partially explain the lesser training volumes in the U16 age category in the present study. Fourteen-year-old team sport athletes are at a different stage of athletic development to 18 year olds, where there would be a greater emphasis on competition and competition-specific training for the older age category. 29 The findings of this study suggest that total TLs were higher in U18 players due to their longer field-based session durations and increased weekly training frequencies.
Training durations in the present study were generally lower than previously reported in adolescent rugby union training (range: 58–93 min), 15 while unfortunately the use of an alternative scale to measure s-RPE in previous research prevents direct comparisons for subjective TLs. However, HRmean measures reported in this study are similar to those previously reported (range: 136–141 b·min−1) suggesting a similar mean physiological intensity of training. 15 The TDs covered during training sessions in the current study are also comparable to previously reported values (range: 2208–3576 m). 15 However, compared to the previously reported training data (range: 38–50 m·min−1), the relative distances covered in the current study are greater for all six groups. 15 These findings suggest that although session durations were lower in the present study, session intensities were higher than previously reported during training in a similar population, resulting in similar external and internal loads.
Of note, the median percent time spent undertaking HSR and VHSR during training was 3–7% and 0%, respectively. Interestingly, at school and club standards, the U16 players were exposed to greater HSR demands than the U18 players, however this finding is reversed in the academy standard. This may be attributed to the academy training programmes approach to improve high intensity running ability alongside increases in body mass. The use of 12 km·h−1 as a threshold for HSR may be considered conservative, however it was selected as a population specific absolute value based on the findings of previous adolescent rugby research. 17 The individual design of training sessions by the coaches will likely influence the HSR demands of field-based sessions, as evident in the current study with HSR distances substantially different between groups. The selection of various training drills and games in sessions allows manipulation of HSR exposure in training by altering pitch dimensions and player numbers.
Similar VHSR values have been reported in a comparison of training and match movement demands in a similar population, where the median time spent above the same threshold was 0% for training and 1.3% for matches. 17 It should be further noted that the previous research investigating the differences in running demands of training in comparison to match play in adolescent rugby union employed two different analysis systems for each condition (i.e. GPS for training and computer-based tracking software for matches), due to restrictions on the use of microtechnology during match play at the time. Future studies are also required to examine the differences in HSR relative to the individual’s maximum sprinting speed (Vmax) to further explore the relative running demands in adolescent rugby union players. The absolute values in the current study may overestimate HSR and VHSR demands for faster players and underestimate demands for slower players. 30
The U18-A group covered the greatest HSR distance, although without relative speed comparisons, it is difficult to distinguish whether this is due to enhanced session design or simply because they are faster athletes. However, adolescent rugby union players across all age categories and playing standards do not appear to be exposed to adequate VHSR in training that have been previously reported in match play. 17 A recent study showed that increases in momentum were greater than increases in Vmax with age for regional academy rugby union players, with greater increases in body mass than speed. 31 The development of Vmax may therefore be inhibited due to the lack of exposure to VHSR in training for young rugby union players. Exposure to VHSR may be easily incorporated into a field-based session following an adequate warm up with the inclusion of one or two 30–40 m maximal sprint efforts. However, caution must be taken by coaches not to overprescribe VHSR as excessive distances at these velocities have also been linked to injury risk. 32
As this study is the first to report measurements of PL in junior rugby union training, no direct comparisons can be made for this variable. The inclusion of PL as a measure of global external load may provide valuable information on the additional non-locomotor demands of rugby union training when used in combination with movement demand variables.21,33 As total external load in rugby union consists of much more than simply movement-based demands, the use of PL and its derivatives provide an insight of the global external load of training inclusive of additional rugby-specific activities such as jumping, tackles, mauls, rucks and scrums.1,4,22 Due to the limited involvement of physical contact and collisions in training compared to match play, low speed activity (LSA) or HSR demands may be increased to compensate for the difference in physiological intensity between training and matches to produce similar loads.
Conclusion
The current study provides important information for coaches working in adolescent rugby union in relation to the TLs of in-season field-based training sessions, specific to each respective age category and playing standard. School and amateur club coaches may want to adopt training practices similar to academy sessions, by focussing on intensity rather than volume, to maximise player development. However, coaches must remain cognisant that if session intensities are increased, training volumes may need to be decreased to avoid excessive accumulated TLs. Due to the limited exposure to full collision-based activity in training and its resultant effect on the reduced physiological intensity of sessions compared to match-play, coaches should consider strategies and behaviours to compensate for this deficit and maximise player involvement, where increasing LSA or HSR may be beneficial. Including small exposures to VHSR during training may assist to improve sprint performance. Finally, as many adolescent rugby players participate with multiple teams concurrently, TLs should be monitored for players who may be undertaking additional training with teams away from the coaches’ supervised environment to help inform appropriate prescription of training to maximise performance and protect the player from injury.
Footnotes
Acknowledgements
The authors would like to thank all of the coaches, parents and players who were involved in the project.
Declaration of Conflicting Interests
The author(s) declared no potential conflicts of interest with respect to the research, authorship, and/or publication of this article.
Funding
The author(s) disclosed receipt of the following financial support for the research, authorship, and/or publication of this article: This research was part funded by Leeds Rugby as part of the Carnegie Adolescent Rugby Research (CARR) project.