
Abstract
Previous studies investigating running distance in high performance soccer have led to contradictory evidence, potentially due to ignoring contextual information during match phases. The present study therefore examined the relationship between running performance and goal scoring in a football match for a standardised score line. In a sample of 302 matches from the first German Bundesliga, the first goal was modelled as a function of the teams’ running performance and team strength using logistic regression. Goodness of fit was assessed by the prediction accuracy of the model utilising cross-validation. The best model showed a mean accuracy of 77%, reflecting a strong relationship between running performance and the probability of scoring the first goal. This relationship was strongest for total running distance compared to high-speed, sprint or in-possession running distance. We propose two different potential mechanisms to explain the relationship between running performance and goal-scoring found in the present study. These are (1) better ability to reach tactical aims or (2) accumulation of fatigue in the opponent. Future studies should build on these results by further examining the relationship between running performance and success using a more granular segmentation of matches.
Introduction
In association football, the distance covered during a match by a team is one of the simplest measures describing the players’ movement. However, although the distance covered is frequently used to characterise players’ load and effort, the relation between running performance and game success remains unclear at present. Several studies investigating the relationship between distance covered and gameplay success show conflicting results whilst using inconsistent methodologies (for an overview, see Lepschy et al. 1 The aim of the present study was to further clarify the influence of distance covered on game success. Insights into this relationship may provide valuable information for decision making during live analyses as well as during post hoc analyses of matches. 2 , 3 Additionally, findings based on correlational studies can be used to design more controlled experimental studies where underlying mechanisms can be tested. 4
The study of physical work in association football has generated important insights on running performances during matches as a function of players’ age, 5 playing position6–8 or physical capabilities9,10 as well as several contextual variables.11–14
In contrast, the relationship between running distances and game performance is much less well understood and results are conflicting with each other. Some correlational studies have reported a positive association between running performance and success or playing level.10,15,16 For example, Modric et al. 16 found a positive correlation between distance covered and the position-specific InStat index, a game performance indicator rating player performance during matches in professional Croatian soccer players. Schauberger and colleagues 17 analysed one season of the German Bundesliga with a Bradley-Terry-model for paired comparisons and concluded that running distance has the largest effect on match success. Thus, there seems to be evidence for a positive relationship between running performance and technical or tactical performance in a soccer match.
However, there are also correlational studies suggesting a negative or no relationship between running and success or playing level. Di Salvo et al. 18 found that teams finishing on high ranks in the English Premier League exhibited lower running distances over the whole season compared to lower-ranked teams. Similarly, Lepschy and colleagues 19 analysed three seasons of the German Bundesliga using an ordered logit regression and found that running distance is not a significant predictor of match success. However, the authors state that the relationship between running performance and success is not fully understood at present and needs to be further examined. Thus, throughout a whole season, running performance seems to be uncorrelated or even negatively correlated with long-term success.
Some authors have claimed that running performance should be differentiated by velocity or ball possession.18,20,21 Hoppe et al. 20 reported that overall running performance did not predict points achieved in a single soccer season, while in-possession running did. Rampinini et al. 22 observed similar results in studying the physical performance profile of Italian Serie A teams with respect to end of season league ranking. However, care should be taken when interpreting these results, as none of the studies normalised in-possession running distance by time in possession. This suggests that a confounding effect of overall possession rates cannot be ruled out.
Mohr et al., 15 however, suggest that high-speed running and sprinting more strongly discriminate between players of different competitive levels. Bradley and Ade 23 suggest that it may be reasonable to attribute special importance to high-speed running for success from a practitioner’s standpoint, while robust support for this hypothesis is missing at present. Taken together, differentiating between total distance, in-possession distance and high-speed distance seems to be warranted for further research to clarify their respective influence on success.
A potential reason for the conflicting results concerning the relationship between running distance and game success might be related to methodological issues regarding the inclusion of contextual information in the analysis. MacKenzie and colleagues 11 elaborate on the importance of contextual information in match analysis research while at the same time pointing out that it is mostly ignored.
Context variables have been shown to influence both running performance and match outcome. Contextual variables are, among others, playing location, 24 opponent team quality, 24 and match status.24,25 For example, teams playing at home show a higher probability to score 26 as well as a higher running performance. 24 While playing location and opponent quality have been included in most predictive match analysis studies,17,19,27 the match status or score line has not received much attention to date. A change in the score line drastically changes the aims of both teams and has been shown to affect numerous gameplay variables. 25 If teams are losing, ball possession rate increases28,29 as well as physical efforts.24,25 Therefore, it seems advisable to divide matches into segments and to statistically control for different score lines. One way to achieve this is to focus the analysis only on the time before the first goal in each match. Lago-Penas and colleagues 30 have shown that the team scoring the first goal is more likely to win the game and even after the first goal scores more goals than the opponent. Accordingly, the first goal in a soccer match seems to have special importance for the outcome of a match and to be valid as a dependent variable for predictive studies. Therefore, in the present study, matches should be only analysed before the first goal and the first goal should be used as a dependent variable.
Furthermore, running performance in ball possession should be scaled according to relative ball possession during the phase under examination. Otherwise, the resulting metric would mainly be influenced by ball possession rates instead of in-possession running performance.
In summary, at present, it is not clear to what extent distance covered during a high-performance soccer match is related to game success. Based on the limitations in the literature described above, as an important premise contextual variables including score line, playing location, team strength, and possession rates should be included in the analysis. The present study, therefore, consisted of a cross-sectional analysis of the relationship between the teams’ running performance and the first goal in a soccer match. Based on studies using match-wise aggregation and finding positive relationships,16,17,31 a positive relationship between running performance and game success was assumed. Based on previous studies we further expected a strong positive relationship between high-speed running and success 23 and between in-possession running and success. 20 , 22
Material and methods
A convenience sample of N = 302 matches from the 1st German Bundesliga during the seasons 2011/2012 to 2016/2017 was used for the analysis. As the first goal was operationalised as a dependent variable, all matches (N = 23) without a single goal were excluded from further analysis. The remaining 279 matches stemmed from 4 distinct seasons (19 matches from 2011/2012, 58 matches from 2012/2013, 45 matches from 2014/2015 and 157 matches from 2016/2017). 24 different teams are represented in the sample, while on average a team was observed in 23 matches (±14 matches).
The (x/y)-coordinates for each player were determined through a semiautomatic optical tracking system (VISTRACK, by Impire Corp., Germany) at a sampling rate of 25 Hz. The validity and reliability of this tracking system have been described previously. 32 The study was approved by the local ethics committee at the German Sport University Cologne (DSHS 093/2017) and fully complies with the guidelines stated in the Declaration of Helsinki. 33
Data collection and data processing
For each match, information about the team and the time of the first goal were determined. The first goal was coded as either home goal or away goal. The distance covered by each player was calculated trigonometrically through Pythagoras rule from the x-y-coordinates in subsequent recording frames. The running velocity for each player was calculated using a finite 3-point difference approach. Subsequently, the team’s total distance covered as well as distance covered in ball, distance covered above 14.4 km · h−1 (high-speed running), 23 and distance covered above 25.2 km·h−1 (sprinting) 23 were calculated, yielding 3 different measures of running performance. As only the running distance before the first goal was analysed, running distance per game was calculated until a team conceded the first goal. Then the whole time interval before the first goal as well as the last 5 minutes and the last 15 minutes before a goal were considered. In this way, 12 parameters of running performance were calculated. Subsequently, the running distance was normalised to minutes played before the first goal to allow comparison between matches (or to the respective time interval of 5 or 15 minutes). For in-possession running distance, values were normalised to time in possession before the first goal, to minimise the influence of relative possession. For each match and each category, the home team’s respective running distance was divided by the away team’s running distance, yielding the ratio of running distances. Additionally, the sum of both teams’ running distances was used to reflect the general physical requirements of a match. These two variables were subsequently used as independent variables.
To account for varying team strengths, home advantage or player availability, historic betting odds for each match outcome were collected. 34 The respective values represent the mean odds across bookmakers. Then the inverse values of the odds were calculated to determine the probability of each match outcome. As the odds contain a bookmaker’s advantage, the sum of the probabilities is larger than 1, so each probability was divided by that sum. 35 Betting odds have been shown to be the best source of information for the prediction of match outcomes and can, therefore, be considered a reliable estimate of pre-game expectations about the teams’ abilities.36,37
Statistics
To examine the relationship between running performance and the first goal in a match, the first goal was modeled depending on running distance and probability of match outcomes. Twelve models were fit, three each for total running distance, in-possession running distance, high-speed running distance, and sprinting distance (one model per time interval considered). Starting from the model term in (1) it was examined whether one of the coefficients could be excluded from the model without information loss. The respective model showing the smallest Akaike Information Criterion (AIC) while revealing no significant difference of deviance compared to the full model in a Chi-squared-test (α = 5%) was chosen for further analysis. AIC provides an estimate of the likelihood of the model given the data observed, while greater values correspond to a lower likelihood.
38
In addition, a null model was fit, containing only the outcome probabilities. This model was also subjected to the above-mentioned examination. The probability of a draw was not included in either model since the number does not provide additional information if the other two probabilities are known.

RDratio = ratio of running distances of the home and away team, RDsum= sum of running distances of both teams, Phome win, Paway win = probability of a home win or an away win.
To check the relevance of running performance as a predictor for the model, Chi-squared Likelihood-Ratio-Tests were conducted to compare the respective model’s deviance with that of the null model. 38 The level of significance was set at α = 5%. As a logistic regression does not allow the calculation of explained variance, the goodness of fit and thus the relationship between variables was described by the model’s prediction accuracy and the area under the curve (AUC) for the receiver operating characteristic curve (ROC curve), as commonly used to assess the predictive accuracy of a classification model.39–41 To assess the model’s generalizability and avoid overfitting, these metrics were calculated using threefold cross-validation. The model was repeatedly fit on two thirds of data points and subsequently its predictions for the remaining data points were evaluated. To evaluate the meaning of the results, the null model’s performance was also measured with this procedure. The difference between the two models’ accuracies then allows a conclusion on how much the running distance improves the predictive ability. The size of each fold was set to 93.
All data processing and analysis were done using the statistical software R 42 with the packages dplyr 43 for data processing, ggplot2 44 for graphical illustration, and caret 45 for performing cross-validation.
Results
First goal of the match
After excluding 23 goalless matches, in 171 out of the 279 matches the home team scored first and in 108 matches the away team scored first. The distribution of first goals over time and by scoring team is illustrated in Figure 1.
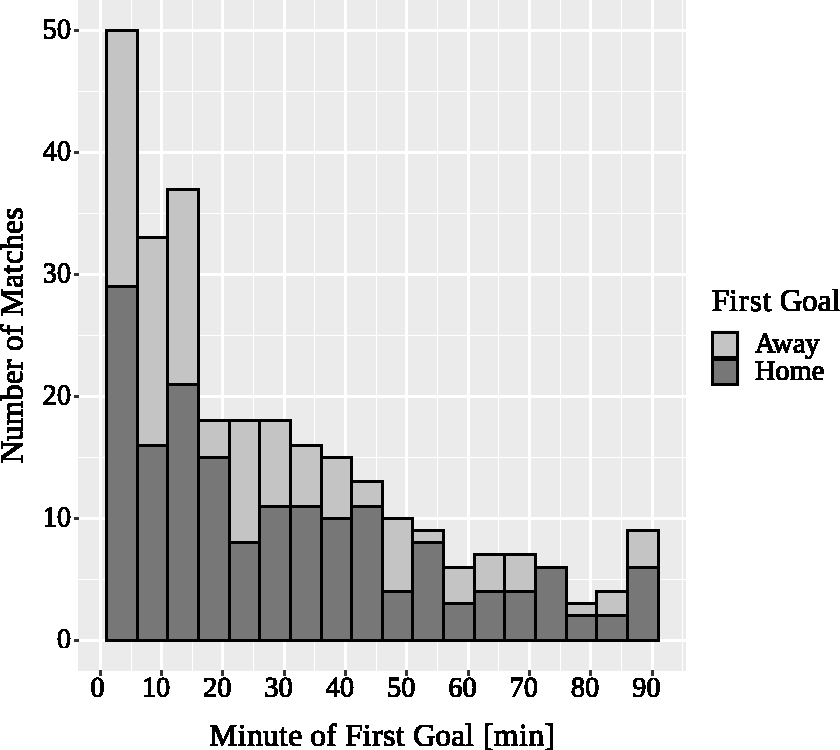
Histogram showing distribution of first respective goals over time in the 279 matches, separated by home team goals and away team goals. Bars represent bins of 10 minutes, including the left boundary.
Covered distance
On average over all teams and all matches a player covered 10501 m for the whole match and 117 m·min−1 before the first goal. Running distances of home and away team by velocity and possession are shown in Table 1. Values represent distances for the whole games, respectively. No normalisation by individual game duration was conducted.
Running distances for whole matches by ball possession and velocity.
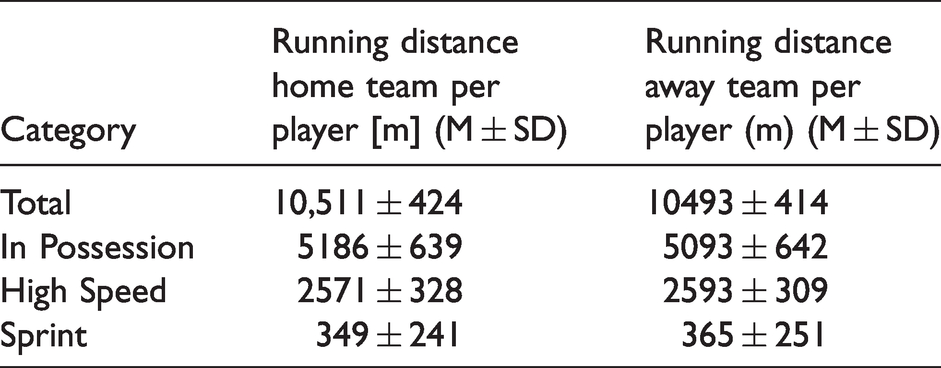
Figure 2 shows running performance of the home and away teams before the first goal of the match for the whole time interval before the first goal. The original straight indicates the theoretical scenarios in which both teams cover the same distance. Thus, points lying above the straight indicate a match where the away team covers more distance than the home team before the first goal and vice versa. In panel A, for total distance covered, many points are located close to the straight, but several dark points (away goal) above the straight and light points (home goal) below the straight can be seen. These indicate scenarios, in which the team covering more distance scored the first goal. In panel C, for high-speed distance, this pattern seems less pronounced and in panel B, for in-possession distance, as well as in panel D, for sprint distance, no such patterns can be observed.
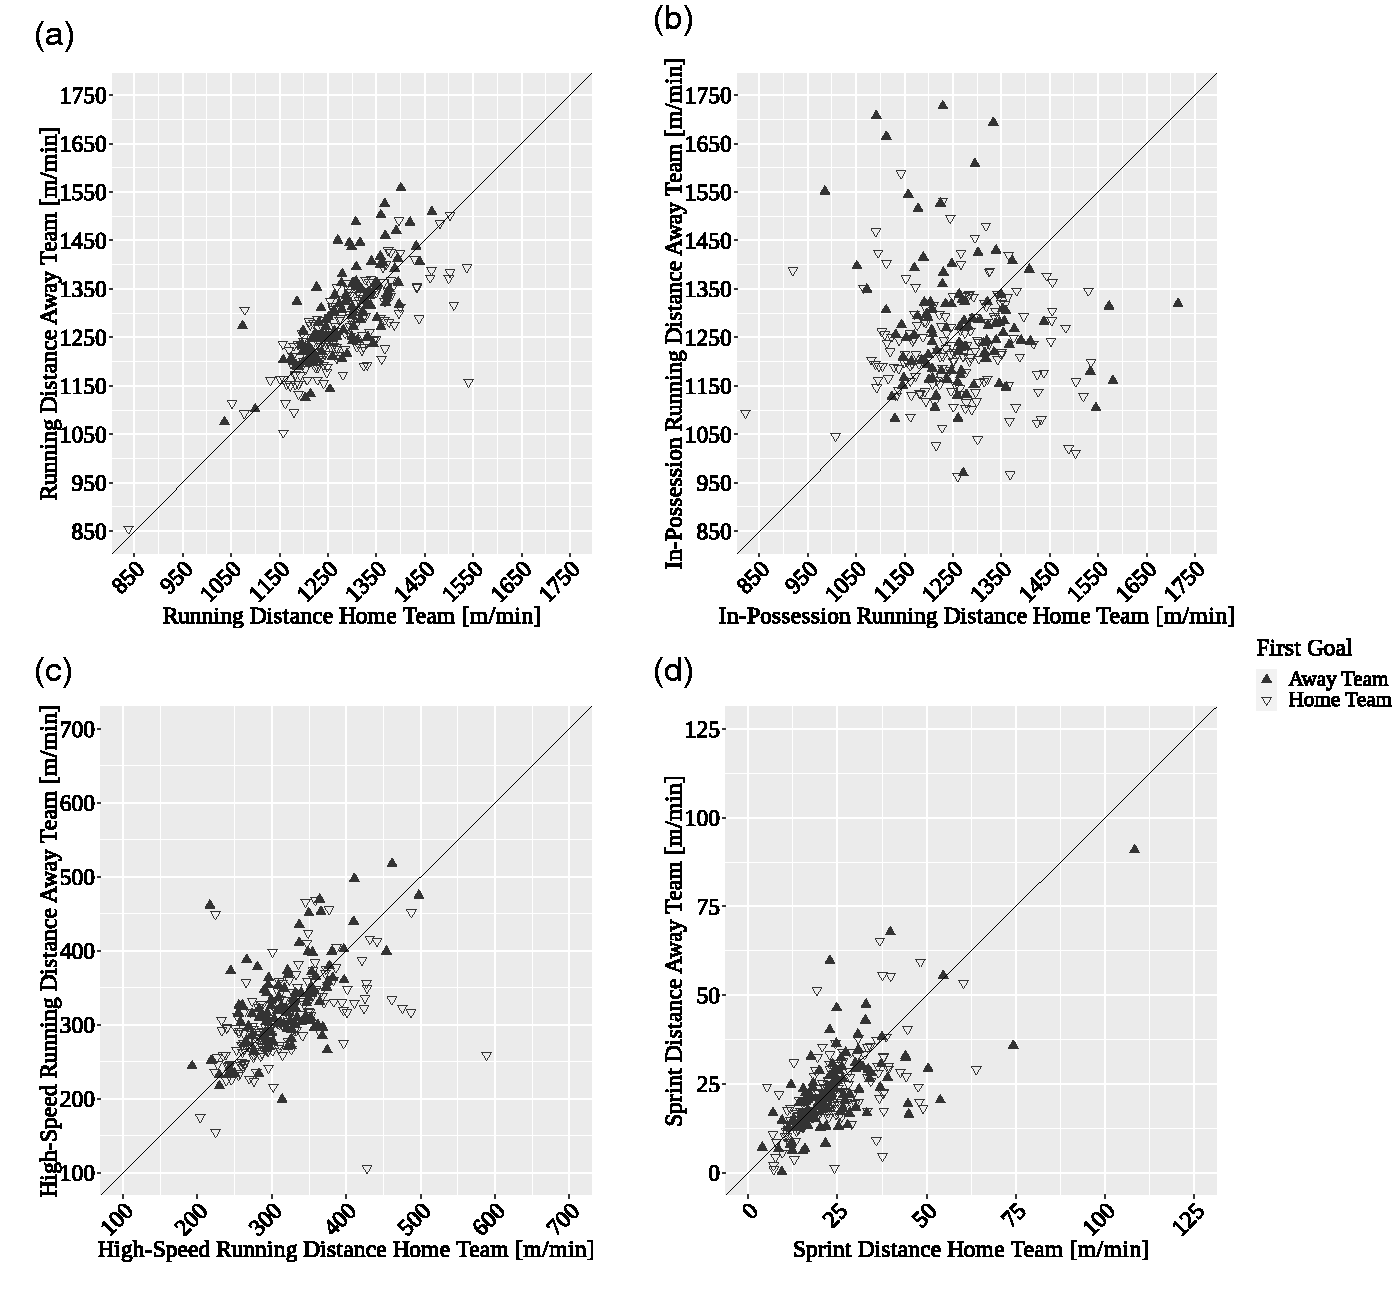
Running Distances of Home Team (x-axis) and Away Team (y-axis). Distances are expressed as meters per minute, normalised for time played until first goal. Each point represents one match. The shape of points indicates which team scored the first goal. The original straight represents all points for both teams running the same distance. A point below the straight means that the home team covered more distance than the away team and a point above the straight means that the away team covered more distance. (a) Total distances covered. (b) Distances covered in possession. (c) Distances covered faster than 14.4 km · h−1. (d) Distances covered faster than 25.2 km · h−1.
Model selection
For the null model, the lowest AIC score (358.4) was achieved by using the probability of home win as the only predictor with the Likelihood-Ratio-Test showing no significant difference to the full model (χ2diff(1) = .34; p = .56).
Therefore, the null model was fit using the binomial variable first goal as a dependent variable and probability of home win as an independent variable. Based on AIC, the twelve models for running distance were fit additionally using ratio of distances covered in the respective running categories.
Model accuracy
Model accuracy for each of the twelve models was assessed using two steps. First, Likelihood-Ratio-Tests were performed to compare the deviances of the respective model with the null model to assess, whether the model explains additional variance compared to the null model. Second, the performance of each model was calculated using threefold cross-validation for calculation of prediction accuracy and the AUC of the ROC curve. These were then compared to the performance of the null model.
Likelihood-Ratio-Tests revealed significant differences for all three models of total running distance (χ2diff(1) = 44.3; p < .001; χ2diff(1) = 92.8; p < .001; χ2diff(1) = 44.9; p < .001), all three models of high-speed running distance (χ2diff(1) = 10.9; p = .001; χ2diff(1) = 36.5; p < .001; χ2diff(1) = 10.6; p = .001), as well as for the model of in-possession running distance in the 5 minutes before the first goal (χ2diff(1) = 6.6; p = .01), but not for the remaining in-possession running parameters or the sprint distance parameters.
For each of the three models a 3-fold cross-validation was conducted, yielding three prediction accuracy scores and three AUC scores for the three respective subsets (with 93 matches in each subset).
The mean and standard deviation for accuracy scores are depicted in Table 2. The highest overall prediction accuracy was reached by the model of total running distance 5 minutes before the first goal, showing an accuracy of 0.77 (±0.04). The null model achieved an average predictive accuracy of 0.61 (±0.01).
Mean and standard deviation of predictive accuracy across three folds of cross-validation for the three models.
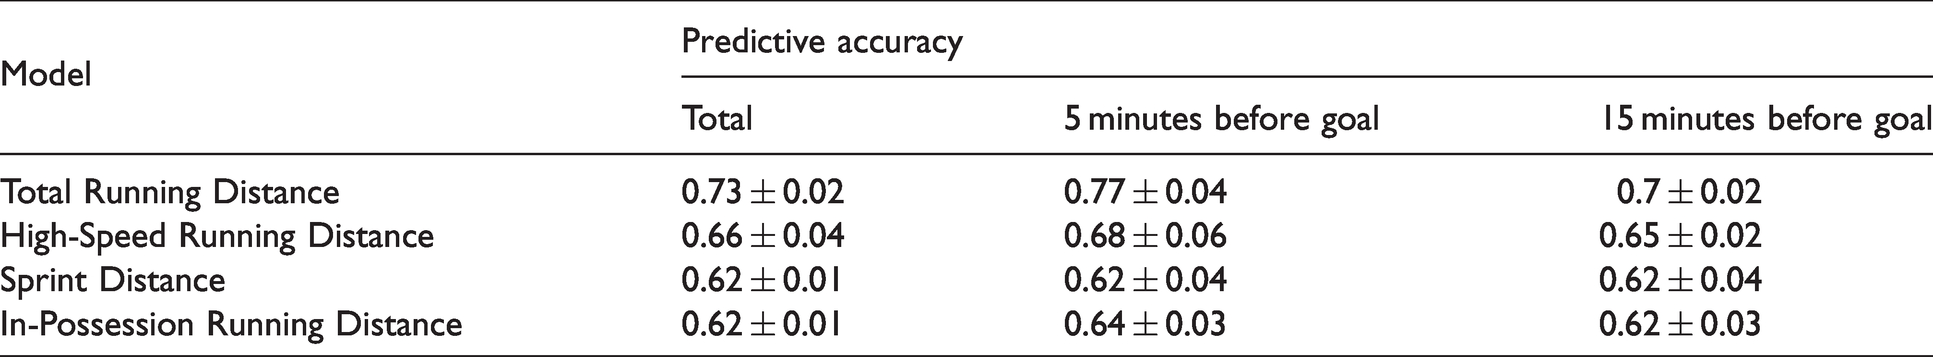
Table 3 shows the correlation matrix of the predictors of the models, i.e. the correlations between team strength and the respective running performance parameter used in the different models. It shows a significant negative correlation between team strength and total distance covered and significant positive correlations between team strength and in-possession distance for the whole time interval and the 15 minutes before the first goal.
Correlation coefficients between team strength and the respective running performance parameters (expressed as the ratio home:away).
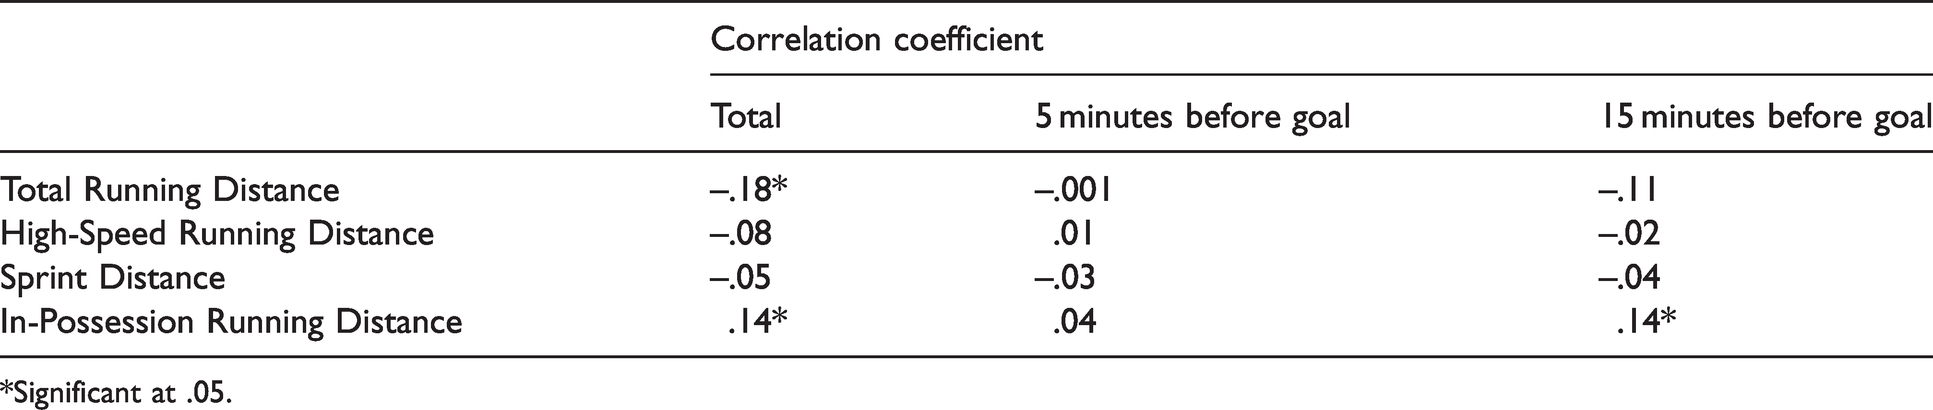
*Significant at .05.
To provide insight into the relationship between predictors and the dependent variable, Figure 3 illustrates how the model predicts goals based on total running distance. The x-axis shows the home team’s running distance and the y-axis shows the away team’s running distance.
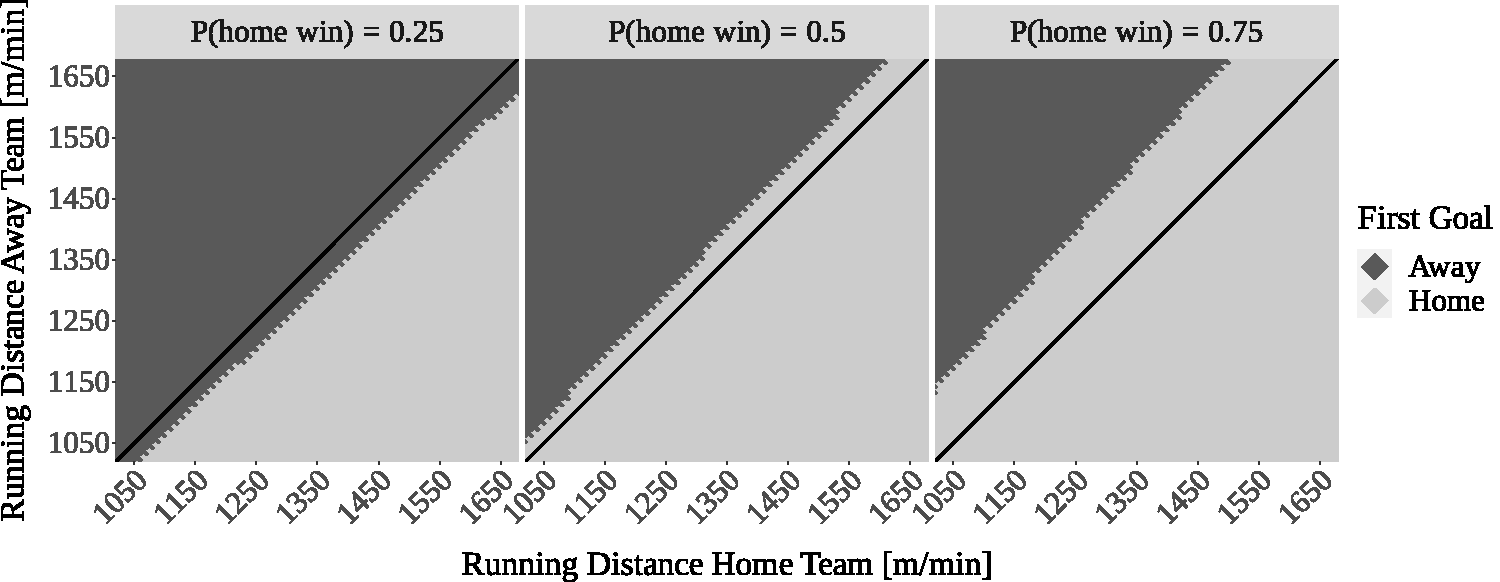
Predictions of the Model. The Running Distances of the two teams are shown. The color of the points indicates which team the model predicts to score for the respective distances. The three panels indicate different team strengths used for prediction.
The black solid line indicates data points for which both teams run the same distance. The predictions of which team scores the first goal are denoted as the color of data points. The three panels of the graph represent the effect of team strength. In general, it can be seen that if one team runs more, this team is more likely to score the first goal. Not surprisingly, the home team’s strength positively affects the probability of a home goal.
Discussion
Previous studies on the relationship between running performance and success in soccer have yielded conflicting results. However, methodological issues may have contributed to these conflicting results as studies typically analysed the data after aggregating over whole matches or seasons averaging out contextual factors describing matches or match phases, most notably the score line. In the present study, matches were analysed only until the first goal of the match, thereby ensuring a standardised score line as well as considering individual team strengths, playing locations, and possession rates. The main findings were: (1) the first goal of a match can be predicted by the teams’ running performance until the first goal with high accuracy, (2) the predictive accuracy was higher for total running distance compared to running at higher velocities or in possession.
For total running distance, in the present study mean distances of 10511 ± 424 m for the home team and 10493 ± 414 m for the away team were observed. This is in line with previous findings for the European leagues6,16,21,46,47 as well as for the 1st German Bundesliga.19,20 High-speed distance, (faster than 14.4 km·h−1) was 2571 ± 328 m for the home team and 2593 ± 309 m for the away team, while sprint distance (faster than 25.2 km·h−1) was 349 ± 241 m for the home team and 365 ± 251 m for the away team in the present study. Both measures are similar to previous results for the English Premier League 6 and for the first Croatian football league. 16 Running performance in possession of the ball was 5186 ± 639 m for the home team and 5093 ± 642 m for the away team in the present study. This is as well in line with the results presented by Hoppe and colleagues 20 on in-possession running in the German Bundesliga.
The results presented here add to the research body addressing the relationship between running performance and game success in soccer. Addressing the existing ambiguity in previous work on the topic, our study was able to corroborate earlier research suggesting a positive relationship between running performance and game success.10,15–17 However, our results do not necessarily contradict those studies suggesting a negative or no relationship, since due to the previously discussed methodological differences a slightly different research question was framed in these investigations, where running performance was compared between teams from different table ranks or leagues.9,20
The prediction accuracy for which team will score the first goal based on running performance was 77% based on the results from cross-validation. Given the statistical nature of association soccer game play, a prediction success rate of 77% can be considered relatively high. Heuer and Rubner 48 quantified the proportion of systematic and random variance in football teams’ results. Calculating the teams’ true strength by this approach, they concluded that the contribution of chance to a team’s accumulated goal difference still remains 30% at the end of a season.
Accordingly, taking into count this rather high level of uncertainty influencing the dependent measure game success, the prediction accuracy of 77% appears quite high, in particular, given that the predictive accuracy is calculated using cross-validation, where first goals are predicted in a sample which has not been used to train the model. This is a common practice in machine learning to avoid overfitting49,50 and raises the importance of the estimated model performance. Based on these results, it appears therefore that the relationship between running performance and probability of scoring the first goal is relatively strong.
Possible mechanisms
A widely recognised problem in team game performance analysis is the lack of a theoretical framework that provides models and testable predictions. 51 At present, there is no theory available explaining how success in team sports arises which makes it difficult to discuss possible mechanisms relating factors like running performance to game play success. Approaching the problem without a theoretical framework, two mechanisms may reasonable to explain the findings, of which either one or both may be responsible.
The first one is related to tactical behavior. According to Gréhaigne and Godbout, 52 tactics describe how players adapt to the opponent team’s behavior, within the framework of a previously defined strategy. Previous research suggests, that a team’s running performance is influenced by the opponent team’s tactical behavior 53 as the distance covered by a team varied with respect to the formation adopted by the opposition team. Rampinini and colleagues 54 found that more distance was covered when playing against higher-ranked opponents compared to playing against lower-ranked opponents. Therefore, covering distance may be needed to reach certain tactical aims and to perform well tactically. This notion is underpinned by the study of Modric and colleagues, 16 where running distance was positively correlated with players’ tactical performance, expressed as a position-specific performance index. Covering more distance than the opponent may therefore lead to a superior tactical performance and consequently to an increase in goal scoring probability.
Second, a physiological mechanism could be responsible due to stronger effects of fatigue in one team compared to the other. Rampinini 54 showed that the running performance between two competing teams was strongly correlated in a major European National League and also in UEFA Champions League matches (r = .62 CI95% [.4; .81]). In the present study, the correlation between the two teams’ distances covered per match was also high with r = .56 CI95% [.43; 67]. Consequently, the teams seem to adapt to their opponent and no large differences are to be expected between the two teams’ running performances. It has been suggested by different authors that soccer teams do not operate at their maximum capacity in terms of physical performance.55–57 If, however, the correlation between two teams’ running performances is broken in certain match phases, this could guide the assumption that in these specific cases, teams do reach their limit in terms of physical capabilities, which would lead to a considerable level of exhaustion. In the present study, for the time before the first goal, the ratio of running distances between home and away team ranges from .85 to 1.61, whereas for the whole match the ratio ranges between .88 and 1.11. For high-speed running, the range is .5 to 4.12 before the first goal and .67 to 1.51 for the whole match. These numbers indicate a stronger uncoupling between the teams’ running performances before the first goal compared to the whole match and might hint at physical exhaustion. This again could lead to impaired technical performance 58 and increase the probability of the opponent scoring. However, it is important to note, that physiological exhaustion can not be pictured using only spatiotemporal data,13,55 so testing the aforementioned hypothesis would require more in-depth monitoring methods.
Importance of velocity and possession
Previous studies suggested a special importance of high/speed or sprint running and in-possession running.15,20 In contrast, the results of the present study showed the opposite relationship, i.e. the highest accuracy in predicting goal scoring (reflecting the strongest association) was shown for total distance covered. While this sounds surprising at first, there may be methodological as well as domain-related explanations for these findings.
In previous studies reporting a strong association between in-possession running and success,20,22 distance covered in possession was not normalised to a team’s time in possession. Therefore, this association might have been simply due a positive effect of ball possession rates.29,59 Thus, it seems reasonable to assume that out-of-possession running, i.e. physical performance in defense, is as important as in-possession running.
Similarly, a weak relationship between high-speed running or sprinting and goal-scoring succes was found in the present study. This might be attributable to statistical reasons, since running performance at higher velocities is subject to a much greater match-to-match variability which complicates modelling60,61 or indicate that even low-speed running is important. In a case study, Fernandez and Bornn 62 showed that Lionel Messi improved his positioning while moving at very low velocities because he did not attract as much attention from the defenders. Accordingly, covering distance would be important, irrespective of velocity. However, an interesting insight is gained from the analysis of different time intervals before the first goal. While considering the last 15 minutes before the first goal led to a decrease in predictive accuracy compared to the whole time interval, looking at the last 5 minutes before the goal yielded the best predictive accuracy in all four running parameters. This suggests that there is a long-term as well as a short-term positive effect of running on goal-scoring probability. For example, the long-term effect could be explained by the exhaustion mechanism discussed above, while the short-term effect might more likely be due to the tactical mechanism.
For further examination of the relationship between running and goal scoring, it could be useful to also consider the tactical purpose of running, as it is done within the framework of the integrated approach by Bradley and Ade. 23 However, this approach requires an enormous amount of manual work and therefore it is not yet applicable for large sample sizes, like the one used in the present study.
To our knowledge, this was the first study to examine the relationship between running performance and goal scoring success considering contextual factors including the score line. The results underscore the importance of physical match performance and highlight the need for training programs which ensure players’ physical capacities meet the physical demands placed on them by their opponents. The results therefore may also aid match analysts in offering a potential explanation for results achieved by a team. Practical implications can be derived in the sense that professional teams should focus on improving the players’ physical capabilities as much as needed to cope with match demands. If suitable for the general tactical framework of a team, it could also be advisable to adopt a physically demanding playing style in the beginning of the match, since this was shown to increase a team’s goal-scoring probability.
As every research endeavor, the presented study bears some limitations that have to be considered in the interpretation of results. First, no direct knowledge regarding the tactical aims of the teams was available. Different strategies could have promoted a more or less pronounced physical performance and therefore act as a confounder. However, based on the sample size it is safe to assume that those effects might have averaged out. Next, due to goals occurring sooner or later during a match, the sequences under examination were of different length, which could have affected the results. By normalising the distance covered with respect to the time played, we addressed this limitation. Additionally, excluding matches with early or late goals did not substantially change the results. Lastly, the sequences before the first goal can still be quite long and include multiple changes of possession. Further research should therefore use an even more granular segmentation of the match, e.g. individual attacks, to look into the relationship between running and game success in more detail.
Footnotes
Acknowledgements
We would like to thank the players participating in the study.
Declaration of conflicting interests
The author(s) declared no potential conflicts of interest with respect to the research, authorship, and/or publication of this article.
Funding
The author(s) received no financial support for the research, authorship, and/or publication of this article.