
Abstract
There are two techniques for a lateral sprint start: crossover (CS) and jab step (JS) starts. This study aimed to elucidate the difference in the CS and JS starts in terms of sprint performance and leg kinetics in athletes from ball-and-goal type sports (e.g. soccer and handball). Nineteen male athletes performed CS and JS starts, during which their motion and the force they applied to the ground were simultaneously recorded using a motion-capture system and two force platforms. The results showed that, although 5-m time via video analysis did not differ between CS and JS starts, forward velocity of centre of gravity (CG) and normalised average horizontal external power were greater for the JS start than the CS start. From waveform analysis, greater positive joint power in the sagittal plane leading to greater positive work in the JS start were found in the first three quarters of the push-off phase for rear hip extension and in the subsequent push-off phase for rear ankle plantar flexion. In conclusion, the results suggest that the JS start is superior to the CS start for start quickness, though the gains in the start did not appear to transfer to the 5-m performance. Moreover, greater positive joint power in the first three quarters of the push-off phase for the rear hip extension and in the subsequent push-off phase for the rear ankle plantar flexion were considered to be important contributing factors to the better performance of the JS start.
Introduction
The ability to rapidly accelerate the body from a stationary standing posture is an important factor in increasing the chance of scoring or passing an opponent in ball-and-goal type sports (e.g. football [soccer], handball, etc.). Sprint start manoeuvres from standing can be categorized into a number of types. At the initial posture, there are front-on and side-on positions relative to the running direction, crouched and upright postures, and split and parallel foot positions. 1 With regard to the initial leg movement, there are backward step and non-backward step starts from the front-on position, 2 and crossover (CS) and jab step (JS) starts from the side-on position. 3 The CS start is performed by the athlete initially pivoting on the grounded front foot, producing propulsive force by the rear leg and then applying propulsive force with the front leg while crossing the rear leg over the front leg directly toward the running direction in front of the body. In contrast, the JS start is performed by the athlete initially briefly elevating his/her front foot off the ground while producing propulsive force with his/her rear leg and then placing his/her front foot back on the ground before the rear leg crosses over the front leg toward the running direction.
Investigations of the differences during sprint start performance between the initial movements from the front-on position have revealed that an initial backward step could lead to better sprint start performance (times for 2.5 to 10-m and acceleration during push-off phase at the start).1,2,4,5 Moreover, an initial backward step resulted in greater propulsive force and power during the push-off phase at the start.2,4 While differences in sprint performance (times for >7.3 m, not focused on short distance) between the initial movements from side-on position have been investigated,6–8 only one study has explored the differences in sprint start performance and underlying mechanical factors between the CS and JS starts. 3 In a situation involving a base stealing start using baseball players, a JS start produced greater normalised average horizontal external power, average anteroposterior force exerted by the left leg, and forward velocities of the whole body centre of gravity (CG) generated by both legs and the left (rear) leg than CS. 3 Moreover, the positive work done by hip extension during the left leg push-off was two-times greater for the JS start than the CS start. The authors concluded that the JS start may be the better technique for a base stealing (lateral) start and that the greater positive work produced by left hip extension probably leads to the generation of a larger propulsive force.
Although Miyanishi et al. 3 provided useful knowledge regarding the performance and kinetic difference between CS and JS starts, it is not yet known whether the knowledge gained from baseball players can be applied to specialists in other sports. Clarifying the difference in sprint start performance and underlying joint kinetics between CS and JS starts would be valuable to athletes and their coaches who are trying to improve the ability to cover a short distance in the least possible time in other ball-and-goal sports. Recently, waveform analysis using statistical parametric mapping (SPM) was applied to investigate the factors determining better sprint start technique in terms of ground reaction force (GRF).9–11 Using an SPM analysis could deepen understanding of the difference in leg joint kinetics between CS and JS starts and be useful for providing specific advice for improving sprint start from the side-on position. Therefore, the purpose of this study was to elucidate the difference in CS and JS lateral starts in terms of sprint performance and leg kinetics in ball-and-goal type sports athletes. We hypothesised that (1) the JS start would result in better start performance (time to 5 m) than the CS start, and that (2) the greater work done at the rear leg hip in the JS start would lead to the better sprint start performance.
Methods
Participants
Nineteen healthy male collegiate athletes (mean ± SD: age, 20.1 ± 1.2 years; stature, 1.74 ± 0.07 m; body mass, 66.6 ± 5.6 kg; years of practice, 10.7 ± 4.4 years) participated in this study. Twelve were from football and seven were from handball. All participants were free from injury. Written informed consent was obtained after explaining the aims, risks of involvement and experimental protocols of this study, which had been approved by the institutional research ethics committee.
Experiment
When comparing the sprint start techniques, it was expected that leg dominance would affect sprint start performance. 12 Thus, leg dominance was established before the main experiment: participants were asked to adopt a natural crouched standing position with one leg behind, and the rear leg was defined as the dominant leg. Through this identification process, 14 were right leg dominant and five were left leg dominant. The dominant leg was always the rear leg for the initial position of the sprint start in the main experiment.
After warming-up, the participants, wearing the same gym shoes (12KT-34201, Mizuno, Tokyo, Japan), performed three 5-m maximal-effort sprints for each of the two start techniques in a randomised order. The rest period between the trials was 3–5 min. Before the trials, the participants performed CS and JS until they were familiarized with both start techniques. Retro-reflective markers (14 mm diameter) were attached to 43 body and shoe landmarks, as identified by Miyanishi et al. 3 Each trial was initiated from a static crouched starting position, with each foot on a separate force platform and the two legs supporting approximately equal proportions of body weight. The participants were instructed to react immediately to the start signal and sprint as fast as possible to the 5-m mark. A start signal was presented using an LED light (PH-101, DKH, Tokyo, Japan), which was connected to the operating computer and located to the front right of the participant's initial position (3 m away from the participant) (Figure 1).
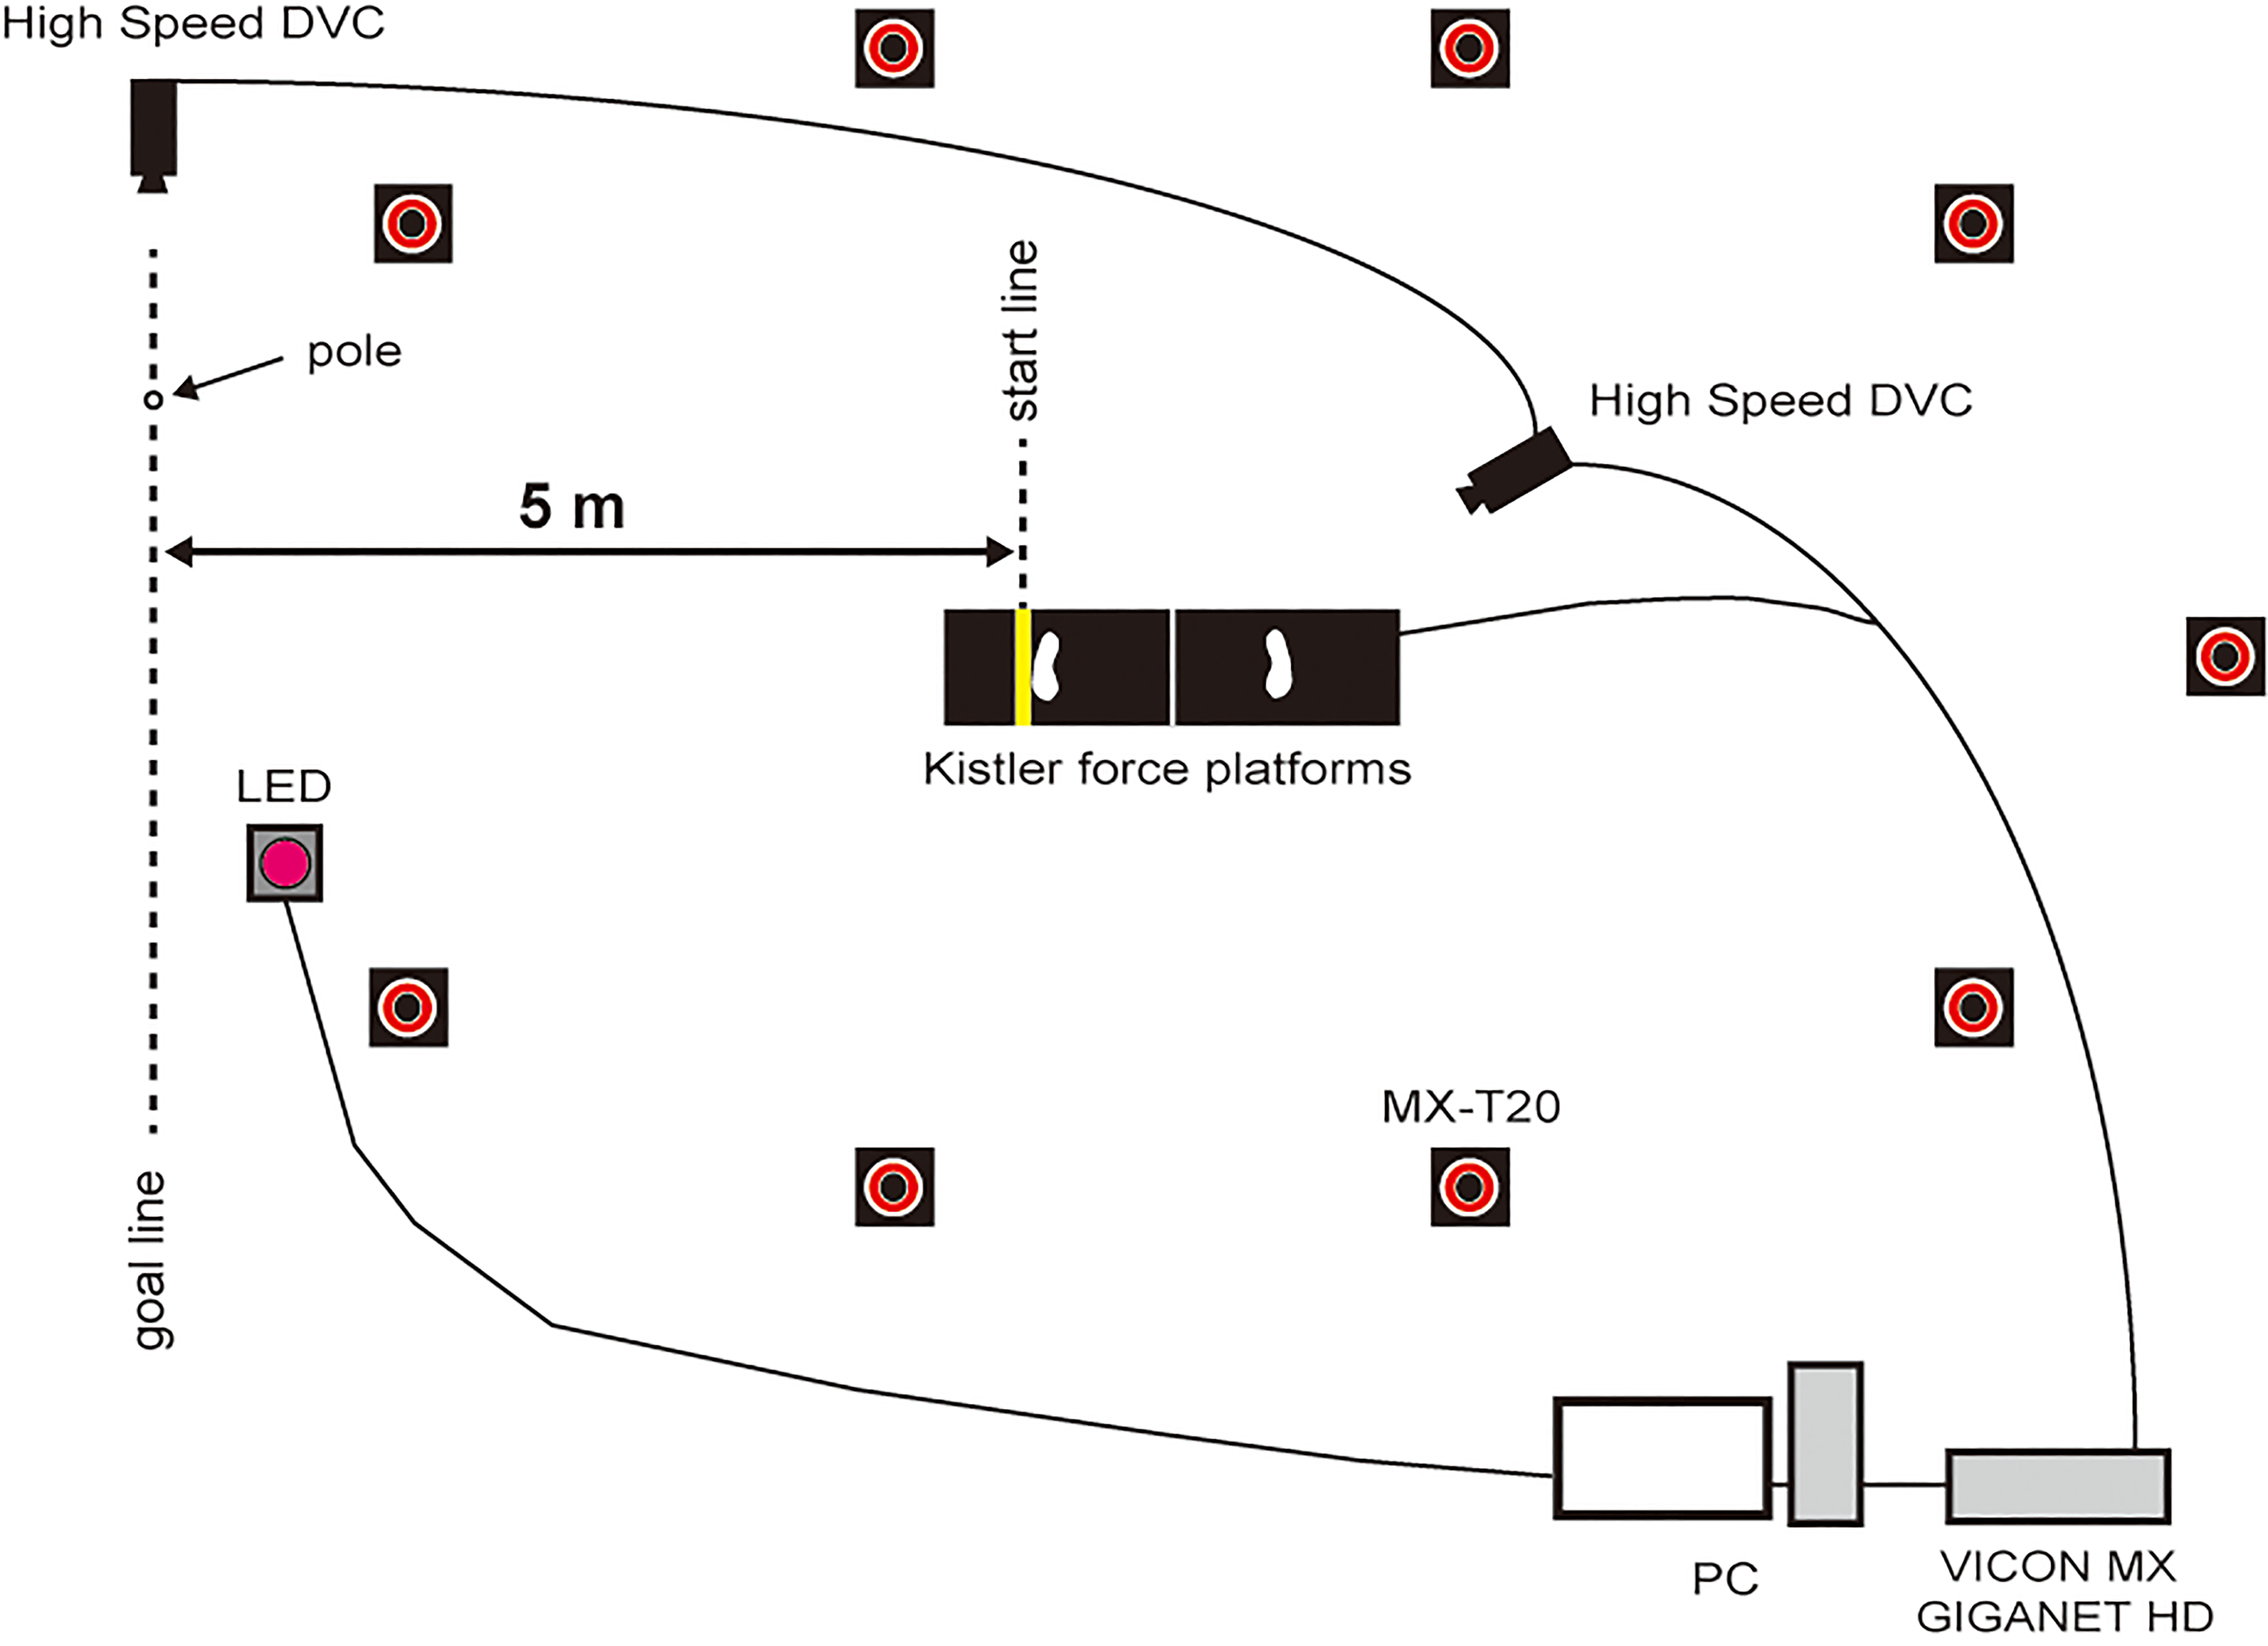
Schematic diagram of the experiment.
The experimental set-up consisted of a three-dimensional motion capture system (nine MX-T20 cameras, Vicon Motion Systems, Oxford, UK; 250 Hz) for capturing sprinting motion and two force platforms (9287B, Kistler, Winterthur, Switzerland; 1000 Hz) for measuring GRF separately for each leg in an indoor experimental site (as in Miyanishi et al. 3 ) (Figure 1). The global coordinate system was defined with the Y axis being the horizontal direction of running, the X axis being horizontal and perpendicular to the Y axis, and the Z axis pointing vertically upwards.
A high-speed camera (Phantom V311, Vision Research, Wayne, New Jersey, USA), located to the right side of the 5-m mark, was used to measure 5-m sprint time. The time taken from the start signal to the instant when a marker on the participant's right hip reached the 5-m mark, detected using the high-speed video image, was used as the 5-m time. The best trial for each start technique was selected for subsequent data processing and analysis.
Data processing and analysis
Data processing of marker coordinates and GRF was performed using the same method as Miyanishi et al. 3 Briefly, segment endpoints were calculated in accordance with a 16-segment body model consisting of the head, a three part-trunk (divided into upper, middle, and lower parts), upper arms, forearms, hands, thighs, shanks, and feet. 13 The endpoint coordinates were smoothed and differentiated using a fifth-order spline function 14 with the cut-off frequencies ranging from 7.5 to 15 Hz. The cut-off frequencies were determined using the residual analysis. 15 The GRF were filtered with a fifth-order spline function at a cut-off frequency of 40 Hz. The CG position and inertial properties for each segment were estimated from the standing height and body mass of each participant using de Leva's 13 adjustments of the values reported by Zatsiorsky et al. 16 In accordance with the method detailed in Miyanishi et al., 3 a rigid segment-link model and Newton-Euler's equations of motion were used to calculate the joint angular velocities and torques. 17 After transformation of joint torques and angular velocities at joints from the global reference frame into local reference frames, joint powers were computed as the products of joint torques and angular velocities. The absolute, positive and negative work done at the joints during each phase of the sprint start were obtained by integration of the respective joint powers over time. 17 The terms of the positive and negative powers indicate the concentric and eccentric muscle contractions, respectively.
The initiation of start motion (ISM) was detected as an instant when the propulsive (Y-direction) force exceeded 10 N. The reaction time was determined as a duration from the start signal to ISM. The instants of first take off of the front leg (FLOF1, only appearing in JS start), second take-off of the front leg (FLOF2), and take-off of the rear leg (RLOF) were determined respectively from the instants when the net GRF for that leg fell below 20 N. The instant of front leg landing (FLON, only appearing in JS start) was determined from the instant when the net GRF rose above 20 N. In this study, the entire start motion (bilateral push-off phase, from ISM to FTOF2) was divided into the rear leg push-off phase, from FTSD to RTOF, and front leg push-off phase, from RTOF to FTOF2 (Figure 2).
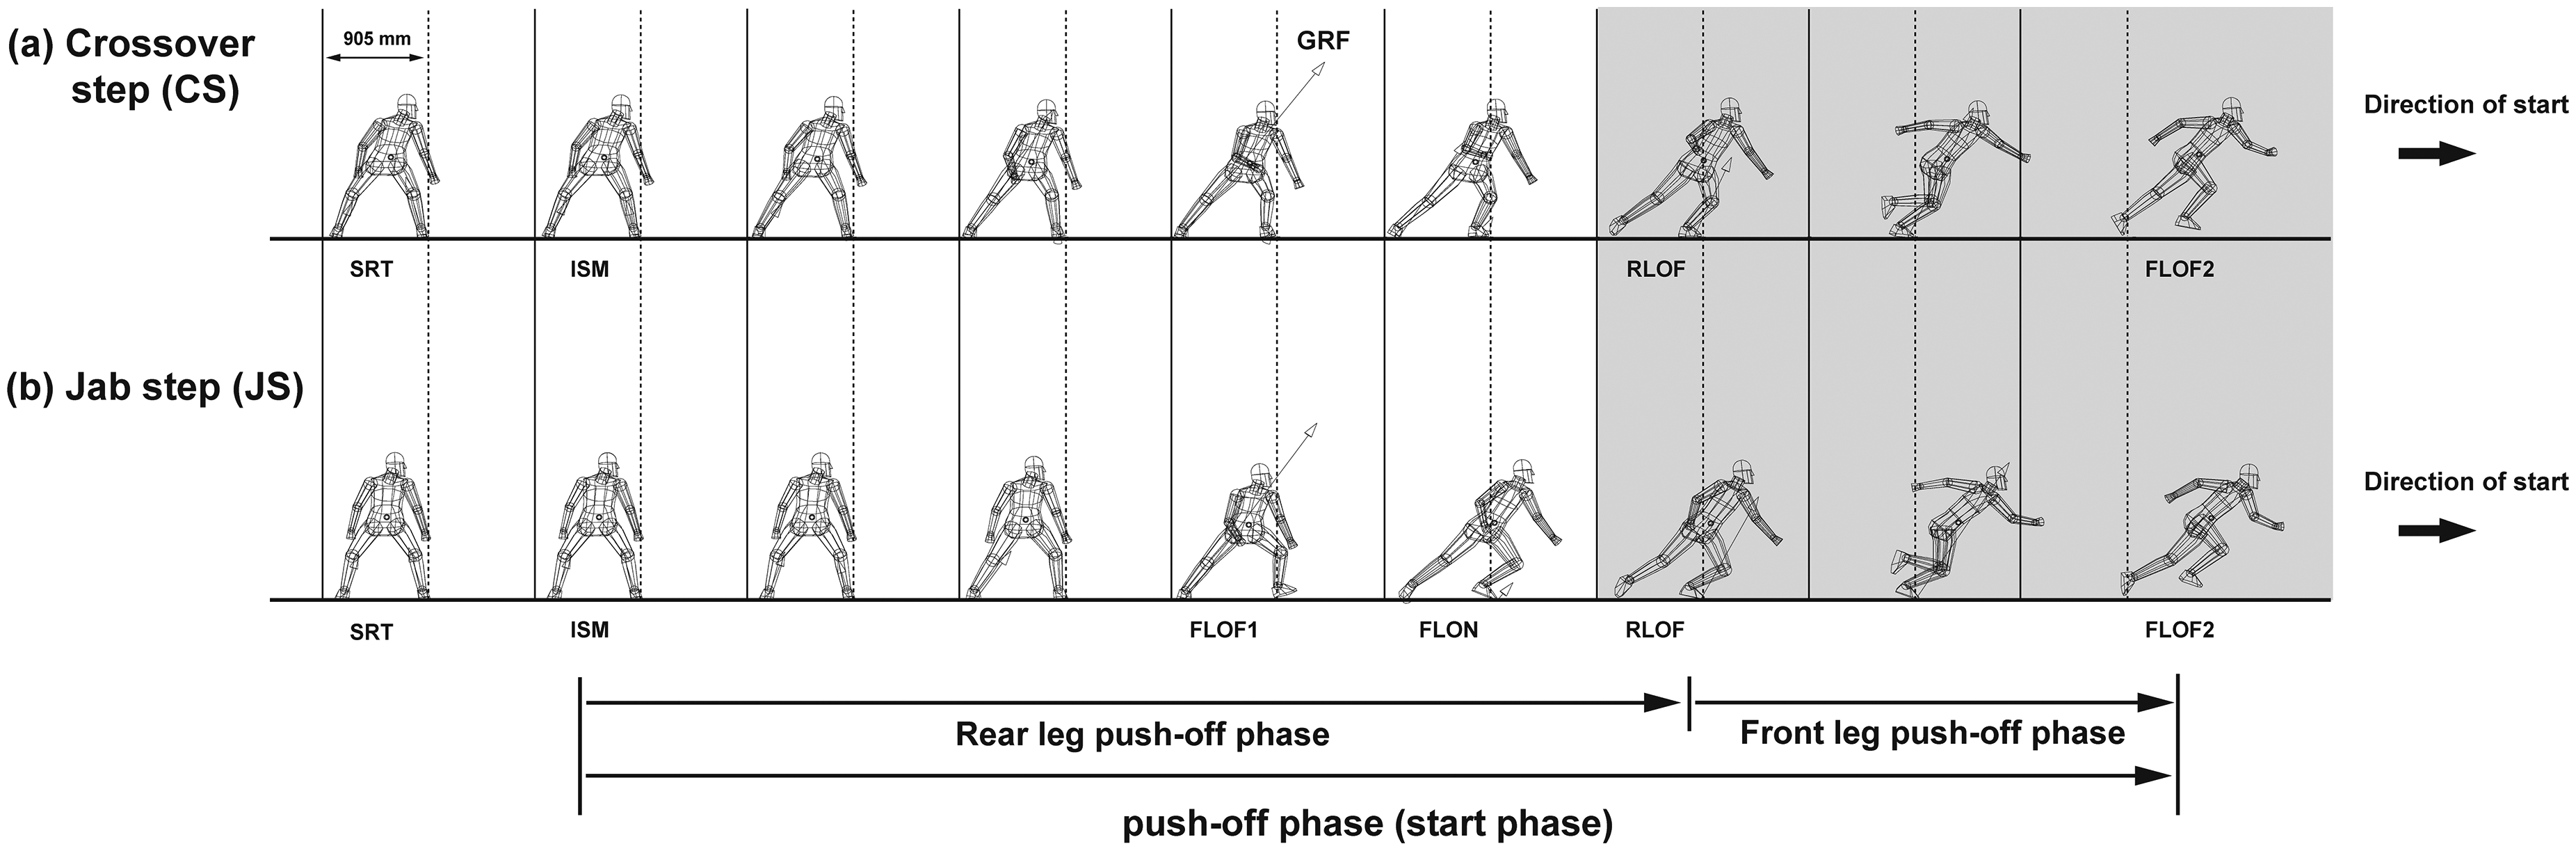
Sequences of the (a) crossover and (b) jab step start techniques using wireframe graphics, and the definitions of phases. SRT: Start (the instant when LED turns on). ISM: Initiation of start motion. FLOF1: 1st front leg take-off. FLON: Front leg landing. RLOF: Rear leg take-off. FLOF2: 2nd front leg take-off. The instants of FLOF1 and FLON do not exist in the crossover step technique. The athlete is facing away from the reader. The arrows indicate the ground reaction force (GRF) vectors acting on the feet.
The forward velocity of CG was calculated through single integration over time of anteroposterior acceleration, which was deduced from the anteroposterior GRF. The average vertical and anteroposterior forces during the respective push-off phases were computed from the vertical and anteroposterior forces, respectively. Moreover, normalised average horizontal external power was calculated from anteroposterior force in accordance with previous studies.18,19 All kinetic values, except for normalised average horizontal external power, were divided by body mass.
Statistical analysis
Means and standard deviations were calculated for all variables. Two-tailed paired t-tests were used to examine the difference in variables between the two start techniques. Statistical significance level was set at 0.05. Moreover, unbiased Cohen's d (Hedge's g) was computed as a measure of effect size (ES). 20 Threshold values for the interpretation of the ES were g < 0.2 (trivial), 0.2 ≤ g < 0.6 (small), 0.6 ≤ g < 1.2 (moderate), and 1.2 ≤ g (large) in reference to a previous study. 21 To compare the leg joint power profiles between the CS and JS starts, a SPM one-dimensional two-sample t-test was used.10,22,23 For the SPM analysis, joint power signals at each joint for the CS and JS starts were temporally normalised from 0% to 100% of the push-off phase for use in generating an SPM{t} curve. Random field theory was adopted to set a critical threshold (α = 0.05). If the SPM{t} curve was greater than the critical threshold, joint power was deemed to be significantly different between CS and JS starts at these specific nodes. 23
Results
While the 5-m time did not differ between CS and JS starts, normalised average horizontal external power (moderate ES), average anteroposterior force exerted by rear legs (moderate ES), average vertical force exerted by rear leg (moderate ES), and forward velocity of CG generated by both legs (moderate ES) and rear leg (large ES) were greater for the JS start than for the CS start (Table 1). In contrast, average anteroposterior force exerted by front leg (small ES) and average vertical force exerted by front leg (moderate ES) in the CS start were greater than those in the JS start. Hereafter, only the results for rear leg variables during the rear leg push-off phase will be presented, since the rear leg showed significantly moderate or large differences in horizontal force and velocity variables, while the front leg showed non-significant or significantly small differences in the corresponding variables.
5-m Sprint time, phase durations, average propulsive force, average vertical force, forward velocity of CG, and normalised average horizontal external power in the crossover and jab step starts. Forces have been normalised to body mass.
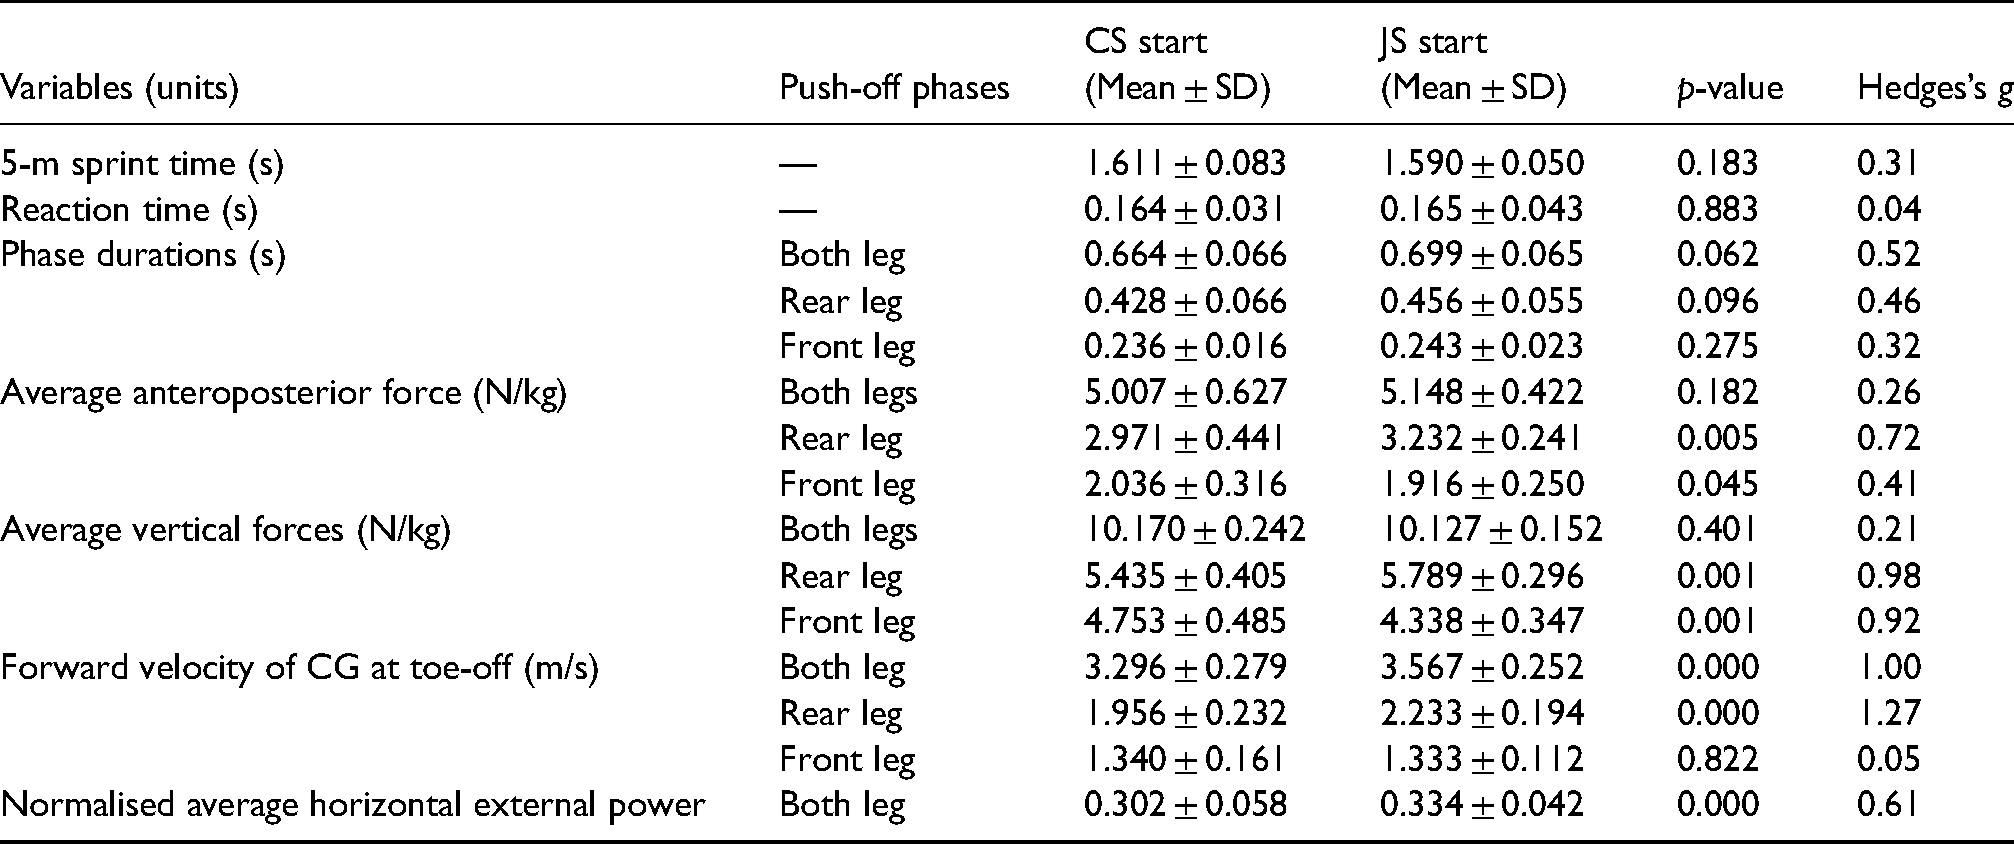
Table 2 shows the positive and negative work done at the rear leg hip, knee and ankle joints during the rear leg push-off phase. Positive work at the hip in the sagittal and coronal planes (large ES), and at the ankle in the sagittal and transverse planes (moderate and large ES), and negative work at the knee in all planes (moderate or large ES), and at the ankle in the sagittal and transverse planes (moderate and small ES) was significantly higher for the JS start than for the CS start, whereas the rest of variables did not show significant differences. Hereafter, only the results for positive work at the hip in the sagittal and coronal planes and at the ankle in the sagittal plane and negative work at the knee in the coronal plane and at the ankle in the sagittal and transverse planes will be mentioned, because the magnitude of the difference in other variables where there was statistical significance was trivial (<0.1 J/kg).
Positive and negative work at the hip, knee, and ankle joints during the rear leg push-off phase in the crossover and jab step starts. Values have been normalised to body mass.
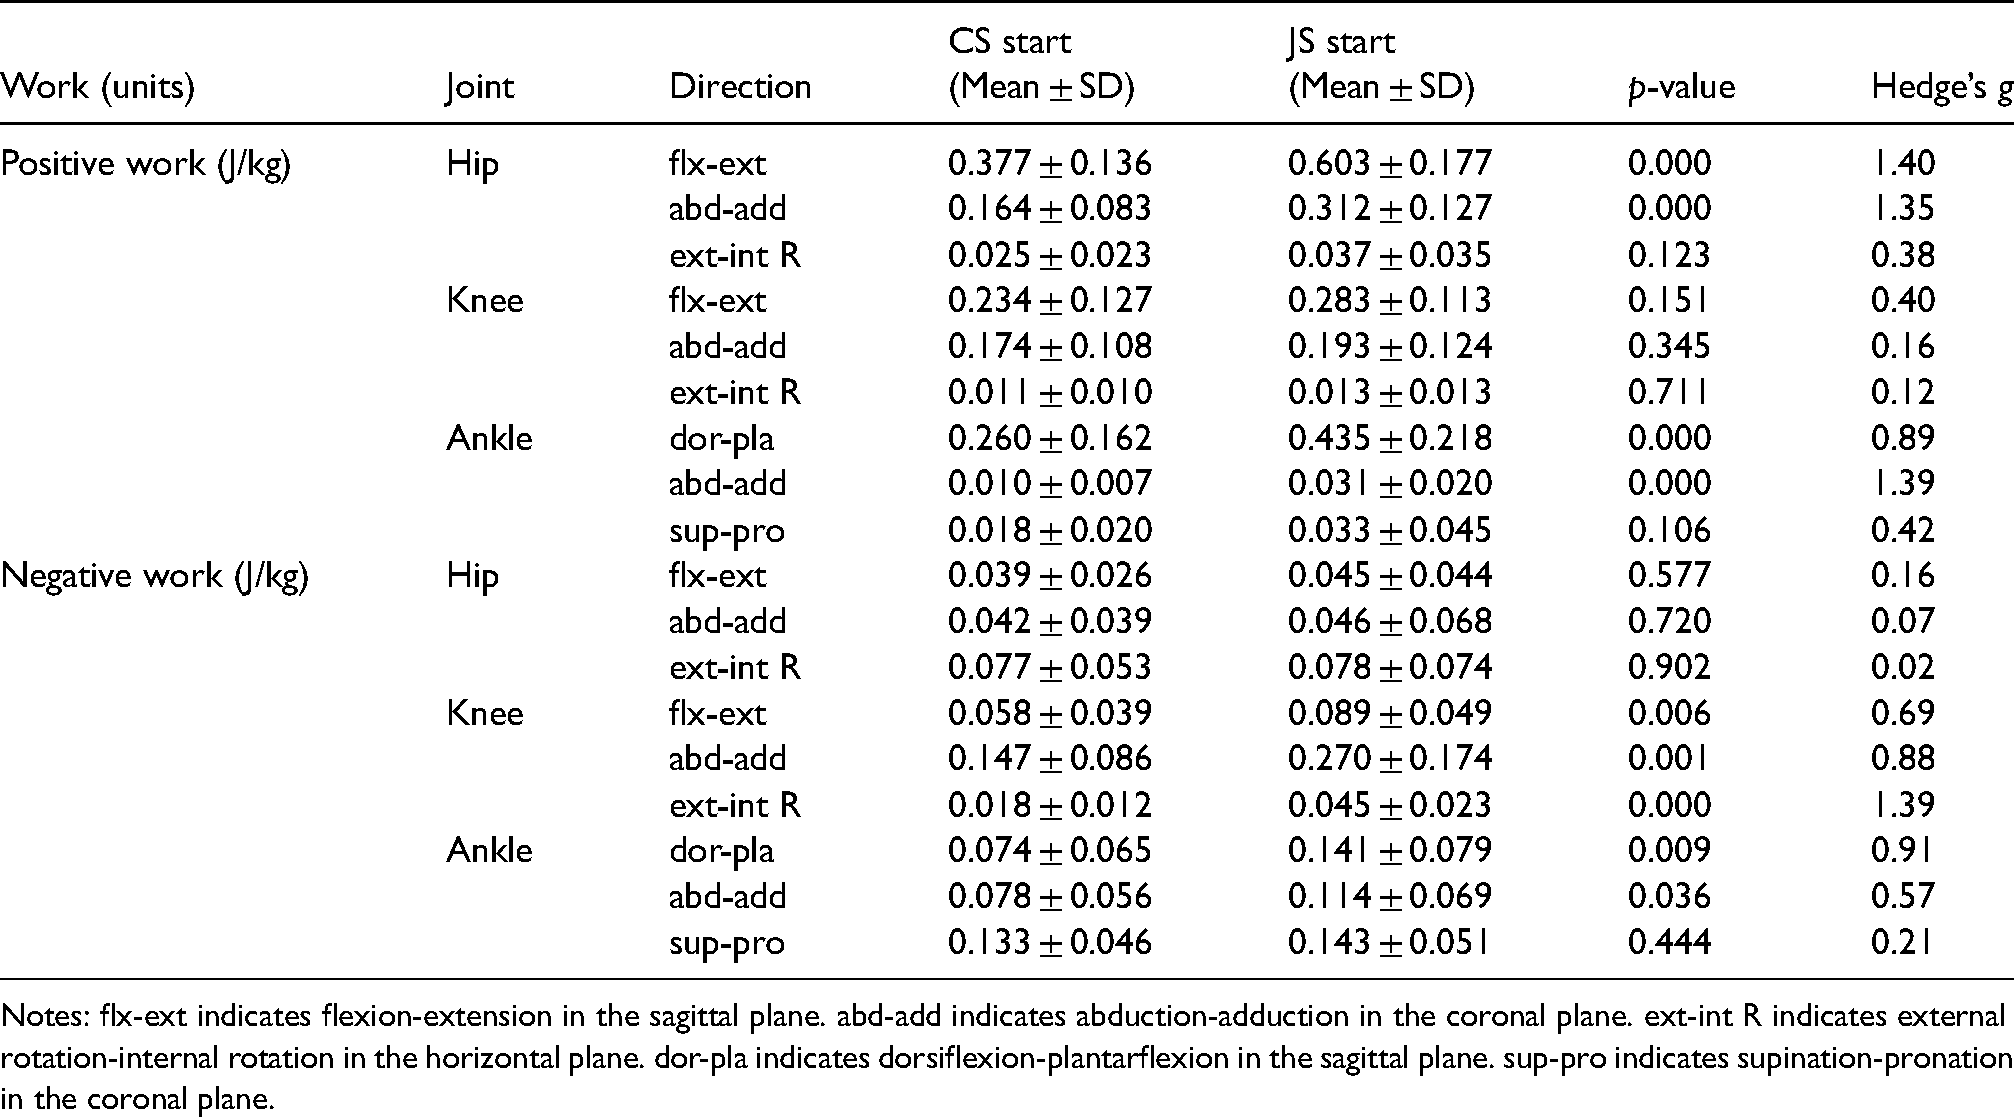
Notes: flx-ext indicates flexion-extension in the sagittal plane. abd-add indicates abduction-adduction in the coronal plane. ext-int R indicates external rotation-internal rotation in the horizontal plane. dor-pla indicates dorsiflexion-plantarflexion in the sagittal plane. sup-pro indicates supination-pronation in the coronal plane.
The SPM analysis revealed that positive hip joint power produced by rear hip extension torque and velocity was greater for the JS start than the CS start for a number of periods during the first three quarters of the push-off phase (11 to 15%, 21 to 31%, 35 to 36%, 39 to 43%, and 61 to 67% of the duration) (Figure 3). The positive hip joint power produced by hip abduction torque and velocity was greater for the JS start than the CS start during the first half of the push-off phase (12 to 45% of the duration), while that produced by hip adduction torque and velocity was greater for the JS start than the CS start from 82 to 87% of the push-off duration. The negative knee joint power produced by knee adduction torque and abduction velocity was greater for the JS start than the CS start from 84 to 87% of the push-off duration. The positive ankle joint power produced by ankle plantar flexion torque and velocity was greater for the JS start than the CS start from 81 to 89% of the push-off phase. The negative ankle joint power produced by ankle adduction torque and abduction velocity was greater for the JS start than the CS start from 86 to 88% of the push-off duration, while positive ankle joint power produced by ankle adduction torque and velocity was greater for the JS start than the CS start from 96 to 99% of the push-off duration.
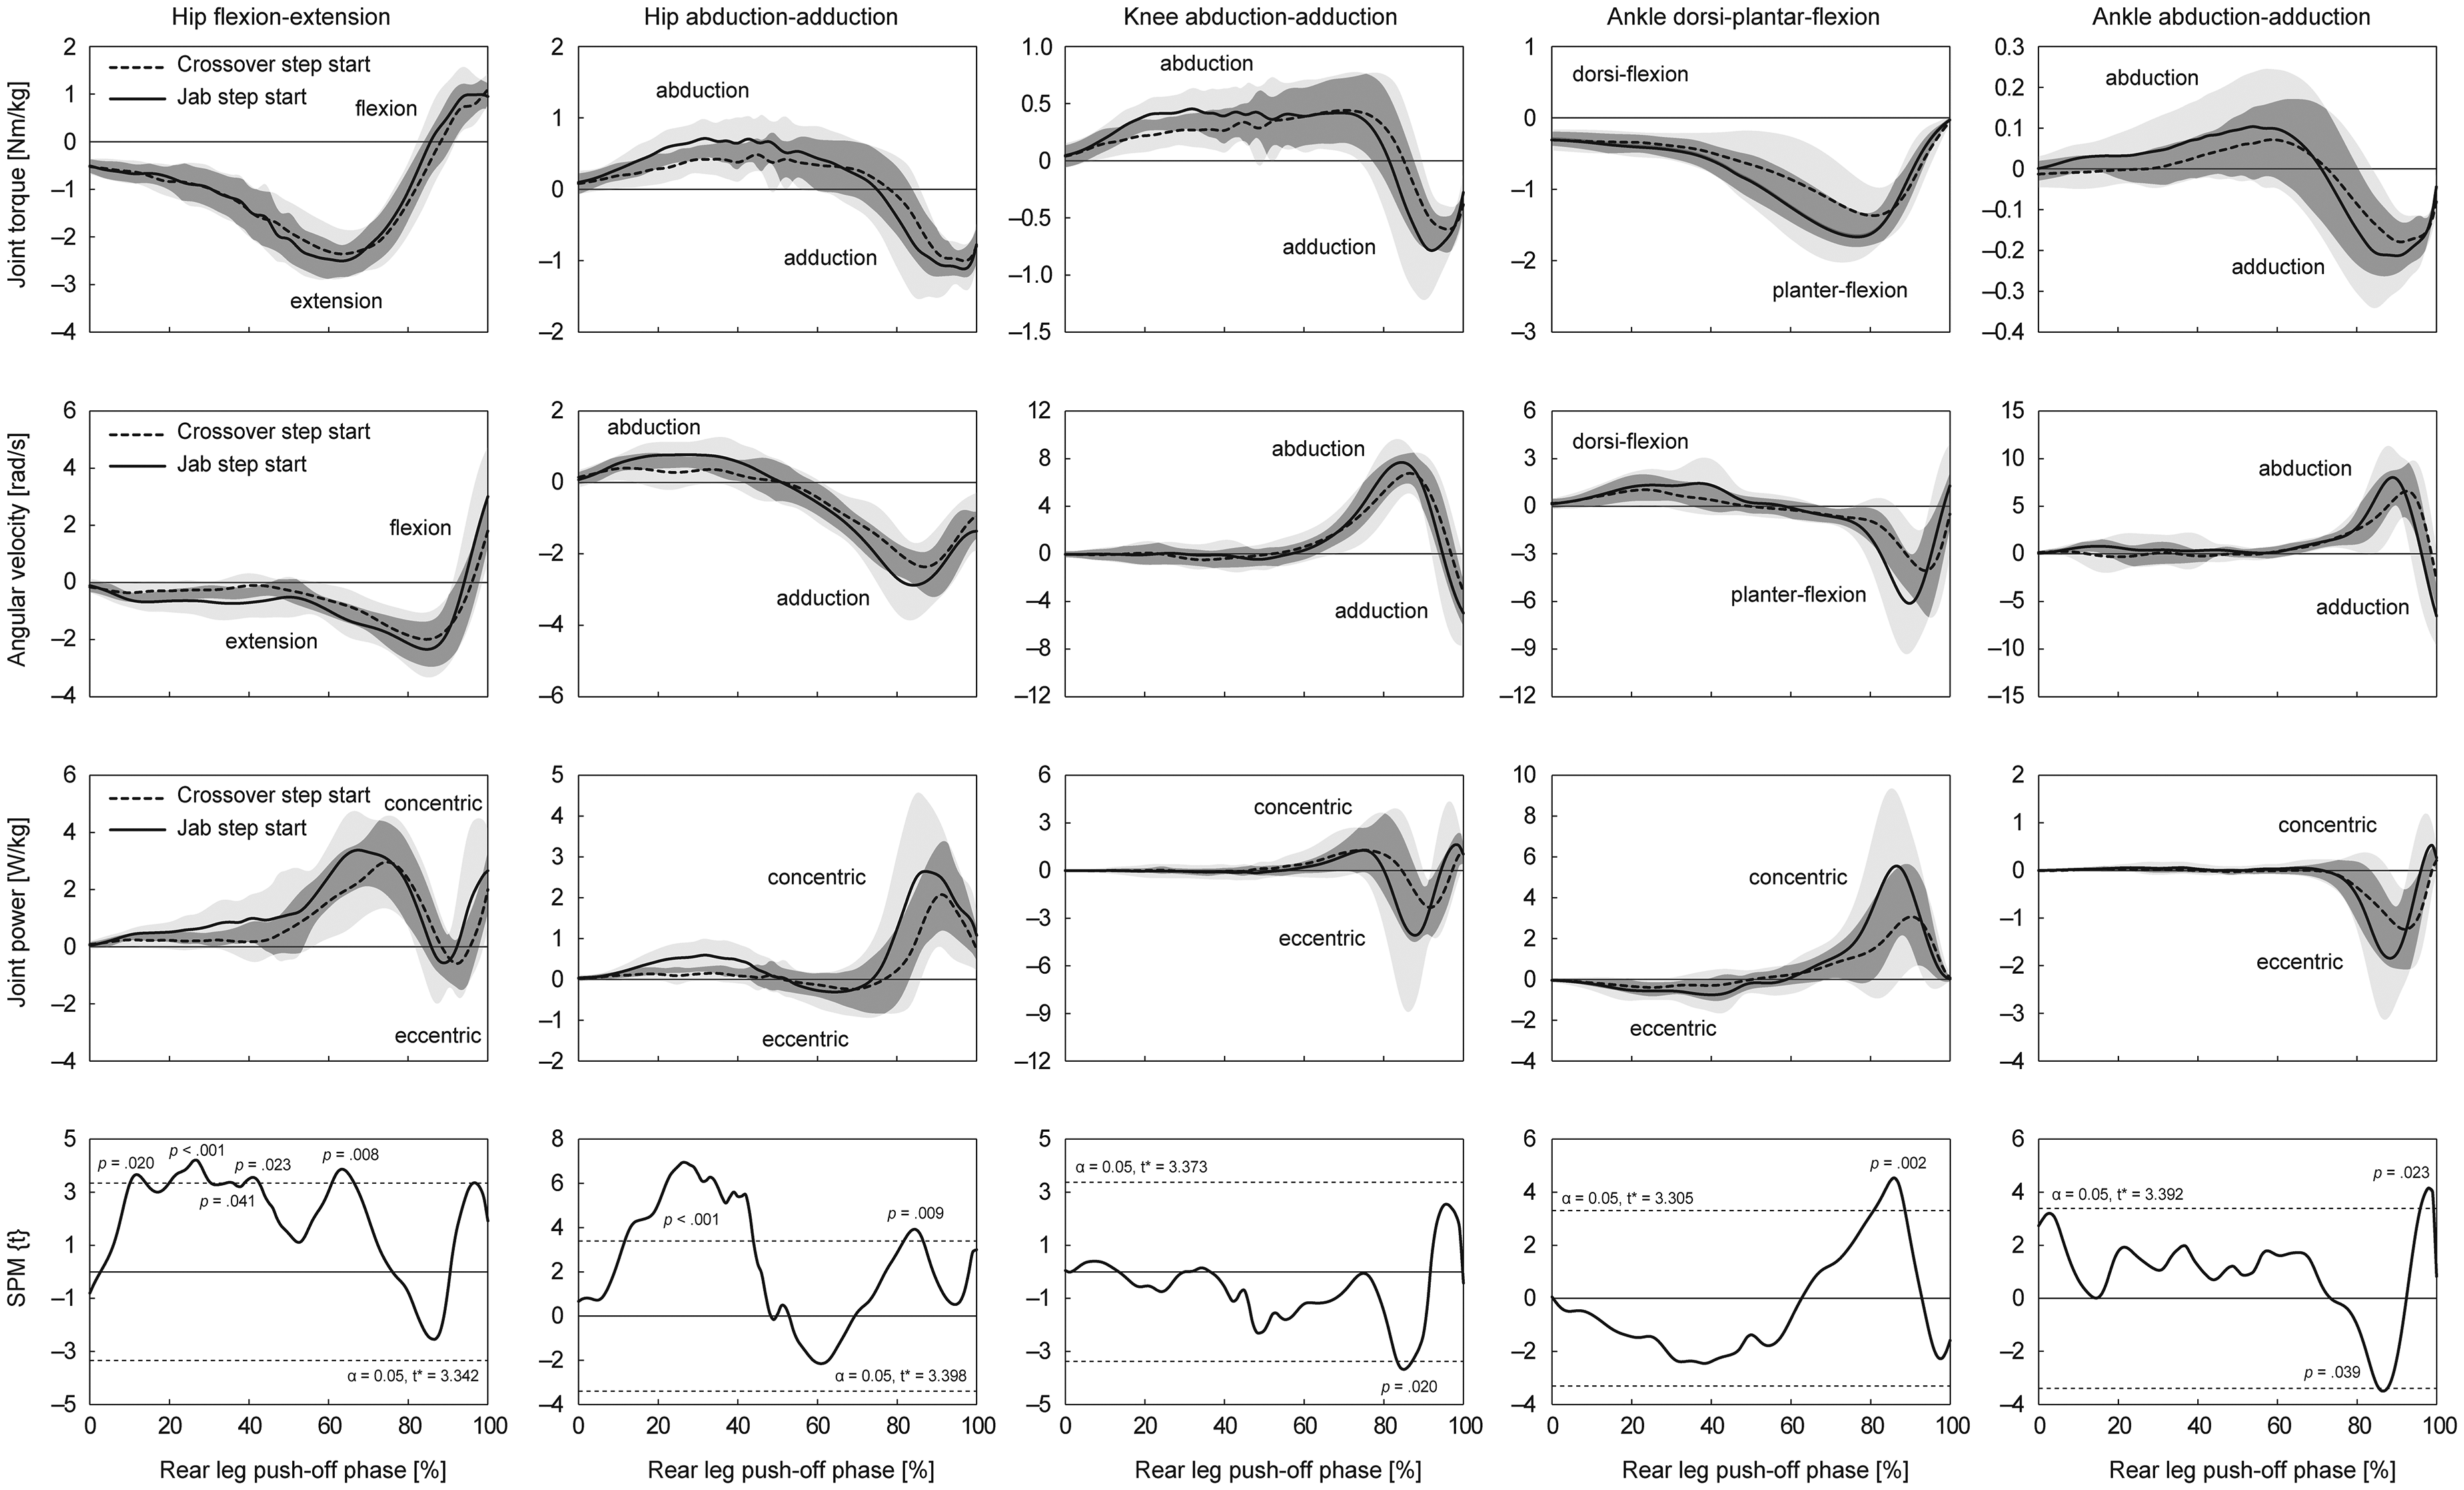
Normalised mean joint torque, angular velocity, and joint power curves during rear leg push-off phase in the crossover and jab step starts, and the associated SPM-1D t test results for difference between the power curves. The top, second, third and bottom rows show joint torque, angular velocity, joint power and SPM t curve, respectively. From left to right the columns show hip flexion/extension, hip abduction/adduction, knee abduction/adduction, ankle dorsi/planter-flexion, and ankle abduction/adduction, respectively. For the SPM t curve, ranges where the curve is above or below the dotted lines indicate regions of statically significant differences between the power curves.
Discussion
This study aimed to elucidate the difference in CS and JS lateral starts in terms of sprint performance and leg kinetics in athletes from ball-and-goal type sports. Although 5-m time and reaction time did not differ between CS and JS starts, forward velocity of CG and normalised average horizontal external power were greater for the JS start, suggesting that the JS start is superior to the CS start for start quickness, though the gains in the start did not appear to transfer to the 5-m performance. Moreover, as hypothesized, the positive work produced by hip extension and abduction, as well as ankle plantar flexion, in the JS start was greater than that for the CS start, likely being responsible for the greater propulsive force produced by the rear leg during the start. In addition, greater positive joint power leading to greater positive work in the JS start was found in the first three quarters of the push-off phase for the hip and in the subsequent push-off phase for the ankle.
In line with a previous study using baseball players, 3 the JS start resulted in better lateral sprint start performance in terms of normalised average horizontal external power. This indicates that the JS start can be recommended for the initiation of movement for the lateral direction from a stationary standing crouched posture not only for baseball players but also for athletes in ball-and-goal type sports. The 5-m time however did not differ between the two start techniques, suggesting that the JS start is not beneficial for subsequent sprinting. When comparing average anteroposterior force and forward velocity of CG between the two start techniques, the rear leg showed larger values indicating that the difference in rear leg force production performance is likely the critical factor for the better performance of the JS start from a side-on position. Kugler and Janshen 24 revealed that the better initial acceleration from a front-on position was accompanied by a more horizontally-directed GRF through a more backward foot placement. Moreover, Kraan et al. 2 found that the backward step at the initiation of a start motion was effective in improving forward sprint start performance through the greater force and power production during the push-off phase when compared with a start without step backward. The JS start in this study started with the rear leg force production and naturally involved a backward foot placement, suggesting a possible origin of the better sprint start from the side-on position seen with the JS start.
As was the case with Miyanishi et al., 3 when considering the role of the rear leg, positive work in the sagittal plane at the hip joint and negative work in the transverse plane at the ankle joint in the JS start were greater than those in the CS start. Moreover, for the rear leg, positive work in the coronal plane at the hip joint and in the sagittal plane at the ankle joint and negative work in the coronal plane at the knee joint and in the sagittal plane at the ankle joint were greater for the JS start than the CS start. As one of the novel aspects of this study, the SPM analysis revealed the differences in joint power profiles between the two start techniques which contributed to the aforementioned differences in the joint works. The positive power produced by hip extension during the first three quarters of the push-off phase and by hip abduction during the first half of the push-off phase was greater for the JS start than the CS start. Moreover, the positive power produced by ankle plantar flexion from 81 to 89% of the push-off phase was greater for the JS start than the CS start. Using the SPM analyses, the differences in positive hip adduction power (82 to 87% of the push-off phase), negative knee adduction (adduction torque and abduction velocity, 84 to 87% of the push-off phase), negative ankle adduction (adduction torque and abduction velocity, 86 to 88% of the push-off phase), and positive ankle adduction (96 to 99% of the push-off phase) were found between the two start techniques. However, the duration range of these differences were small (<5%) and the differences are not mechanically reasonable (not contributing a generation of propulsive force or a suppression of braking force) for differentiating performance between the two types of sprint start. Thus, the positive (concentric) power exerted by hip extension and abduction, as well as ankle plantar flexion, can be considered as the key mechanical factors for better initiation of a sprint start from the side-on position. In addition, when considering the phases where differences were found, sequentially producing large positive (concentric) power from hip (first three- quarters of the push-off phase) to ankle (81 to 89% of the push-off phase) is likely important for effective acceleration of the body in the lateral direction. These findings suggest athletes to train not only hip extensor, abductor, and ankle plantar flexor muscle strength but also phase-specific techniques to produce the force onto the ground for improving start performance from the side-on position.
Generating greater energy through hip extension is important for improved sprint acceleration performance. 25 This knowledge is supported by the current finding as better lateral start performance was accompanied by greater hip extension positive work and power. Jacobs and Van Ingen Schenau 26 showed that the athletic sprinter moves their CG forward by pivoting around the forefoot before extending the leg which produces more energy transfer from the hip to the ankle during the initial acceleration. The initial position of the JS start positions the CG further forward (in the running direction) relative to the rear foot, which allows an athlete to generate hip extension power effectively. Ankle plantar flexion power production is known as a main contributor to the upward and forward accelerations of the CG during the block clearance phase and support phase of the initial acceleration sprinting.25,27 Thus, it is reasonable that the greater positive ankle plantar flexion power in the rear leg was associated with the greater normalised average horizontal external power in the JS start. The change in importance of joint power production from positive hip extension (first three quarter of the push-off phase) to positive ankle plantar flexion (82 to 87% of the push-off phase) is an interesting aspect of the current findings. A pattern of sequentially performing the hip extension, knee extension, and ankle plantar flexion has been proposed as beneficial for sprint acceleration, 28 and the current findings support this concept. Moreover, the findings can be interpreted as indicating that, for better lateral sprint start performance, an athlete should focus on rear hip extension during first three quarter of the push-off phase, followed by rear ankle plantar flexion.
Although a previous study did not find a difference in positive hip abduction work and power between CS and JS starts, 3 the JS start values were larger in this study. This contradiction is possibly because of the difference in the characteristics of the participants as the previous study used baseball players, who are more likely performing sprints from a lateral stationary standing crouched posture for base stealing, while this study employed football and handball players. A previous study which investigated side steps from a stationary standing posture suggested that hip abduction work was not a contributor for the changes in the side step distances, while the main roles of hip abduction torque and work were to accelerate the CG laterally in the earlier push-off phase and to keep the trunk upright. 29 Therefore, the observed difference in positive hip abduction power may result from a difference between CS and JS starts in the strategy for how acceleration is produced, without contributing to an overall difference in acceleration performance. As it is difficult to actively produce knee abduction torque, greater negative knee abduction power (abduction torque and adduction velocity) in the JS start could be produced by passive abduction torque production at the knee through positive hip abduction torque and power production. Thus, it is not necessarily important to actively produce negative knee abduction power. The greater negative ankle adduction power (adduction torque and abduction velocity) during the JS start could result from greater rotation of the pelvis with medial rotation of the thigh and shank during rear leg push-off phase. During the rear leg push-off in the JS start, the athlete initially rotates their body towards the running direction while pushing on the ground; during this movement, the ankle was likely passively abducted, generating negative power. Thus, the greater negative ankle adduction power may not affect lateral sprint start performance, and it is likely caused by a difference in initial pelvis, rear leg thigh, and rear leg shank movements.
The current findings are accompanied by some limitations. Although the participants in this study practiced both start techniques until they were familiar with them before the experiment, there could be an influence of habitual manoeuvre. Because this study used football and handball players as participants, the findings cannot necessarily be applied to athletes from other sports. Additionally, participants in the present study wore gym shoes and sprinted on a urethane floor with rubber mats over the force platforms; thus, the shoes and surface are different from those in football or handball. In order to elucidate the cause of contradicted results (difference in normalized horizontal external power between CS and JS starts and no difference in 5-m time) in this study, a future study needs to investigate the entire sprint from the start to 5-m mark using a motion capture system.
Conclusion
This study has shown that the JS start may be a better technique for a lateral sprint start but not for subsequent sprinting and that the positive work produced by rear leg hip extension and ankle plantar flexion are probably responsible for the greater propulsive force during the start. In addition, greater positive joint power in the first three quarters of the push-off phase for hip extension and in the subsequent push-off phase for ankle plantar flexion were found to be important factors for achieving better performance of the JS start. It is recommended that athletes in ball-and-goal sports adopt the JS start for initiation of the lateral motion from a stationary standing crouched posture. Moreover, to improve JS start performance, the athletes should focus on rear leg hip extension during first three quarter of the push-off phase, followed by ankle plantar flexion of the same leg.
Footnotes
Acknowledgements
The authors thank the players of Sendai University football and handball teams and their staff for their cooperation. The authors also wish to thank Dr Sandy Willmott for his English proofreading and constructive suggestions.
Declaration of conflicting interests
The author(s) declared no potential conflicts of interest with respect to the research, authorship, and/or publication of this article.
Funding
The author(s) received no financial support for the research, authorship and/or publication of this article.