
Abstract
Objectives
To examine the effects of match-related contextual variables on positional groups and success in the National Rugby League (NRL).
Methods
Data relating to match location, match outcome, quality of opposition and match type (absolute score differential) from all matches across the 2015–2019 NRL seasons were collected, in addition to 14 previously identified Factors (technical performance indicators). A decision tree, grown using the Exhaustive Chi-square Automatic Interaction Detector (CHAID) algorithm, was used to model the effect of each of these match-related contexts on positional contribution according to match outcome.
Results
The accuracy of the exhaustive CHAID model in explaining the influence of positional groups on match outcome was 66%. The model revealed four primary splits: interchange forwards, utility backs, adjustables and a group containing the remaining three positional groups (forwards, backs, and interchange).
Conclusions
Results suggest that interchange forwards, utility backs and adjustables could have a definitive role within the team compared to the remaining positional groups in determining match outcome. In contrast to team-level research, there is a greater emphasis on the importance of defensive actions (e.g. try causes, tackles made) at a positional level than attacking performance indicators. The moderate classification accuracy justifies the use of this approach for examination of the interactions between match-related contextual variables, performance indicators and positional groups.
Highlights
Unique contributions of positional groups to overall team success in elite rugby league were identified, with interchange forwards, utility backs and adjustables each exhibiting a more definitive team role than others.
Contrasting to team level research, defensive actions and poor attacking skill influenced match outcome greater than other performance indicators.
Consideration of the complex interactions between match-related contextual variables, performance indicators and positional groups may provide practical insight for coaches in regards to training design, player selection and game tactics.
Introduction
The capture and analysis of technical performance indicators (PI) in team-sports has been widely investigated, 1 with these works adding value to the understanding of competition trends and to support decision making. For example, research in Australian Football,2–4 basketball5–7 and soccer8,9 has identified various PIs, such as number (or type) of passes, scoring opportunities, tackles made, score assists and errors, that differentiate positional groups and supports the development of training and match-strategies important for success.
In Rugby League, similar research has examined the various positional requirements of players during game play.10–12 This work has identified that forwards, hookers and halves complete more tackles per minute than backs (and full backs), while forwards complete a greater number of offensive and defensive actions compared to backs and adjustables (halves, hooker and fullback).10,11 More recently, Wedding et al. 12 identified two additional positional groups (interchange forwards and utility backs) using an unsupervised classification technique (two-step clustering) – complementing the four a priori positional groups of adjustables, backs, forwards and interchange – supporting the design of positionally-focused practice designs in Rugby League. Whilst such work has been important for understanding differences between playing positions, research is yet to explore how these positional groups change their contribution to match success based on match-related contextual factors.
Several studies in team sports have explored the effects of match-related contextual variables, such as match location,13–15 quality of opposition13,16 and score differential (match type)17–19 on match outcome. These match considerations have enabled performance analysts (and subsequently coaching staff), to better understand successful team performance across a range of contexts. Notably, the PIs important for distinguishing the characteristics of positional groups across a range of match-contexts in soccer were recently examined. 20 The authors reported that the quality of opposition, match outcome and quality of opponent produced the strongest effects on players’ performances, highlighting the need for further consideration of these match contexts when examining or evaluating player performance. 20 Whilst similar research has been conducted in Rugby League,21,22 the influence of different match-contexts, and the subsequent impact on positional groups’ performance and match outcome, have yet to be determined. The aim of this study was to examine the effects of different match-related contexts and positional groups on match outcome in the National Rugby League (NRL).
Methods
Data was collated from a licensed central database (Analyzer; The League Analyst, Version V4.14.318) and consisted of 1005 matches across five seasons in the NRL (2015–2019). By focusing on this 5-year sample, the current study was able to build on work, in which technical performance indicators23–25 and positional groups7,12 have previously been identified via unsupervised clustering techniques. Additionally, the significant impact of COVID-19 and rule changes during the 2020 NRL season rendered the data for that season too heterogeneous for inclusion.
Guided by previous research,
12
we classified technical PIs into 14 Factors (via a data reduction method – principal component analysis, PCA), which could then be used to best describe the technical characteristics of positional performance (Table 1). Positional groups utilised for this study were previously identified via unsupervised classification and were categorised as backs, forwards (middle and edge forwards), interchange forwards, adjustables (halves, fullback and hooker), interchange, and utility backs (see,
12
for further insights). Further, the addition of match-related contextual variables of included below were guided by similar studies in RL22,24:
Match location (Home / Away / Neutral), Match type (absolute score margin calculated as |team score – opposition score|), Quality of opposition (end of season ladder position)
Principal components and their associated technical performance characteristics as previously identified by wedding et al. 12
Match outcome was coded for Wins and Losses, with matches ending in a draw (n = 4) omitted from analyses. Quality of opposition was defined by whether teams reached the finals (i.e. finished the season in the ‘top eight’) in that respective season. 26 For example, if a team that made the finals played a team that did not, then the quality of opposition was defined as ‘worse’. Similarly, for a match where both teams did not make finals that season, the quality of opposition for both teams was considered as ‘balanced’. All data was collated and analysed in accordance with approval from the local Human Research Ethics Committee (H7376).
Statistical analyses
Data was modelled using two-step cluster analysis followed by classification and decision trees, grown using the exhaustive Chi-square automatic interaction detection (CHAID) algorithm. Two-step cluster analysis was used to identify different match types, with the ‘optimal’ number of clusters determined via the Schwartz's Bayesian Information Criterion.22,27 Given the nature of the other response variables, cluster analysis was not required prior to further analysis. The Silhouette coefficient (≥ 0.7) was used to measure cluster cohesion and separation in order to determine the “goodness” of the clustering.27,28 Further, similarity between clusters was calculated using log-likelihood distance measures. 28
Exhaustive CHAID was used to identify how the performance of positional groups effected match outcome, using various response variables (i.e. match location, match type and quality of opposition) and previously identified Factors. 29 Match outcome was the dependent variable with the first categorisation/split forced for playing position(s) to enable subsequent CHAID results to clarify how winning and losing could be influenced by positional groups. The following criteria assisted the build of the model: (i) maximum number of iterations was 100, (ii) statistical significance was set to p < 0.05, (iii) Pearson's Chi-square values were used to detect the relationship(s) between independent variables, (iv) the minimum change in expected cell frequencies was 0.001, and (v) the Bonferroni method was used for significant value adjustments. 29 Additionally, the risk of misclassification was calculated as a measure of the reliability of the model using cross-validation of 10 training splits.29,30
Results
Two-step cluster analysis identified four match types (average silhouette coefficient = 0.7) as follows:
’Close’ (34.8% of all matches, absolute points margin = 3.2), ’Balanced (34.4%, absolute points margin = 11.5), ’Unbalanced’ (22%, absolute points margin = 22.6) and, ’Runaway’ matches (8.8%, absolute points margin = 35.6).
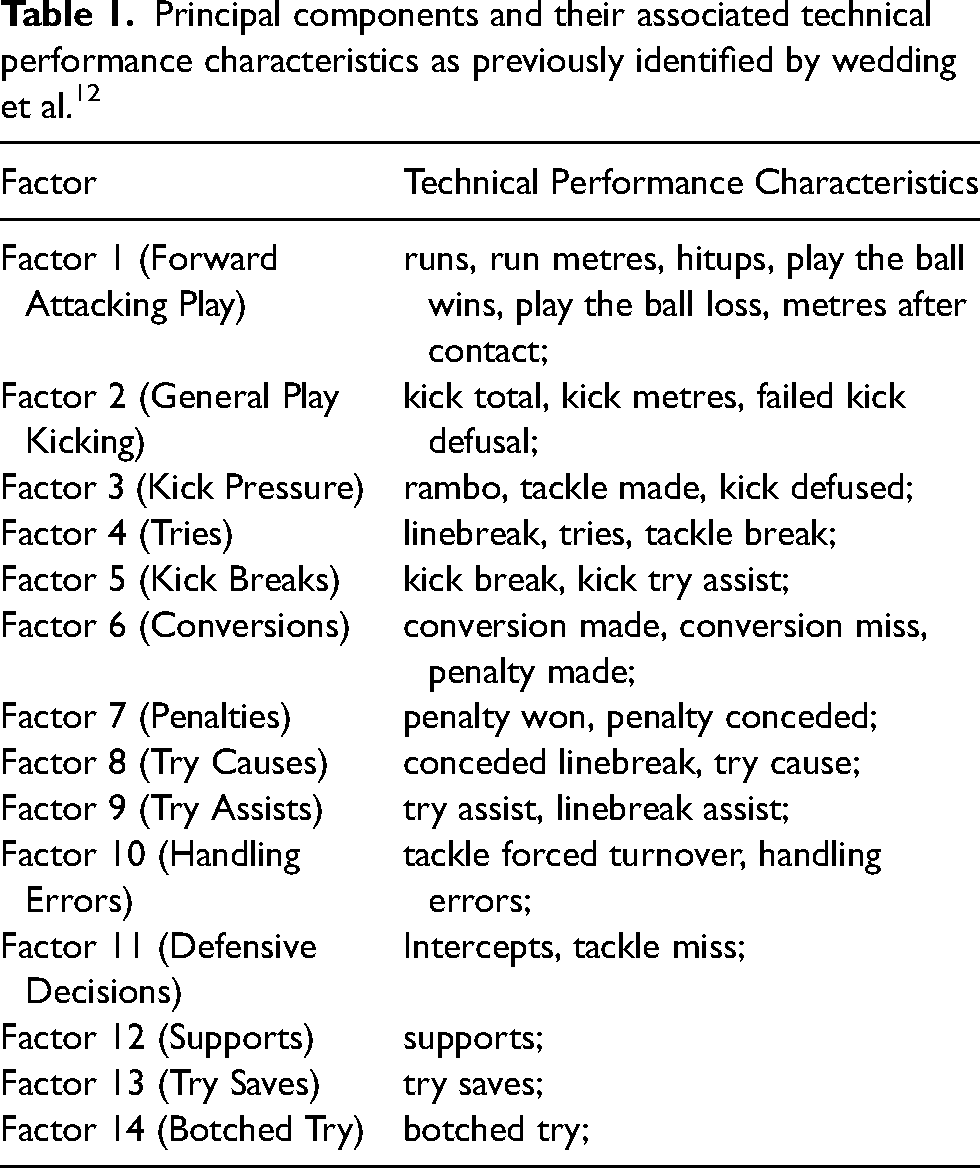
Descriptive statistics were compiled for each position group per each response variable (see Supplementary Tables 1-4). Exhaustive CHAID revealed an average 66% classification accuracy for match outcome using positional group performance (i.e. wins were classified at 71.7% and losses at 60.3%). The independent variables included in the model were: positional groups, quality of opposition, match type, try causes, defensive decisions, handling errors and match location. The model grew a total of 58 nodes (41 terminal nodes), which given the size of the tree, was split into four separate trees beginning with the first positional group split (or combined positional groups). For example, Figure 1 (Node 1, playing position = forwards, interchange and backs) was the only tree split that featured more than one positional group as part of the first partition. Node 1 was then split by quality of opposition, where the likelihood of winning against ‘Better’ opposition was 25.1% (Node 5), compared to 48.8% (Node 6) and 74.6% (Node 7) when competing against ‘Balanced’ and ‘Worse’ opposition, respectively. Continuing from Node 7 (quality of opposition = ‘Worse’), the tree was then split by match type with the greatest likelihood of winning (92.9%) occurring in Node 27 (match type = ‘Runaway’), and the lowest at Node 28 (66.3%; match type = ‘close’).
Exhaustive CHAID model of match outcome as influenced by forwards, backs and interchange players and various response variables and performance indicators.
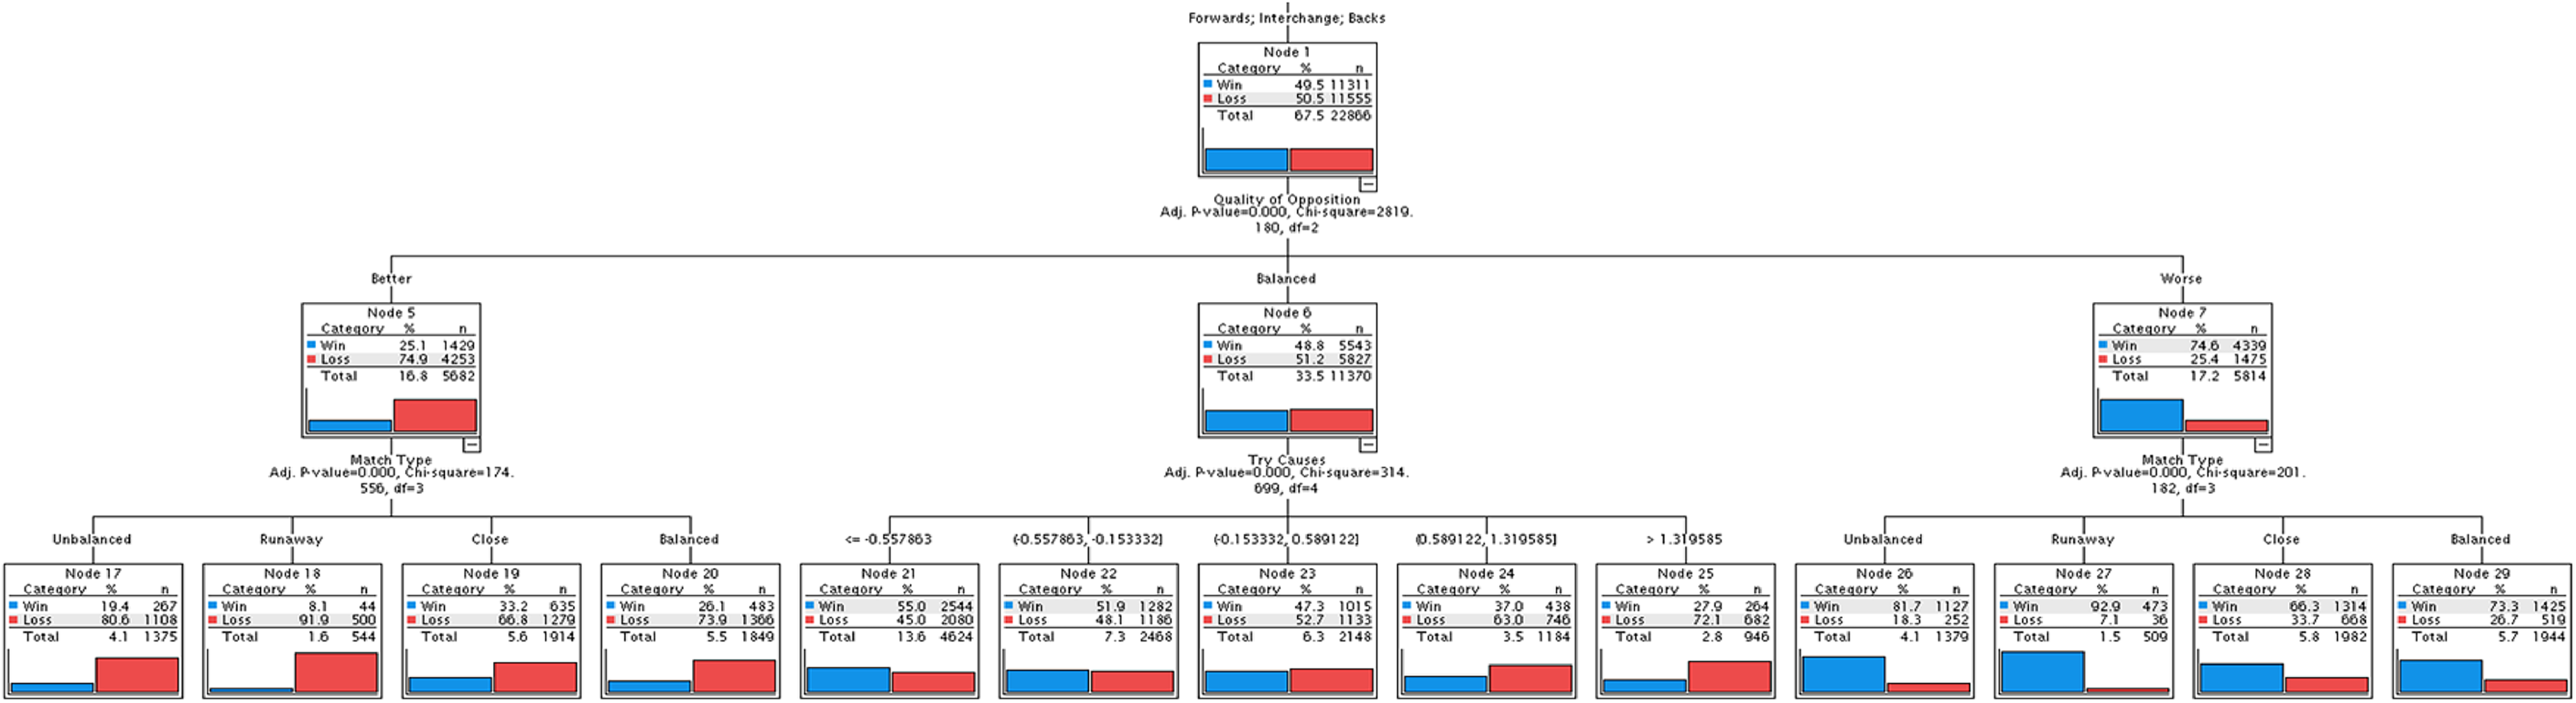
Figure 2 (Node 2) depicts the tree for utility backs and was first split by quality of opposition, where the likelihood of winning against ‘Better’ opposition was 46% (Node 8), compared to 68.3% and 80.4% when competing against ‘Balanced’ and ‘Worse’ opposition, respectively. Continuing to the left of the tree, Node 8 was then split by ‘Defensive Decisions', whereby the likelihood of winning dropped to 29.6% when Utility Backs produced ≤ 0.63 ‘Defensive Decisions' (Node 30), but improved to 65.2% when producing >0.63 ‘Defensive Decisions' (Node 31).
Exhaustive CHAID model of match outcome as influenced by utility backs and various response variables and performance indicators.
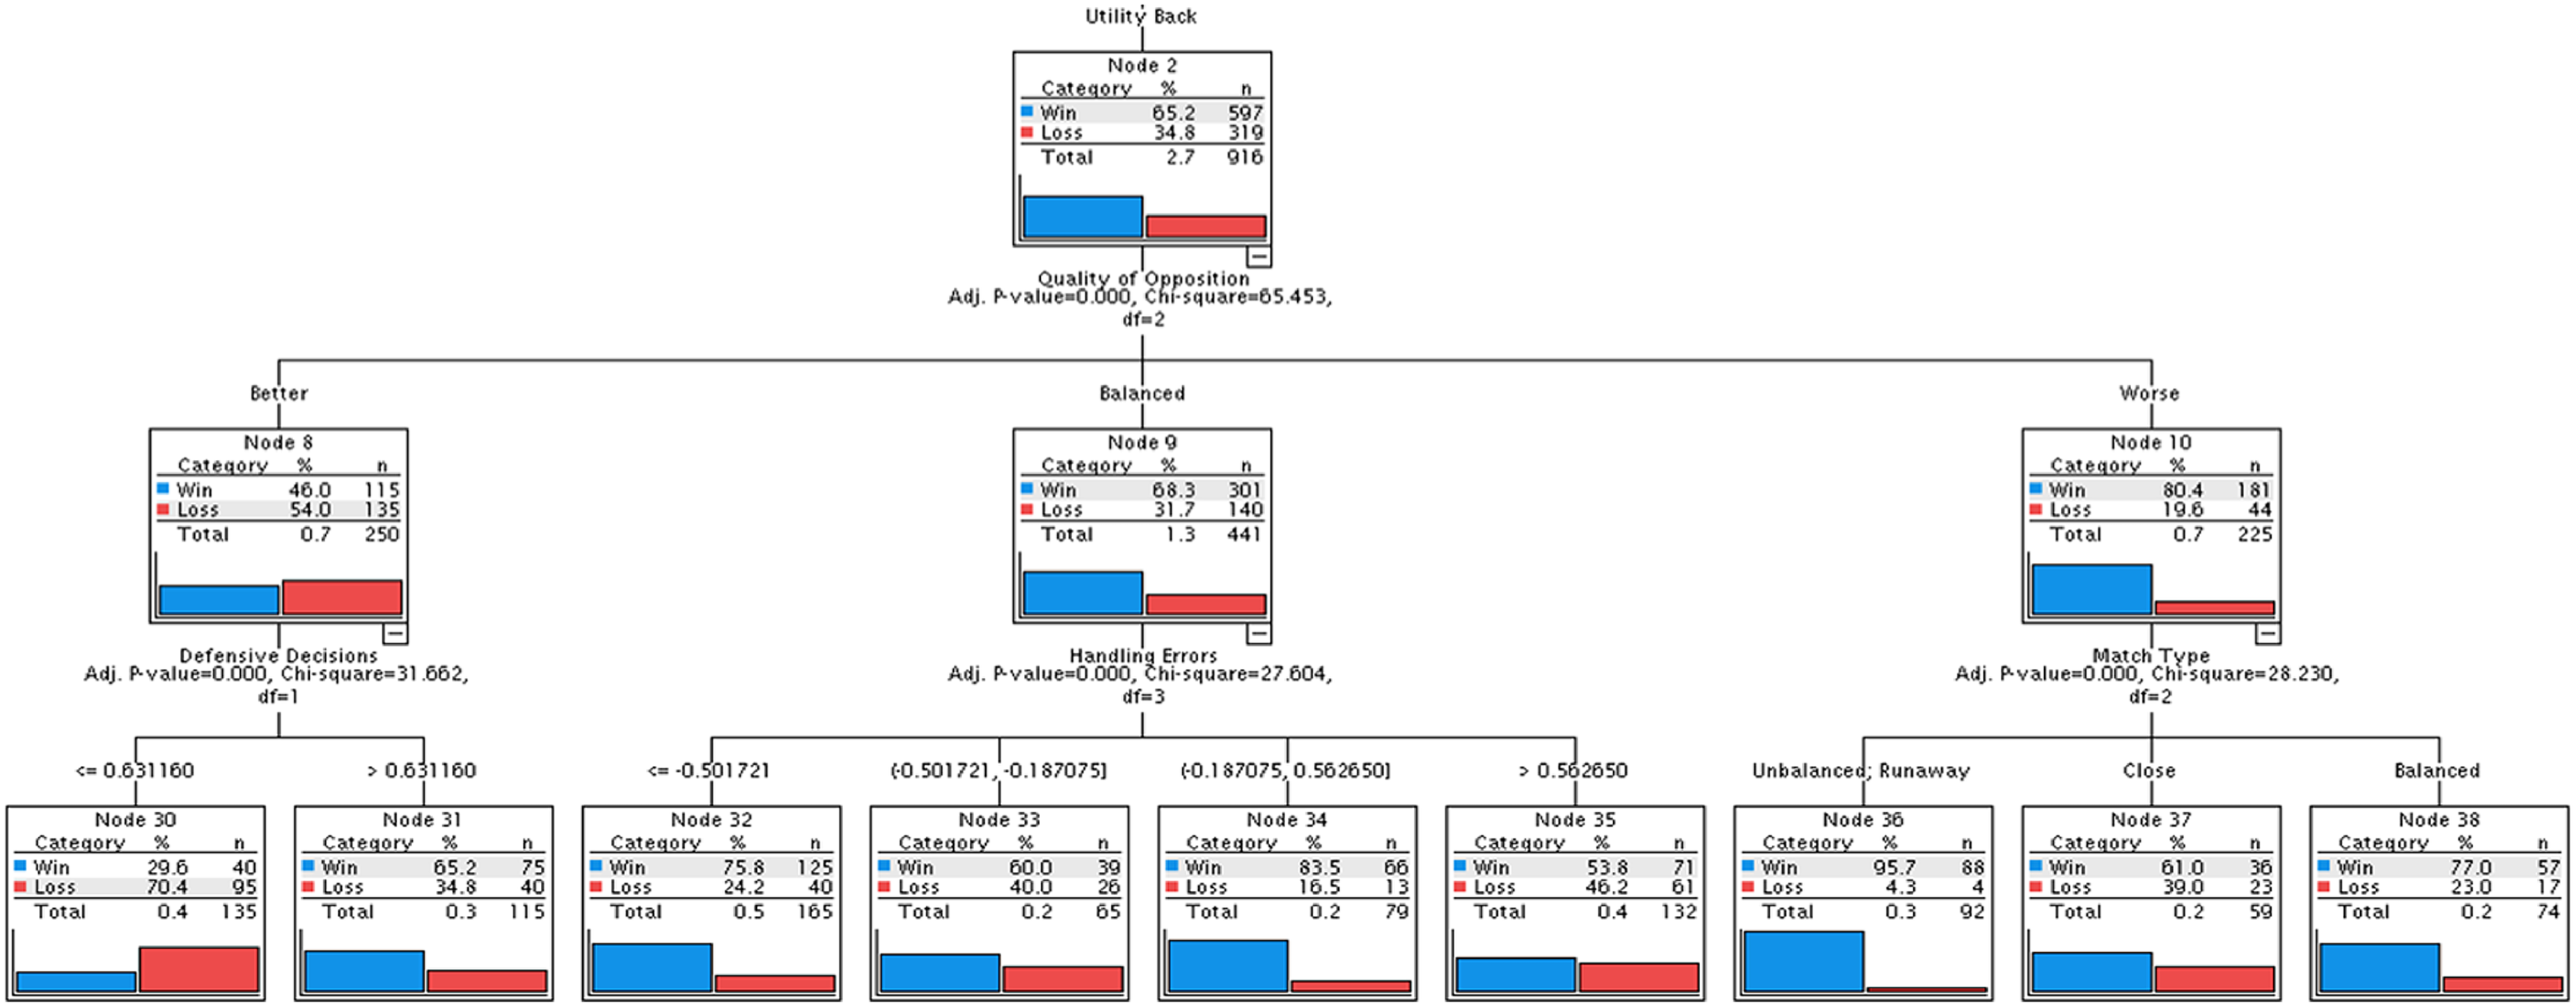
Figure 3 depicts the tree for interchange forwards (Node 3) and was first split by quality of opposition. When facing ‘Better’ opposition, the likelihood of winning dropped to 21.4% (Node 11) whereas it increased to 72.5% (Node 13) when facing ‘Worse’ opposition. Continuing further down the left-hand side of this tree, Node 11 was split by ‘Try Causes'. When Interchange Forwards committed fewer try causes (≤ −0.56, Node 39) against ‘Better’ opposition, their likelihood of winning improved from 21.4% to 36.6%. However, the greater the number of ‘Try Causes' that these players made, the less likely they were to win games; Node 40 (‘Try Causes' >-0.55, <0.59) success rate dropped to 25.4%, while for Node 41 (‘Try Causes' >0.59), the likelihood of winning dropped to 11.5%.
Exhaustive CHAID model of match outcome as influenced by interchange forwards and various response variables and performance indicators. .
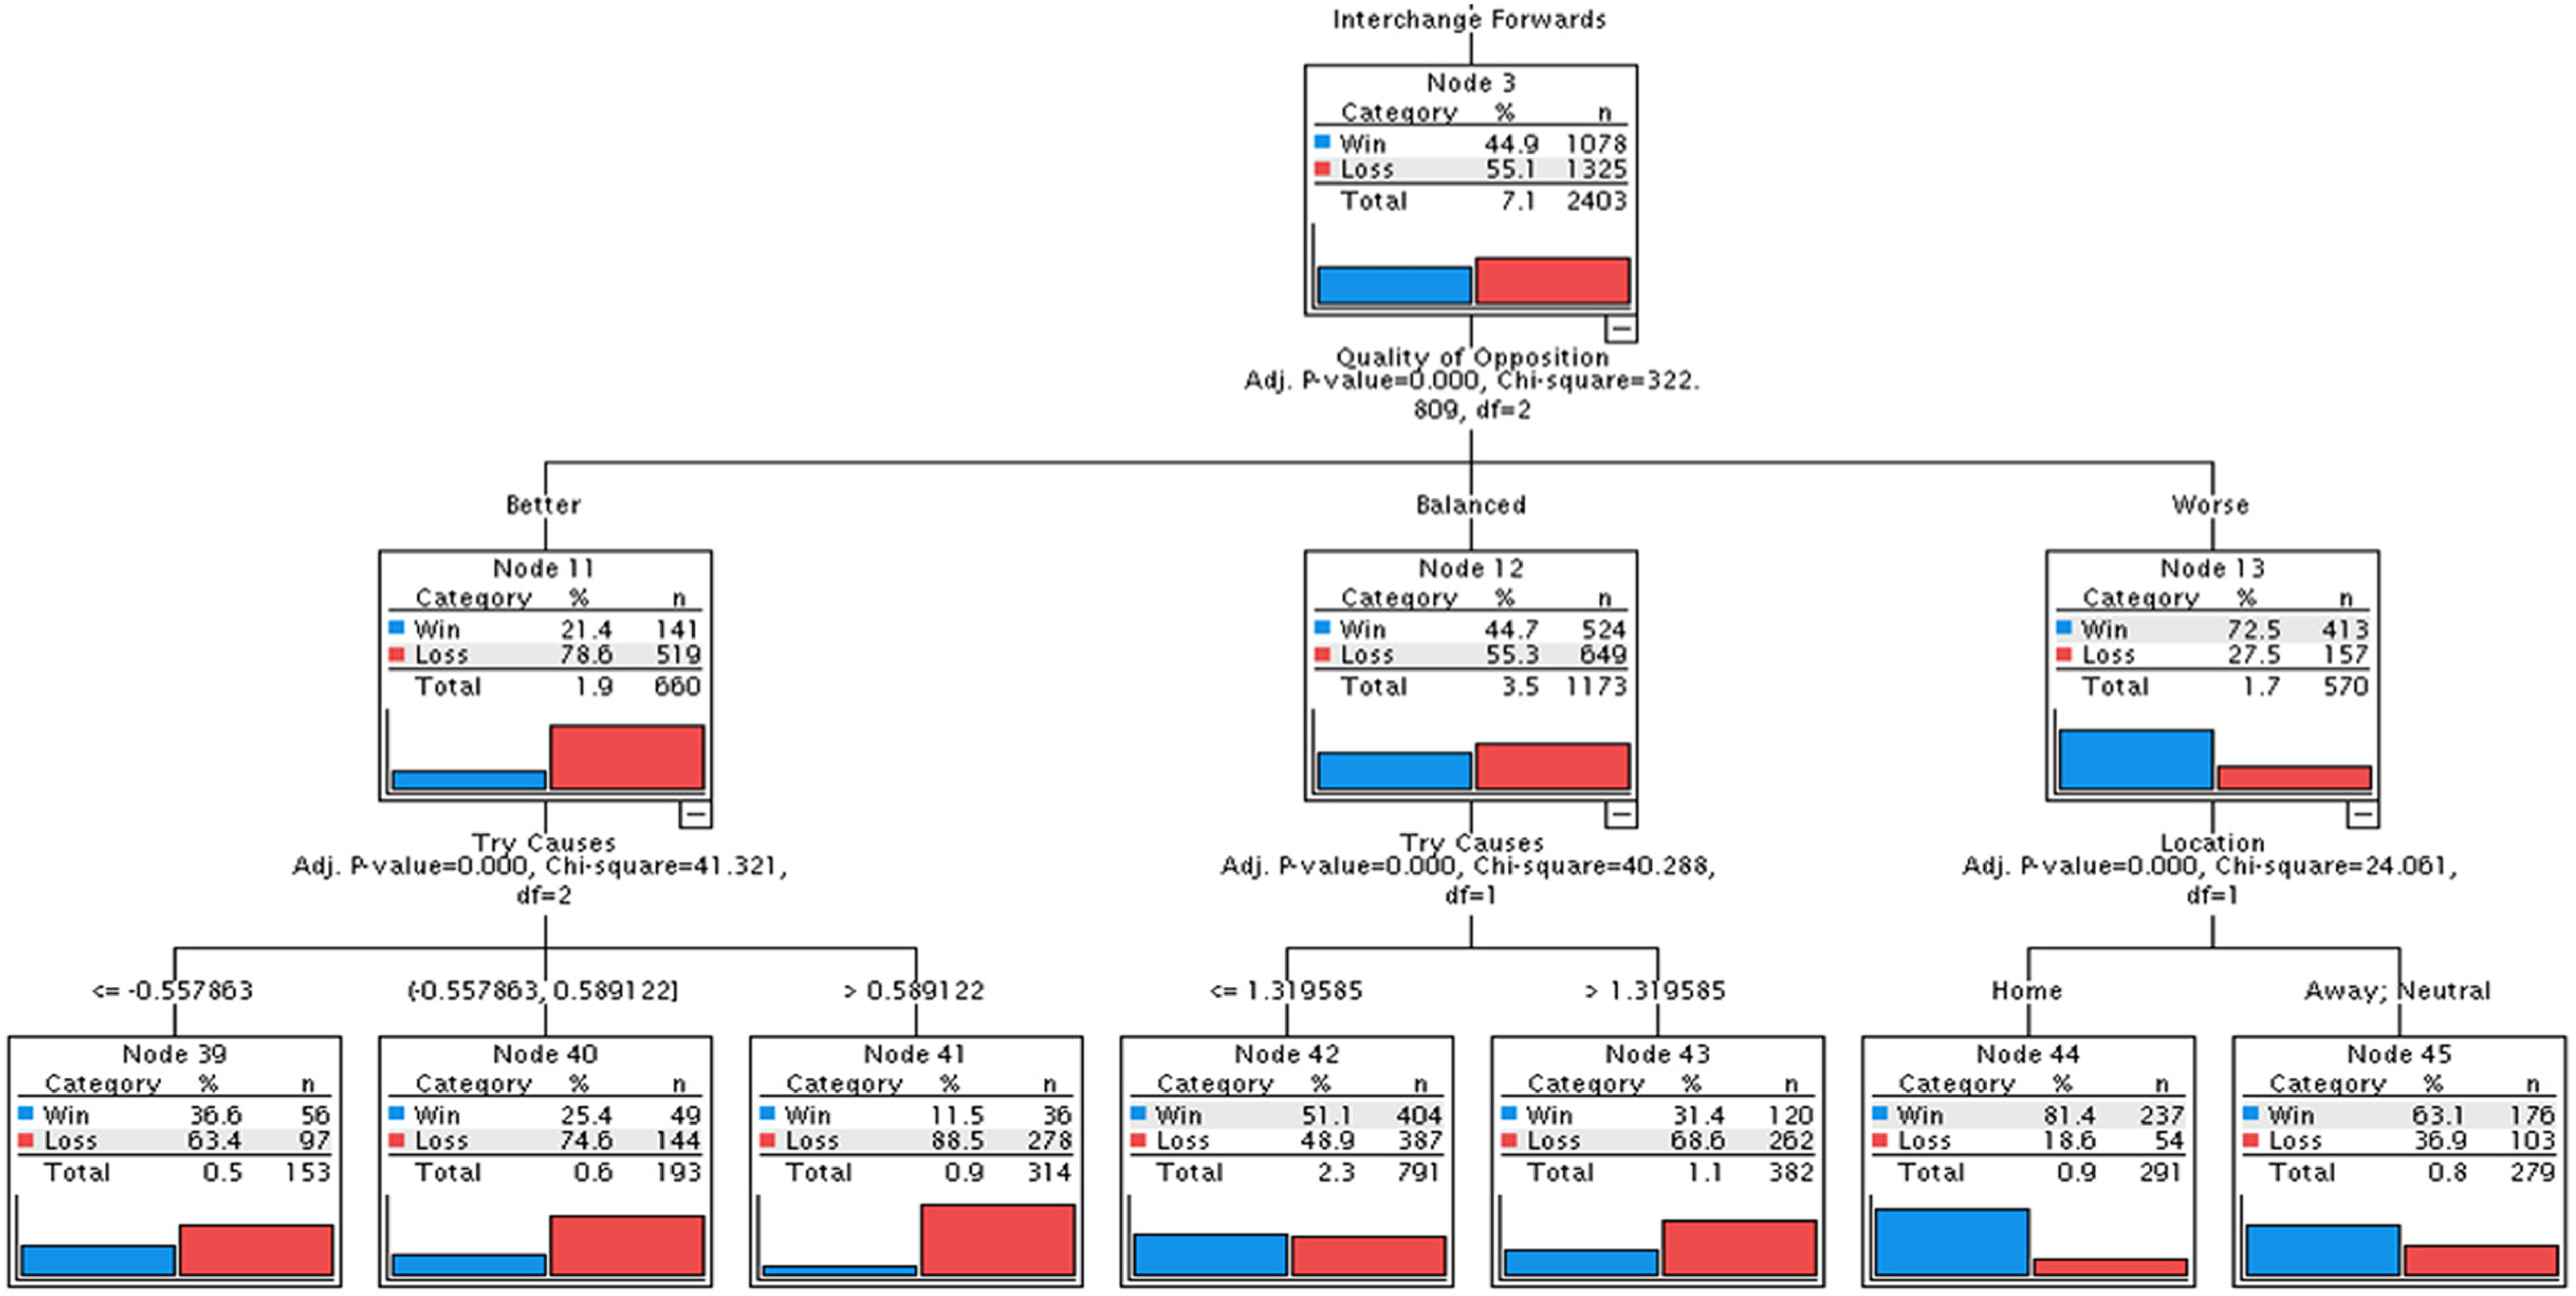
Finally, Figure 4 depicts the tree for adjustables (Node 4) that was first split by quality of opposition, with a winning probability of 26.3% when competing against ‘Better’ opposition, which dropped to 76.1% when competing against ‘Worse’ opposition. Continuing to the right of Node 4, to Node 16 (quality of opposition = worse), data was further split by match type. For example, when adjustables competed against a ‘Worse’ opposition during ‘Runaway’ matches, the probability of winning was 93.9% compared to 66.9% during ‘Close’ matches. This combination of PIs led to the highest probability of winning for the adjustables’ positional group.
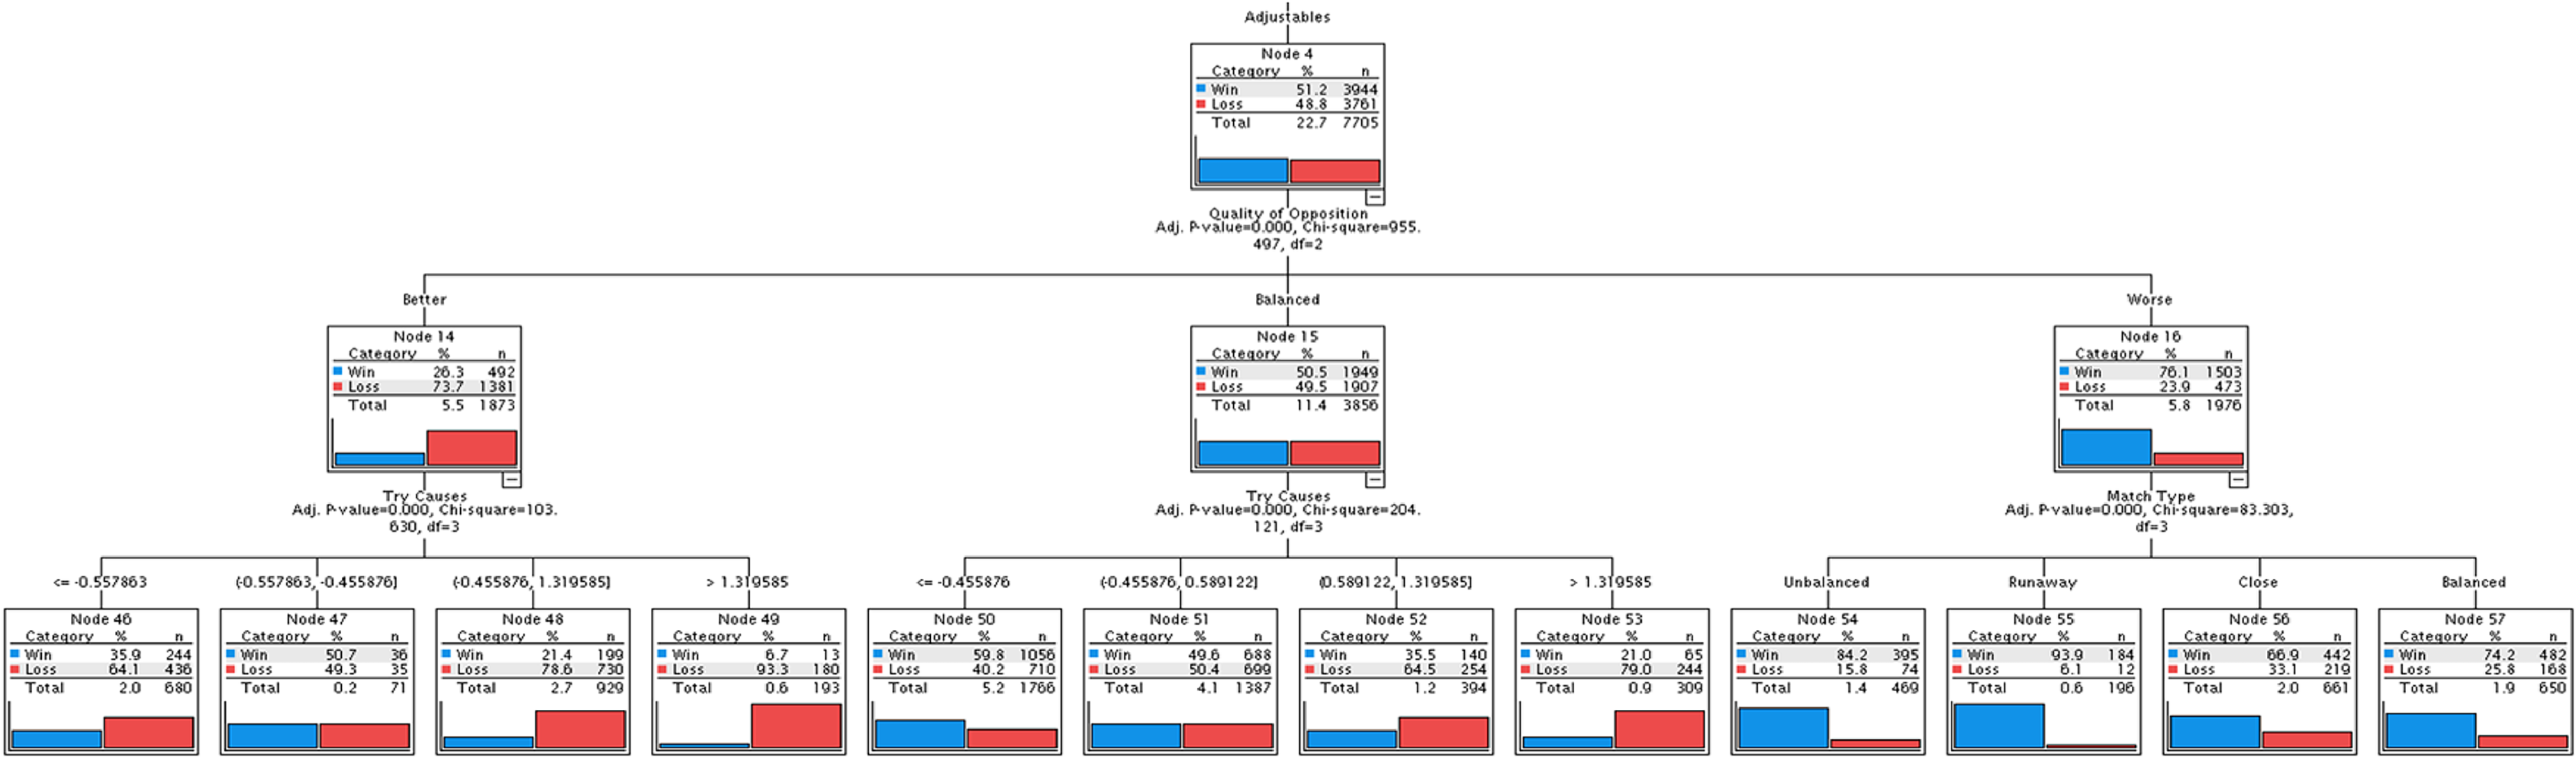
Exhaustive CHAID model of match outcome as influenced by adjustables and various response variables and performance indicators.
Discussion
This study investigated the effects of different match-related contextual variables on positional groups and the likelihood of success (match outcome) in the NRL. Results showed that forwards, interchange players and backs were grouped together, exerting similar influences on match outcome irrespective of match context. Conversely, interchange forwards, utility backs and adjustables might have a more definitive role in match outcome, as seen in the resulting trees. Similar findings have been noted elsewhere,10–12 but work had yet to compare the relative contribution to overall team performance, as done here. The findings that specific positional groups have relatively (dis-)similar contributions to team performance could have several implications for coaching staff, particularly with respect to team selections. For example, by improving the ‘catch-pass' of utility backs – thereby assisting with a potential reduction in the frequency at which ‘Handling Errors' may occur – a team could improve their likelihood of success beyond 54% (Figure 2; node 35) to as much as 84% (Figure 2; node 34). Similarly, a defence-orientated coach may interpret the same finding such as that by increasing defensive pressure on utility backs – thereby potentially increasing ‘Handling Errors' – an opposing team may increase their opportunity to be successful. Whilst acknowledging ‘Handling errors' rely on a number of additional variables; the aforementioned examples provide an illustration of the practical applications achievable from the current findings. Interestingly, the three individually split positions include key position (adjustables) and interchange players (interchange forwards and utility backs), which would mean the decision-making regarding team selection, particularly around these positions, is even more important for team performance. Further, it would suggest that positional-specific training also may be important for improving the overall team success – namely, utility backs improving defensive decisions or interchange forwards working on their defensive movements and decision making to prevent try causes. Our point here is that by understanding that these positional groups can have an impactful influence on team success, coaches can carefully design task-specific training activities, select certain players to fulfil roles and plan innovative playing strategies.
It was interesting to note the omission of attacking variables from the final model, with defensively related variables seeming to have a greater influence on match outcome. Research had suggested that attacking PIs such as try assists, run metres, offloads and line breaks provided the greatest explanation for match outcome (and ladder position) in the NRL from a team level, 16 findings which have been supported by other recent team level studies of RL.21,24,25 Whilst research has identified that manufacturing scoring opportunities enhances the likelihood of success, 16 the current results highlighted that reduced errors in both attack and defence are more important from a positional level. Our findings indicate that it would be beneficial for teams to focus on position-specific, defensive activities during training to aid overall team success. For example, if improving the defensive decisions (Factor 11; intercepts and missed tackles) of Utility Backs (Figure 2) can improve the likelihood of winning from 29.6% (node 30) to 65.2% (node 31), then performance preparation frameworks could prioritise the decision making and tackle selection of such players. This would also support the results of previous research, which highlighted that in conjunction with maintaining possession and generating scoring opportunities, defensive efficiency was important for team success in the NRL. 25
The results of the exhaustive CHAID highlighted that the response variables chosen for this study had a greater influence over the positional influence on match outcome than any of the technical skill metrics previously reported. 12 This indicates that additional analyses could be used to enhance our current understanding of the relationship(s) that might exist between the technical performance of various positional groups and how this may influence match outcome, as at present, just three of the fourteen PIs were retained in the model. Although, the model does provide novel insight into how different positional groups, PIs and response variables interact to influence team performance. Further to this, the interpretations of these insights may then be dictated by the style of play for a specific team, or whether it is being viewed from the perspective of an offensive or defensive oriented coach (as per previous examples above). Nevertheless, the model outputs can offer interpretable insight for coaches in understanding how different PIs (and contextual factors) contribute to positional and team performance, enabling tactical insight for coaching and performance staff, specifically regarding team selections, training and game-planning.
This study is not without limitations that require brief recognition. Firstly, it is worth considering that different clubs each have a unique way of playing and thereby will inherently utilise their personnel differently. The results of the study offer an abstract and generalisable insights, however the nuanced interactions (e.g. manipulating play the ball speed in defence to reduce the likelihood of opposition teams scoring) that may occur at a team level may be more practical, which may require further investigation. Secondly, given recent rule changes introduced in the 2020/21 seasons (e.g. ‘six again’ and reduced scrums), and the varying implications of COVID-19, it is possible that the way in which different positional groups are utilised has changed relative to the sample used within this study. It would be interesting for follow up work to, therefore, explore differences in competition trends before and following COVID-19 restrictions. Thirdly, the data utilised in this study was discrete, and thus insights should be made relative to its nature. The addition of spatiotemporal data, for example, may add further depth to what was offered here through the consideration of context surrounding the noted action.
Conclusion
This study modelled the relationship between match-related contextual factors on positional performance and match outcome in the NRL. A moderate level of classification accuracy was observed, justifying the use of this approach for further examination into the interaction between positional performance, match factors and success. Defensive actions and poor attacking skill significantly influenced match outcome greater than PIs that helped generate scoring opportunities in attack. Further, interchange forwards, utility backs and adjustables independently impacted upon the likelihood of team success when compared to forwards, interchange players and backs. These results offer coaches and analysts in the NRL with interpretable and practically useful insight to complex interactions.
Supplemental Material
sj-docx-1-spo-10.1177_17479541221092525 - Supplemental material for Effect of match-related contextual factors on positional performance in the national rugby league
Supplemental material, sj-docx-1-spo-10.1177_17479541221092525 for Effect of match-related contextual factors on positional performance in the national rugby league by C. J. Wedding, M. A. Gomez, C. T. Woods, W. H. Sinclair and A. S. Leicht in International Journal of Sports Science & Coaching
Footnotes
Acknowledgements
The authors would like to thank the North Queensland Cowboys Rugby League Football Club for their support of this study. The authors also wish to acknowledge the National Rugby League for granting access to the notational data presented in this manuscript.
Declaration of conflicting interests
The author(s) declared no potential conflicts of interest with respect to the research, authorship, and/or publication of this article.
Funding
The author(s) received no financial support for the research, authorship, and/or publication of this article.
Supplemental material
Supplemental material for this article is available online.
References
Supplementary Material
Please find the following supplemental material available below.
For Open Access articles published under a Creative Commons License, all supplemental material carries the same license as the article it is associated with.
For non-Open Access articles published, all supplemental material carries a non-exclusive license, and permission requests for re-use of supplemental material or any part of supplemental material shall be sent directly to the copyright owner as specified in the copyright notice associated with the article.