
Abstract
The aim of this study was to explore the match and technical indicators between winning and losing women's teams in the Olympics and World Championships (2016–2021) depending on the final score of the matches and to compare the winners’ technical indicators in 3-set matches to those of men in the respective competitions. A total of 281 volleyball matches were analyzed from the Women's Olympics (2016 and 2021) and World Championships (2014 and 2018). Discriminant function analysis determined which skill(s) contributed significantly to winning matches in every type of score. This study showed that the teams that won 3-0 and 3-1 matches had better performance in all scoring skills (serve, attack, block, and opponent errors) compared to their opponents, while the opponents’ errors did not affect the result. In 5-set matches, block points were the main predictor of a team's success. In conclusion, the results of the women's teams at the highest level of volleyball matches, show that different performance indicators determine the match outcome. The attack is not the only skill that increases the probability of winning a match, since block and serve to contribute equally significantly. Furthermore, in 5-set matches, blocking is the technical skill that differentiates the winning from the losing teams. Finally, in 3-set matches, it seems that the performance indicators differ between women and men in attack efficiency, block, and opponent error points.
Introduction
The Olympic Games and the World Championship are the most important international women's volleyball competitions, held every four years since 1964 and 1952, respectively. A total of 12 women's teams participate in the Olympic Games, while 24 teams from all continents participate in the World Championship. 1
The analysis of matches in team sports through data entry is an important tool for coaches and athletes, as the performance during the match is quantified and analyzed and can reveal the most important parameters that determine victory over defeat. 2 The evolution of technology has been extremely useful in volleyball, through software programs that record all the match data and are used by high-level teams via specialized performance analysts. 3 However, the high volume of data collected makes data interpretation more difficult, and data use might remain private or shared between the teams participating in the competitions. On the other hand, simple statistics can easily be transferred to in-court training practice. 4
In volleyball, the match report is used in major competitions and includes team and player statistics, analyzing the frequencies of the different skills and how points are won. 5 The volleyball match report includes the points a team can win from attack, serve, block, and from opponents’ errors in attacking and serving. 6 Using these data, coaches can perform simple calculations to determine frequencies, percentages, efficiency, coefficients, and performance indicators. 7 These data are easily understood by coaches and athletes and used in competitions and training sessions.2,4 These data can also be used by TV commentators to keep volleyball match viewers informed.
Various studies on national and international competitions report that the teams that performed better in attack8–12 and block13,14 won the matches while serve efficiency was less important.15,16 Although most studies were based on the overall data from the matches,8,11,17–21 Giatsis et al. 22 analyzed the matches depending on the final score in the men's Olympics and World Championship competitions. They also used the data from the match reports and the results of the research showed that for 3- and 4-set matches, the attack was the best predictor of the team's success (discriminant function classified correctly >90%), while the block and the serve also played an important part. Nevertheless, in 5-set matches, serve and block points were the main predictors of a team's success.
Women and men vary in some aspects of the volleyball game at a high level.23,24 Female lower- and upper-body absolute muscular strength corresponds only to 72% and 55% of male strength. 25 As men perform higher power values than women in spiking, 26 the men's game is more aggressive than the women's24,27 and this, because women cannot match the same ball speed.28–34
Volleyball is a team sport that consists of two major functionally different but interconnected game complexes. 10 The two types of game complexes are Complex I (serve, reception, setting, and attack) 19 and Complex II (serve, block/defense, and counterattack). 18 This distinction allows coaches and athletes to evaluate their teams’ performance in the two game complexes more accurately and effectively.
From the literature review, it seems that statistics are not distinguished according to the final score in the highest-level women's matches as is the case with men. We believe that such a distinction is necessary in order to properly evaluate the performance of the winning teams, because the benchmarks may vary depending on the final score. We also assume that the performance indicators will be differentiated between women and men.
Therefore, the aim of this study is to explore the performance indicators using the data from the women's match reports in the Olympics and World Championships (2014–2021) depending on the final score of the matches. The purpose of this study was threefold: (a) to examine the contribution of skill parameters to the match result, (b) to determine the best predictor variable(s) in winning a match among scoring skills, and (c) to compare the winners’ technical indicators in 3-set matches to those of men in the respective competitions.
Methods
Sample description
In the Olympic Games and World Championships Volleyball tournaments, a qualified statistician appointed by the event organizers uploads the official match report to the tournament website. This report contains match information such as player details, score and time parameters, player lineup, and players’ performance in volleyball skills. The data collection was performed using the Volleyball Information System 35 created from official statistics and published on the website of the International Volleyball Federation (FIVB).
A total of 281 official match reports were obtained for the data sample from the World Championships in 2014 (n = 102) and 2018 (n = 103), and the Olympic Games in 2016 (n = 38) and 2021 (n = 38). In sum, 281 matches, 1003 sets, and 43,457 points were performed in the four tournaments. The primary recorded and evaluated parameters were: 45,418 serves, 2649 aces, 62,527 attacks, 25,906 kill attacks, 4700 blocks, and 10,202 opponents’ errors. All matches were played using the rally scoring system (RS), where every rally results in a point. 36
Data collection
All the ways in which a team can earn a point were analyzed: attack, serve, and block scoring skills. The points that a team earned due to the opponent's errors (OpErr) were also analyzed (serve errors, attack errors, blocking errors, and incorrect handling of the ball). The criteria for blocking errors were referred to the illegal touch of the net.
In the current study, match and technical performance indicators were analyzed. 37 Match indicators were the points earned by each scoring skill (attack, serve, and block) and opponents’ errors, and technical indicators were attack efficiency, serve efficiency, block per match points, and opponents’ errors per match points. The efficiency value was calculated as the sum of successful attempts divided by the total sum of the same skill, and for block and opponents’ errors as the fraction of the points earned by the team divided by the total sum of both teams’ set points.
The teams’ performance was classified according to the type of final score (3-0, 3-1, 3-2) and match result (win–loss). A volleyball expert scout recorded 10 matches from every tournament (14% of the total sample) in a special Microsoft Excel worksheet, 38 and the reliability of data recording presented almost perfect intra-observer Cohen Kappa values between 0.93 and 0.98 (1.00 for serve, 0.98 for attack, 0.95 for block, and 0.93 for opponents’ error).
Statistical analyses
Descriptive statistics were applied to determine means and standard deviations for matches won and lost, and for the three types of the final score for each independent variable. An ANOVA was used for match and technical indicators to compare the differences of the selected variables between winning and losing women teams in all types of the final score. Also, an ANOVA was used to compare the difference between women’s and men's winning teams in 3-set match technical indicators (men's data from Giatsis et al., 2022).
22
Effect sizes (ES) based upon partial eta squared
Furthermore, the contribution of the match and technical indicators to winning in each type of final score match was identified using two stepwise discriminant analyses (DA). The DA were planned to determine three items in each type of final score match: (a) which variables were the best predictors of the team winning, (b) the discriminant function that best distinguishes winning from losing in a volleyball match, and (c) the accuracy of the equation that best discriminated success in a volleyball match. The magnitudes of structure coefficient (SC) loadings larger than 0.30 were meaningful, indicating that the respective independent variables contributed substantially to the separation of the dependent variable's different levels. 40 Absolute loadings were defined as follows: >0.32 poor, >0.45 fair, >0.55 good, >0.63 very good, and >0.71 excellent. 41 Jack-knifed was used to reduce bias in the classification. 39 The eigenvalues >1 indicate a good model, such as canonical correlation high values imply a high level of association between the groups in the dependent variable and the discriminant function. In order to represent graphically the importance of selected key performance indicators, a Scatterplot was created and the accuracy of the discriminant function with regard to the main variables was depicted. Statistical tests were performed with SPSS (version 27) at a significance level of a = .05.
Results
Descriptive statistics of the match indicators for the factor set result, results of the ANOVA (F-value), significance value (P-value) and effect size are presented in Table 1. All the match indicators were significantly different (P ≤ .001) in 3- and 4-set matches as winners won more points than losers. However, in 5-set matches only the block points match indicator was significantly different (P ≤ .05). Figure 1 shows a visual summary of the match indicators (including outliers).
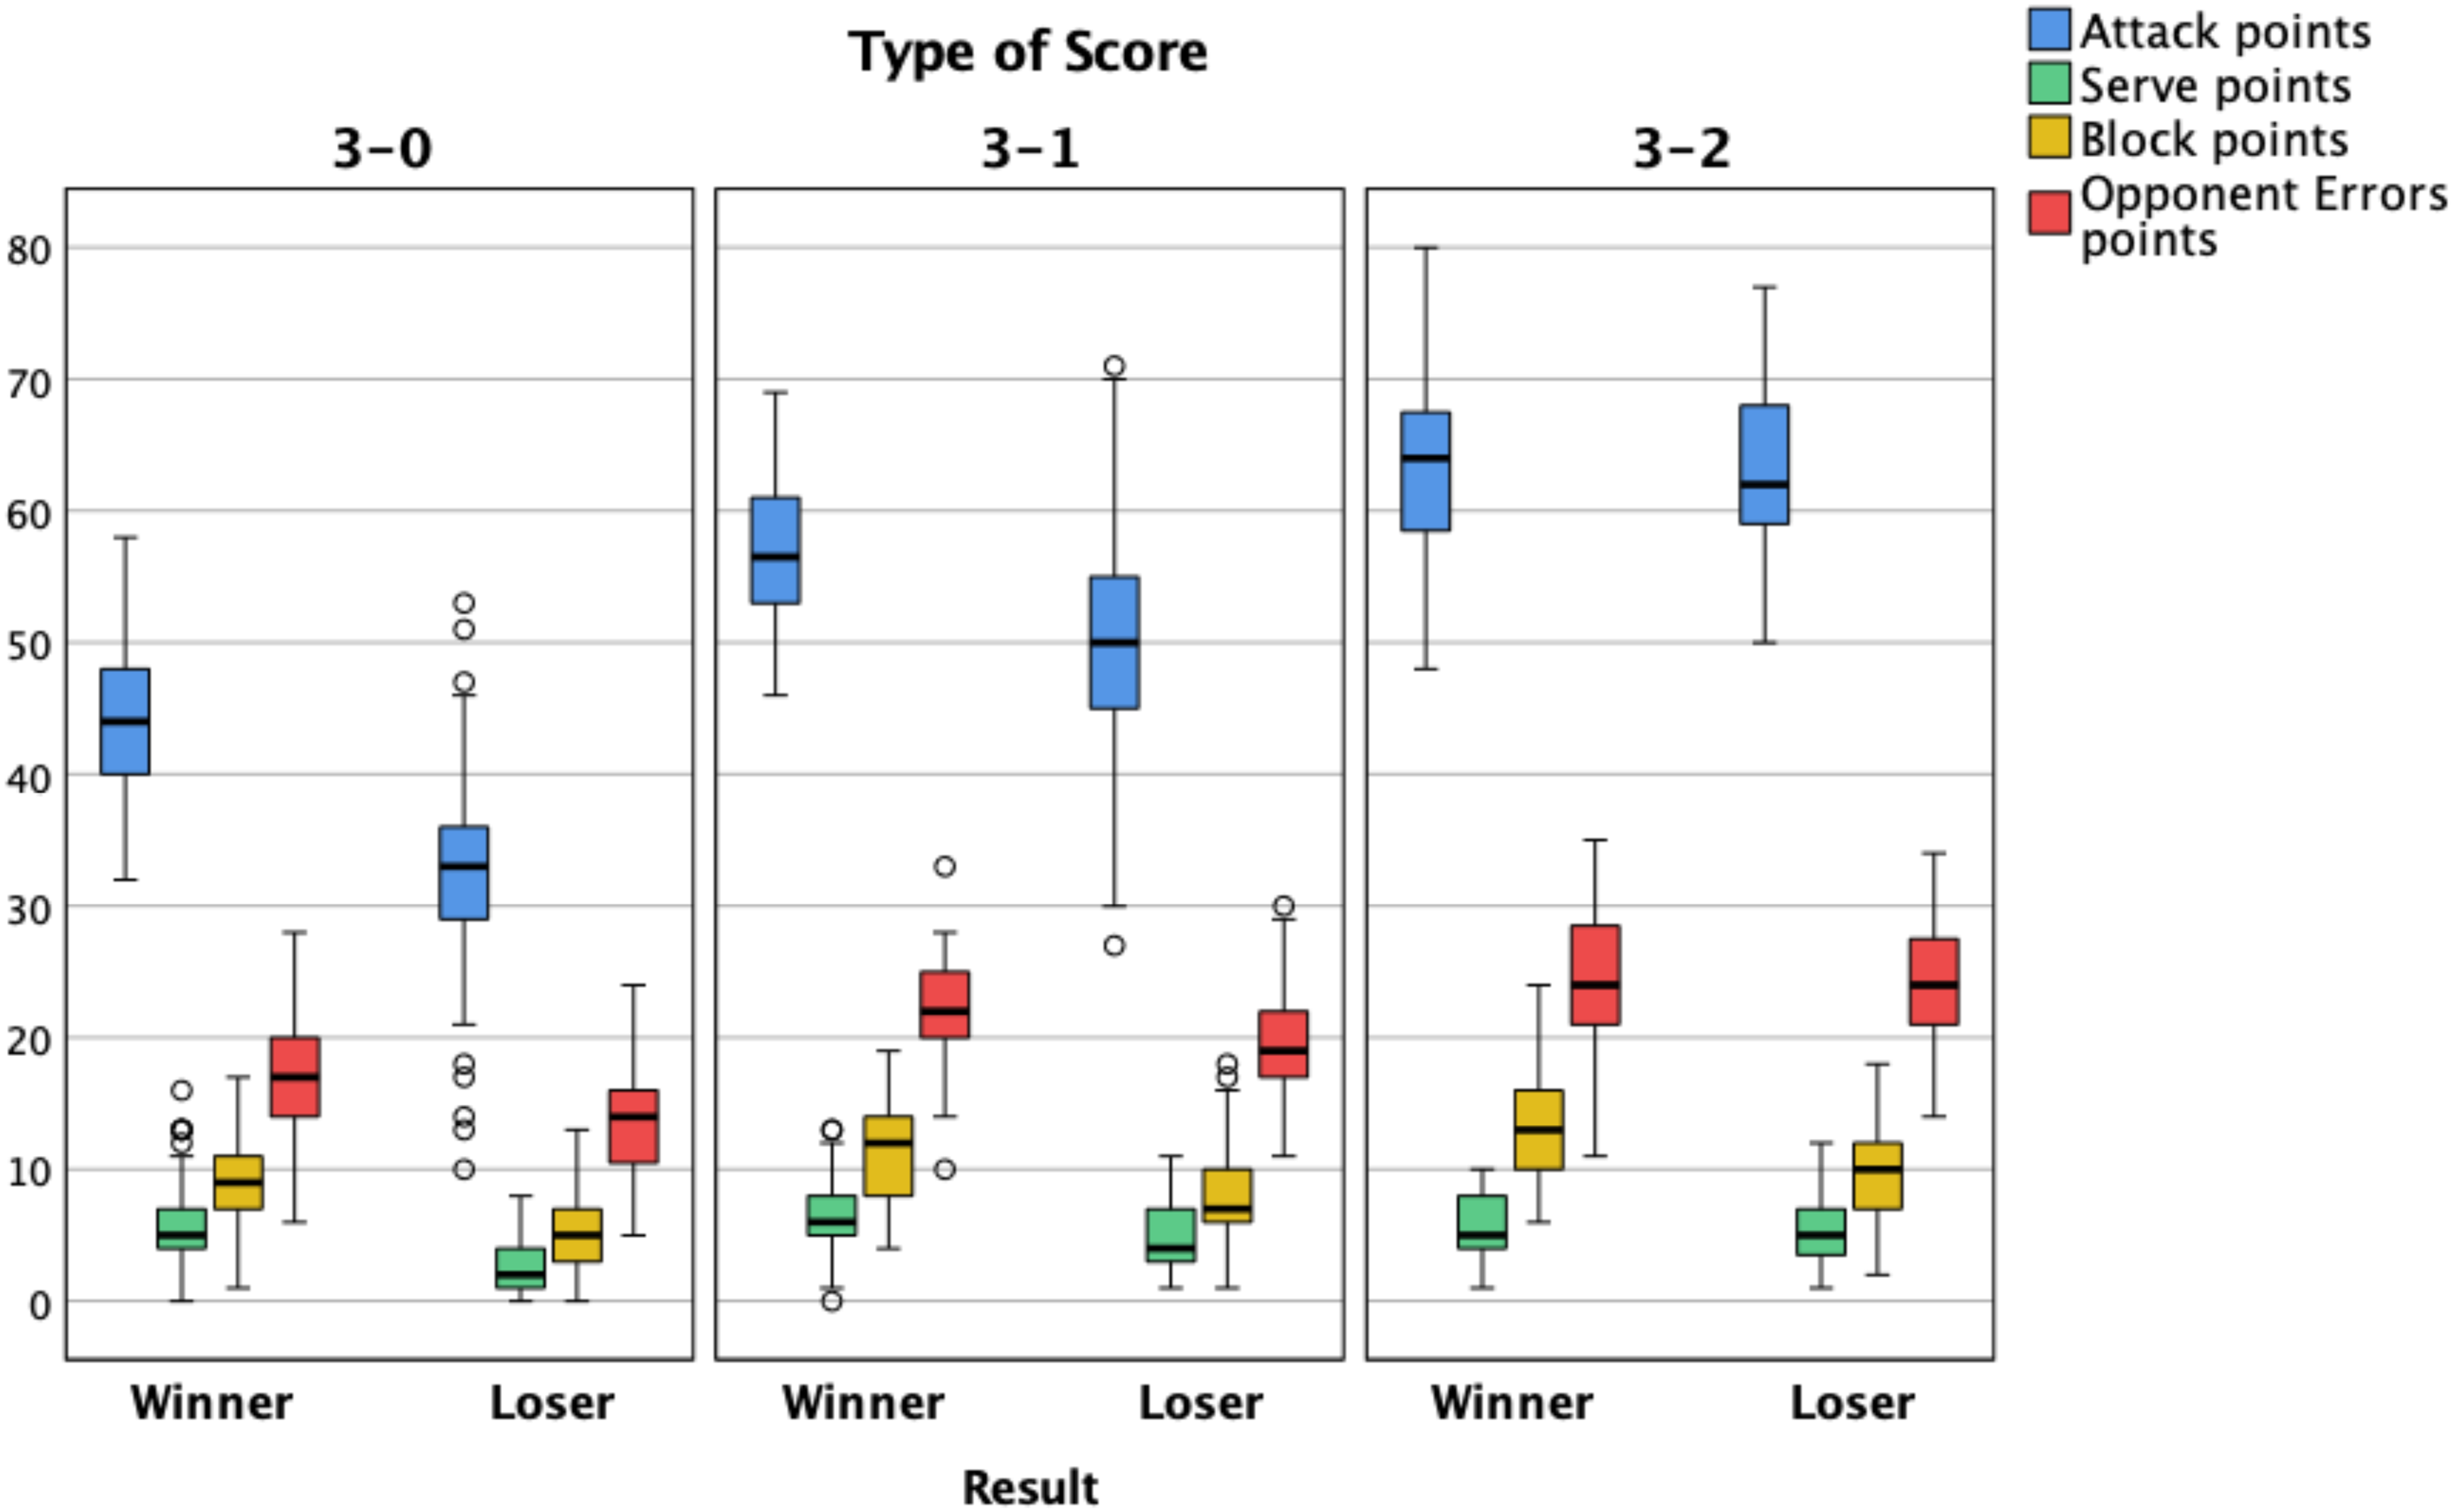
Boxplot of match indicators of all score types for the factor set result.
Means (M) and standard deviations (SD) of match indicators for the factor set result.
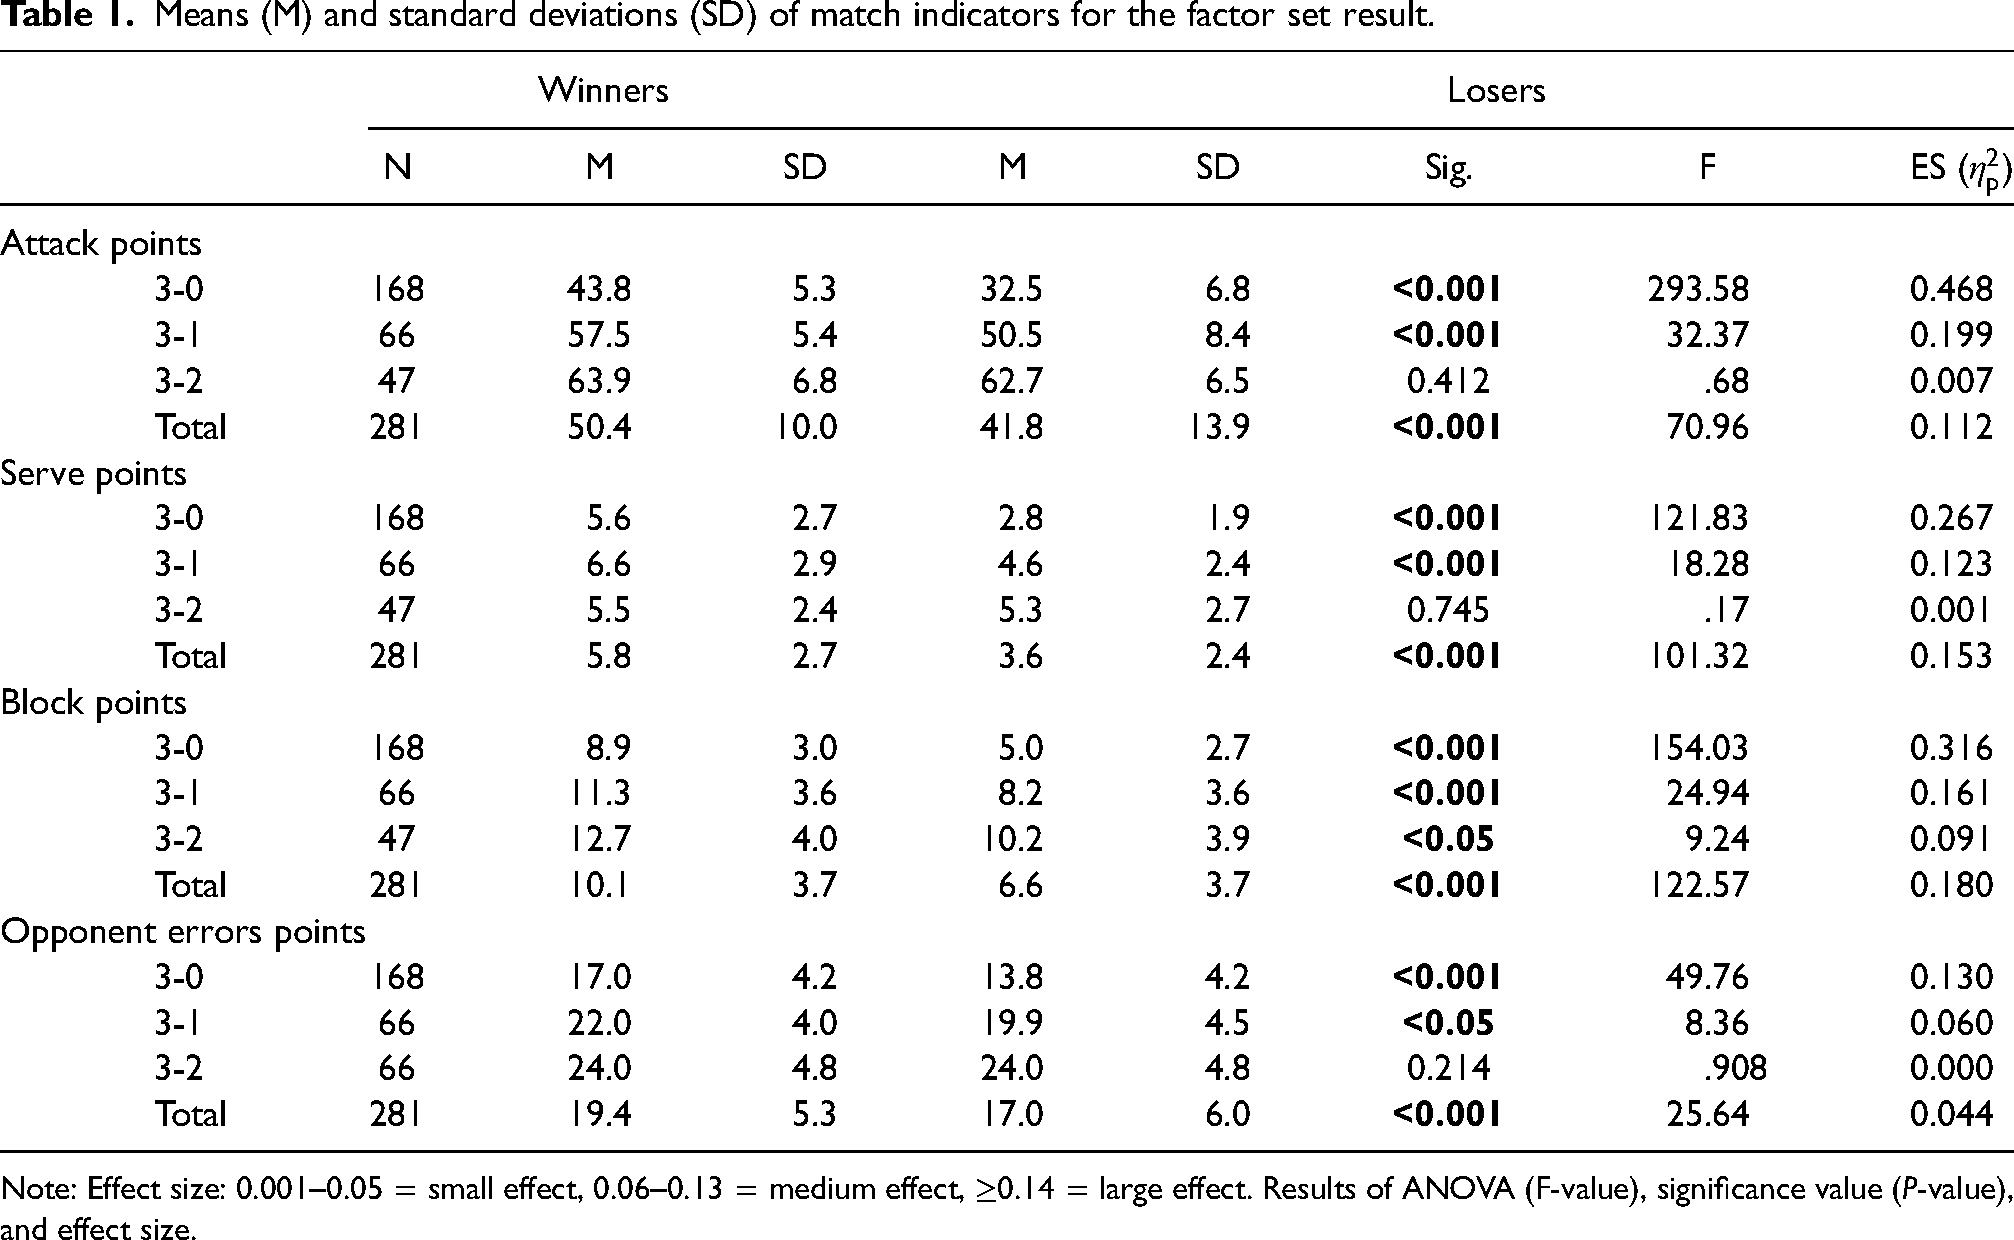
Note: Effect size: 0.001–0.05 = small effect, 0.06–0.13 = medium effect, ≥0.14 = large effect. Results of ANOVA (F-value), significance value (P-value), and effect size.
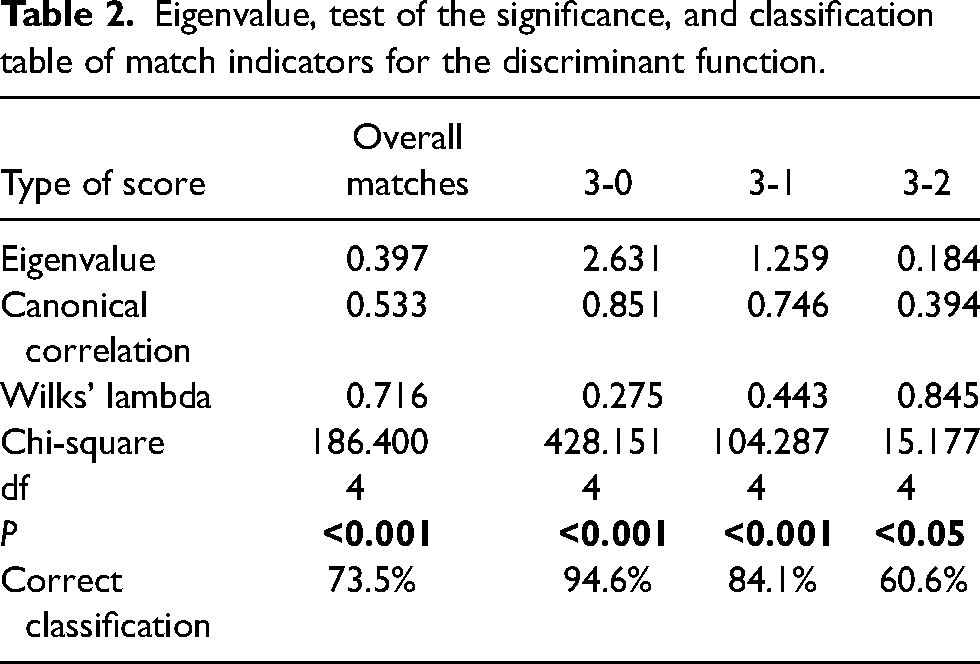
Table 2 presents the eigenvalues, canonical correlations, chi-square values, respective significances, and correct classifications of the discriminant functions. The discriminant functions were statistically significant (P ≤ .001) for 3-0 and 3-1 matches, and (P ≤ .05) for 3-2 matches, while there was a progressive decrease in these statistics between match types as the number of match sets increased. Specifically, the canonical correlation values decreased from 0.851 to 0.394 and the corresponding classifications between winning or losing a match fell from 94.6% for a 3-0 match to 60.6% for a 3-2 match, indicating that the function's discriminatory power decreases as the number of sets increases and vice versa.
Eigenvalue, test of the significance, and classification table of match indicators for the discriminant function.
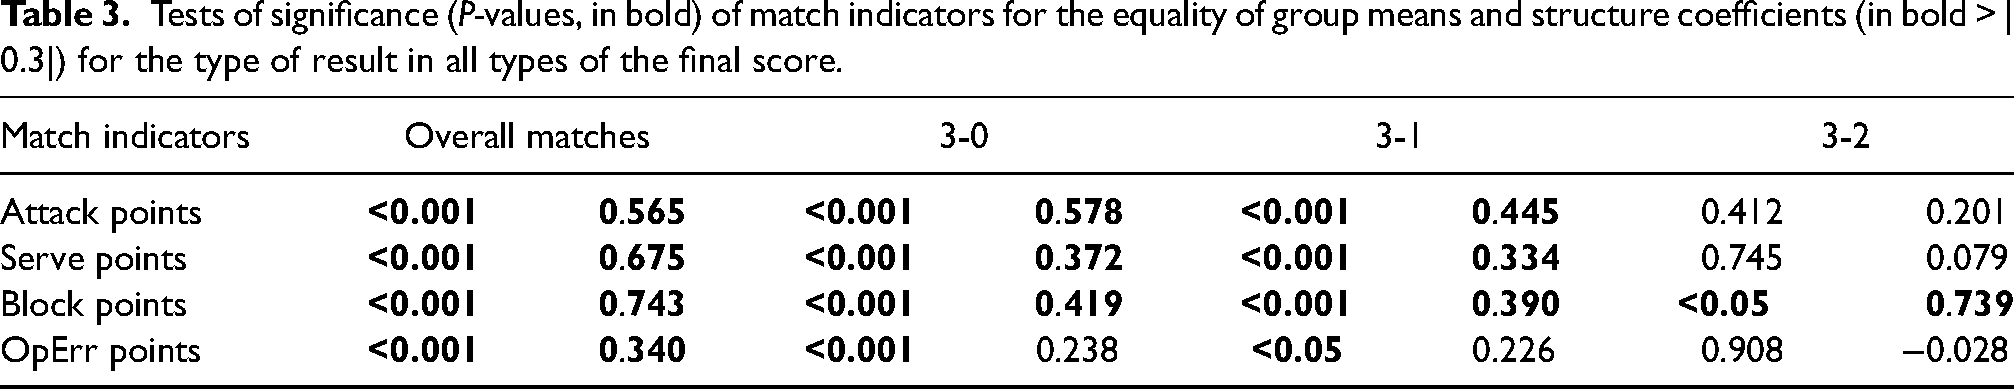
The discriminant function coefficients and the relative contribution of each match indicator in maximizing the multivariate difference for the type of result (winning or losing) were investigated (Table 3). The attack, block, and serve indicators possessed a meaningful SC for the 3- and 4-set matches, while only the block indicator possessed a meaningful SC for the 5-set matches. Therefore, the only common indicator across all match types was block points, which also differ according to the type of final score. The dominant SC value of the attack points indicator for the 3- and 4-set matches (0.578 and 0.445, respectively) indicated that 33% and 20% (squared SC values) of the variance, respectively, is accounted for by each discriminant function. For 5-set matches, the SC value of the block points indicator (0.739) was the highest, and 55% of the variance is accounted for by the discriminant function.
Tests of significance (P-values, in bold) of match indicators for the equality of group means and structure coefficients (in bold > |0.3|) for the type of result in all types of the final score.
Scatter plots present (Figure 2) the accuracy of the discriminant function of the importance of attack, serve, and block points indicators. Attack points are shown on the y-axis, serve points on the x-axis, and block points on the z-axis. The predicted group labels for the factor score result are also presented.
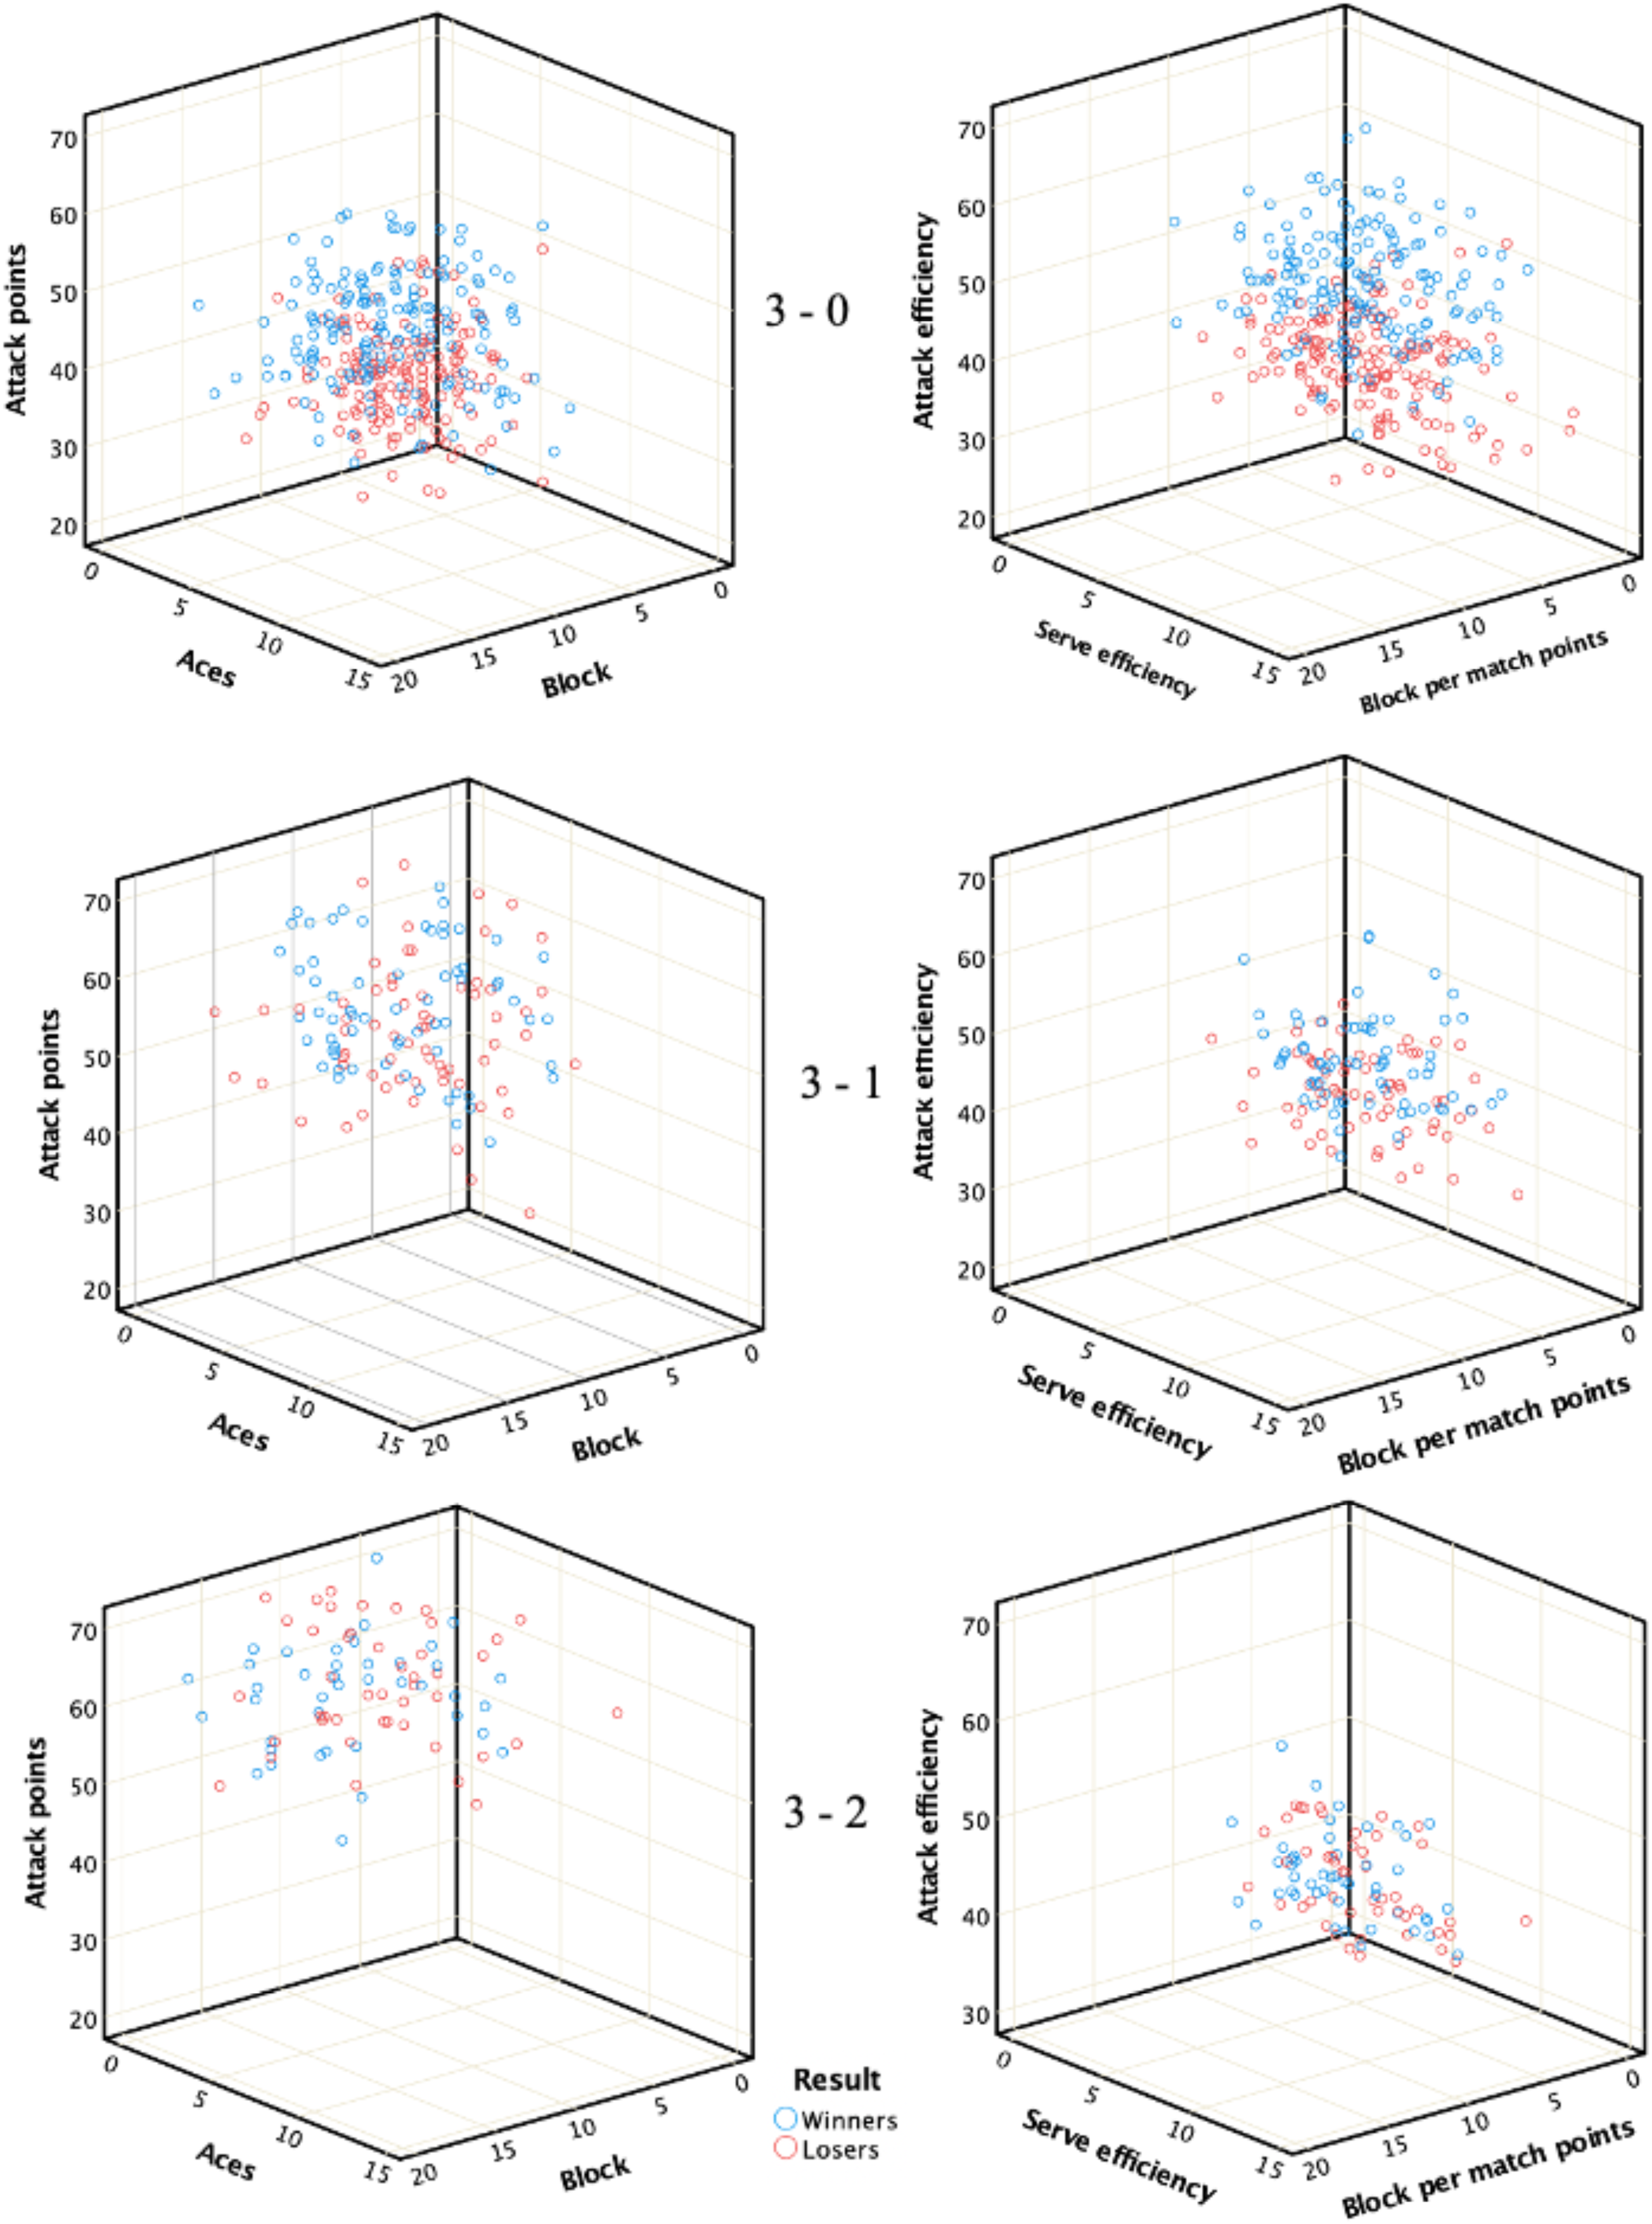
Scatter plot with values of the match point indicators (left column) and technical indicators (right column) and labels of the predicted group (blue for winners and red for losers) for all types of final score.
Technical indicators
Descriptive statistics of the technical indicators for the factor set result are presented in Table 4. The ANOVA results (F-value), significance value (P-value), and effect size are also displayed. All the technical indicators were significantly different (P ≤ .001) in 3- and 4-set matches as winners had a higher value percentage than losers. However, in 5-set matches only block per match point technical indicator was significantly different (P ≤ .05). The technical indicators are visually summarized in Figure 3 (including outliers).
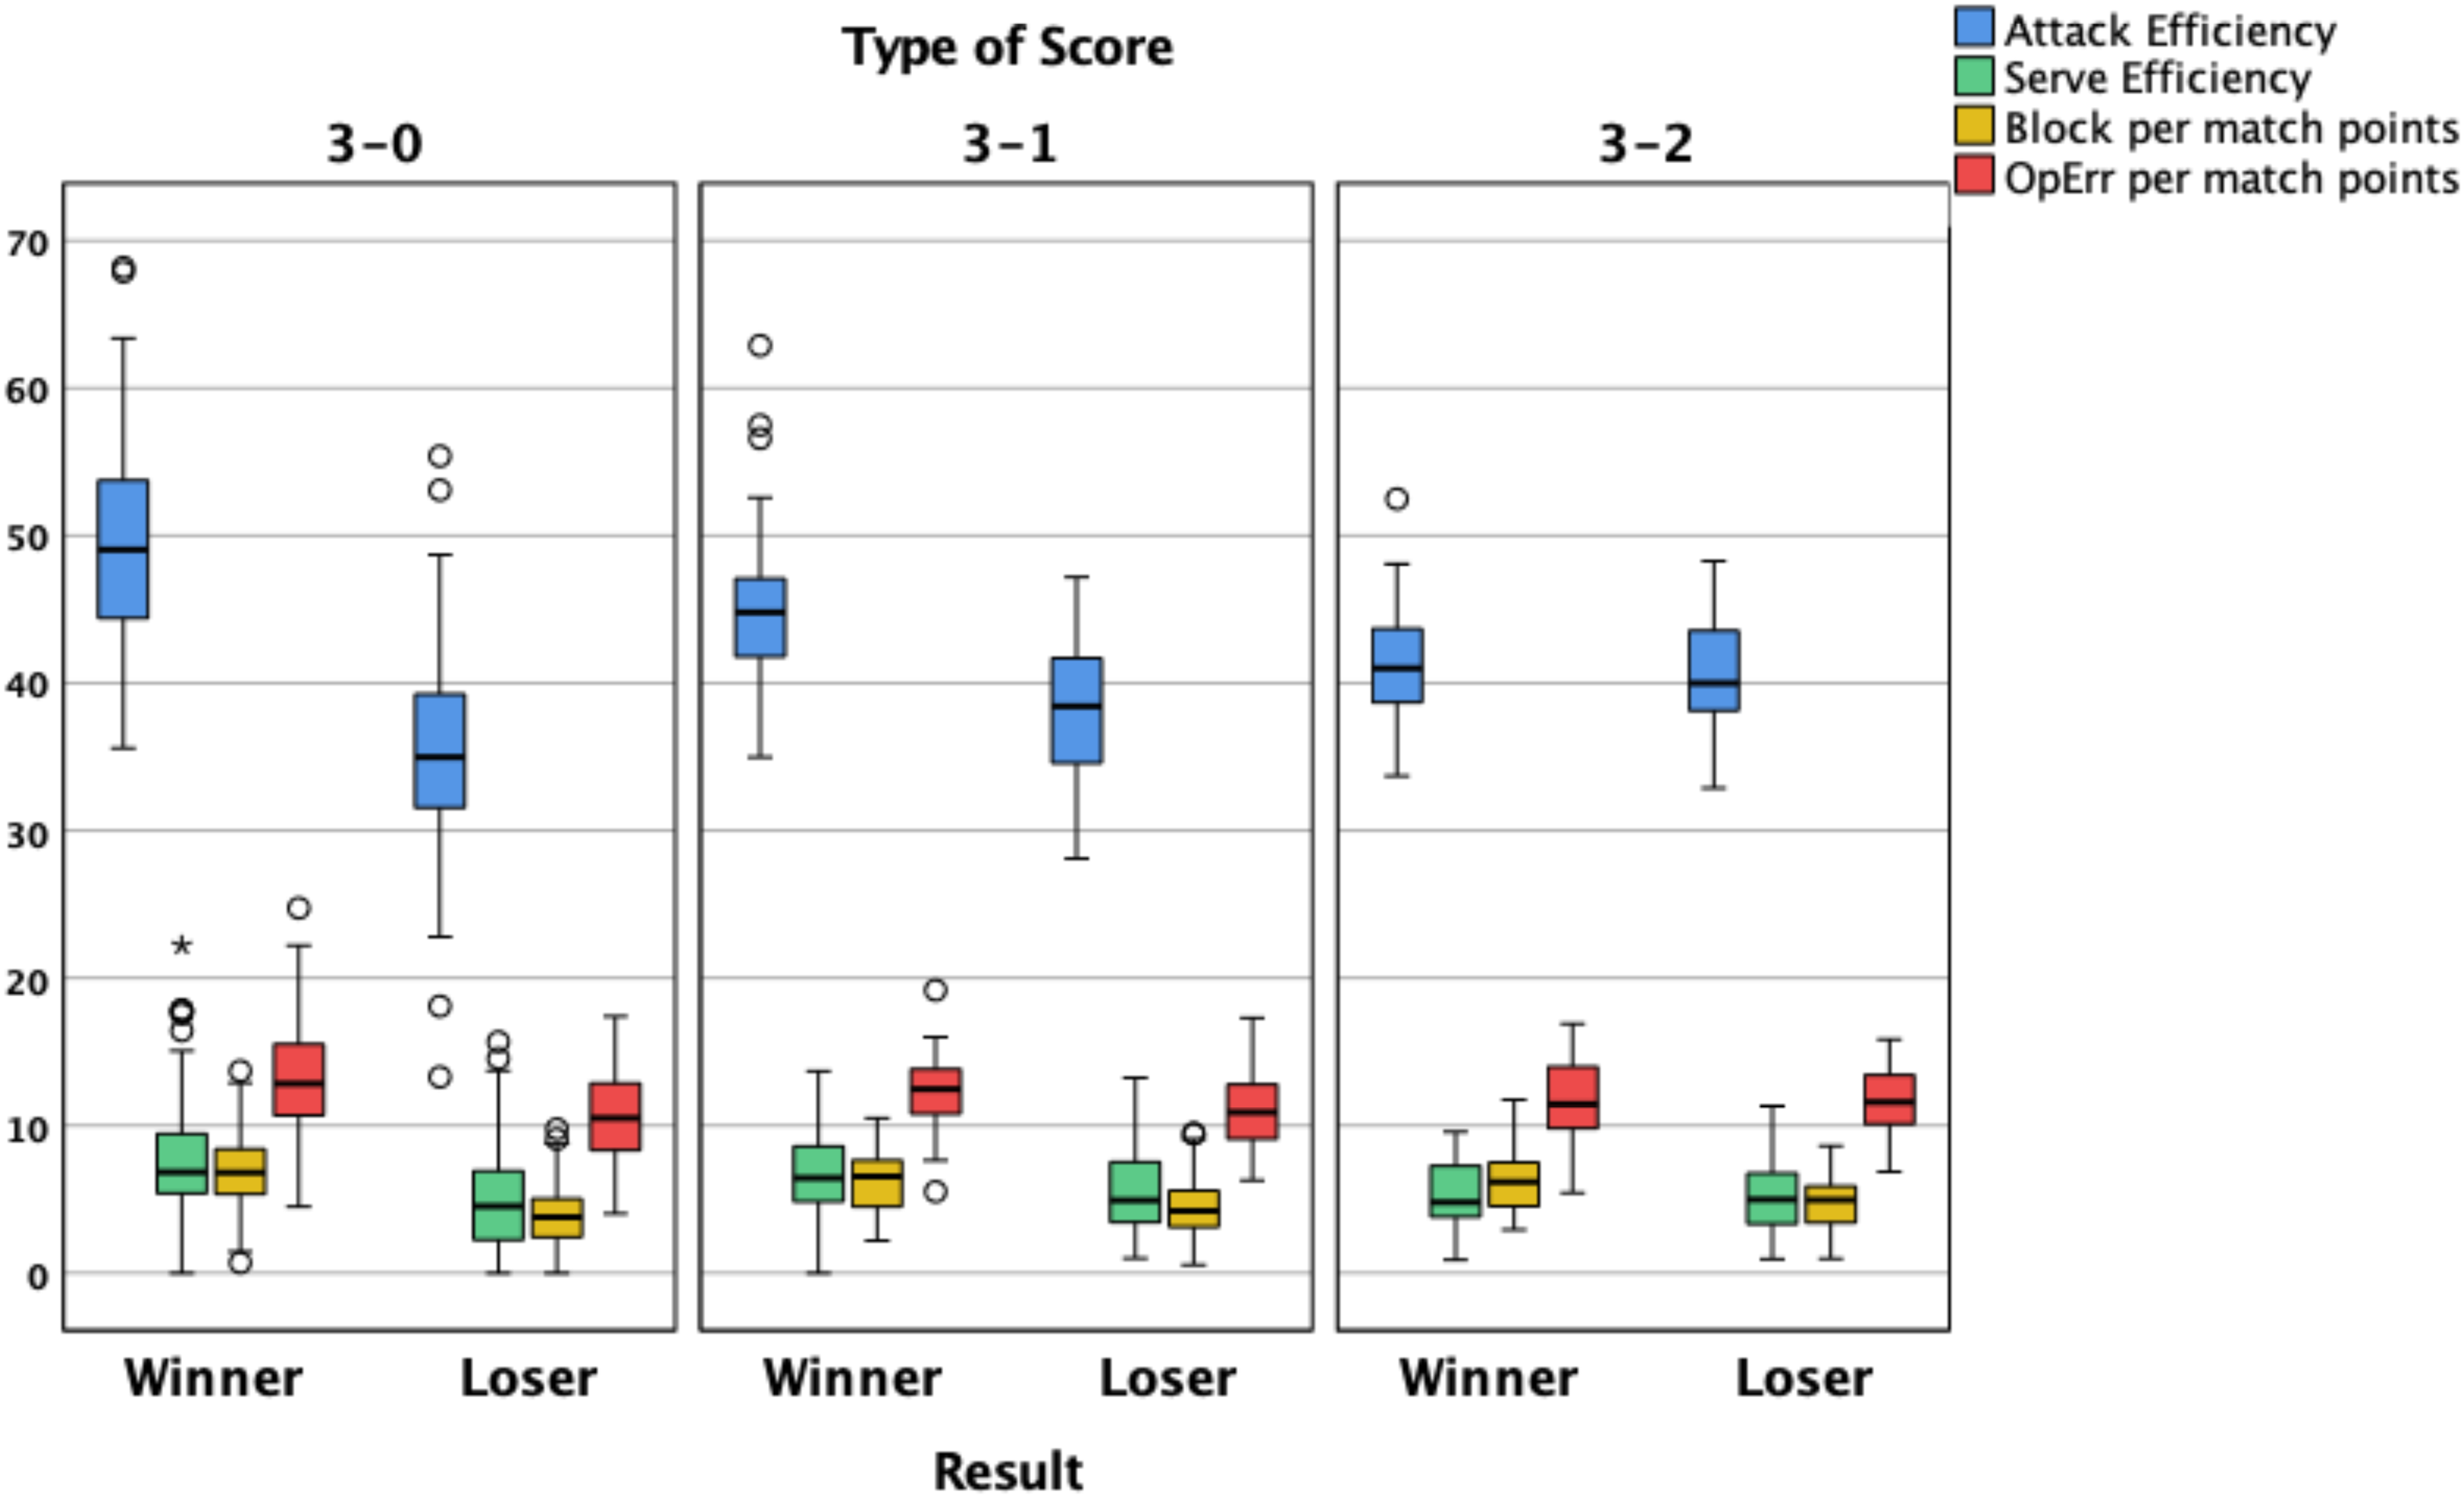
Boxplot of technical indicators for all types of the score for the factor set result.
Means (M) and standard deviation (SD) of technical indicator percentages for the factor set result.
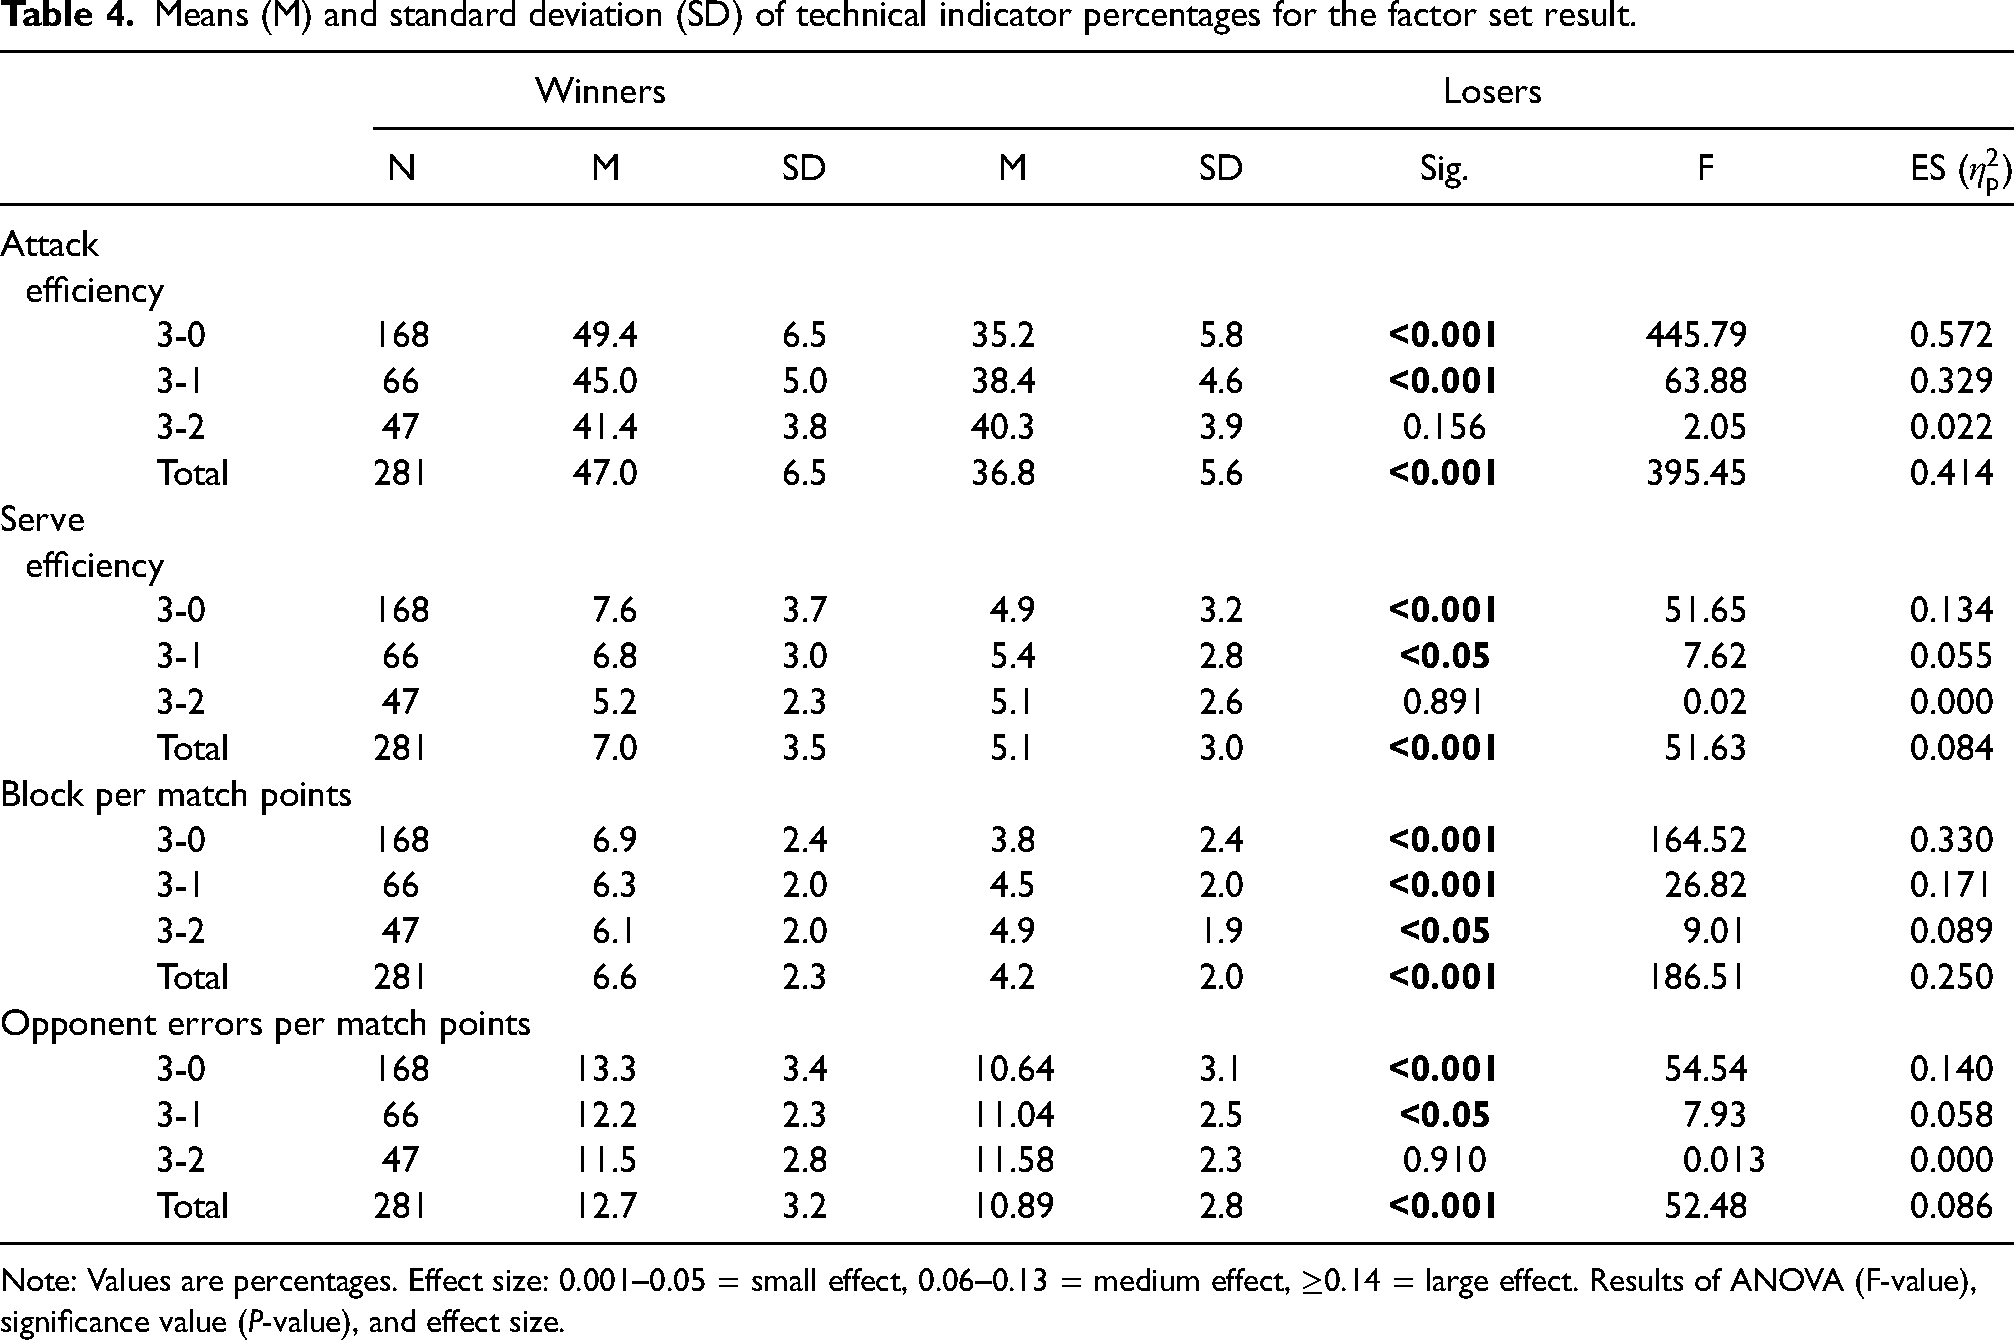
Note: Values are percentages. Effect size: 0.001–0.05 = small effect, 0.06–0.13 = medium effect, ≥0.14 = large effect. Results of ANOVA (F-value), significance value (P-value), and effect size.
Table 5 shows the discriminant functions’ eigenvalues, canonical correlations, chi-square values, relative significances, and correct classifications. The discriminant functions were all statistically significant (P ≤ .001 for 3- and 4-set and P ≤ .05 for 5-set matches) and it seems clear that there is a decrease in statistics as the number of sets increases. Canonical correlation decreased from 0.834 to 0.341 and the corresponding classifications between winning or losing a match decreased from 94.9% for a 3-0 match to 89.4% for a 3-1 match and 63.8% for a 3-2 match, meaning that as the number of sets increased the discriminatory power of the function decreased.
Eigenvalue, test of significance, and classification table of technical indicators for the discriminant function.
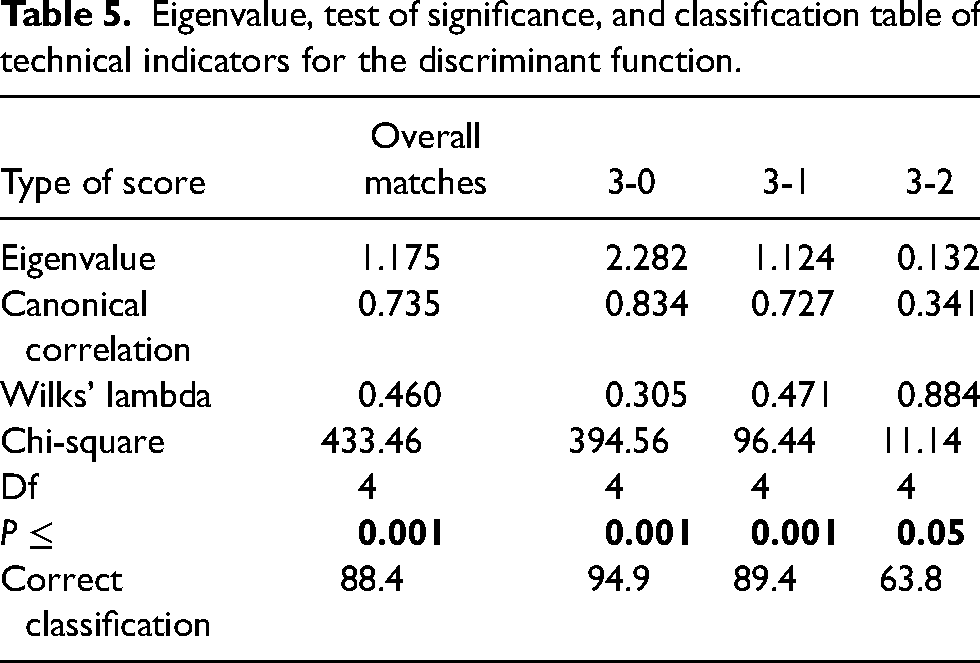
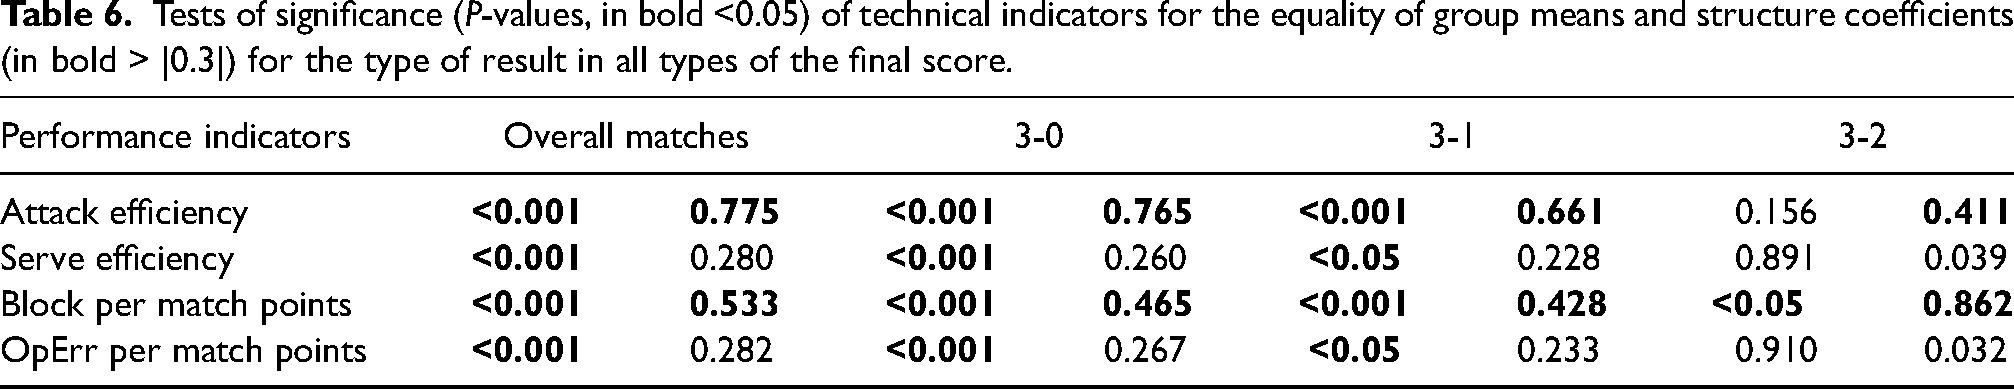
Table 6 presents the relative contribution of each match indicator in maximizing the multivariate difference for the type of result (winning or losing), and the discriminant functions coefficients. Attack efficiency and block indicator percentages possessed a meaningful SC for the 3-, 4-, and 5-set matches. Therefore, attack efficiency and block percentage were the only common indicator across all match types and differs according to the type of final score. The dominant SC value was the attack efficiency indicator for the 3- and 4-set matches (0.765 and 0.661, respectively), indicating that 59% and 44% (squared SC values) of the variance, respectively, is accounted for by each discriminant function. However, for the 5-set matches, the SC value for the block percentage indicator (0.862) was the highest with 74% of the variance accounted for by the discriminant function, while the SC loading magnitude for the attack efficiency was 0.411 with 17% of the variance accounted.
Tests of significance (P-values, in bold <0.05) of technical indicators for the equality of group means and structure coefficients (in bold > |0.3|) for the type of result in all types of the final score.
Scatter plots (Figure 2) present the importance of attack and serve efficiencies and block percentage, in the accuracy of the discriminant function. Values of attack efficiency are shown on the y-axis, serve efficiency on the x-axis, and block per match points on the z-axis. The predicted group labels for the factor result are also presented.
Comparing the overall match technical indicators from the data on women and men in the respective Olympics and World Championship competitions (2014–2021), ANOVA revealed that there was a statistically significant difference (P ≤ .001) between attack efficiency (F(1, 297) [91.94], P ≤ .001), opponent errors per match points (F(1, 297) [32.15], P ≤ .001), and block per match points (F(1, 297) [6.53], P = .011) (Figure 4).
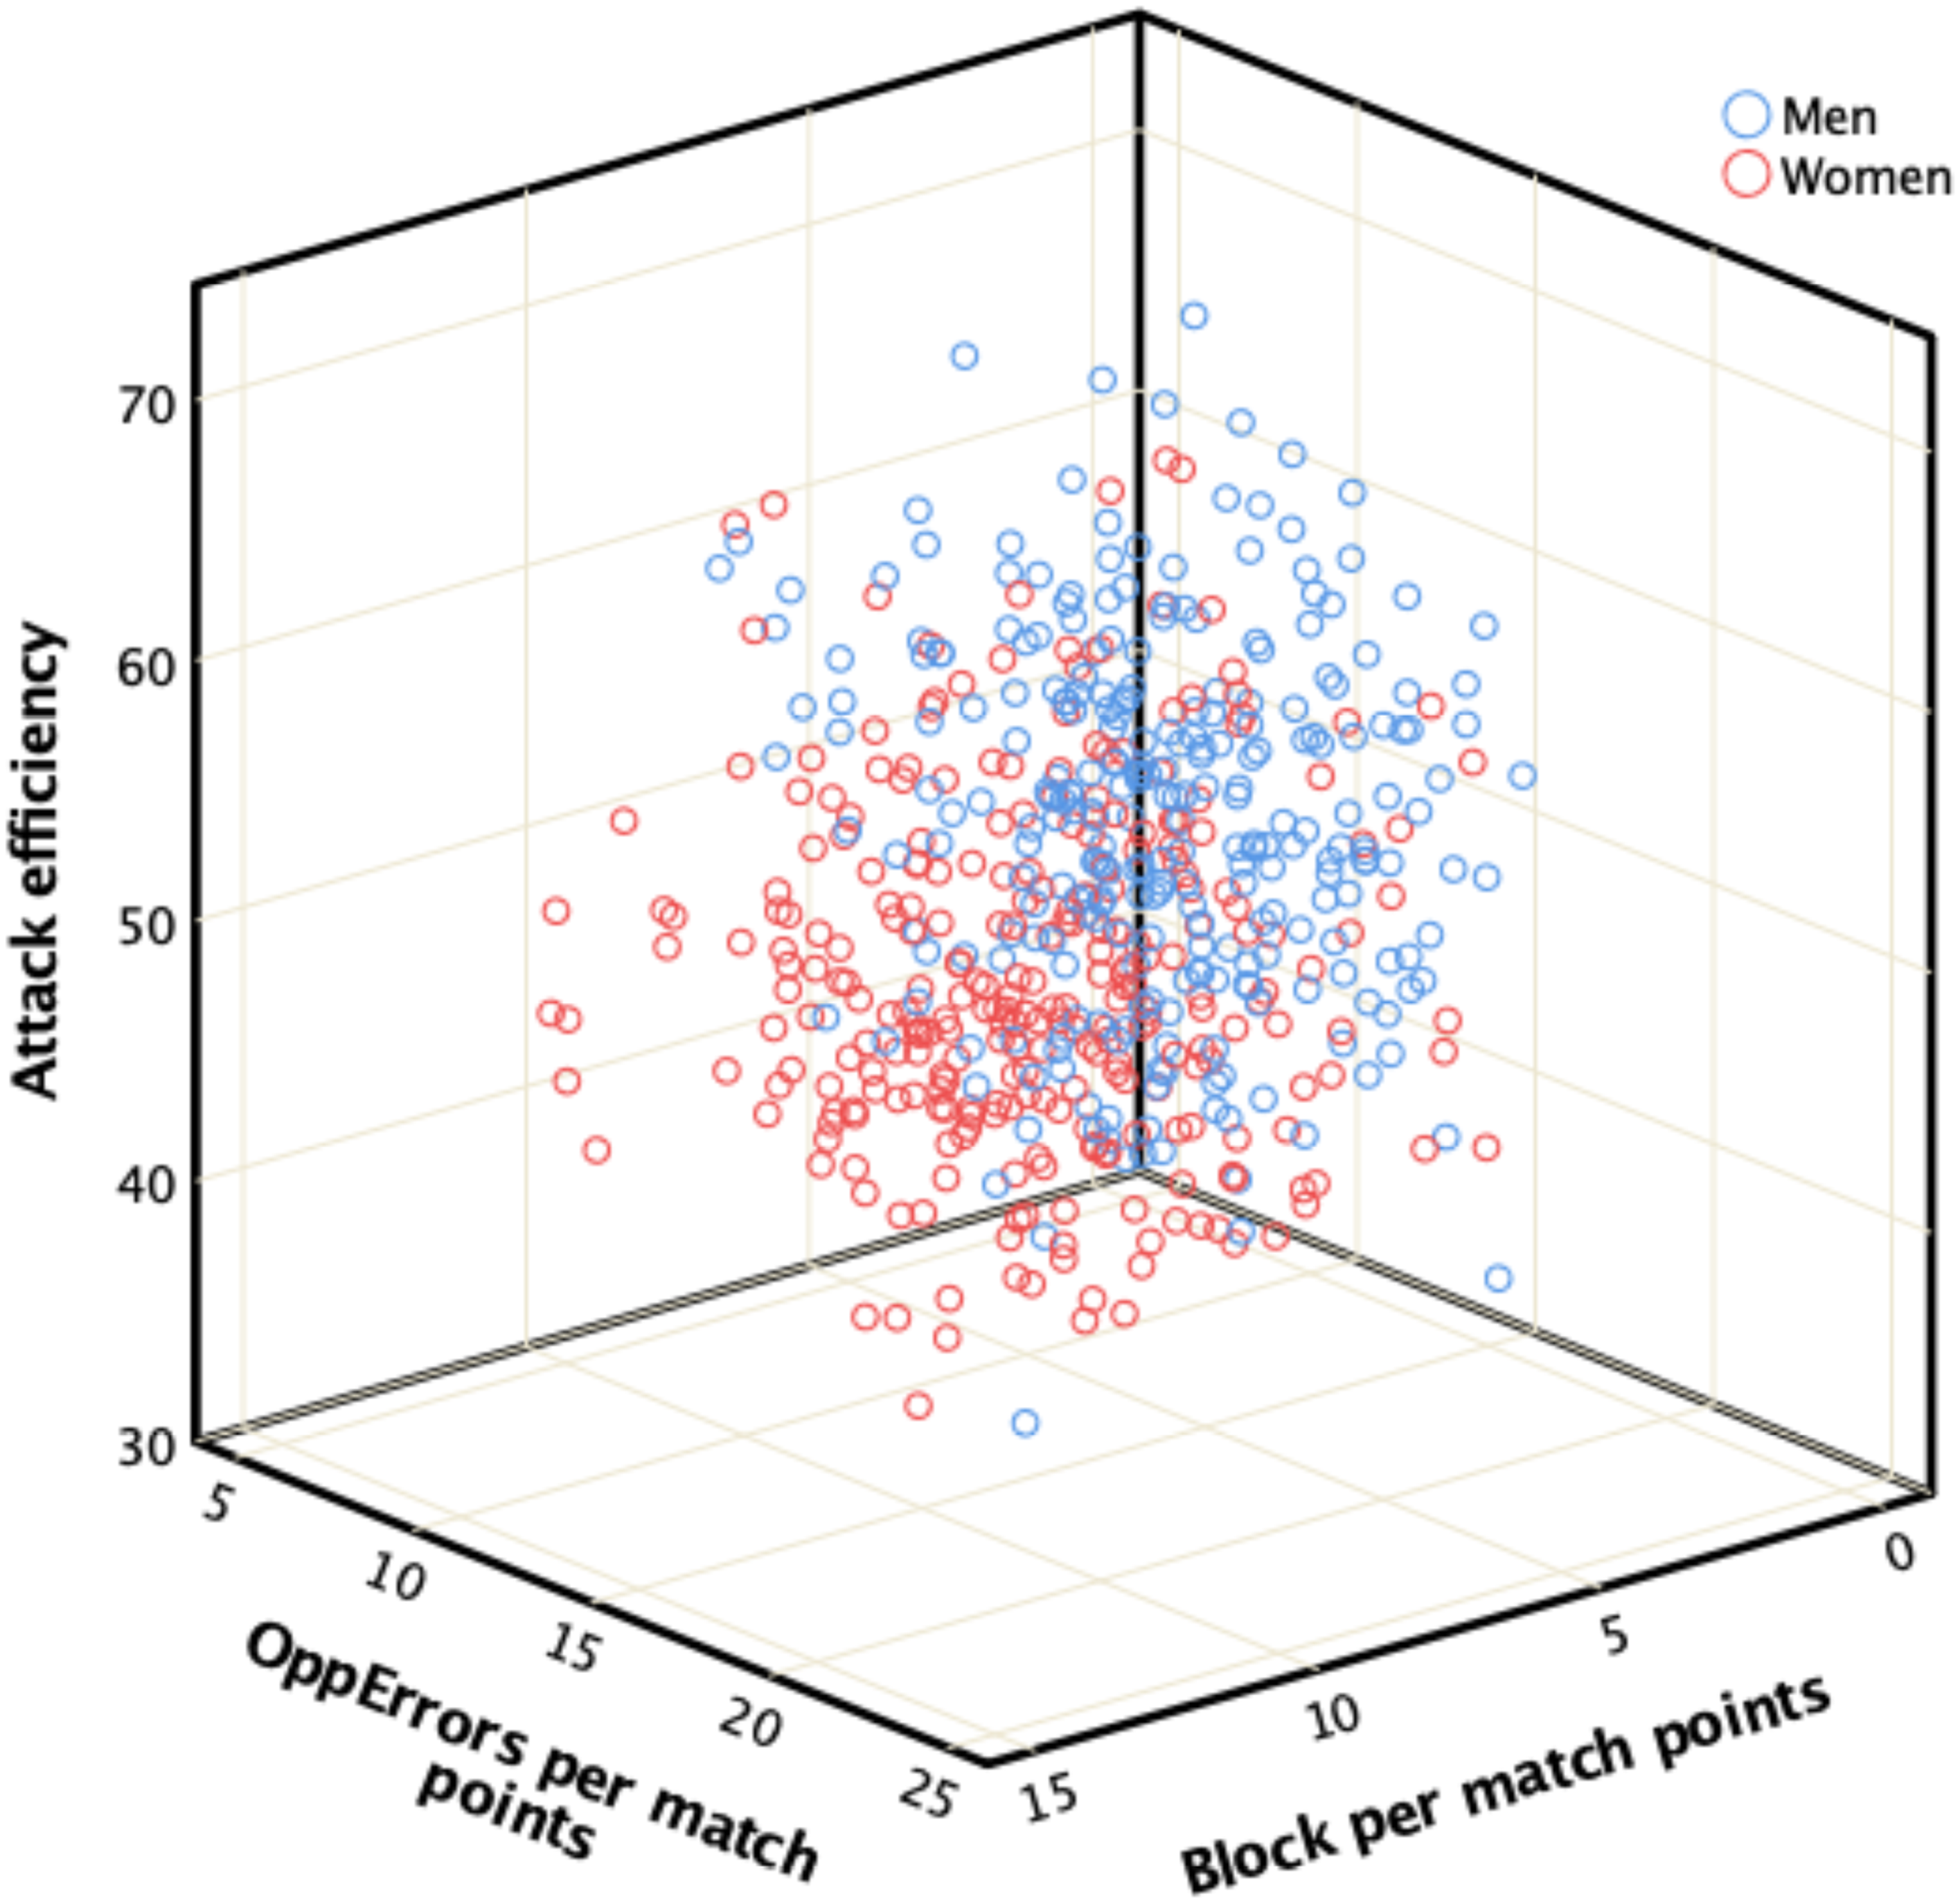
Scatter plot with values of the winners’ technical indicators and labels of the predicted group (blue for men and red for women) for 3-0 matches.
Discussion
The aim of this study was to explore which performance indicators contributed to winning a match with various types of scores, using the match report data of women's Volleyball Olympics and World Championships (2014–2021). Match and technical indicator types of performance were analyzed to identify which were the best predictors for winning a match and which classified the cases more accurately. The match points and technical indicators presented the highly correct classification in 3-set (94.6% and 94.9%) and 4-set (84.1% and 89.4%) matches, respectively. However, the findings of this study show that the correct classification decreased as the number of sets increased. For the 5-set matches, the match points and technical indicators presented corrected classification 60.6% and 63.8%, respectively. These findings agree with the national women's championship which found that, as the difference in points between the two teams decreases, the correct classification decreases too. 42 The results in high-level women's volleyball revealed that winning teams had higher match indicator values in 3- and 4-set matches in all scoring skills. However, in 5-set matches, winners differ from losers only in the blocking skill.
The importance of serving in women's volleyball has been reported in various studies.17,43 The results of the present study agree with the previous findings, as to serve points and serve efficiency indicators, were significant in 3-set and 4-set matches, but not in 5-set matches. This may be happened due to the ability of teams to receive the serve more effectively in balanced 5-set matches, as the average aces were 1.1 points for winner and losers’ teams in each set. This differs from men's high-level volleyball in corresponding competitions, as it was the most significant indicator in 5-set matches. 22 The highest percentage of jump serves used by men (75%) compared with women (4.9%) could explain this significant difference. 44
On the contrary, with serve for 5-set marches, 2.5 more points in block or a + 1.2% increase of block per point percentage in winners compared with losers, increases the probability of winning a match. Despite the lower correct classification in 5-set compared with 3-set and 4-set matches, winners differ significantly (P < .05) mostly due to their higher blocking skill values. A previous study 14 on men's volleyball found that block was the most important factor of success in top-level teams and differentiated high-ranked from lower-ranked teams, as the former had 1.5 blocks more per set. It seems that the same applies to high-level women's competitions, not only in overall matches but in every type of score. Specifically, winners won one more block point per set in overall matches and 0.8 more points in 5-set matches. The importance of blocks in volleyball has been highlighted in previous studies12,45 and matches the findings of the present study. The skills, performed in Complex I (serve–block–counterattack), are crucial even in balanced matches, 45 as the present study found for 5-set matches. The SC of the block per match points was the dominant indicator, and 74% of the variance accounted for by the discriminant function indicated that the block could make the difference between winners and losers in the highest level of women's volleyball, even in the balanced matches.
Although the number of points in attack and serve efficiency are the most important predictors of winning a match,18,31,46–48 the non-significant difference found in 5-set matches in the present study was unexpected. This may be explained by the fact that teams in balanced matches, according to the final score, have similar values in most performance indicators except blocking skill. An additional explanation is that the upper-ranking teams in men's elite volleyball were balanced with the other level teams in Complex I attack values and were not an important factor. 12 Unfortunately, the match reports did not distinguish between the attack in the two game complexes, and attack after reception has been reported to be 10% higher than counterattack in men's volleyball.8,11 However, a small difference in attack efficiency (1.1% more for winners) which is not statistically significant could make the difference as in the discriminant equation, the SC of the attack is high, so the variable is important for the construction of the discriminant function.
Comparing the women's winners’ technical indicators to those of men in the respective competitions, showed that they are significantly different. Men had a higher attack efficiency (+6.7%) and opponent errors per match points (+2.3%), while women had higher block per match points (+1.1%). No gender difference was found in serve per match points. Men's attack efficiency may be higher than women's since men can perform more powerful spikes, as women are unable to match the same ball speed.28–34 Furthermore, men's serve reception has been proven to be more successful, allowing for better conditions in the attack.8,26 On the other hand, the higher opponent point errors in men may be related to the higher risk that males take in serving, since they use more jump serves than women. Also, the height of the net has been reported to cause greater difficulty in scoring aces for men, compared to women. 16 Men take a lot of risks in the serve to reduce the opposition setter's offensive organization. 8 Regarding blocking skill, the higher percentage of women compared with men, may be due to the smaller number of attackers that the setter can set, as men have better efficiency in serve reception.8,49,50 This allows women to perform a larger number of organized blocks with two or three players.
Given that the use of statistical software is mandatory for all major competitions because it provides the statistical information on the competition websites and can be viewed by users and media all over the world, it is suggested that organizers modify the match report by including additional data, such as the attack efficiency after the reception (positive or negative reception) and after the defence (counterattack). The total number of errors and blocks in the attack could be added to this report because the performance of the teams will be evaluated in the best way since the block points can be reduced by the coverage of the team, 51 while attack errors (outside the lines or in the net) can be avoided with training. These available data can give another performance indicator (hitting efficiency) that will evaluate how effective a team, or a player, is attacking, counting the ratio between attack points minus the blocks, and attack errors per the total number of attacks. 52
The performance indicators of points after reception and counterattack to total serves would also be useful because the specific indicators show the performance of the teams in the two game complexes. In addition, the statistics in the attack could possibly be evaluated differently, ignoring the attacks where the players voluntarily attack the ball softly on the block, to return it to their own court and have the chance to attack in better conditions, or cover the ball after a strong attack. 51 Women, due to the lower ball speed of attack compared to men, could defend more attacks and consequently could perform more, and the match report could present an additional performance indicator for women, which counts only the attacks after the reception, first counterattack and last attack. Another useful performance indicator that could be added is the team's points in each rotation, which would provide an even better analysis of the team's performance in relation to setter rotation. We also suggest that the match report should include the individual analysis of the players in serve, reception, attack, and number of blocks, as well as the performance of the team in the above skills in each set. With these data included in the match report provided by the organizers of major volleyball competitions such as the Olympics and World Championships, coaches, athletes, and the media will be able to make even better use of the statistical analysis.
This study establishes reference values for analyzing the match and technical indicators of elite volleyball women’s matches. In a 3-set match, the winning team must score 43.8 points from attack, 8.9 points from blocking, and 5.6 points on serve. Using these values divided per set, benchmarks such as 14.6 kills, three kill blocks, and 1.9 aces in each set are established. Furthermore, a team should have 49.4% attack and 7.6% serve efficiency in 3-set matches, while a drop of 4.4% and 0.8% in attack and serve efficiency, respectively, for the 4-set match would be acceptable to coaches. Researchers, media, coaches, and athletes can benefit from these reference values.5,53 Finally, despite the simplicity of the match report, it has proved to be a useful tool if used properly, since the present study's major findings were similar to those of studies based on more detailed data.
Conclusions
In conclusion, the results of the women's teams at the highest level of volleyball matches indicate that different performance indicators determine the match outcome. Also, attack is not the only skill that increases the probability of winning a match, since block and serve contribute equally significantly. Moreover, in 5-set matches, blocking is the technical skill that differentiates the winning from the losing teams. Finally, in 3-set matches, it seems that performance indicators differ between women and men in attack efficiency, block, and opponent errors per match points.
Footnotes
Declaration of conflicting interests
The author declared no potential conflicts of interest with respect to the research, authorship, and/or publication of this article.
Funding
The author received no financial support for the research, authorship, and/or publication of this article.