
Abstract
This study evaluated the physical demands and specificity of small-sided games (SSGs) compared to matches in Australian Football (AF). Global positioning system (GPS) data was collected on 48 AF players from 39 matches and 28 training sessions across two seasons. Match data was analysed using the ball in play (BiP) method with the maximum BiP period for each match (e.g. the BiP with greatest meters per minute), for each variable (relative distance, high-speed running, and accelerations) averaged for each player to establish maximal means as reference points. Intensity of all BiP periods in matches and SSGs was compared (e.g. a BiP period recorded at 100 m·min−1 by a player with a maximal mean of 200 m·min−1, was classified as a 50% effort). This was categorised in 10% intensity buckets, and compared between matches and SSGs using linear mixed models and Cohen's d effect sizes. Distance was greater (p < 0.01) in the 20–49% buckets for matches and in the 60–89% buckets (p < 0.001) for SSGs. For high-speed running and accelerations, matches were greater (p < 0.001) in the 0–9% bucket but SSGs were greater (p < 0.001) in buckets from 20 to 49%. At the individual level, 37–49% of the players did not record any SSGs efforts in buckets of >80 to ≥90% across GPS variables. SSGs appear to provide a sub-optimal training stimulus, if the aim is to prepare AF players for the highest intensity periods of play recorded during matches, thus may under-prepare players for the intensity demands of AF matches.
Introduction
Small-sided games (SSGs) are modified games played on smaller pitch areas, with a reduced number of players, and are commonly used as part of a training regime by Australian Football (AF) teams.1–6 There are several SSGs formats which can be achieved by manipulating area size, player numbers, unbalanced teams, and special rules.1,3,7,8 Previous research has highlighted that SSGs played on larger areas significantly increase relative distance, PlayerLoadTM, and sprinting distance experience by the players. 1 SSGs give opportunities for the players to concurrently train the physical, technical, tactical and perceptual requirements of match play, whilst also being easily manipulated by coaches to replicate specific match scenario's.1,6 It is proposed that the implementation of SSGs can enable an environment whereby specific task constraints can aid the development of perception action coupling,3,5,9 as well facilitating the improvement of several measures of physical capacity amongst team sport athletes such as running economy, repeat sprint ability, as well as both time trial and intermittent Yo-Yo test performance.10,11 However, the intensity of SSGs in relation to that in official matches is not necessarily clear.
Limited studies have compared the physical demands of SSGs to official matches within AF.2,4,5,12 When compared to youth AF matches, using averaged data (i.e. total distance covered per match divided by total playing time), SSGs were shown to display higher values for distance per minute and percentage of high-speed running. 5 However, previous research has demonstrated that analysing AF matches using averaged data underestimates the most physically demanding periods of play,13–15 therefore only comparing SSGs to averaged match data appears problematic. It is proposed that through comparing SSGs to maximum periods of play (e.g. the period with the highest meters per minute), practitioners may be able to more accurately ensure players are better prepared physically for the demands of matches with higher levels of training specificity.2,15 Additionally, ensuring that training is of a sufficiently high enough intensity may improve the successful transfer of technical skills (e.g. kicking), particularly as previous research has demonstrated that kicking execution is not performed under the same constraints (e.g. time pressure) during SSGs as in competitive matches.4,5
Despite this, to the best of our knowledge, only the study by Thornton et al. 2 has made assessments of this nature focusing on elite female players. They divided match and training data into 1-min time periods before assigning each period into an intensity bucket relative to the match maximal mean (i.e. average of the maximum period from each individual game). 2 Their results demonstrated that the intensity distribution of games style training (which included SSGs) was somewhat comparable to match play when the two were compared relative to maximum game intensity. 2 However, the 1-min analysis time period utilized in their study is somewhat uniform, which may not be as desirable for intermittent type sports which are commonly non-uniform in nature.15,16 Therefore, it may be better to make the comparison of SSGs to match data derived using non-uniform analysis methods, such as the ball in play (BiP) technique.15,17 This technique involves splitting match data into discrete periods where the ball is in and out of play, which has been successfully employed in AF populations previously. 15 This study by Wing et al. 15 showed that maximum BiP periods were significantly (p < 0.0001) greater than match averaged data for a variety of metrics (e.g. distance, high-speed running, accelerations). Furthermore, AF players were required to perform a technical action (e.g. a kick) in 21–48% of these maximum periods, dependent upon the microsensor metric being analysed and player position in the team. 15 Therefore, it appears prudent to compare BiP periods to SSGs, where technical actions are also performed, as opposed to conditioning-based drills (e.g. high intensity interval training) where no technical actions are performed. Comparisons of this nature can be useful to coaches when planning and monitoring SSGs prescription, ensuring that players are exposed to appropriate time periods in the relevant intensity ranges that better replicate periods when the ball is in play during official matches (i.e. a time period when a physical and technical task is placed upon a player).2,15
This study aimed to compare the intensity distribution of SSGs and BiP periods from competitive matches, relative to maximum BiP periods. We hypothesised that differences would exist in the intensity distribution between BiP and SSGs, whereby SSGs would be unable to match the highest intensities performed during competitive matches.
Method
Participants
Global positioning system (GPS) data were collected from 48 male AF players from one club competing in the West Australian Football League (WAFL) from 2019 (n = 29, age 23.2 ± 3.1 y, mass 84.1 ± 8.6 kg, height 184.1 ± 7.4 cm) and 2021 (n = 38, age 23.0 ± 3.3 y, mass 82.8 ± 10.1 kg, height 185.8 ± 8.2 cm) seasons, where 19 players provided data across both captured seasons. The 2020 season was not included due to the COVID-19 pandemic. A total of 39 matches (record; 26 wins and 13 losses) and 28 training sessions were included. Match files were removed if a player failed to complete the entire game (e.g. suffered an injury; 31 files) or if there was a failure of the recording device (3 files). All participants were provided with relevant study information before providing informed written consent. The study was approved by the Edith Cowan University Human Research Ethics Committee (2020-01058-WING).
Procedures
GPS data was collected using the Playertek device (Catapult Innovations, Melbourne, Australia) sampling at 10 Hz, which was fitted into a pouch sewn into the playing shirt during matches, and in a specifically design vest provided by the manufacturer during training sessions. The accuracy of these devices has been previously reported. 18 In this instance, no significant differences were found between the distance recorded by the Playertek unit and measured track distance at both 350 m (p = 0.098) and 40 m (p = 0.081). 18 To reduce inter-unit variability, the players wore the same device in all matches and training sessions. The following microsensor metrics were recorded and reported per minute of playing time: total distance, high-speed distance (> 18 km·h−1) and acceleration efforts (> 3 m·s−2). Typically, an acceleration threshold of 2.78 m·s−2 is employed in AF research, 19 however, this was not available to the researchers, so 3 m·s−2 was employed due to it being the closest available.
Match data
A timeline of events provided by Champion Data (Melbourne, VIC, Australia) – a commercial company which provides coding of events and associated time stamps for the Australian Football League (AFL) and the WAFL, was accessed to identify BiP periods. Match events coded by Champion Data were used to describe BiP periods, which started with an umpire centre bounce or throw-in, or where a player restarted the game with a kick-in, until a time where the umpire considers the ball to be out of bounds or signals that a behind or goal has been scored, in line with previous AF research. 15 Following each match, the microsensor data was downloaded onto the proprietary software (Playertek Cloud, Melbourne, Australia). BiP time periods were then time matched and manually entered onto the microsensor technology data before being exported to Microsoft Excel (Microsoft Corporation, WA, USA). In-line with previous research, BiP data was then cleaned by removing all plays <30 s duration (8% of total BiP time) and by removing all plays where the player did not complete the full phase of play (e.g. was rotated on or off during the BiP period).15,17 The maximum BiP period (e.g. the period with the highest meterage per minute) for each metric was recorded for each player in each match. The average of these maximum periods was then calculated for each player, for each season separately, to provide a measure of a player's maximal mean.2,20 All BiP periods were then calculated as a percentage (to the nearest whole percent) of an individual's maximal mean. For example, a BiP period performed at 100 m·min−1 for a player with a maximal mean of 200 m·min−1, would be classified as a 50% effort.2,20 The maximal mean from the 2019 season and 2021 season were applied to their respective seasons data. The count of BiP periods was calculated in 10% intensity buckets (i.e. 0–9%, 10–19%, up to and including ≥100%). 2 The count within each bucket was divided by the total count to give a percentage (i.e. the proportion) of BiP periods performed within each bucket. 2 A total of 37,068 BiP periods (2019; average observations per player 631.2 ± 331.9; range 92–1055, average BiP duration 1.2 ± 0.7 min; range 0.5–5.8 min, 2021; average observations per player 493.7 ± 307.6; range 76–994, average BiP duration 1.2 ± 0.7 min; range 0.5–6.5 min) were included in the final analyses.
Training data
The start and end of each SSG was split in real time using live feed technology (Playertek + live feed application). SSGs format typically consisted of 8 versus 8 or 8 versus 7 matches played on an area of approximately 50-m × 90-m, which is smaller than an official match which is competed by two teams of 18 on an oval of at least 150-m × 110-m. These drills were selected for analysis as they are routinely used by the study team, particularly during the pre-season phase to try and expose players to relative match intensities. Due to the practicality of training, all SSGs were played with additional numbers upon the ‘outside’ of the game, and players periodically swapped in and out of the game. Therefore, post download each drill was re-split into individual player efforts, where each effort was started and stopped as a player entered and left the drill. All SSGs efforts <30s in duration (1.4% of total SSGs efforts) were removed from the final analysis (duration of an SSGs effort 2019; average 3.6 ± 2.2 min, range 0.5–15.8 min, 2021; average 2.4 ± 1.3, range 0.5–7.1). This allowed for the analysis of on-field time only. A total of 2949 SSGs efforts (2019; average observations per player 35.9 ± 15.9; range 2–58, 2021; average observations per player 50.2 ± 24.9; range 3–90) were included in the final analyses. Each individual's BiP maximal mean was then applied to each training observation to enable SSGs to be assessed relative to match intensity, before being placed into intensity buckets as previously described.
Statistical analyses
All statistical analyses were performed in either Microsoft Excel (Microsoft Corporation, WA, USA) or R software (R, v4.1.2, The R Foundation for Statistical Computing, Vienna, Austria). To assess differences between matches and SSGs, linear mixed models were constructed (using lmerTest package in R 21 ), with percent as the outcome variable, phase (BiP or SSGs) and bucket as the fixed effect, and player identification as the random effect. Fixed effects describe the relationship between the dependent variable and the population, whilst random effects describe random deviations from the relationships described by fixed effects. 22 Where significant differences were highlighted, Tukey's post-hoc test was used to make pairwise comparisons (using the emmeans package in R). The significance level was set at p < 0.05. Normality was confirmed through visual inspection of the residual plots (Figure 1). The magnitude of the differences was further explained with Cohen's d effect sizes (and associated 95% confidence intervals), calculated using a customised spreadsheet, where ≤0.2, 0.21 to 0.6, 0.61 to 1.2, 1.21 to 2.0 and >2.0 effect size magnitudes were classified as trivial, small, moderate, large and very large, respectively. 23 Additionally, the SSGs data was inspected at an individual level to identify intensity buckets where a large number of participants did not achieve any efforts, where specific focus was on those buckets classified as high-intensity, classified as ≥70% in-line with previous research. 20
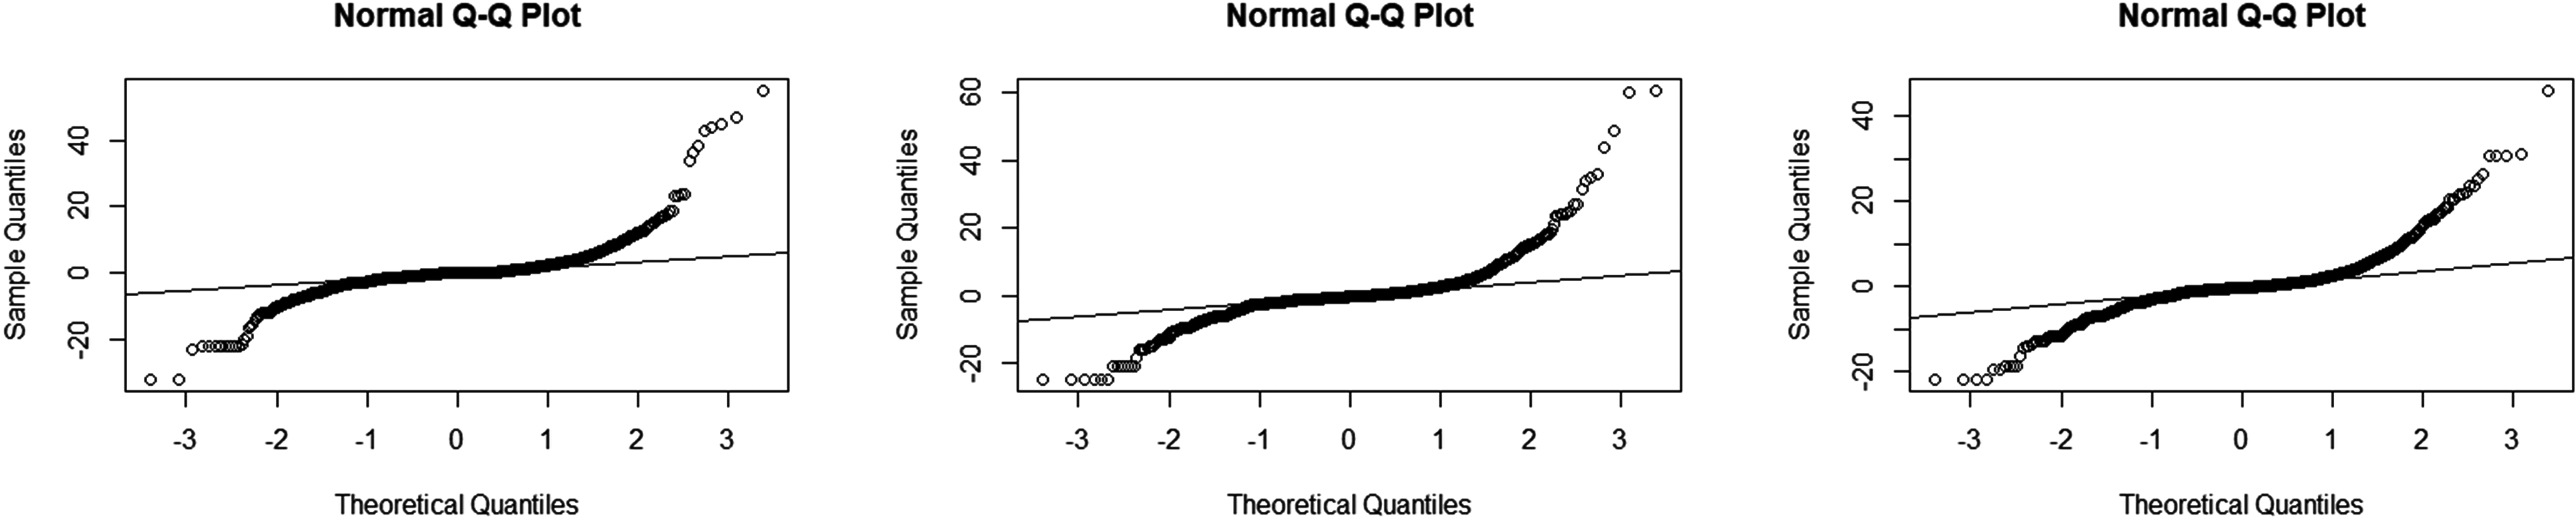
Quantile–quantile plot for linear mixed models for distance, high-speed running and accelerations (left to right). A quantile–quantile plot is a method to assess if a data set comes from a theoretically normal distribution. Most of the points between + /−2 should fall along the black line.
Results
Distance
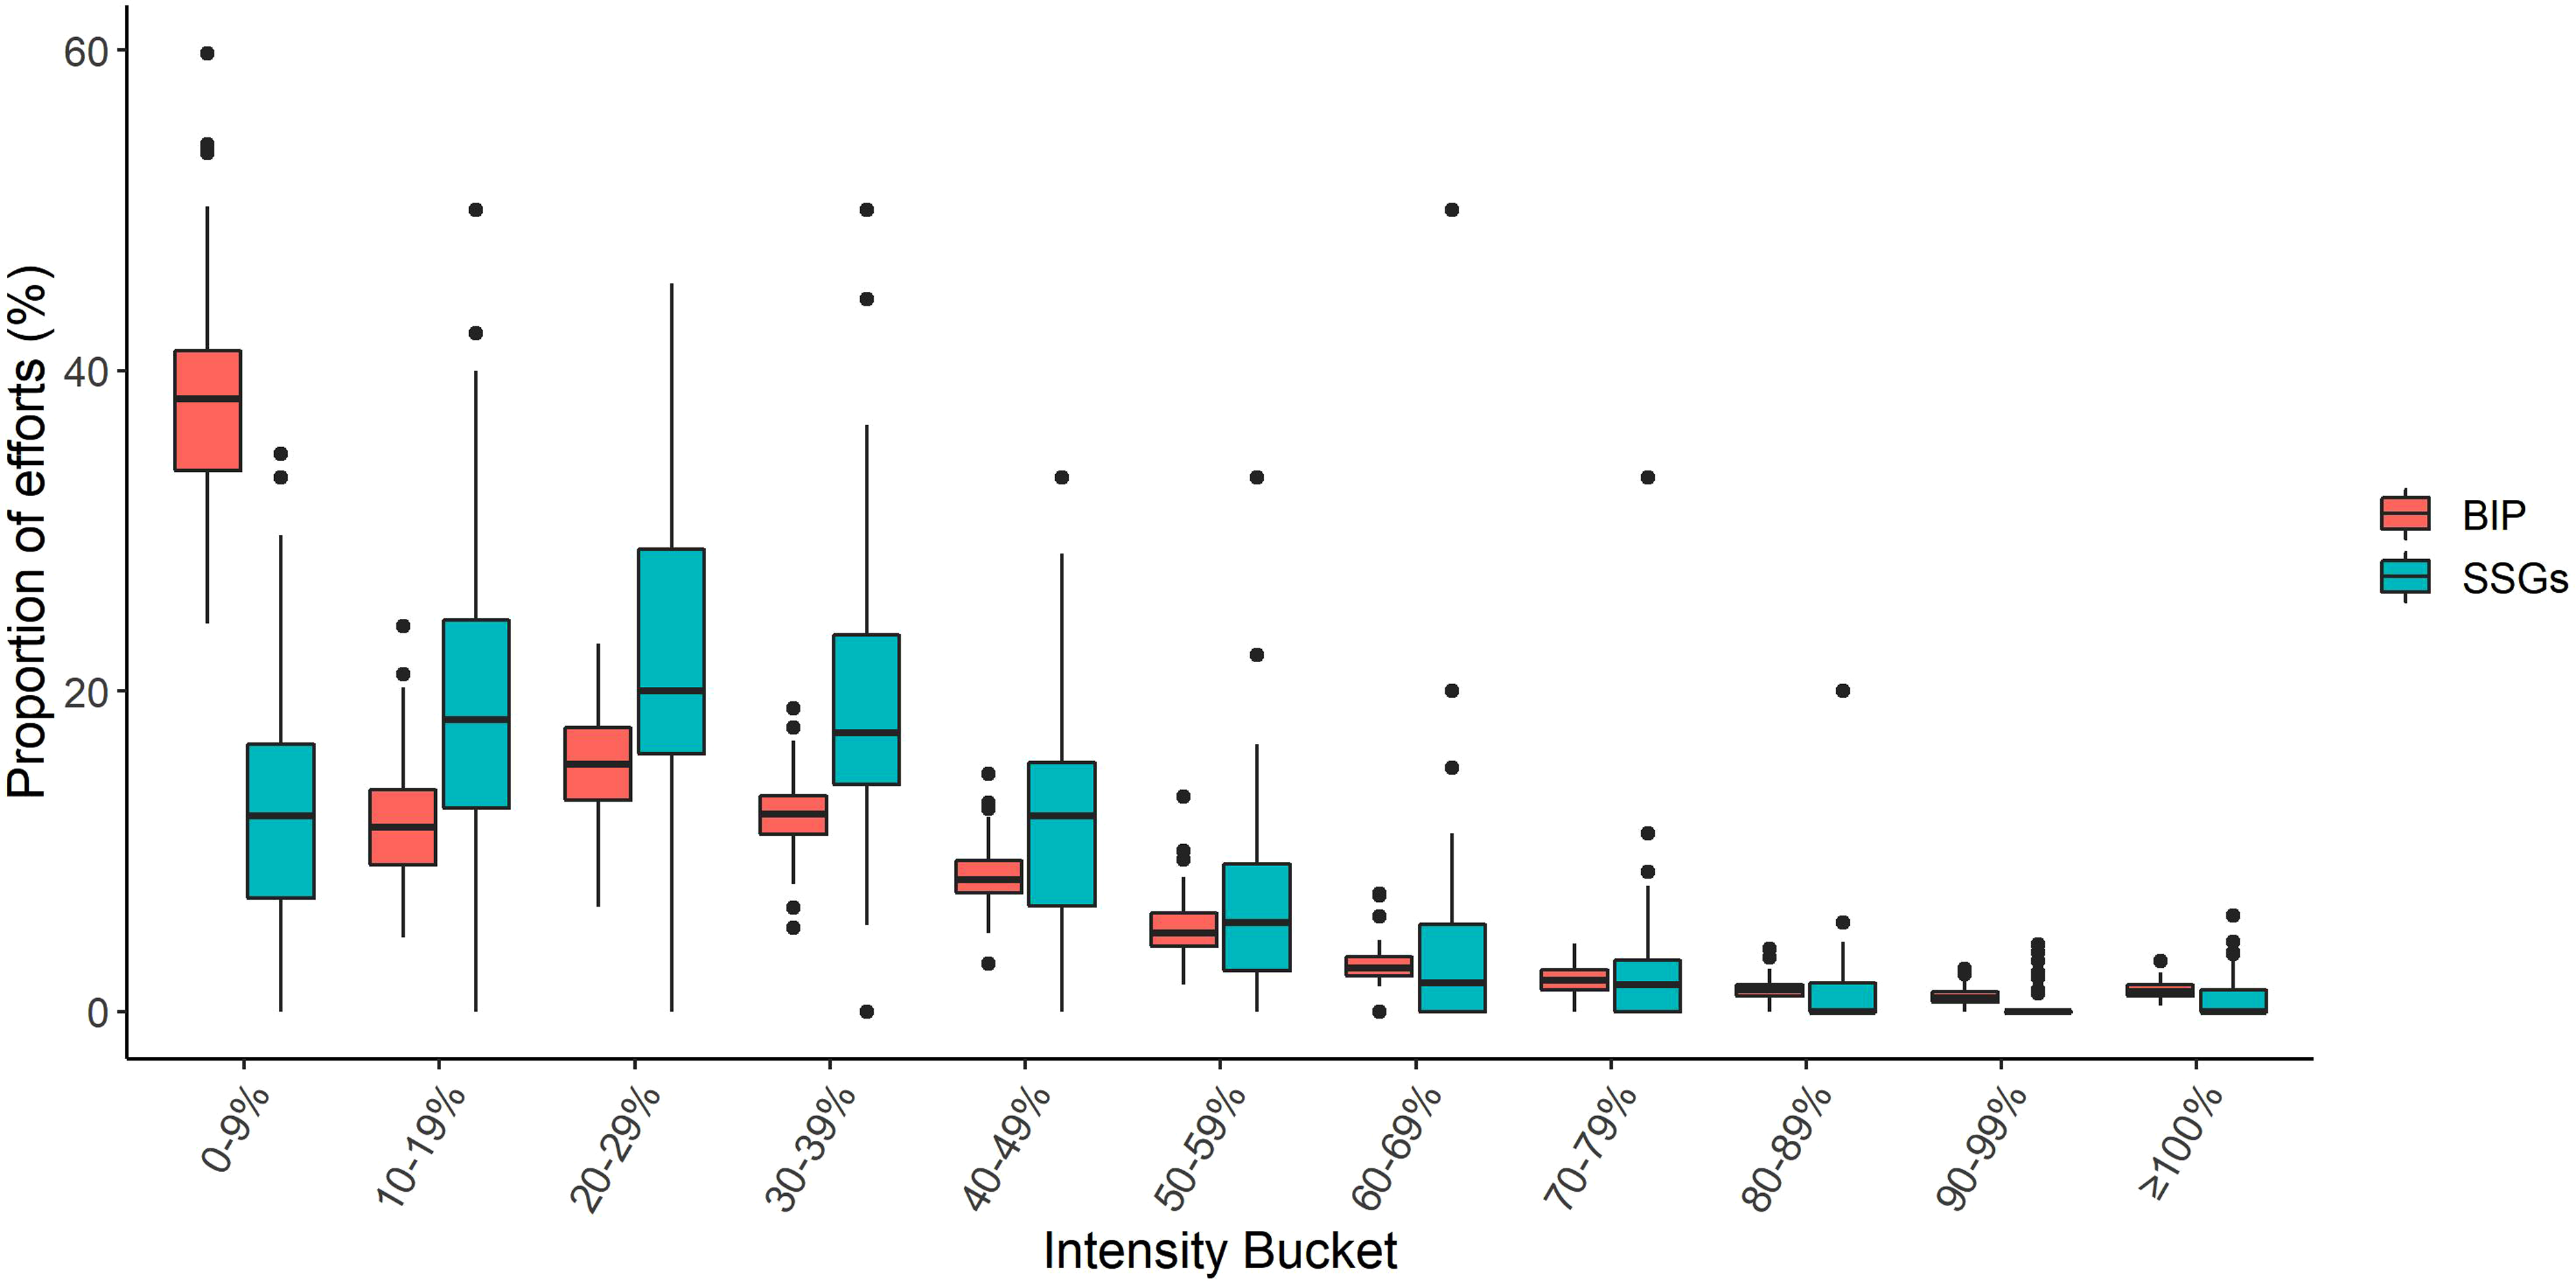
The proportion of efforts for relative distance were significantly greater for BiP periods compared to SSGs in the 20–29% (p = 0.003, ES: 4.24), 30–39% (p < 0.001, ES: 2.75) and 40–49% (p < 0.001, ES: 2.11) buckets, whereas the proportion of efforts was significantly greater for SSGs in the 60–69% (p < 0.001, ES: −1.14), 70–79% (p < 0.001, ES: −0.74), and 80–89% (p < 0.001, ES: −0.46) buckets compared to BiP periods. There were no significant differences (p > 0.05) in any other buckets (Table 1 and Figure 2). Several players did not perform any SSGs efforts in the high-intensity buckets (70–79%: n = 4, 80–89%: n = 6, 90 = 99%: n = 35, ≥100%: n = 44). Combined, 25 of 67 (37%) players did not record any SSGs efforts in buckets classified as ≥ 90%, with these players performing 5.0 ± 1.5% (range; 2–8%) of BiP periods ≥ 90%, this equates to 22 ± 12.2 min (range; 3.7–44.1 min) of total season BiP time. Only seven players were able to match, or supersede, the proportion of efforts performed in all of the highest (70–79% to ≥ 100%) intensity buckets during SSGs compared to BiP periods.
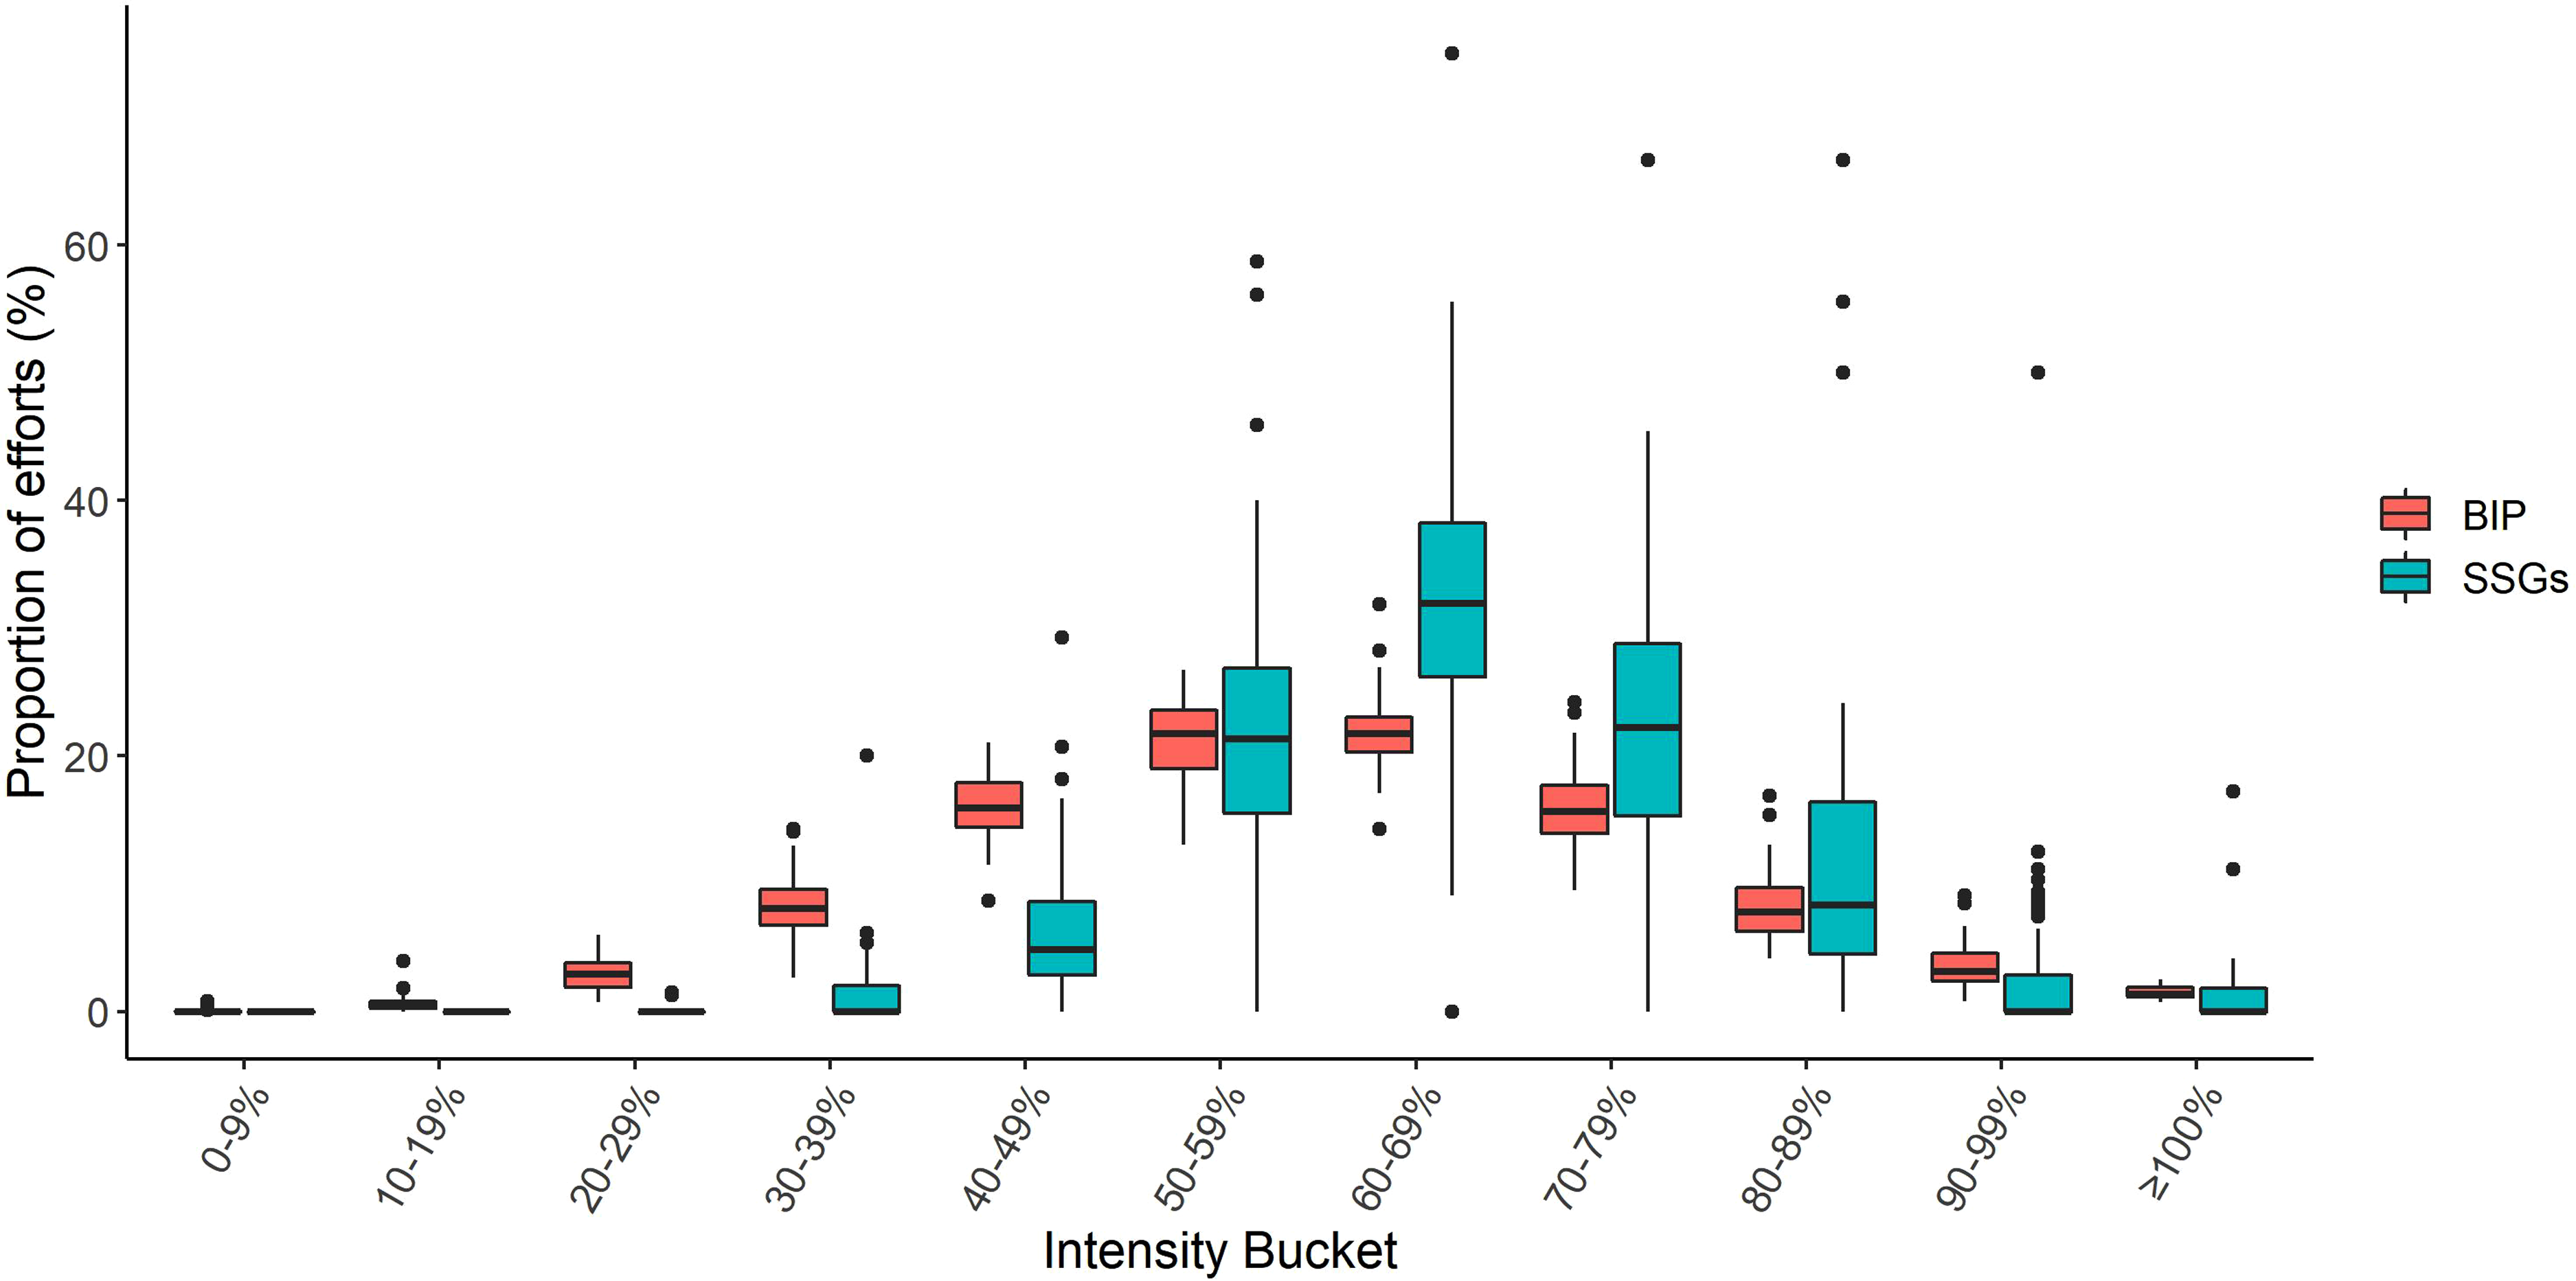
Proportion of efforts in each intensity bucket for distance per minute between small-sided games (SSGs) and ball in play (BiP). Boxplots represent the median and interquartile range of the proportion of effort in SSGs (blue box) and BiP (red box) within each intensity bucket, whilst black dots highlight individual data points considered to be 1.5 times outside the upper or lower interquartile range.
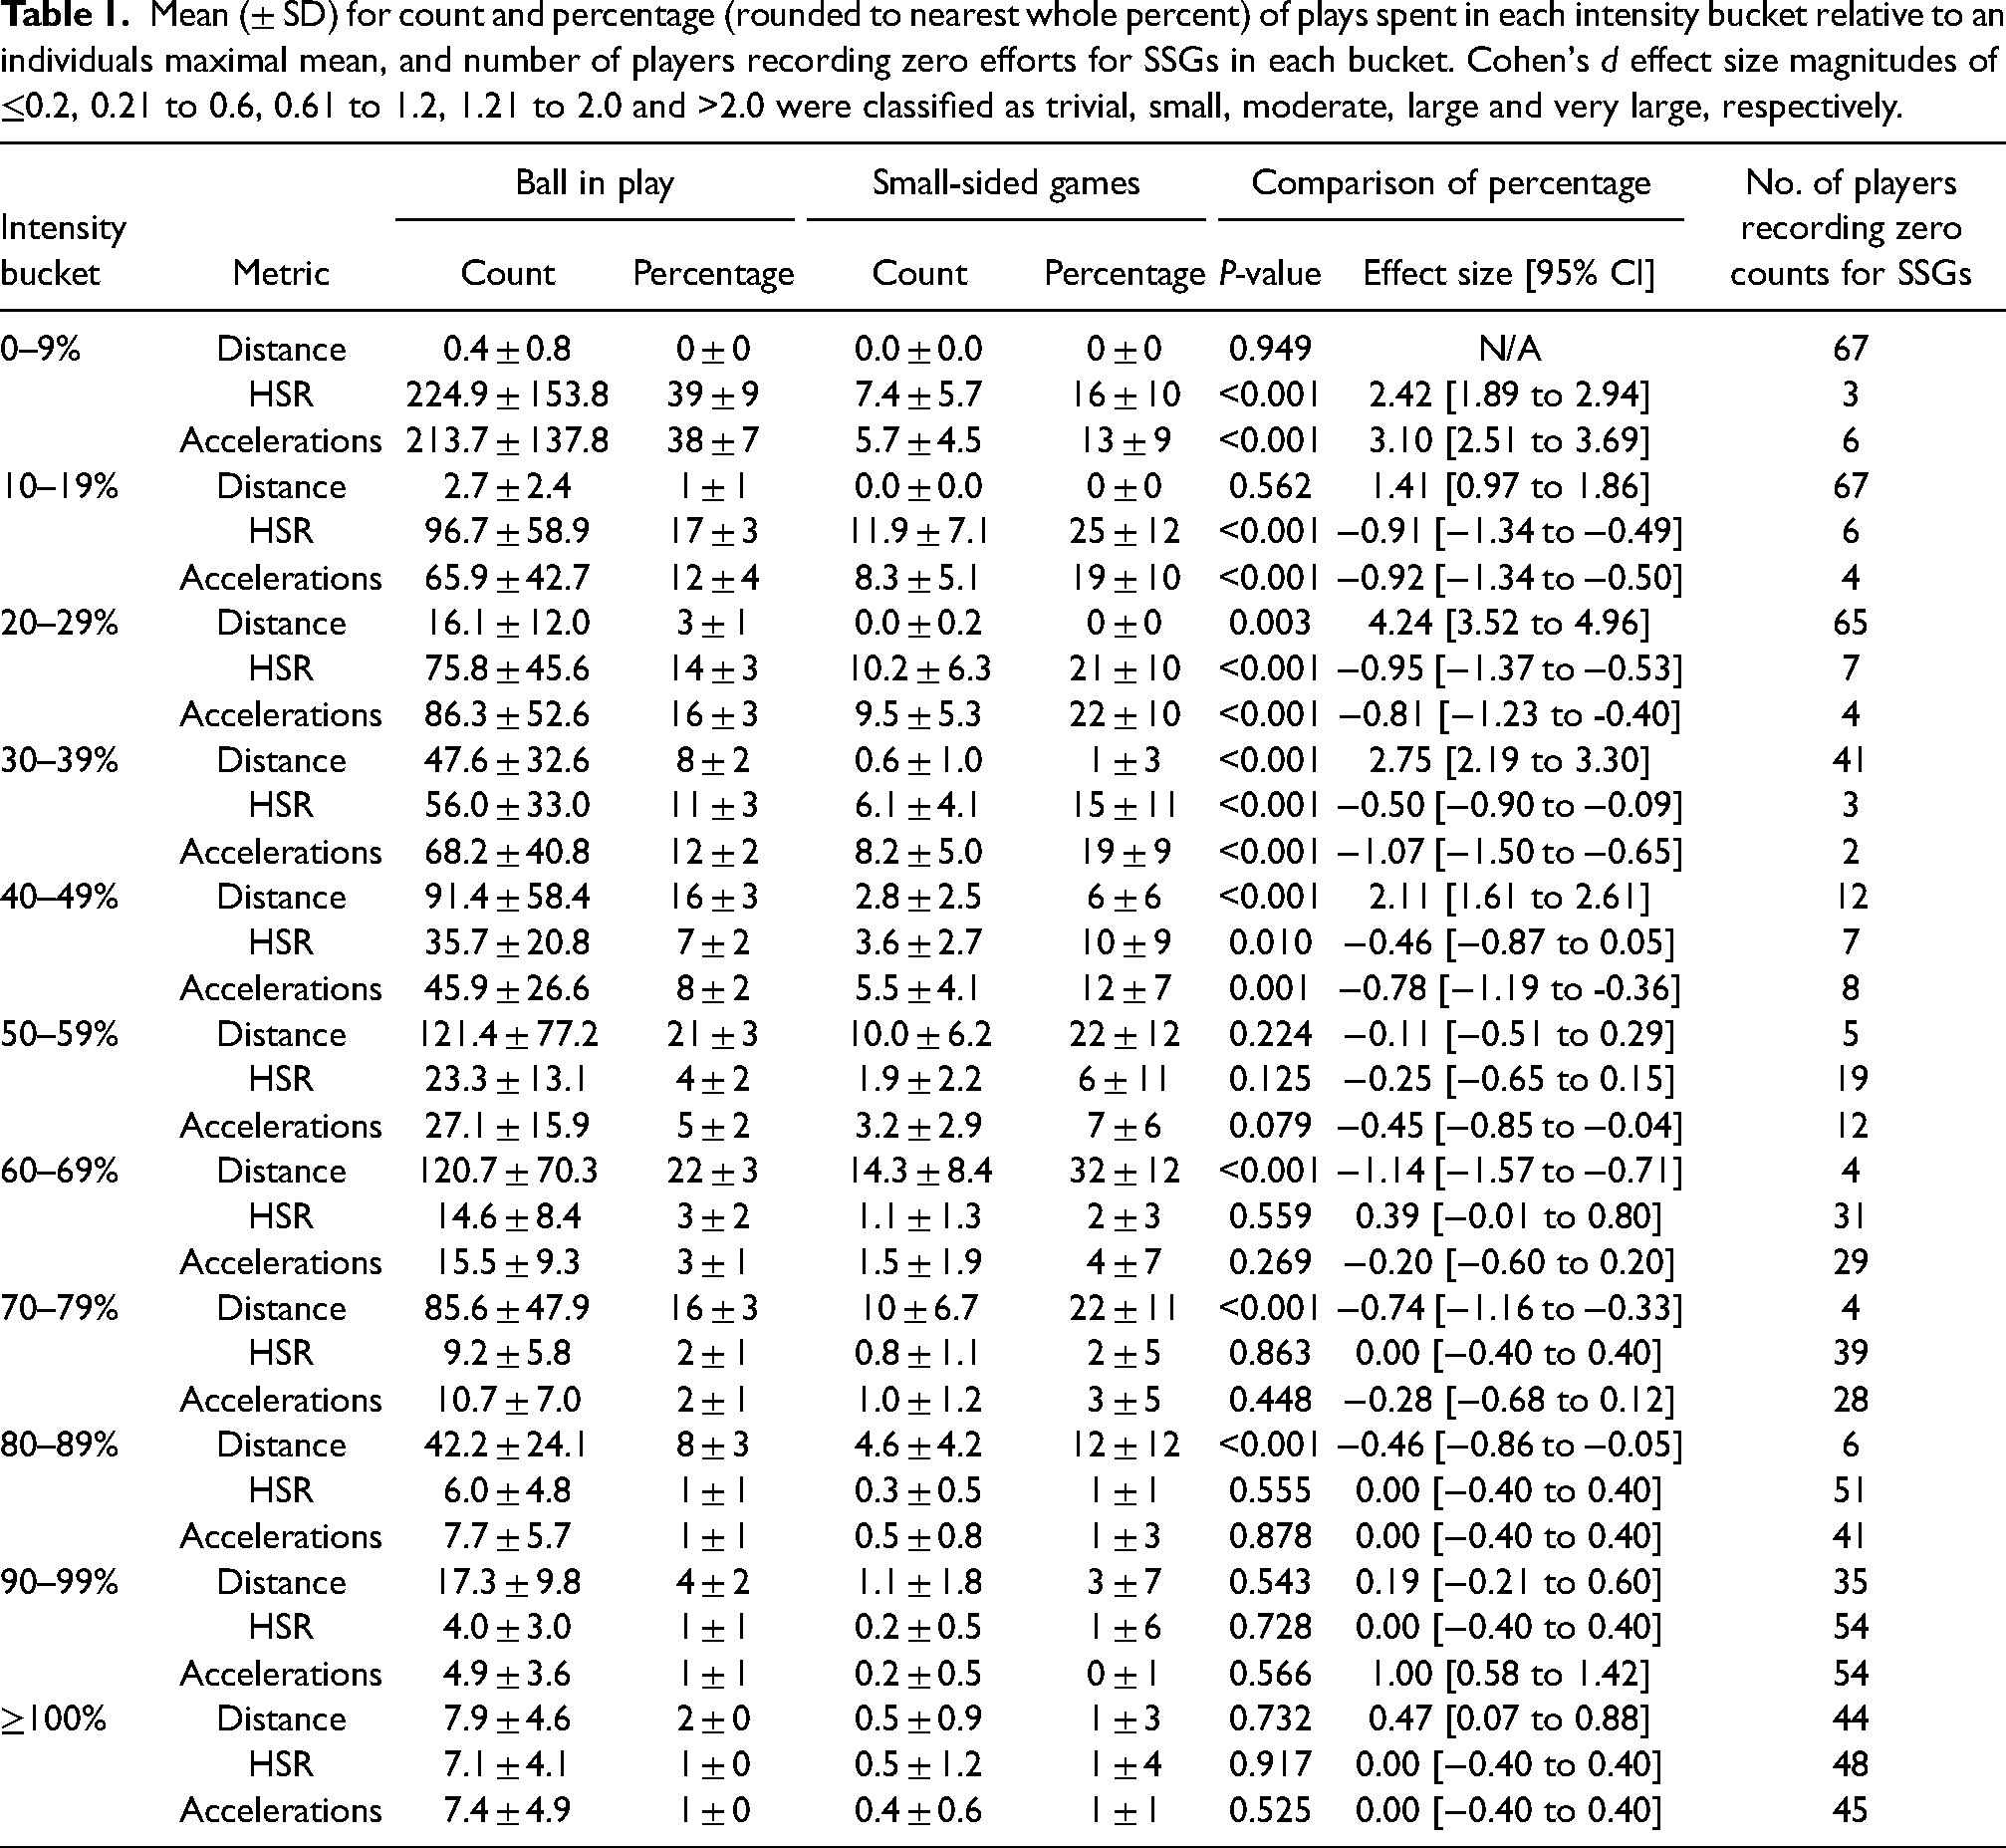
Mean (± SD) for count and percentage (rounded to nearest whole percent) of plays spent in each intensity bucket relative to an individuals maximal mean, and number of players recording zero efforts for SSGs in each bucket. Cohen's d effect size magnitudes of ≤0.2, 0.21 to 0.6, 0.61 to 1.2, 1.21 to 2.0 and >2.0 were classified as trivial, small, moderate, large and very large, respectively.
High-speed running
A significantly greater proportion of efforts for high-speed running were performed in the 0–9% (p < 0.001, ES: 2.42) bucket for BiP periods compared to SSGs, whilst a significantly greater proportion of efforts were performed in the 10–19% (p < 0.001, ES: −0.91), 20–29% (p < 0.001, ES: −0.95), 30–39% (p < 0.001, ES: −0.50) and 40–49% (p = 0.010, ES: −0.46) buckets for SSGs compared to BiP periods. No significant differences (p > 0.05) were noted for any other buckets (Table 1 and Figure 3). Several players did not perform any SSGs efforts in the high intensity buckets (70–79%: n = 39, 80–89%: n = 51, 90 = 99%: n = 54, ≥100%: n = 48). Combined, 33 of 67 (49%) players did not record any SSGs efforts in buckets classified as ≥80%, where these players performed 3.5 ± 1.1% (range; 2–6%) of BiP periods ≥ 80%, this equates to 12.7 ± 7.0 min (range; 2.7–28.1 min) of total season BiP time. Only two players were able to match, or supersede, the proportion of efforts performed in all of the highest (70–79% to ≥ 100%) intensity buckets during SSGs compared to BiP periods.
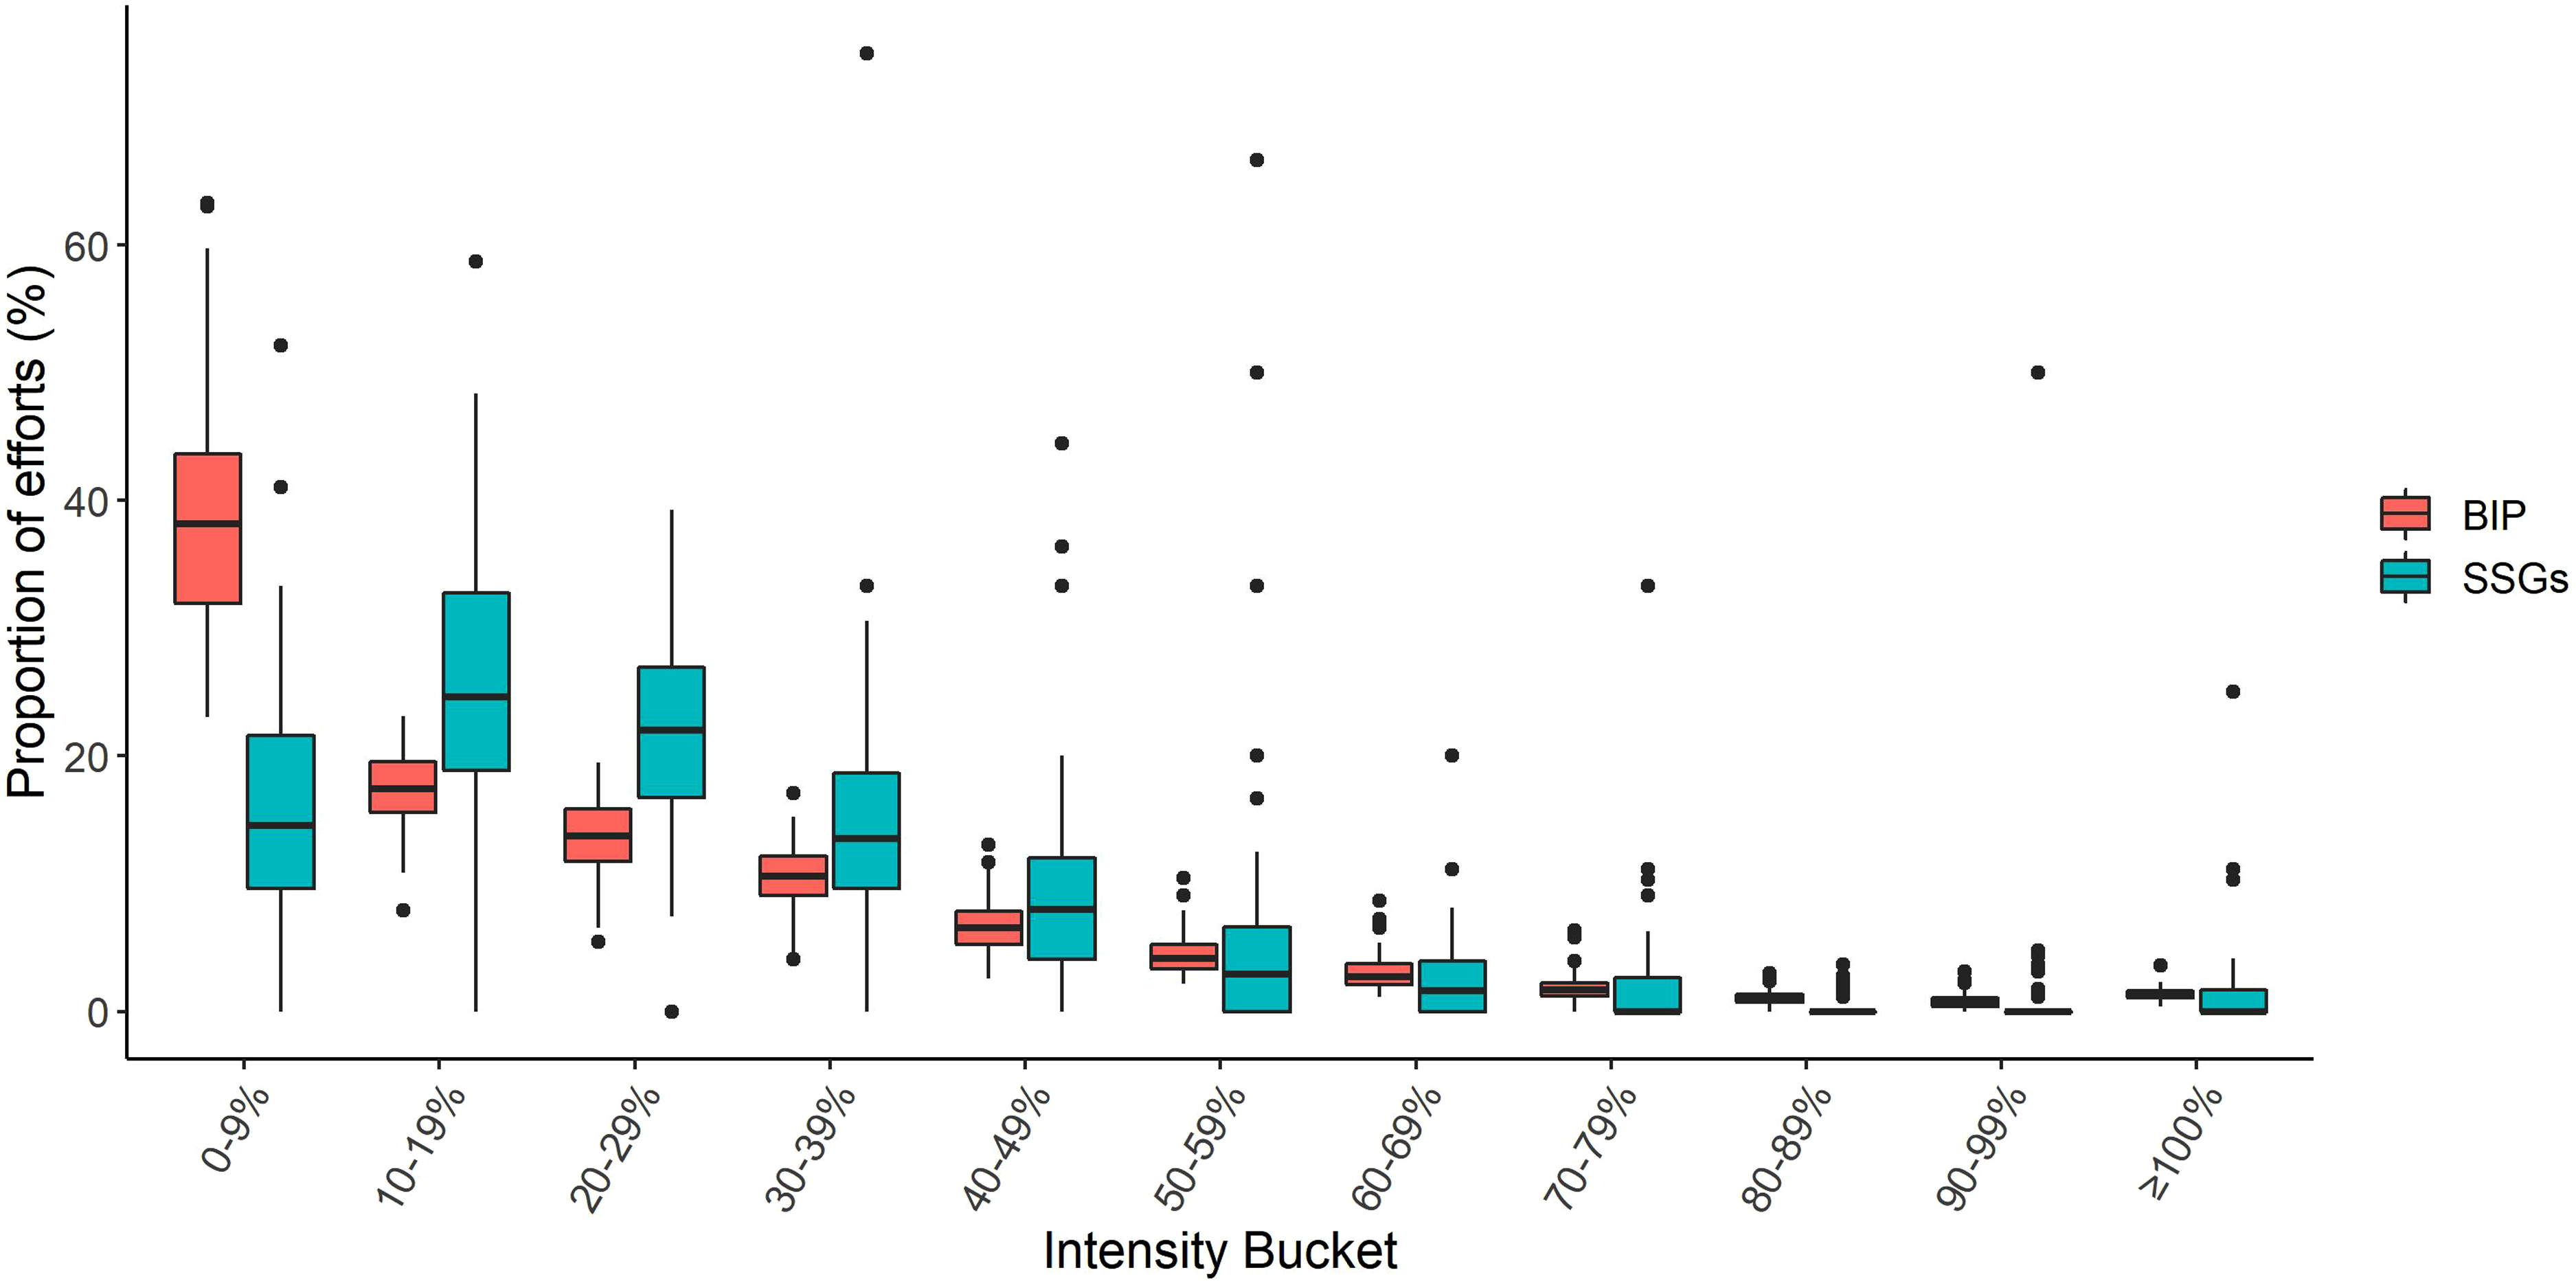
Proportion of efforts in each intensity bucket for high-speed running per minute between small-sided games (SSGs) and ball in play (BiP). Boxplots represent the median and interquartile range of the proportion of effort in SSGs (blue box) and BiP (red box) within each intensity bucket, whilst black dots highlight individual data points considered to be 1.5 times outside the upper or lower interquartile range.
Accelerations
A significantly greater proportion of efforts for relative accelerations were recorded for BiP periods compared to SSGs in the 0–9% (p < 0.001, ES: 3.10) bucket, conversely, a higher proportion of efforts were recorded for SSGs compared to BiP periods in the 10–19% (p < 0.001, ES: −0.92), 20–29% (p < 0.001, ES: −0.81). 30–39% (p < 0.001, ES: −1.07), and the 40–49% (p < 0.001, ES: −0.78) buckets. No significant differences (p > 0.05) were noted for any other buckets (Table 1 and Figure 4). Several players did not perform any SSGs efforts in the high intensity buckets (70–79%: n = 28, 80–89%: n = 41, 90 = 99%: n = 54, ≥100%: n = 45). Combined, 28 of 67 (42%) players did not record any SSGs efforts in buckets classified as ≥ 80%, where these players performed 3.7 ± 1.2% (range; 2–7%) of BiP periods ≥ 80%, this equates to 14.5 ± 9.1 min (range; 1.6–29.8 min), of total season BiP time. Only two players were able to match, or supersede, the proportion of efforts performed in all of the highest (70–79% to ≥ 100%) intensity buckets during SSGs compared to BiP periods.
Proportion of efforts in each intensity bucket for accelerations per minute between small-sided games (SSGs) and ball in play (BiP). Boxplots represent the median and interquartile range of the proportion of effort in SSGs (blue box) and BiP (red box) within each intensity bucket, whilst black dots highlight individual data points considered to be 1.5 times outside the upper or lower interquartile range.
Discussion
The present study tested the hypothesis that the intensity distribution would be different between BiP and SSGs, whereby the intensity in SSGs would not match the highest intensity performed during competitive matches. There were significant differences in intensity distribution between BiP and SSGs (Table 1). When specifically analysing higher intensity buckets (i.e. ≥70%), only the comparison of the proportion of efforts for relative distance in the 70–79% and 80–89% buckets reached significance, where the proportion of efforts in SSGs were greater than BiP periods. This suggests that when analysing team data, SSGs are an adequate training modality for exposing players to the highest intensities recorded during matches. However, when the data was inspected at an individual level, it was found that SSGs were unable to elicit efforts recorded in the higher intensity buckets for many of the players. Specifically, 25 players (37%) did not achieve efforts ≥90% for distance, 33 players (49%) did not achieve efforts ≥80% for high-speed running, and 28 players (42%) did not achieve efforts ≥80% for acceleration efforts during SSGs. These findings were in line with our hypothesis, and highlights the need to monitor training at an individual player level, as opposed to analysing group data where this occurs, as there is a need to expose all players in a team to an appropriate training stimulus to facilitate optimal team-wide match preparation. 24
Oftentimes, it has been recommended that players are exposed to training intensities recorded during maximum phases of play during competitive matches.2,15,25,26 As AF players are required to regularly perform technical actions (e.g. kicks) during these maximum phases,15,25 the use of SSGs would appear to be particularly attractive. However, the findings of the present study demonstrate that SSGs are not suitable for this purpose amongst many players. In particular, SSGs are less effective at providing adequate high-speed and acceleration stimulus, compared to total distance. Although several players did not achieve efforts ≥90% for distance, only 3 players did not achieve efforts ≥80%, in comparison to the 33 and 28 players for high-speed and acceleration efforts respectively during SSGs. This finding is somewhat supported by those made within soccer populations, which reported that relative to maximum periods of play, distance and high-speed distances were reduced during possession based games, however, acceleration efforts were increased.27,28
Several factors are postulated to affect the intensity of SSGs, which may have contributed to this finding, which include SSGs design (e.g. rules, pitch size)3,29 and other factors including coach motivation 29 and pre-training subjective wellness. 30 However, as SSGs design remained relatively stable (e.g. pitch size) and data was collected across multiple seasons and time frames (e.g. pre and in-season), it is our view that the potential impact of these factors is reduced. Interestingly, amongst the players who provided data from both seasons, some recorded efforts in the higher intensity buckets in 2019 and not in 2021, and vice-versa. Therefore, it is more likely that it is hard to control the intensity of SSGs, in the same way as conditioning based training methodologies, leading to several players not reaching the highest intensities recorded during competitive matches. This is somewhat highlighted by the coefficient of variation measures calculated for the raw SSGs data (e.g. the meters per minute of each SSGs effort) as 19% for distance, 76% for high-speed running, and 70% for acceleration efforts, indicating the high variability in SSGs intensity. The high variability in SSGs intensity has also been previously reported in soccer populations. 31
It may also be hypothesised that SSGs bout duration may have had an effect upon those who are able to achieve versus those unable to achieve efforts in the highest intensity buckets. However, previous research identifying maximal BiP periods from matches reported that these bouts ranged from 30 to 214 s, suggesting that players can maintain high intensity activity over longer time frames. 15 This study highlighted that those who did achieve efforts within the higher intensity buckets were exposed to slightly shorter SSGs bouts on average compared to those who did not reach the highest intensities in training (distance (2.6 ± 1.6 vs 3.4 ± 2.1 min), high-speed running (2.7 ± 1.7 vs 3.1 ± 1.9 min) and accelerations (2.7 ± 1.6 vs 3.2 ± 2.1 min)). However, when inspecting the data at an individual level, almost all players were exposed to both short and long duration SSGs durations. Therefore, it appears that effect of duration on players SSGs intensity was minimal.
The findings of this study indicate SSGs may not be the best training methodology for many players to reach, or achieve overload, for the most intense periods of play experienced in AF matches. Despite alternative training methods, such as high-intensity interval training, 32 potentially affording coaches greater control over intensity, and therefore ensuring players reach optimal intensity, training of this type does not allow the inclusion of technical skills. Therefore, the possible inclusion of position specific drills, where there is a combination of running efforts and technical involvements, may be desirable to supplement current training practices. 33 These drills should be designed using position specific match data, inclusive of GPS metrics (e.g. distance per minute) and technical actions (e.g. kicks). Previous research within soccer has shown that drills of this type are able to overload specific player physiological measures. 33 However, future research is required to investigate such drills within AF populations in order to establish their potential, and therefore practical significance, to reach or over-load maximal periods of play recorded during AF matches.
Strengths and limitations
A strength of this study was the capture of data across two seasons, which allowed the inclusion of many games and training sessions, as well as a large number of players. This strengthens the applicability of our findings. An obvious limitation to this study which should be addressed was the lack of variety in the SSGs included for analysis. The SSGs included within this study were predominantly played between the same number of players on the same field size, however, several SSGs formats (e.g. small field sizes, different number of players) have been reported in AF research. 1 The drills included are those typically used by the study team, who rarely use different SSGs configurations. Therefore, caution should be exerted when applying these findings to other SSGs formats, and to the wider AF population. Additionally, the comparisons were limited to three GPS metrics (distance, high-speed running and accelerations), however, this could be expanded further to include other GPS metrics such as deceleration efforts, as well as spatiotemporal data such as congestion and density. 34 A total of 34 files were removed due to loss of data capture or an injury sustained by a player. Although this is a strength of the data cleaning process, which ensures intensity distributions are captured from entire games and thus allowing for the effect of accumulated fatigue, it is possible that potentially important information could have been removed from the final analysis. Future studies may wish to account for such data sets within their analysis methods. Despite this, the analytical approach used (i.e. the use of maximal means and BiP analysis) appears to have benefit when making comparisons between matches and SSGs, which may be applied to any SSGs configuration and to a multitude of sports.
Conclusion
SSGs are restrictive when seeking to reach and overload the highest intensity periods of play recorded during matches for many players across playing positions and the entire team. Additionally, comparing SSGs to matches using team averages is problematic, thus assessments should be made at the individual player level. Furthermore, the present study combined with others, 2 supports the methodology of comparing SSGs to a maximal mean, in this case BiP periods, as it can afford greater detail concerning the distribution of training intensity relative to that of a match. This may not be as well reflected when using whole game averaged data. Although this research focuses on AF, the methodology outlined here is applicable to all team sports who employ SSGs as part of a training regime.
Footnotes
Acknowledgements
The authors wish to acknowledge the athletes and coaching staff of the football club for their contribution to this research; and to acknowledge Champion Data for their permission to use and report this data in the context of this research.
Author Note
Nicolas H Hart, School of Sport, Exercise and Rehabilitation, Faculty of Health, University of Technology Sydney, Moore Park, NSW, Australia.
Declaration of conflicting interests
The author(s) declared no potential conflicts of interest with respect to the research, authorship, and/or publication of this article.
Funding
The author(s) disclosed receipt of the following financial support for the research, authorship, and/or publication of this article: CW is supported by an Edith Cowan University Higher Degree by Research Scholarship.