
Abstract
Purpose
The purpose of this study was to assess running load trends (total distance (TD), high-intensity distance (HID; > 5.5ms−1) and sprinting distance (SprD; > 7ms−1)) in the English Premier League (EPL) between the 2014/2015 and 2018/2019 seasons using a semi-automated optical tracking system.
Methods
A total of 1634 games across 5 seasons (2014/2015–2018/2019) were analysed for team and positional TD, HID and SprD. All matches were tracked using TRACAB® Gen-4 HD motion cameras. Data were analysed to identify significant team and positional differences for each metric.
Results
Small to moderate increases were seen in team running load for TD (p = 0.02; effect size (ES): 0.21), HID (p < 0.001; ES: 0.88) and SprD (p < 0.001; ES: 0.67) between 2014/2015 and 2018/2019. Positional analysis showed significant increases in TD for all except for defensive midfielders (DM), attacking midfielders (AM) and wide midfielders (WM) (p < 0.001–0.009; ES: 0.14–0.36); HID for all positions excluding goalkeepers (GK) (p < 0.001–0.007; ES: 0.2–0.54) and SprD for all positions except for GK, central midfielders (CM) and AM, (p < 0.001–0.020; ES: 0.19–0.39). Trivial to small differences were seen in season-to-season comparisons for TD (p < 0.001–0.023; ES: −0.16–0.52), HID (p < 0.001–0.033; ES: 0.10–0.38) and SprD (p < 0.001–0.025; ES: 0.13–0.27) for both team and positional differences.
Conclusion
Small to moderate increases in team TD, HID and SprD occurred in the EPL between 2014/2015 and 2018/2019, with trivial to small changes in season-to-season variations. Actual changes in running load over time appear to be dependent on playing position. Running load trends should be updated regularly and practitioners should be aware of the variability within their team, and programme accordingly.
Introduction
Player load monitoring is a common term used within elite football and is a consistent means of assessing the running load performed in both training and competition. 1 Running loads during competitive matches have been proposed to have become more intense, placing greater physical stress upon the modern-day footballer. 2 However, the literature underpinning this extrapolation is dated, with almost 10 years since the last study in the English Premier League (EPL) 3 and may not fully represent the running load profiles of players since 2013.
Running load outputs in competition are commonly obtained through either optical, or more recently global positioning systems. High-intensity distance (HID) in the EPL increased in games between 2006 and 2013 (HID; + 30%; > 5.5ms−1 and sprinting distance (SprD; + 35%; > 7ms−1). 3 Positionally, fullbacks (FB) were shown to have the highest increases (HID: 35% and SprD 62%) and attackers the lowest (HID: 24% and SprD 36%). 4 Therefore, consideration must be given to the evolving positional and individual differences displayed in running load in relation to positional demands, to effectively physically prepare players for their positional requirements.4,5 Additionally, inter-individual differences related to team playing strategies and their associated positional requirements will affect the running load requirements for the player over time. 5
Findings from previous studies have led to the assumption that the intensity of the game will continue to evolve, with predicted increases of 40% in HID by 2030. 6 Further work has highlighted the potential requirement for players to possess the capacity to perform greater acceleration and deceleration movements more efficiently. 2 There is a lack of recent evidence surrounding running load (volume and intensity) demands on players within the EPL and predictions based on the work of Barnes et al., 3 must be interpreted with caution due to the age of the study and improvements in optical tracking technologies. 7 For these reasons, it is important to update the current information available, to see if there are changes in running load trends.
The aim of the present study is to provide an update on team and positional running loads of footballers in the EPL, seeing how these have evolved over the course of five seasons from 2014/2015 to 2018/2019. This will build upon the existing literature 3 and provide more insight into how running loads of EPL football have evolved.
Methods
Participants
Running load data of 1397 players from 1872 games over a 5-season period (2014/2015 to 2018/2019) were collated in the present study. Natural variation occurred in the 1397 players analysed between the number of seasons played (Table 2) and number of positions players played in throughout the season (Table 3). Due to change of optical tracking provider (from TRACAB® to Second Spectrum®) in the 2019/2020 season and changes in stoppages (additional water breaks) and increased substitutions due to the impact of COVID-19, data from the 2019/2020 season was excluded from the analysis. Players were split by position, determined by OPTA statistics (www.optasports.com), for more detailed analysis: goalkeeper (GK), centre back (CB), FB, defensive midfielder (DM), centre midfielder (CM), attacking midfielder (AM), wide midfielder (WM) and centre forward (CF). Twenty-seven games in the 5-year period did not have tracking data due to technical faults. Games, where the match finished with less than 22 players on the pitch (238 games; due to a sending off or injury), were removed from this data set. This left 1634 games for analysis.
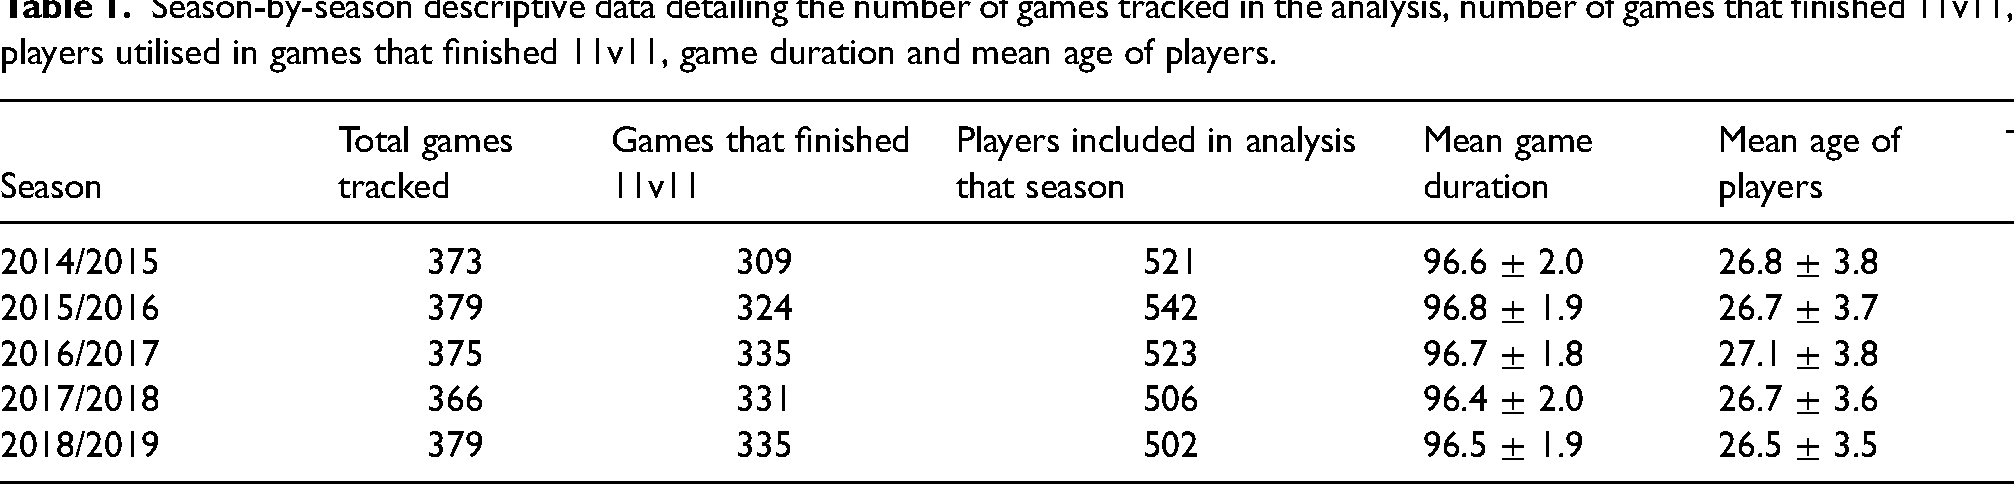
Season-by-season descriptive data detailing the number of games tracked in the analysis, number of games that finished 11v11, players utilised in games that finished 11v11, game duration and mean age of players.
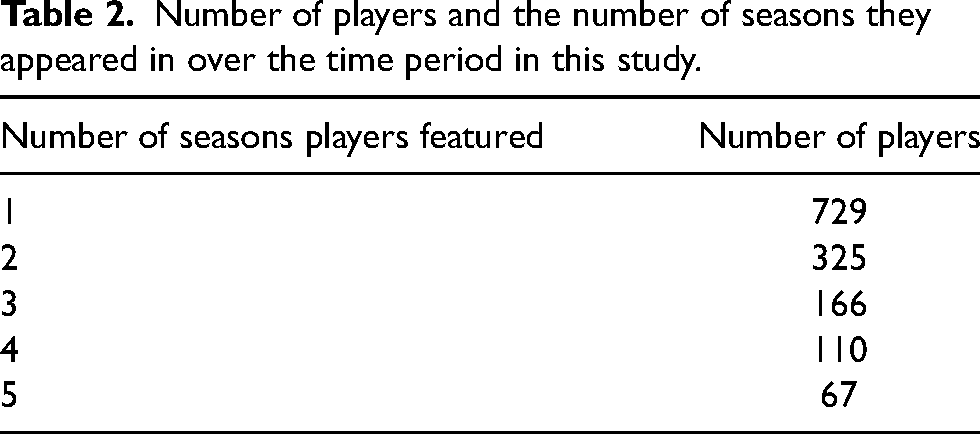
Number of players and the number of seasons they appeared in over the time period in this study.
The number of players who played in numerous positions within this data set.
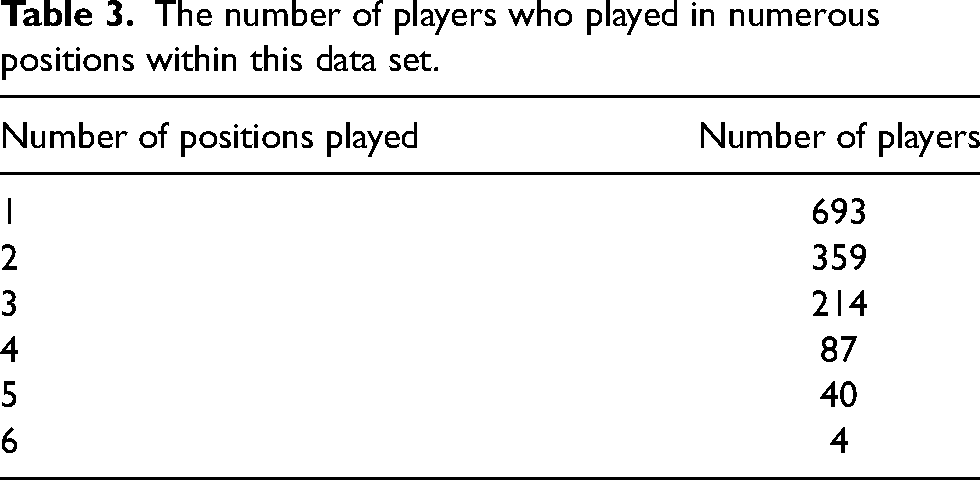
Table 1 shows the season-by-season number of games selected for analysis, number which finished 11v11, game duration and players utilised (in matches that finished 11v11). Ethical approval for the use of match data was obtained from the host university, in accordance with the Helsinki Declaration.
Table 2 shows the number of players and the corresponding number of seasons they appeared in the analysis.
Table 3 shows the number of players and the number of different positions they played in.
Data collection
Positional tracking data for 1634 games over 5 EPL seasons was recorded by TRACAB® Gen-4 (TRACAB; ChyronHego, New York, USA). The data for TRACAB® has been shown to be valid and reliable.8,9 TRACAB® Gen-4 utilises six semi-automated HD cameras sampling at 25 Hz, installed at a height of 36 m in the EPL stadiums. The dwell time (minimum effort duration) was set at 0.5 seconds for HID running and 1 seconds to detect SprD efforts as per manufacturer's guidelines. Tracking data were measured throughout the full game, including any stoppages, and added time. After the games, TRACAB® delivered a physical summary file (Excel, .csv format) to the EPL portal. Activities analysed were total distance (TD) covered by the players, absolute HID, (speed >5.5 m/s−1) which combines high-speed running (5.5–7 m/s−1) and sprint (speed >7 m/s−1) distances and absolute SprD. These running load measurements were chosen as they are frequently reported in the literature and are often monitored closely by professional football clubs when analysing optical tracking data.1,10 All player data were anonymised prior to analysis to ensure confidentiality.
Statistical analysis
Data were analysed for season-to-season changes in team and positional (GK, CB, FB, DM, CM, AM, WM and CF) running load (i.e. 2014/2015 compared to 2015/2016; 2015/2016 compared to 2016/2017, etc.). The data was processed and analysed using R software (https://www.r-project.org/), Rstatix and Tidyverse.
A one-way ANOVA (used to determine whether there is a statistically significant difference between the means of >3 groups) and Tukey's range test were used to analyse statistical significance. Statistical significance was set at p < 0.05. The p-value was adjusted for multiple pairwise comparisons. The effect size (ES) was calculated using Cohen's d to determine the relationship between the seasons evaluated. The magnitudes were reported as trivial (<0.2), small (0.2–0.6), moderate (0.6–1.2) and large (1.2–2.0). 11 A confidence interval of 95% 11 was used to show the difference in mean outputs between successive seasons (i.e. 2014/2015 to 2015/2016; 2015/2016 to 2016/2017, etc.) and when comparing seasons 2014/2015 to 2018/2019.
Results
Team and positional running load characteristics (TD, HID and SprD) for each season are reported in Table 4. Small to moderate increases in total team TD, HID and SprD were found when comparing seasons 2014/2015 to 2018/2019.
Comparisons of 2014/2015 to 2018/2019 seasons detailing team totals and positional differences for TD, HID and SprD.
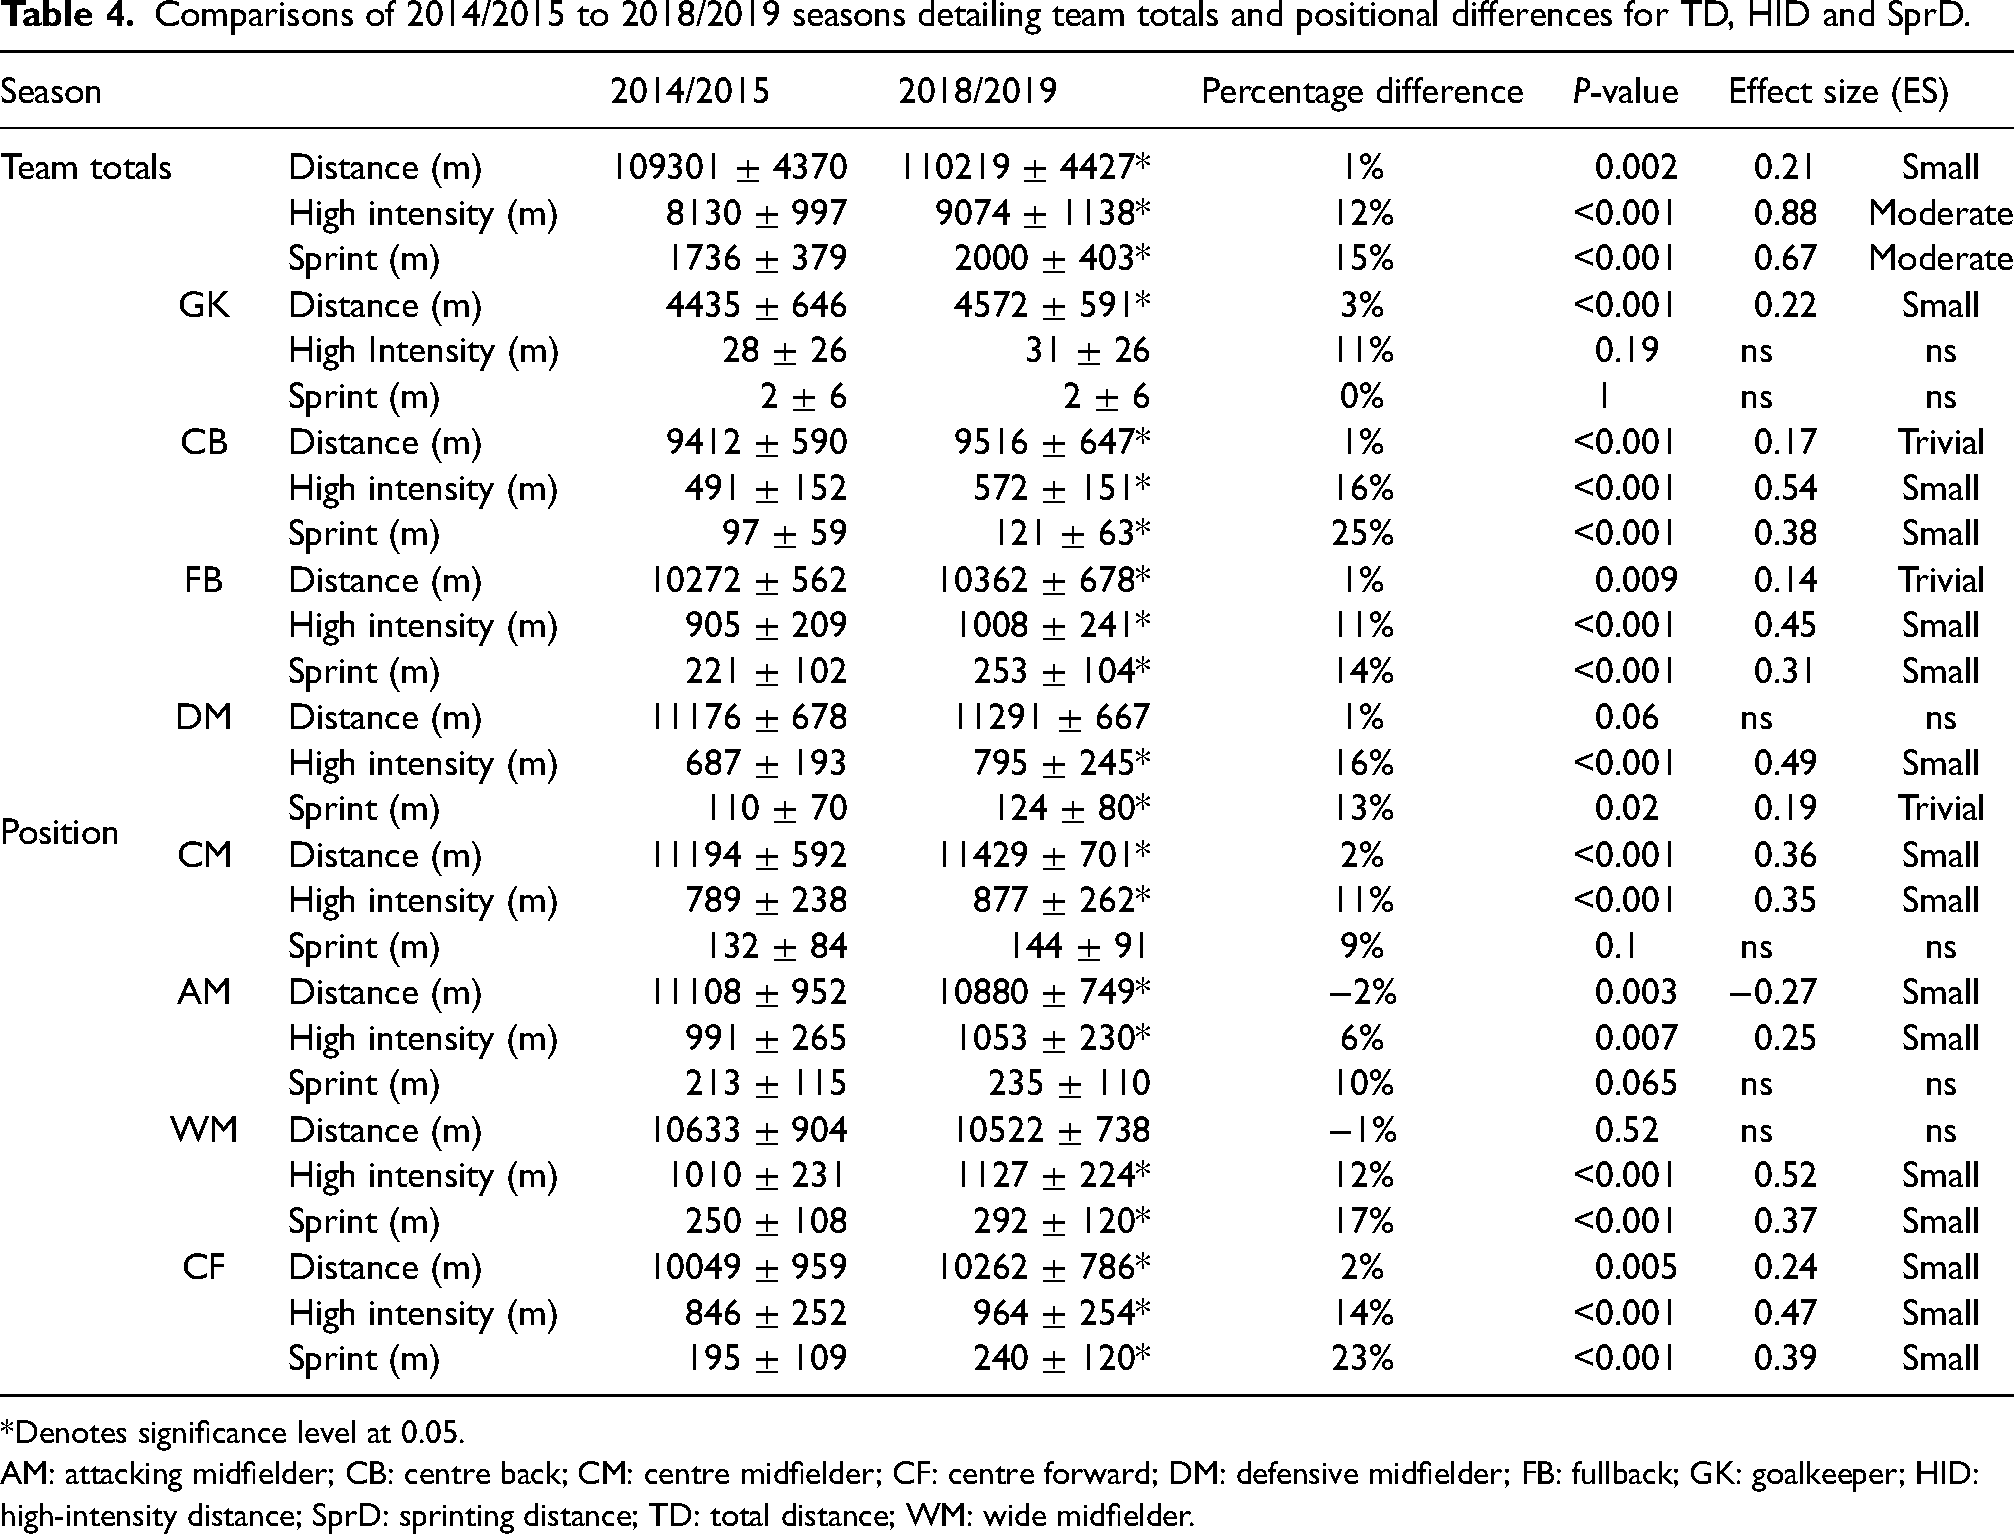
*Denotes significance level at 0.05.
AM: attacking midfielder; CB: centre back; CM: centre midfielder; CF: centre forward; DM: defensive midfielder; FB: fullback; GK: goalkeeper; HID: high-intensity distance; SprD: sprinting distance; TD: total distance; WM: wide midfielder.
Team total running load
Team total running load for TD, HID and SprD for each season are shown in Table 5. The main findings showed trivial to small changes (majority increases) from season to season for team total TD, HID and SprD.
Team total outputs for TD, HID and SprD each season. P values and effect size (ES) are in comparison to the season before.
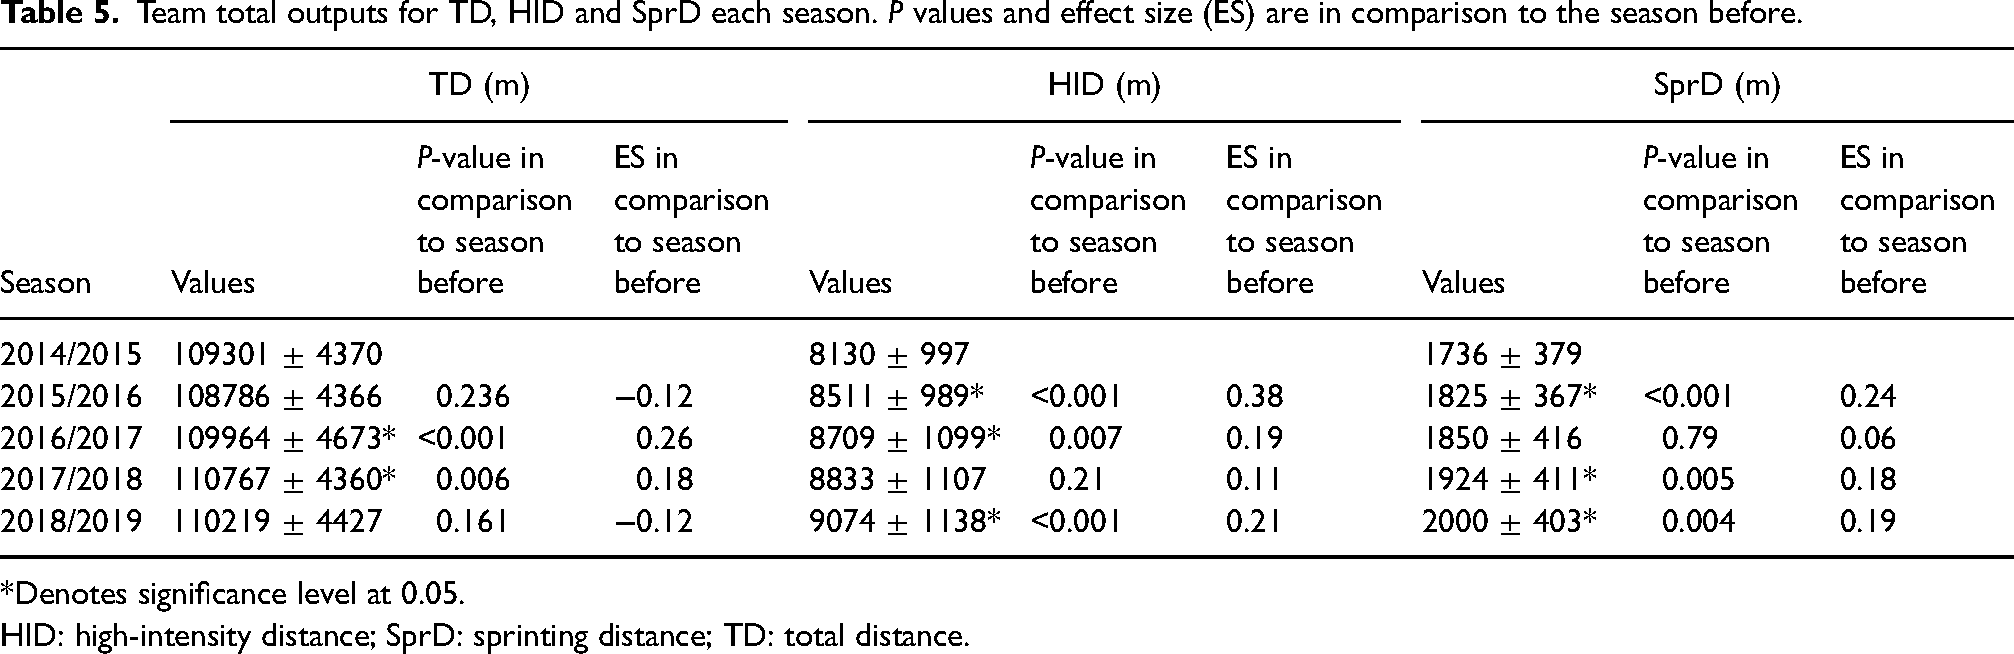
*Denotes significance level at 0.05.
HID: high-intensity distance; SprD: sprinting distance; TD: total distance.
Positional running load
Table 6 shows the positional breakdown for TD, HID and SprD running load covered season to season (metres).
Positional breakdown for each season, highlighting the number of players played in positions (note the same player can play in several positions), mean age of the players and TD, HID and SprD metres covered season to season.
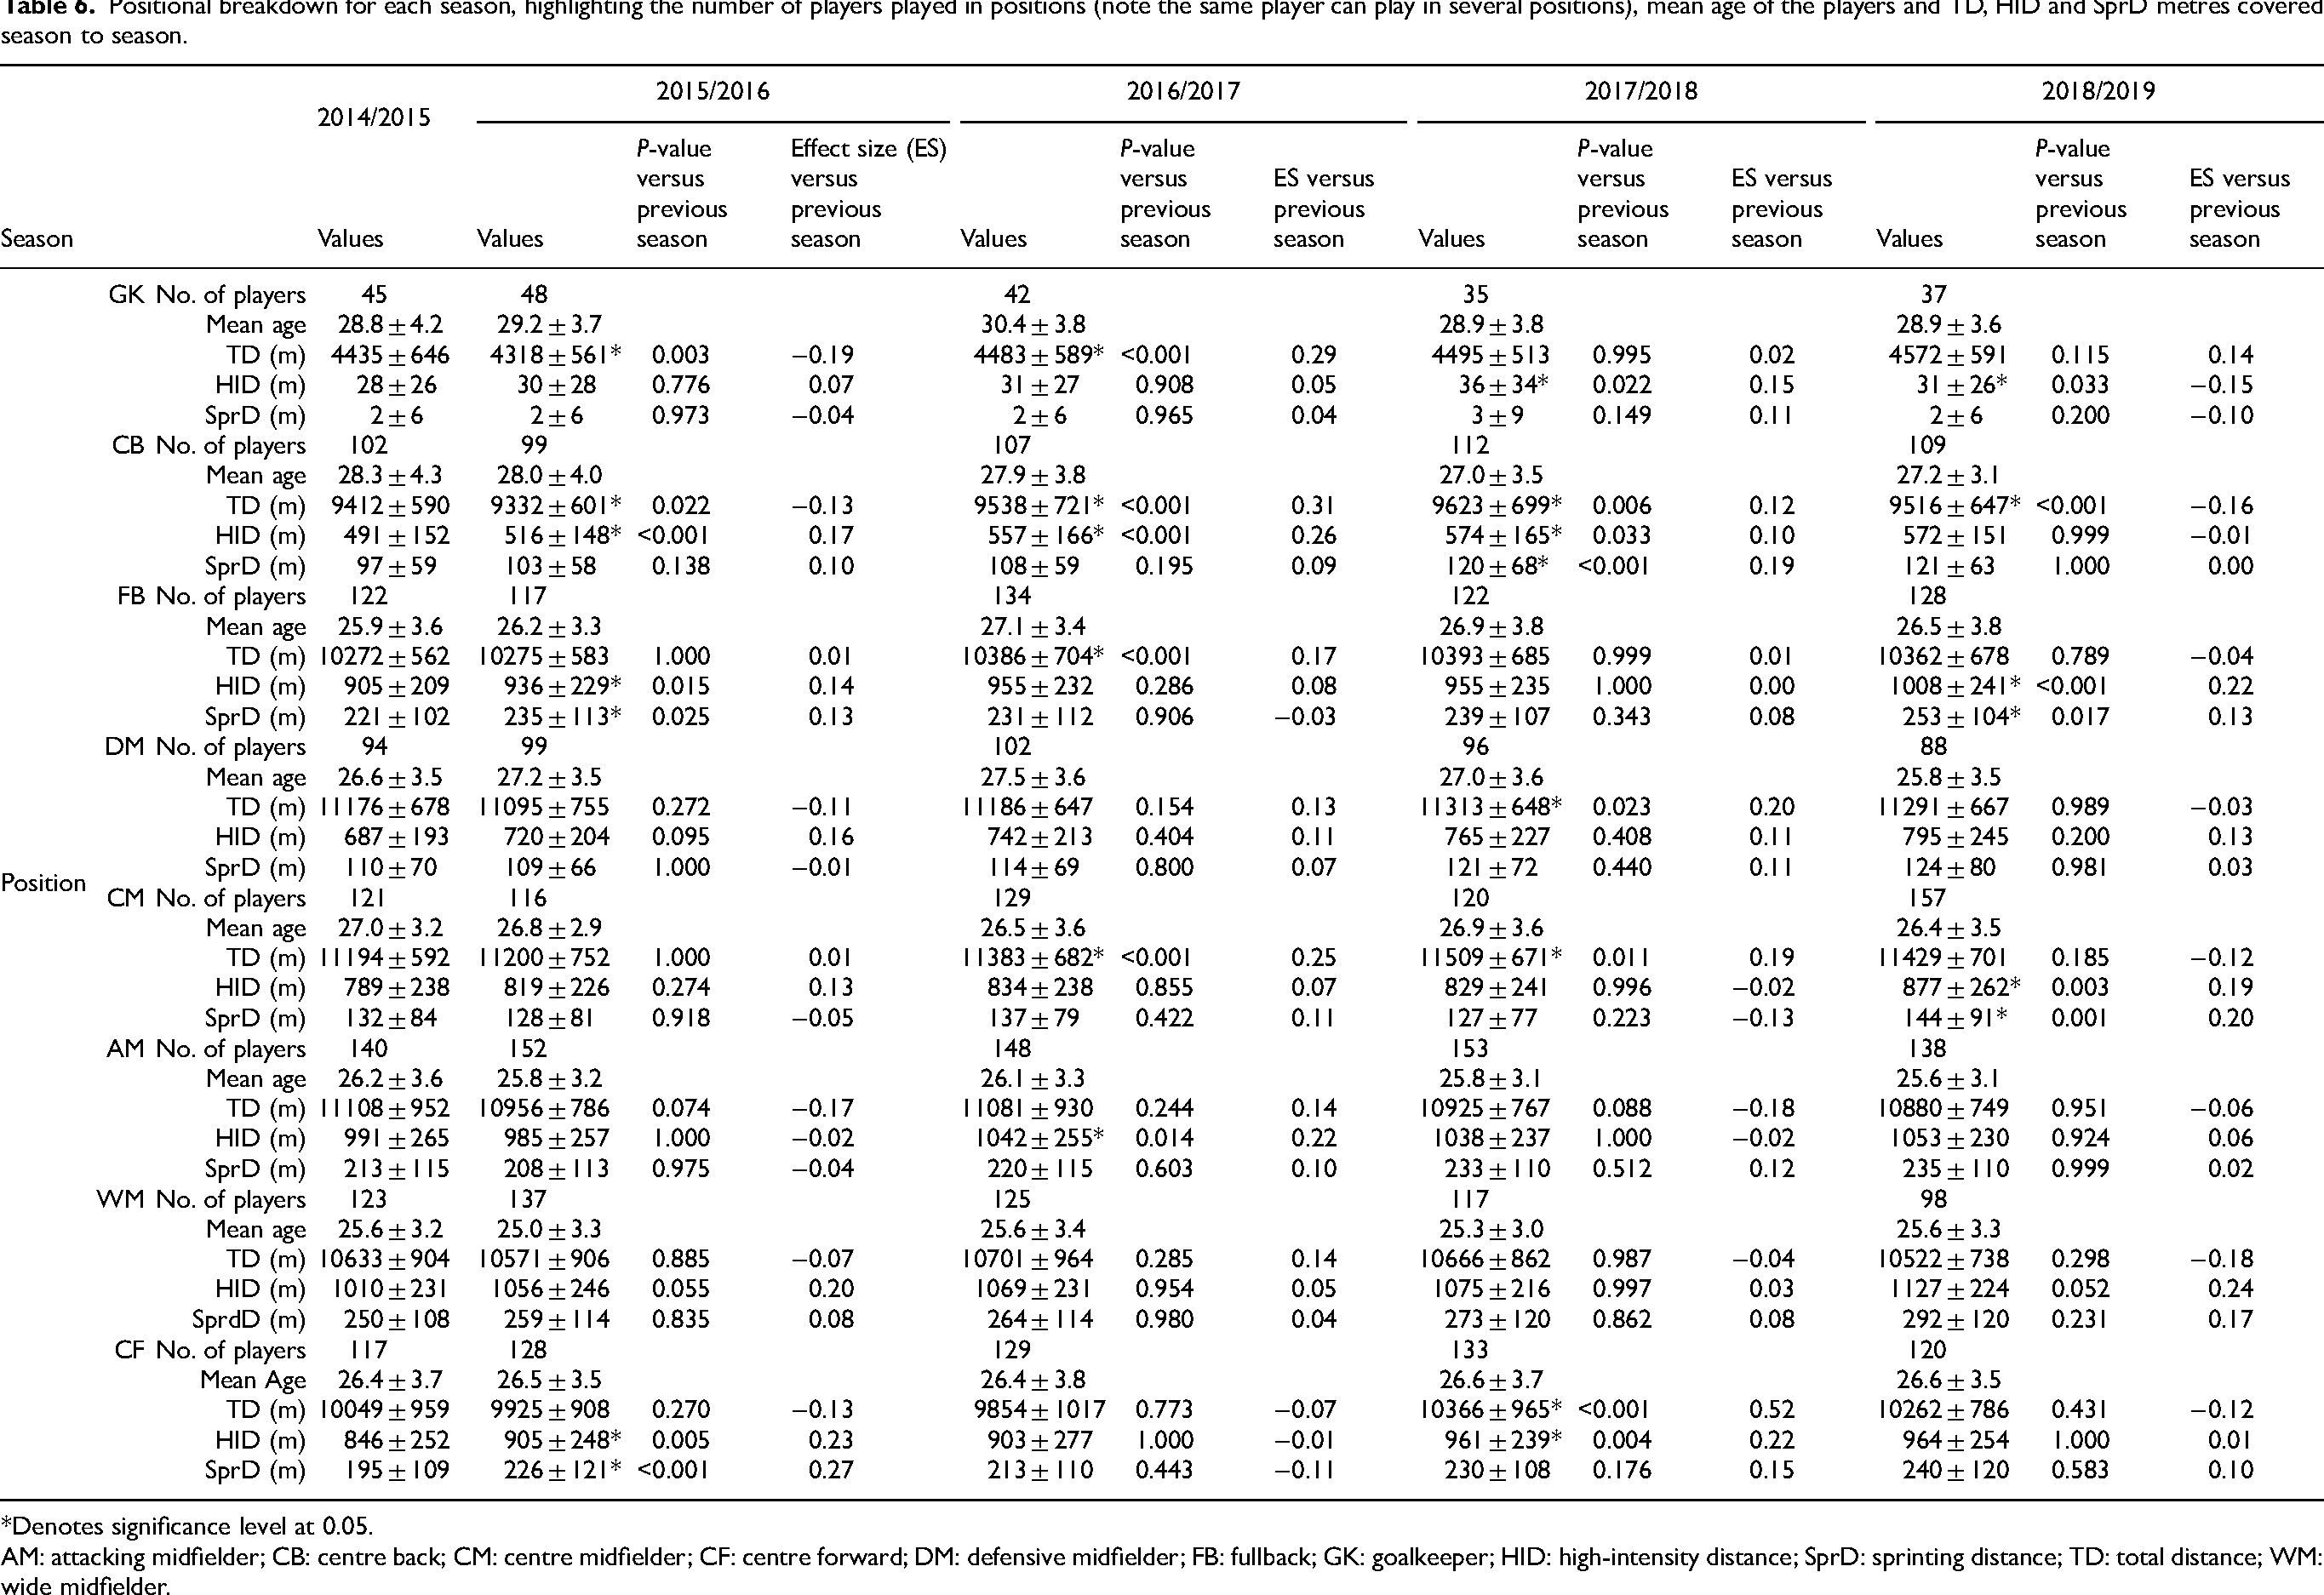
*Denotes significance level at 0.05.
AM: attacking midfielder; CB: centre back; CM: centre midfielder; CF: centre forward; DM: defensive midfielder; FB: fullback; GK: goalkeeper; HID: high-intensity distance; SprD: sprinting distance; TD: total distance; WM: wide midfielder.
On a positional level, season-to-season changes showed trivial to small changes in running load outputs for all positions apart from WMs, who saw no significant change between seasons (Table 6). The majority of season-to-season running load changes were increased. However, whilst CB's exhibited small increases in two of the seasons, there were also two seasons during the observation period where they showed trivial decreases in TD. The combination of these trivial to small increases, cause a small to moderate increase in running load over the five seasons. Small increases in TD were seen for GK, CM and CF when comparing 2014/2015 to 2018/2019 (Table 4), whilst trivial increases occurred for CB and FB. A small decrease in TD was seen for AMs, whilst no differences were apparent for DM or WM. GKs displayed no difference in HID and SprD between 2014/2015 and 2018/2019 seasons (Table 4). All other positions had significant small increases in HID (ES = 0.25–0.54) and trivial (DMs) to small (CB, FB, CM, AM and CF) increases in SprD between 2014/2015 and 2018/2019 seasons, with the largest increases seen in CBs (HID (ES = 0.54) and SprD (ES = 0.38)) and CFs (SprD (ES = 0.39)) (Table 4).
Discussion
The aim of the present study was to update team and positional running load demands in the EPL and look at the evolution across five seasons from 2014/2015 to 2018/2019. The most recent work identifying running load demands in EPL football was completed by Barnes et al., 3 which may no longer be representative of current positional game demands. Team totals increased for TD (small), HID (moderate) and SprD (moderate) between the 2014/2015 and 2018/2019 seasons. On a season-to-season basis, trivial to small changes were observed in some, but not all, of the five seasons analysed when compared to the previous season.
Team running load
Significant changes in TD, HID and SprD on a team level were observed between 2014/2015 and 2018/2019. Previous literature reports increases in running load, 2006/2007 to 2012/2013 highlighting a 30% and 35% increase in HID and SprD, respectively. 3 Recently, work by Nassis et al., 6 predicted an increase of ∼40% in HID by 2030, however, the present body of work potentially highlights this may be overestimated, highlighting increases of 12% and 15% for HID and SprD, respectively. Comparisons of these data sets must consider the tracking technologies utilised to quantify the running loads. Previous work 3 utilising Prozone technology had a sampling frequency of 10 Hz, whereas the technology used in this study (TRACAB) samples at 25 Hz, a factor that has been shown to increase the accuracy of reported measurements. 12 Research has indicated differences of ∼50% in SprD values when different tracking systems are utilised,7,13 potentially, explaining the overestimations of earlier running load data sets. For this reason, regular updates of running load trends may be required as technology advances and optical tracking providers change.
Interestingly, although mean season to season increases were noted for metrics of TD, HID and SprD these were not consistently significant, again coherent with the findings of Barnes et al. 3 It is also important to note, no season saw a significant increase in all three variables in the same season, although, over a longitudinal period all three displayed a significant increase. There could be important implications to our findings, where practitioners should not ignore these incremental increases, as rises in running loads should prompt the need to review training prescription, periodisation and recovery methods to ensure players are best prepared for game demands. These incremental increases may also allow players to cope better with changes in match running load, allowing them to become more accustomed and prepare for such increases. This could also be important for players coming from academies, with trivial to small rises seen season to season; the compounding of these changes may see players need to increase their average running load by ∼15% every five seasons. However, the running load trends for academy players are not reported in the research literature (to our knowledge) and should be addressed in future research. Additionally, the increase in the number of games through additions of international tournaments may require players to produce higher running loads per game as well as maintain it for more games, and more frequently, across the season. This could potentially present an increased injury risk for a player, with higher demands required across a season. Consequently, this places an increasing emphasis on appropriate training prescription and periodisation to meet the increased volume, frequency and density of running load, alongside implementation of recovery strategies around dense fixture periods.
It is possible that tactical changes to positions (e.g. more pressing/increase in number of CM in a formation – 442 vs. 532) over the years may have caused players to run differently (more or less) season to season, but this is purely speculation. Increases in high-velocity running load metrics, such as HID and SprD, may be explained by evolving formational and tactical trends. 14 Research suggests football is moving towards a higher pressing 15 and more transitional game, 16 with counterattacks becoming a prominent way to score. 17 These transitions have been shown to increase running load demands 18 and could lead to increased speed of ball play. This potentially influences the head coaches to select players who can perform at higher speeds, evolving the physical profiles of teams in the EPL, consequently contributing to an increased running load profile of teams in the EPL. These outcomes will be determined by a team's style of play, with trends being shown to differ among teams 19 and leagues. 20 In turn, a team's style of play is likely to influence the running load requirements for individual positions within a team. Future work should consider the contribution of formational and tactical influence on the longitudinal analysis of running loads.
Positional running loads
Most significant positional running load changes between 2014/2015 and 2018/2019 showed increases across five seasons (Table 4); however, AMs showed a small decrease in TD, highlighting the need for practitioners to observe changes at a more granular level when making decisions around training and recovery. Season-to-season running load showed most of the significant changes in positions were increases, however, trivial decreases were seen in two seasons for CBs. This highlights how positional running load can fluctuate season-to-season again emphasising the importance of practitioners evaluating the running load demands in their teams and players regularly. Small and trivial increases were seen in 2016/2017 (ES = 0.23) and 2017/2018 (ES = 0.18) for team TD. Positionally, 2016/2017 showed increases in TD by GK, CB, FB and CM and in 2017/2018 increases in TD for CB, DM, CM and CF. Reasons for this increase and more specifically in these seasons are unclear, but the increasing trend in transitional football 16 may offer a partial explanation. Logically, evolving formational and tactical demands could contribute to greater distances being covered18,21 with faster transitions meaning teams will have to move more in relation to the ball and opposition. The variations in the running load outputs in each season highlight the importance for practitioners to understand the need to delve deeper into match data, contextualising the running demands for individual players. 22 Contextualising data will allow staff to design training sessions to suit their teams and individual players needs around their playing style (e.g. high press/counterattacking) and individual roles within the team's training and playing methodology. The variability between players and even positions highlights the need to be aware of potential fluctuations in running load requirements across time, suggesting that averages over longer periods cannot be the sole information used. Rolling averages, maximum and minimum running loads may provide a richer source of information in the preparation for the fluctuating demands of footballers. Over a season, increases in certain running load metrics on a game-by-game basis may mean players could be under-prepared to compete at certain times in the season. Practitioners may benefit by exposing players to higher running loads during training so players are better prepared to cope with higher match running loads. Opposition teams may cause a certain position to increase HID in matches through tactical reasons (e.g. transitions). 18 Should this occur for a period of time, players may become overexposed to HID and could increase the risk to posterior thigh injury. 23 This would require practitioners to adapt training demands for certain individuals.
Interestingly, the TD reduced for CBs (2018/2019 season) when there was a significant increase in HID and SprD between 2016/2017 and 2017/2018 seasons. The reduced TD in the 2018/2019 season may have been due to a tactical response to reduce the opportunity for teams to counter by suppressing spaces between the teams. Although not significant, this same pattern was seen for the CFs TD, HID and SprD in the same seasons, suggesting that these may be linked to tactical responses. Previous research has shown team movements are linked with one responding to another (i.e. one goes forward, other goes back). 24 Unfortunately, due to the data set used, we cannot see whether this trend was the same for the 2015/2016 season due to not having TRACAB® data for the 2013/2014 season.
No significant changes in running load were observed season to season for WMs. Similarly, DMs showed an increase in TD in one season (2017/2018) and AMs in HID in one season (2016/2017). This suggests there may be no significant tactical changes in the roles of a WM, or any changes in tactical requirements did not have a significant impact on WM running load. Minimal changes are seen in the DM and AM roles in the EPL between seasons. Whilst speculative and requires further investigation, tactical changes over the years may be one explanation for why running loads have changed. Alternatively, the athletic profiles of players in these positions may not have changed too much over this period. Whereas increases seen in the HID and SprD between seasons for other positions (and overall team values) may be due to the athletic profiles of some of the players chosen to play. It is plausible that faster players might acquire greater absolute HID and SprD values due to their ability to get to those speeds easier. This will be individually dependent due to the different player profiles within a team. 25 Head coaches may believe having faster players in key positions allows them to perform tactical requirements (e.g. increased speed of transitional football) which may increase success in games. This may produce a ‘Darwinian effect’ with those who possess these traits being more likely to be picked for EPL teams.
Future research
Running load is only one aspect of the game and an interaction between a myriad of factors is required to create the optimal chance of winning a football match. Future studies should consider the effect of running outputs on match outcome in the EPL. Previously, running has been suggested to be an important aspect of a team's chance of winning.27,28 This may mislead practitioners and underestimate the complexity of the game. Contextualisation of the running, how it relates to tactical and formational change and an understanding of how different types of running influences match outcome is needed. Emphasising the importance for researchers and practitioners to search for the process, and how these impact on team success. It is important to note that running more may not be the desired outcome, but rather to be in the right place at the right time. 26 Importantly, given that football is not a ‘brainless task’ 29 the effects of increased running load may increase mental fatigue for a player, which may affect the player’s decision-making. 30
The incorporation of tactical elements within the physical data has started to be explored. 22 Additional tactical information in the future may provide an understanding as to whether players are able to run more efficiently, affecting the movement of the team and increasing the chances of successful outcomes (e.g. pass/goal). The speed of which certain movements are performed may affect the chances of success and may determine the times in which a player should run faster or more. Should this be a possibility, a better understanding from the player may preserve their running load; allowing the player to ‘keep more in the tank’ through pacing strategies 31 for the pertinent moments in the game or for the next fixture.
Although this research is an update on previous findings, it is important practitioners begin to look at if there are optimal moments in a game to run, which may increase the potential for team success.
Limitations
Running load involves extensive (e.g. HID and SprD) and intensive (e.g. acceleration and deceleration) measures. 32 This article focuses primarily on the extensive load of football. HID includes SprD within that which may contribute to some of the findings. These metrics were chosen due to their use by practitioners in football. It is also important to understand that a key part of the running load in football is the load component, characterised by accelerations and decelerations. Current optical tracking technologies are not capable of accurately determining acceleration and deceleration efforts, 33 hence why they were not analysed in this study. However, research has suggested that intensive outputs may play a significant role in match play.2,34 Future research needs to look at this over multiple teams and seasons to see if this is a contributing factor towards team success.
Conclusion
The present study updates previous work observing longitudinal physical running load outputs in the EPL.3,4,26 This article adds to the work of Barnes et al., 3 by analysing season-to-season comparisons. Running load demands between 2014/2015 and 2018/2019 have increased, but it is imperative that practitioners in elite football understand that player running load profiles are changing from season to season. Due to the inter-positional differences, it is key that staff consider the contextual influence upon distances to inform the training prescription at their club, focused within their game model. This increase in game running loads suggest practitioners are required to prepare players for these greater demands, but we suggest this should be achieved by considering ecological dynamics and incorporating contextual information such as position-specific conditioning, that is, training that relates to key game moments, due to the positional running load differences seen. The variability in the averages suggests that a long-term average alone may not be enough to build a full understanding. Running load is likely to be affected by environmental and situational factors around the player within the same game and from one game to another.
Running loads show differences between positions from season to season. Findings in the present study detail that small to moderate increases in TD, HID and SprD were found for team totals in the EPL between 2014 and 2019. Positional analysis highlights significant increases in HID for all positions except GK, with SprD and TD significantly increasing for all positions except for CM/AM/GK and WM/DM respectively. Trivial to small differences were found in team and positional TD, HID and SprD, which when combined sees a bigger increase in running load over the time period analysed. This is an important consideration for sports scientists responsible for the physical preparation of players for competition and recovery strategies between games. As we did not find consistent increases for all the seasons and all positions, this highlights the need for practitioners to understand the individual player demands when assessing and preparing them for training and competition. Although, it is important for practitioners to contextualise this information to establish why some teams, positions and players run more than others and how this may affect match outcome. It is also suggested that these trends need to be updated regularly to monitor running load patterns and see how the physical demands are increasing for players in an ever-increasing fixture schedule.
Footnotes
Author’s note
This paper was published with the permission of The Premier League but not implying the views of The Premier League.
Declaration of conflicting interests
The author(s) declared no potential conflicts of interest with respect to the research, authorship, and/or publication of this article.
Funding
The author(s) received no financial support for the research, authorship, and/or publication of this article.