
Abstract
The interest in tactical analysis in soccer has increased in the latest years, especially with the growing availability of player tracking data. With it, the defending team's compact organization, which is considered by practitioners to be an important factor in defense, was repeatedly examined. However, the connection between this defensive principle of play and the defending success remains unclear. Therefore, this study aims to investigate the relation of the principle of playing defensive compact organization to the success of the defense. Based on tracking and event data of 153 games of the German Bundesliga (season 2020/21), the compactness (surface area, spread of the team, and of defending subgroups) and the organization (distances between formation lines) of the defending team was compared between successful and unsuccessful defensive plays. There were almost no differences in the compactness of the whole team, and the organizational measures between successful and unsuccessful defensive plays. The defending subgroup of five defenders closest to the ball showed a higher compactness (smaller surface area and smaller spread) in successful defensive plays compared to unsuccessful ones (−0.08 ≤ d ≤ −0.16). Our results indicate that the compactness of players in areas close to the ball seems crucial for defensive success. However, the compact organization of the entire team does not seem important to regain the ball in defense.
Highlights
Successful defensive plays are characterized by higher compactness in areas close to the ball (represented by the five defenders closest to the ball) to pressurize the attacking player in control of the ball and close pass options
In contrast, no evidence is found that the compactness of the whole defending team is related to the success of a defensive play
All elite soccer teams studied show a good compact organization in defense across all defensive plays considered, exemplified by small inter-line distances (Ø distance def-mid = 10.22 ± 3.76 [m]) and a small surface area of the defending team (Ø surface area = 792.54 ± 227.24 [m2])
Analyzing the distances between the formation lines, no differences are found between successful and unsuccessful defensive plays
Introduction
Due to the development of spatio-temporal tracking data of high resolution, the analysis of tactical performance enjoys growing interest. This analysis of tracking data enables researchers to investigate complex interactions between all players to understand the emerging patterns of the game. 1
These investigations mostly focused on offensive play with a tendency to analyze on-ball actions such as shots (e.g., expected goals) 2 or passes. 3 However, soccer is a low-scoring game, 4 which is also reflected in practice, where coaches often spend more time teaching defensive principles.
Accordingly, several studies have emphasized the importance of defensive play, with defensive variables considered at least as important as offensive variables.5,6 Furthermore, a recent review 7 showed that there is an increasing number of studies on defensive play. Still, studies on cooperative defending of the entire team (at a team-level) or subgroups (at a group-level) are sparse. Therefore, this study will investigate if specific measures of cooperative defending at a team- and group-level (organization and compactness) differ between successful and unsuccessful defensive plays. It is noteworthy that the tactical behaviour of players in team sports can be distinguished into the behaviour of the whole team (team-level), the behaviour of a subgroup consisting of at least two players (group-level), and the behaviour of single players (individual-level). 7
The collective behaviour of soccer players can be analyzed using the dynamic system theory, which states that both teams behave in an opposing relationship 8 depending on the ball possession. The players of the defending team coordinate their actions to prevent the opponent from scoring and eventually regain possession. In contrast, the players of the attacking team coordinate their actions towards maintaining possession and achieving scoring opportunities to eventually score. Accordingly, there are differences in the characteristics of the movement behaviour of players between these different game phases.
While the offensive team is characterized by high movement variability to disrupt the opposing organization 8 and create open space for passing options or scoring opportunities, 9 the defending team is characterized by more ordered and compact movement behaviour. These characteristics result in the players of the attacking team moving further apart (expanding), while the players of the defending team move closer together (contracting), which is also referred to as the expansion–contraction relationship between the attacking and defending teams.10,11
The contraction–expansion relationship was found by four of five individual studies analyzing tracking data of professional soccer players in official 11vs11 games.9,10,12,13 To quantify the compactness of a team they used the surface area,9,10,12,13 the spread,10,12 the width and length, 9 and the effective area of play of a team. 12 Solely one study found no proof of the defending team contracting while the attacking team expanding using surface area and spread measures. 11
While the aforementioned studies described collective defending behaviour in general, only two studies related their analysis of compact defending to performance (successful vs. unsuccessful defending). Moura et al. 10 found a higher compactness (represented by smaller surface area and spread) of defending players in the last moment of a successful defensive play (tackle) compared to the last moment of an unsuccessful defensive play (shot on goal). In contrast, Bartlett et al. 11 found no effects in the average spread and surface area over a possession between successful (tackle or other possession regain) and unsuccessful (shot on goal) defensive plays. Given these contradicting results, the importance of defensive compactness to defensive success remains unclear.
The above-presented knowledge can be summarized in one tactical principle: Defensive compact organization. 14 A tactical principle of play describes the superordinate and general behavioural patterns in solving problems that arise in specific playing phases (e.g., offense, defense).15,16 With it, the specific behaviour of the players is caused to optimally achieve the goals in the respective playing phase.15,16 However, principles of play could be associated with particular playing styles (e.g., deep defending) and little is known about which principles of play are connected to success and therefore are beneficial.
The tactical principle of play defensive compact organization 14 can be defined by three main parts: Compactness, contraction of compactness, and organization within this compactness. While compactness describes the current spatial proximity of players of a team at a given time point (which was investigated by the mentioned studies above), the contraction of compactness describes the change of compactness over a time period. 15 High compactness represents players in close proximity to each other (e.g., small surface area) and a high contraction is defined as a process of players moving closer together thus increasing the compactness (e.g., decreasing size of surface area). In contrast, the organization describes the formation and coordination of players within this compactness (e.g., distances between formation lines) with players in different positions having different tasks (tactical formation). A structured organization makes it harder for the opposing team to play within or through this compact organization and eventually achieve dangerous goal-scoring opportunities.
This defensive compact organization is characterized by players maintaining an optimal and small distance between each other, 9 precise structure in the spatial or tactical formation (e.g., small distances between formation lines), and clear distribution of tasks between the different playing positions or groups (e.g., central midfielders prevent central passes, wide midfielders push the ball-carrying player to the outside of the pitch).
In summary, as mentioned above the knowledge about this tactical principle of play remains unclear, as one study showed that increased compactness is connected to defensive success and one study did not find this result. However, as both studies solely investigated the compactness of a team at a given time point, the aspects of contraction of compactness and organization are not captured. This limits the outcomes regarding the detailed knowledge about this tactical principle of defensive play. Furthermore, both studies examined fewer than 11 games, which is a very small sample size that makes it difficult to generalize the results. Further, both studies solely used two measures to describe the teams’ compactness at a team level (surface area and spread) without considering the group level. It can be argued that it is necessary to include more variables (e.g., distance between formation lines) and also variables on the group-level enabling one to get more informative insights into defensive play.
Therefore, the aim of this study is to gain more detailed insights into the tactical principle of defensive play: defensive compact organization, exploring the differences of compactness, contraction of compactness, and organization at a team- and a group-level between the successful and unsuccessful defensive plays using a large sample size.
We hypothesized that successful defensive plays show higher compactness (e.g., smaller surface area) and higher contraction of compactness and better organization (e.g., smaller distances between formation lines) compared to unsuccessful defensive plays.
Methods
This study was approved by the local ethics committee (Human and Business Sciences Institute, Saarland University, Germany, identification number: 22-02, 10 January 2022) and all procedures were conducted in accordance with the guidelines of the Declaration of Helsinki.
Data
We used an observational and explorative study design in which tracking data and event data of all 153 games of the second half of the German Bundesliga season 2020/21 were included.
The tracking data was officially collected with a semi-automatic multi-camera system (TRACAB, ChyronHego, Melville, NY, USA) which has a sampling frequency of 25 Hz. Thereby the X- (length) and Y-coordinates (width) of all players on the pitch and the ball are collected in metres [m]. In addition, the Z-coordinate (height) for the ball is measured. All positions are tracked on a standardized pitch with 68 m of pitch width (on the y-axis) and 105 m of pitch length (on the x-axis) with the bottom left corner of the pitch representing the origin of the coordinate system. This tracking system was found to be a valid measurement technique to analyze soccer-specific performance. 17
The associated event data was officially annotated by Sportec Solutions (Sportec Solutions AG, Ismaning, Germany) using manual tagging based on the definition catalog of the German Soccer League (DFL). 18
Both data sets (tracking and event data) were imported to Python 3.8 and all data processing, visualization, and statistical analysis were accomplished using the NumPy, pandas, math, SciPy, scikit-learn, and Matplotlib libraries.
Data processing
Synchronization of position and event data
Due to the manual annotation of event data (human inaccuracy), the raised timestamps and origins of events vary from the automatically raised tracking data, and synchronization of both data types is necessary to combine both data types. Therefore, we determined the matching time-point (frame) of tracking data for every event (pass, tackling, etc.) of the event data. To achieve this, we defined a search time window of eight seconds before to eight seconds after the tagged time-point of an event in the event data. For every resulting time-point (frame) of tracking data in this time window, we calculated the distance between the involved player(s) to the ball (distance of player(s) to the ball) and their distance to the tagged origin of an event in the event data (distance of player(s) and ball to event origin). The distance of player(s) to the ball was weighted ten times over the distance of player(s) and ball to the event origin because deviations were expected in the manually tagged event origin. The searched time-point (frame) was identified using the smallest value that resulted from the described calculations.
In a partial sample of 50 events, our algorithm was able to reach an almost perfect agreement with the observed event time of an experienced match analyst in soccer (intraclass correlation coefficient: > 0.99, p < 0.001). 19 The average deviation between both raters (match analyst and algorithm) was detected to be 0.081 s with a root mean square error of 0.21 [s]. Therefore, we are able to effectively combine both data types.
Success of defensive plays
All ball possessions were identified based on the event data. A possession started at the moment a team-gained control over the ball and ended at the moment the opposing team regained the ball, the ball went out of play, or there was a stoppage of play (e.g., foul). Thereby, it is assumed that the team that performs active actions on the ball (e.g., pass, won tackling) is in ball control.
This study concentrated on deliberate (intentional) possessions to exclude the effects of undeliberate possession, such as short possessions in which solely one player deflects or blocks the ball. Further, we excluded short possessions since these phases could possibly be assigned to the playing phase of defensive transition. However, this study concentrated on the effects of the playing phase of defensive play. Therefore, in accordance with previous studies,20,21 we exclusively included possessions that had a minimum of three consecutive passes and a minimum duration of five seconds.
Furthermore, as a team's defending style changes with the number of players involved (e.g., after player dismissals),22–25 we excluded all game situations in which a regular 11vs11 was not detected (e.g., red cards, injured players who are treated outside the pitch) to avoid biasing the results.
The success of a defensive play was defined by the outcome of possession and in line with previous studies.11,21,26 As the ultimate goal of defending is to gain the ball,10,21 besides preventing opponents’ scoring opportunities, all possessions in which the defending team gained the ball in open play were defined as a successful defensive play. All other outcomes were classified as unsuccessful defensive play (e.g., shot on goal, stoppage of play).
Tactical formation
To determine the tactical formation of a team, we used an approach that has already been used to identify formation lines.20,27,28 However, we expanded this approach by an increasing number of time windows and a dynamic assignment of players to account for in-game formation changes 29 and substitutions. We defined two tactical formations (one defending formation and one attacking formation) for each of the two teams over a ranging window of 15 min (resulting in six defending and six attacking formations for every team per match). This approach was chosen to account for tactical formation changes during the game 30 and the differences between offensive and defensive formations. 31 The tactical formation was identified using the average x-positions of all players of a team which were clustered in three formation lines (defending-line, midfielder-line, attacking-line) using a K-Means unsupervised clustering algorithm. The goalkeeper was also identified, but not assigned to one of the three formation lines. This procedure for identifying subgroups was shown to be adequate. 28
Afterward, we dynamically assigned the players of each team to the formation lines for every individual possession to account for dynamical changes in the formation (e.g., a winger switches with a full back for one possession).
Variables
Team variables
The compactness of a team was defined on the basis of previous investigations to measure team compactness and was operationalized by the measures of surface area and spread of the whole team (excluding the goalkeeper). The surface area of all outfield players (excluding the goalkeeper)9,11,32 was calculated using the area of the convex hull 10 (see Figure 1). The spread of all outfield players was calculated using the sum of the squared standard deviation from their average position (team centroid)11,33 (see Figure 1). The teams’ length (distance in the longitudinal direction of the pitch) and teams’ width (distance in the lateral direction of the pitch) of the surface area were also calculated.1,9,34
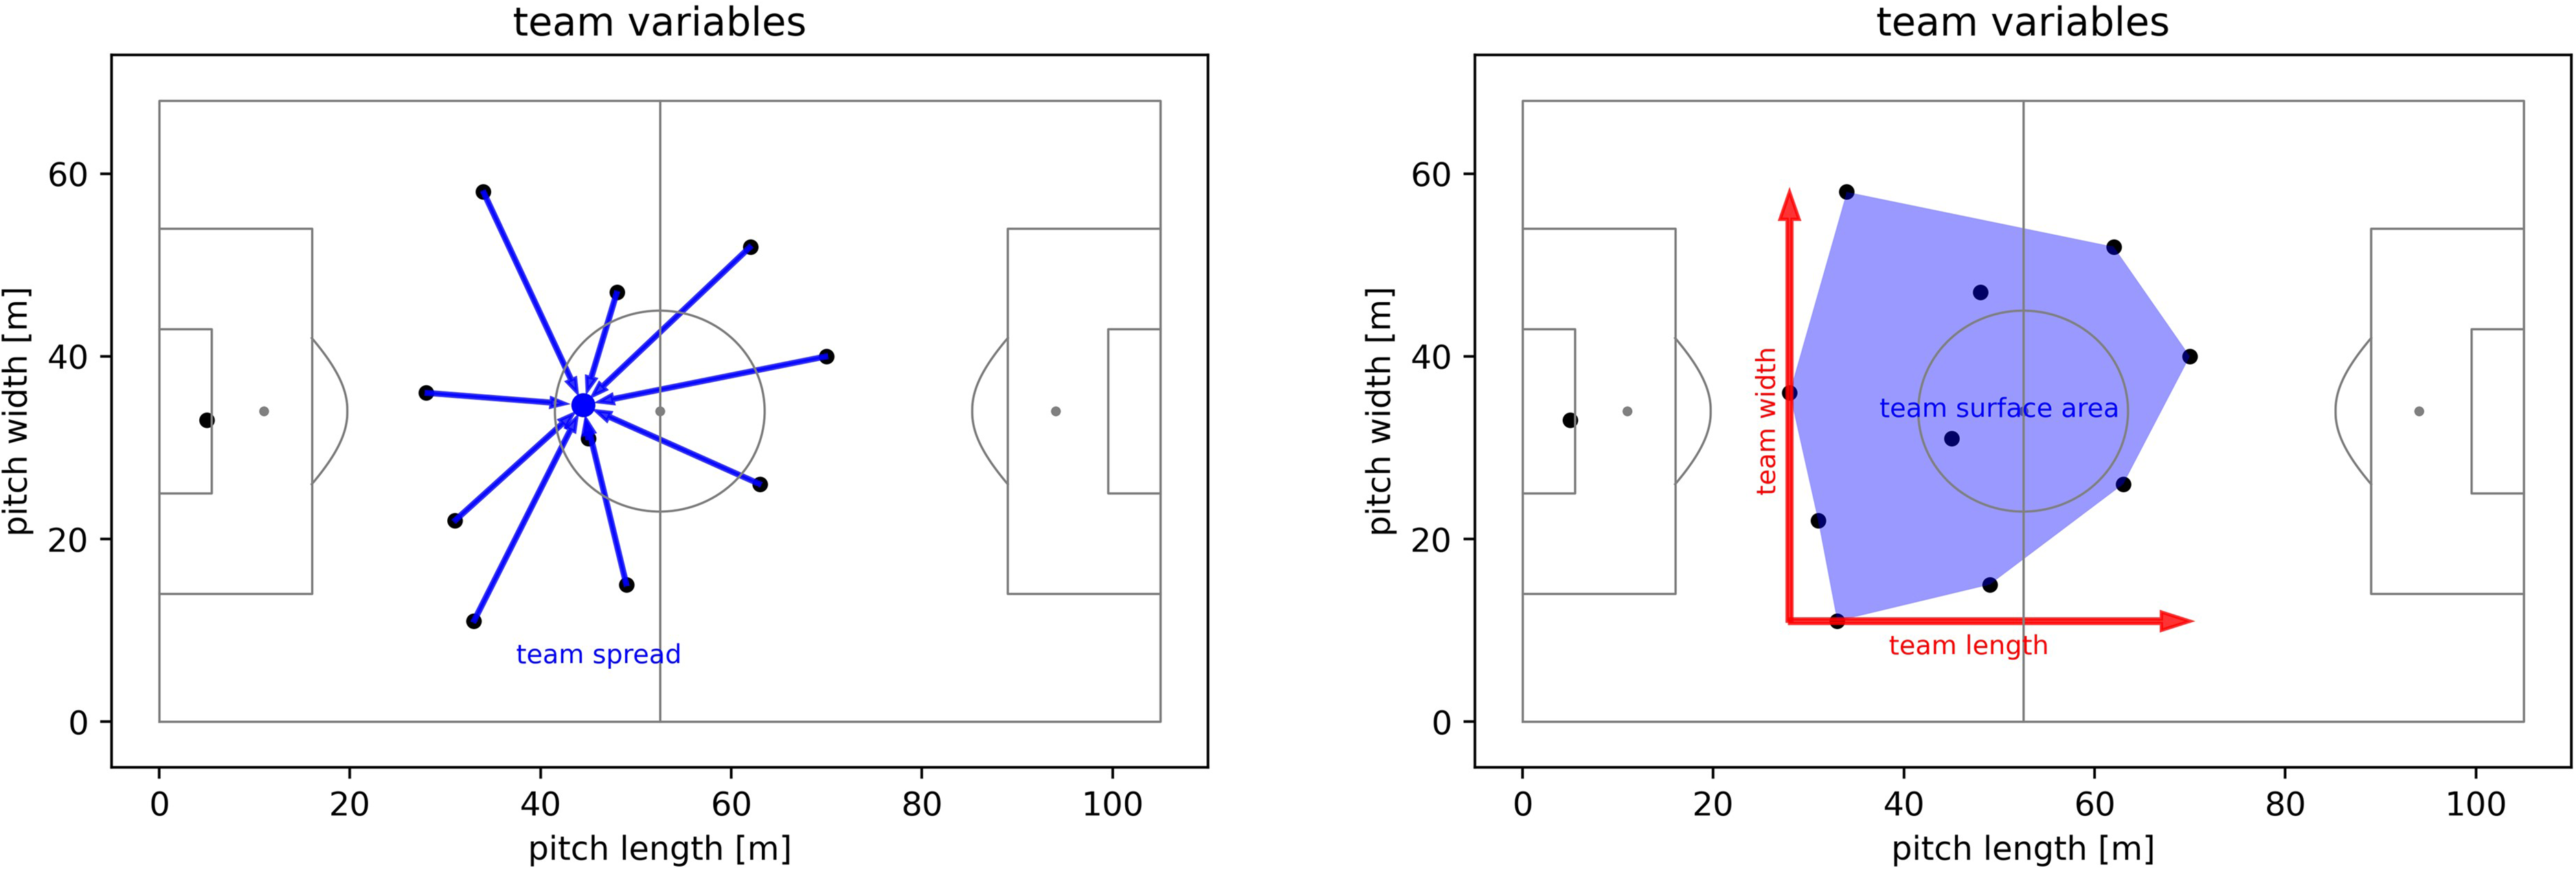
Team variables with team spread on the left and team surface area on the right.
Defensive collective (subgroup) variables
Further, we quantified the compactness of two subgroups, both referred to as defensive collective (DC). To operationalize the compactness of the subgroups we used the measures of surface area and spread of the players assigned to the particular subgroup. This procedure was done because the analysis of movement behaviour of subgroups was shown to give greater insights into coordination dynamics compared to team-level analysis.1,11,28
We expected that strikers are mostly not decisive in defending compactness (e.g., a team can still maintain compactness even though a striker stays in front after he is outplayed, as many strikers seem to be not defensively active when outplayed). Therefore, we defined the first DC (DC defender and midfielder) as all outfield players assigned to the defending-line and the midfielder-line (all outfield players except the attackers) using the identified tactical formation (see ‘Tactical formation’ section).
As previously shown, it is important to pressurize areas close to the ball to gain the ball. 21 Therefore, we have defined the second DC, which comprises the five defenders closest to the ball (DC ball nearness).
For both DC variables, the surface area and the spread were calculated as described above (see ‘Team variables’ section, see Figure 2).
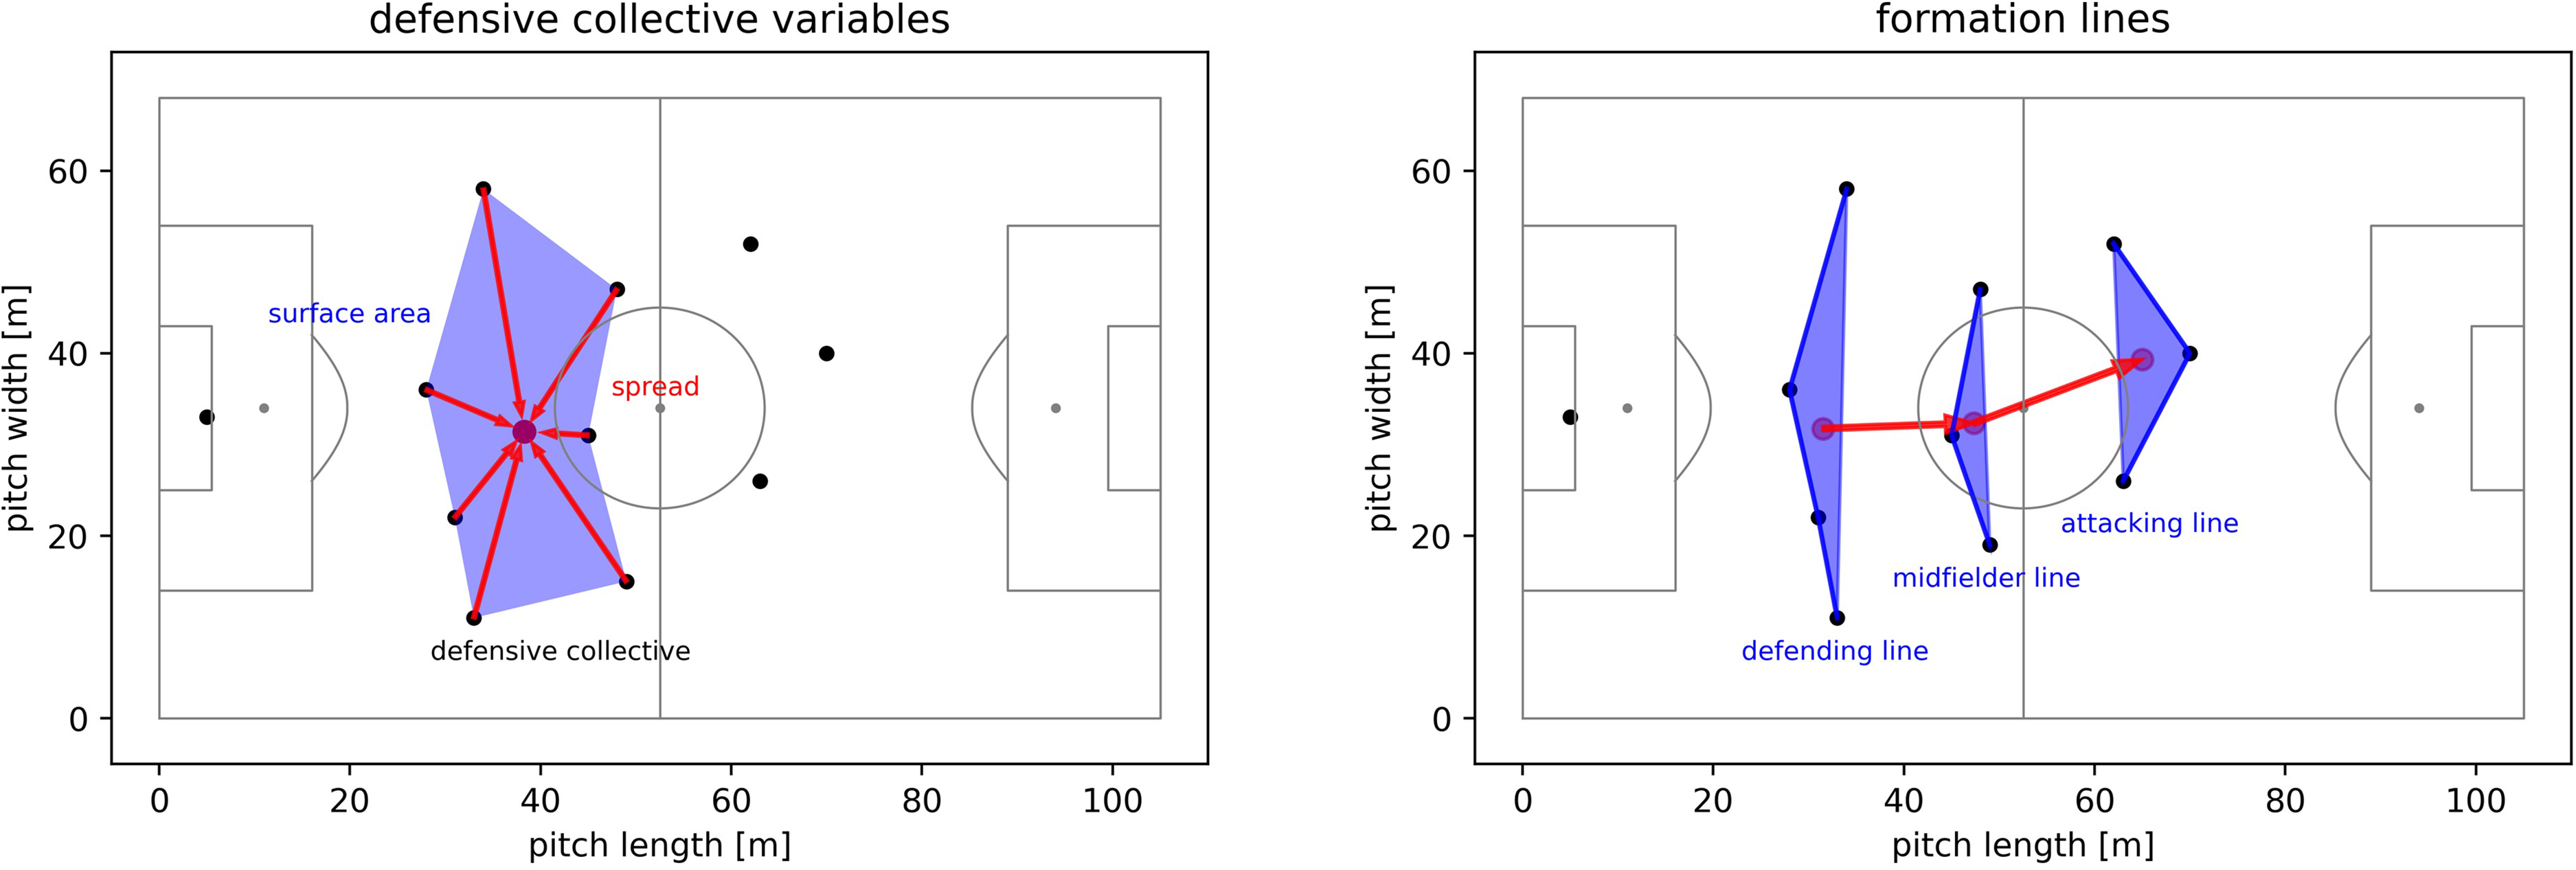
Defensive collective variables on the left and distances between formation lines on the right.
Distances between formation lines
To operationalize the organization within a defending team, we measured the distances between the centroids of the three formation lines (see Figure 2) identified using the formation descriptor (defending-line, midfielder-line, and attacking-line, see ‘Tactical formation’ section). Inter-line distances were used in several other studies.1,28,35,36
For all computed variables we quantified different measures to account for the differences between the compactness of a defending team, the organization of a defending team, and the contraction of a defending team (defined in the introduction).
To quantify the compactness of the defending team (operationalized by team variables and DC variables) and the organization of a defending team (operationalized by distances between formation lines), the average over a possession (mean), the last local maximum of a possession (max), the ensuing minimum (min), and the last moment of a possession (last moment) were measured. The measurement time points were determined by two experienced game analysts in soccer.
To account for the contraction of a defending team, two contraction measures for every variable were computed using the difference between the start of a possession and the end of a possession (contraction start-end), and the difference between the last local maximum of a possession and the ensuing minimum of a possession (contraction max-min).
Statistics
To explore the defensive compact organization, a one-way analysis of variance was conducted between successful and unsuccessful defensive plays for every measure (mean, max, min, last moment, contraction (start-end), contraction (max-min)) of every variable (team, DC lines, DC ball nearness, distance between formation lines). 37 Prior, we checked for homogeneity of variances and normal distribution. Levene's test for homogeneity of variances was performed and if significant the correction was used. Due to the size of the sample investigated (n > 5000), the normal distribution was checked visually. 38 Furthermore, the Bonferroni-Holm correction was used to avoid alpha error.
As effect size, Cohen's d was determined with d < 0.5 representing a small effect, 0.5 ≤ d ≤ 0.8 representing a medium effect, and d > 0.8 representing a large effect. 39
The significance level was set to p < 0.05.
Results
Overall, 2889 (18.3%) defensive plays were classified as successful and 12,899 (81.7%) were classified as unsuccessful. The results are structured according to the aim of this study and, therefore, are differentiated into the facets of the tactical principle of play defensive compact organization: compactness, the contraction of compactness, and the organization of the defending team.
The descriptive statistics of the results and the outcomes of all comparisons are depicted in Table 1.
Descriptive statistics and comparisons between successful and unsuccessful defensive plays of team variables, defensive collective variables, and distances between formation lines (red: significant differences with positive effect sizes ≙ larger values in successful defensive plays compared to unsuccessful defensive plays, green: significant differences with negative effect sizes ≙ smaller values in successful defensive plays compared to unsuccessful defensive plays).
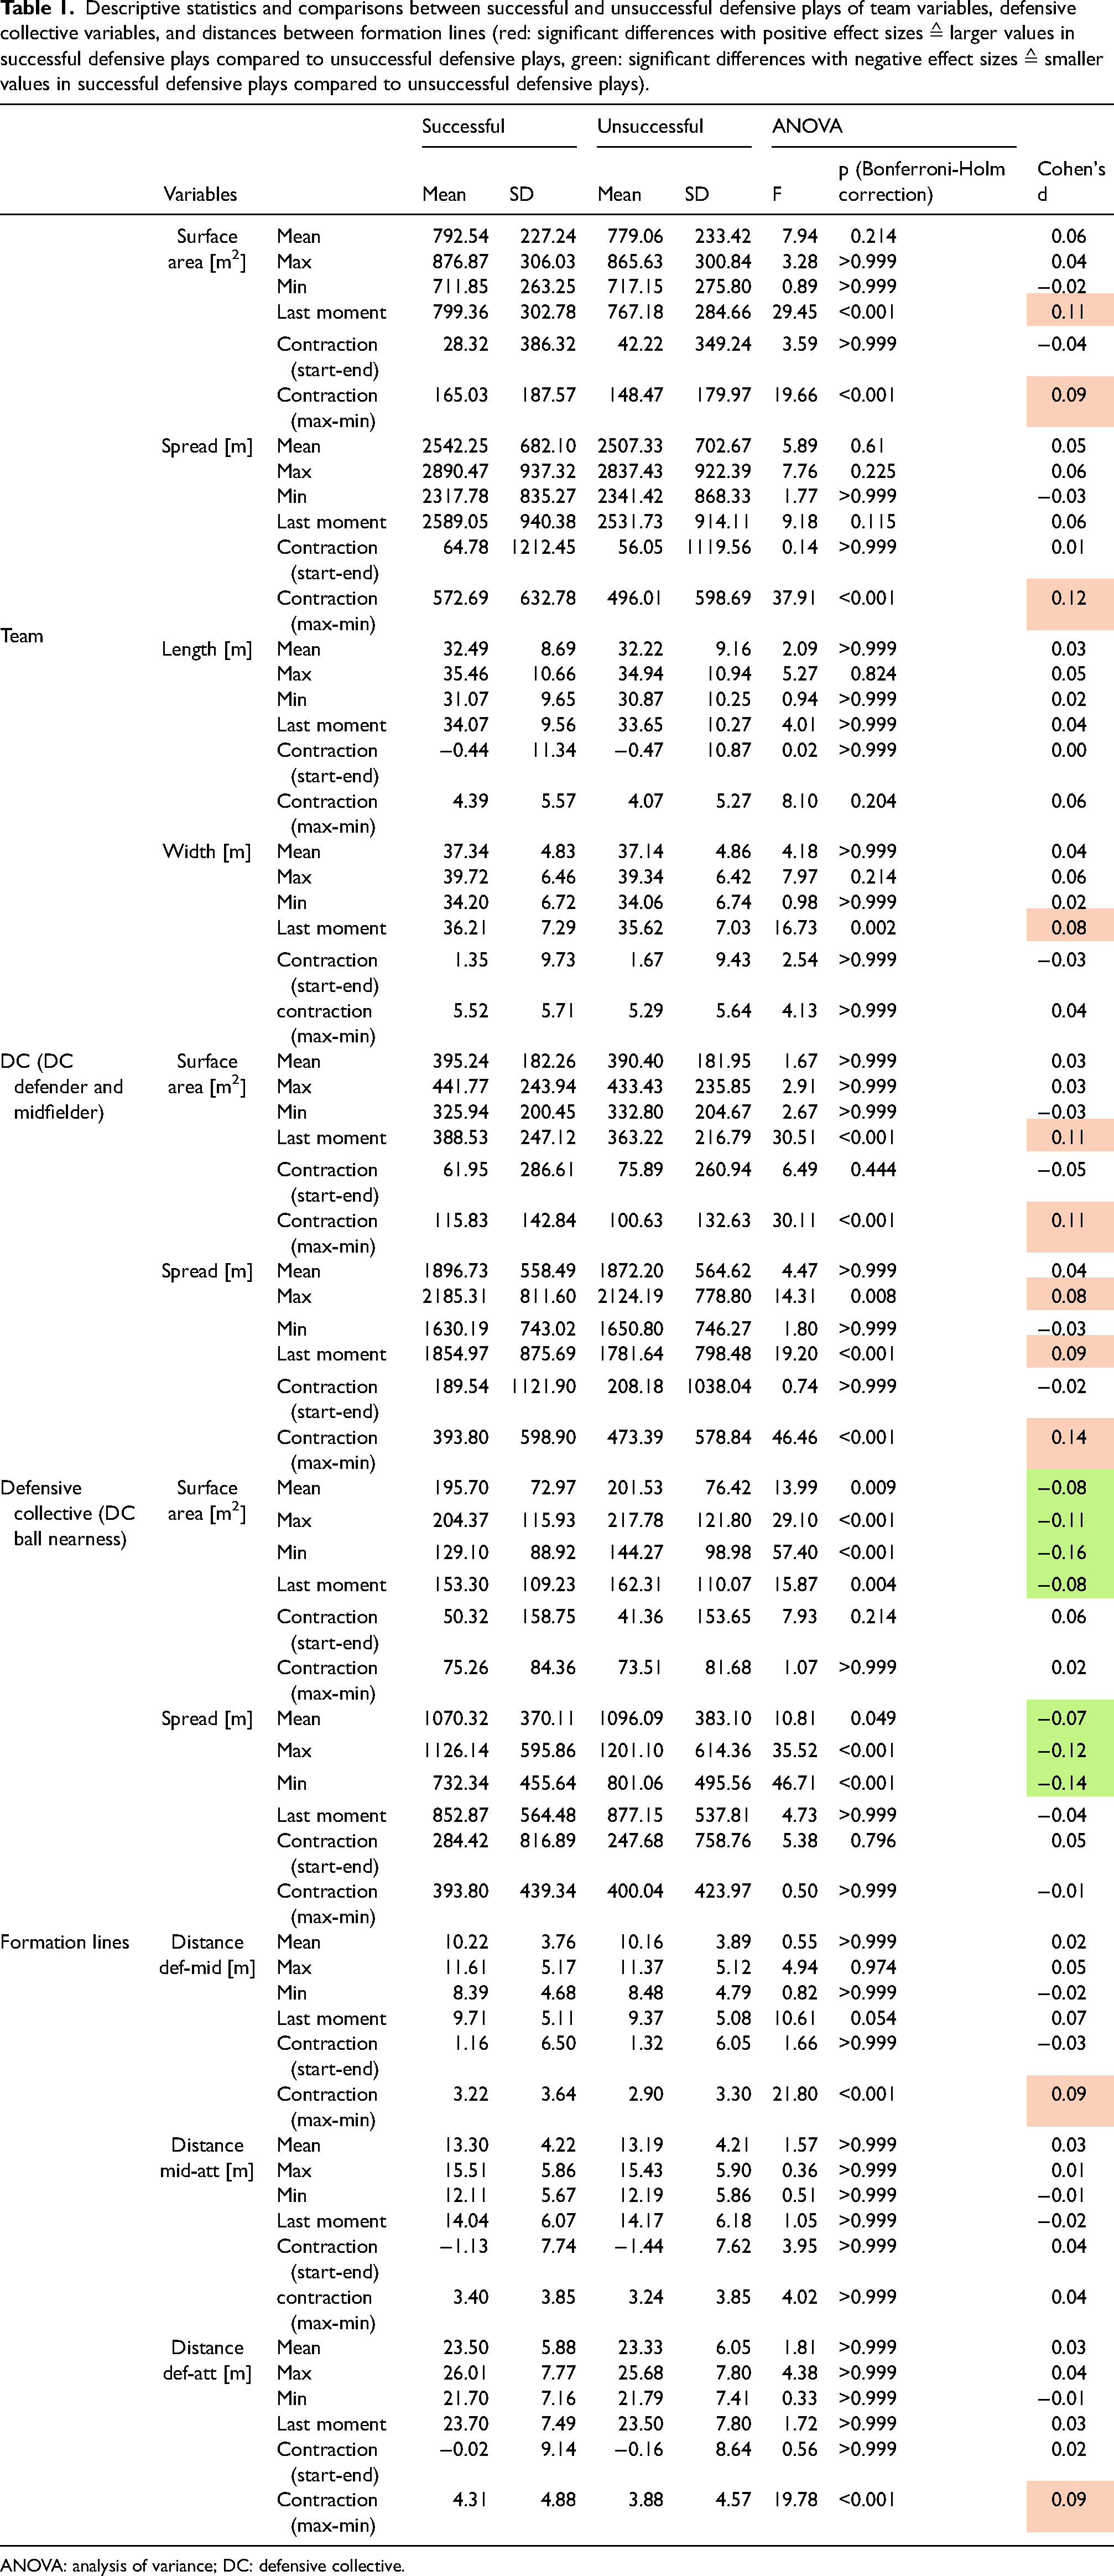
ANOVA: analysis of variance; DC: defensive collective.
Compactness
Team
Regarding the compactness of the whole defending team, almost all measures showed no significant differences between successful and unsuccessful defensive plays, such as surface area (mean, max, min, last moment), spread (mean, max, min, last moment), length of the surface area (mean, max, min, last moment), and width of the surface area (mean, max, min, last moment). Solely the surface area (d = 0.11) and the width of the surface area (d = 0.08) of the whole team were significantly larger at the last moment of successful defensive plays compared to unsuccessful defensive plays showing small effect sizes.
Defensive collective (DC defender and midfielder)
On average, there were 7.12 ± 0.99 players assigned to the DC defender and midfielder.
For the compactness of the DC defender and midfielder, we found a larger surface area at the last moment of successful defensive plays in comparison to unsuccessful defensive plays (d = 0.11). Accordingly, we also found a larger spread of the DC defender and midfielder at the last moment (d = 0.09) and the maximum (d = 0.08) of successful defensive plays compared to unsuccessful ones.
For all other compactness measures (max, min) DC defender and midfielder there were no significant differences between successful and unsuccessful defensive plays.
Defensive collective (DC ball nearness)
In contrast, for the DC ball nearness, we found a significantly smaller surface area (mean, max, min, last moment) in successful defensive plays compared to unsuccessful ones (−0.08 < d < −0.16). In line, we found a smaller spread (mean, max, min) of the DC ball nearness in successful defensive plays compared to unsuccessful defensive plays (−0.07 < d < −0.14). Solely the spread of the collective showed no differences in the last moment of possession.
Furthermore, we found smaller surface area values and spread values for the DC ball nearness (surface area Ø = 195.70 ± 72.97 m2) compared to the corresponding values of the DC defender and midfielder (surface area Ø = 395.24 ± 182.26 m2).
Contraction of compactness
For the first contraction measure between the start and the end of a possession (contraction start-end), there were no significant differences between successful and unsuccessful defensive plays for all variables.
For the second contraction measure between the last maximum and following minimum of a possession (contraction max-min), we found a higher contraction of the surface area and the spread in successful defensive plays compared to unsuccessful defensive plays for the whole team (0.09 < d < 0.12), and the DC defender and midfielder (0.11 < d < 0.14). Additionally, the contraction (max-min) of the distances between the formation lines def-att and def-mid were higher in successful defensive plays compared to unsuccessful ones (d = 0.09). All other variables (DC ball nearness, width and length of surface area team, and distance between formation lines mid-att) showed no significant difference in this contraction measure (0.204 < p < 0.999).
Organization
Regarding the distances between the formation lines (defensive-, midfielder-, and attacking-line), no significant differences were found between successful defensive plays and unsuccessful defensive plays for every combination (def-mid, mid-att, and def-att).
The distance between the defensive-line and midfielder-line (def-mid) was smaller (Ø = 10.17 ± 3.87 [m]) compared to the distance between the midfielder-line and attacker-line (mid-att) (Ø = 13.21 ± 4.21 [m]) (F = 4479.22, p < 0.001, d = −0.75).
Discussion
This explorative study aimed to gain more detailed knowledge about the distinctive parts of the tactical principle of play defensive compact organization in connection to defensive success.
Overall, this study showed that for defensive success it seems to be important that a subgroup of defending players close to the ball form higher compactness to gain the ball. In contrast to the importance given by practitioners to the compact organization of the entire defending team, this team compactness did not show a connection to the success of a defensive play in this study.
The analysis of the defensive organization showed that the attacking-line is more distant from the rest of the defending team compared to the proximity of defensive- and midfielder-line. However, the organization measures did not differentiate between successful and unsuccessful defensive plays.
Overall, the differences found between successful and unsuccessful defending in this study are small indicated by the comparatively small effect sizes (−0.16 ≤ d ≤ 0.14). This could be due to the complexity of the team sport soccer with 11vs11 games, where 22 individual players influence each game situation. Ultimately, no possession is similar to a previous one, which leads to a great dispersion of values. Nevertheless, these small effect sizes are comparable to other studies in this context20,21 and are therefore meaningful. Further, since the compact organization is only a small subset of a team's tactical behaviour in defense, its importance is made clear by the differences found.
Compactness
The compactness of the whole defending team predominantly showed no differences between successful and unsuccessful defensive plays. This result is consistent with the findings of Bartlett et al., 11 who found no differences in the compactness of a defending team between successful and unsuccessful defensive plays over the average of an opposing possession. Beyond that, our results partially indicated that the defending team shows even lower compactness (e.g., larger spread of players) in the last moment of successful defensive plays compared to unsuccessful ones. This outcome is in contrast to the results of Moura et al. 10 who identified higher compactness (e.g., smaller surface area) of successful defensive plays in the last moment of an attack. However, the current results do not show a clear relation between the compactness of the whole defending team and defensive success.
The compactness of the defending subgroup excluding the strikers (DC defense and midfield) showed similar results to the whole defending team, suggesting no relation to the success of a defensive play. In difference to all other results, the DC that included the five nearest defenders to the ball (DC ball nearness) showed contrary results. The compactness of the DC ball nearness was higher (e.g., smaller surface area) in successful defensive plays for almost every variable showing the comparably largest effect sizes in this investigation (d ≥ −0.16). Taking these results into account, the defending team should potentially show high compactness (e.g., small spread) in areas close to the ball to increase the potential to gain the ball. This finding shows the importance of the defending behaviour in areas close to the ball to pressurize the attacking player in control of the ball and close pass options in ball proximity. This principle of pressurizing areas close to the ball is supported by an earlier study that showed that it is more important for defensive success to pressurize areas close to the ball compared to pressurizing all opposing attackers. 21 Additionally, the players that are not in direct ball proximity protect dangerous pitch areas further away from the ball (pitch areas behind the defensive line ≙ deep spaces, pitch half opposing to the ball possession ≙ weakside) to prevent the opposing team to overplay the pressured areas close to the ball and achieve the other goal of defensive play: protect the own goal. This tactical interpretation is supported by the analysis of an actual exemplary game situation in Figure 3.
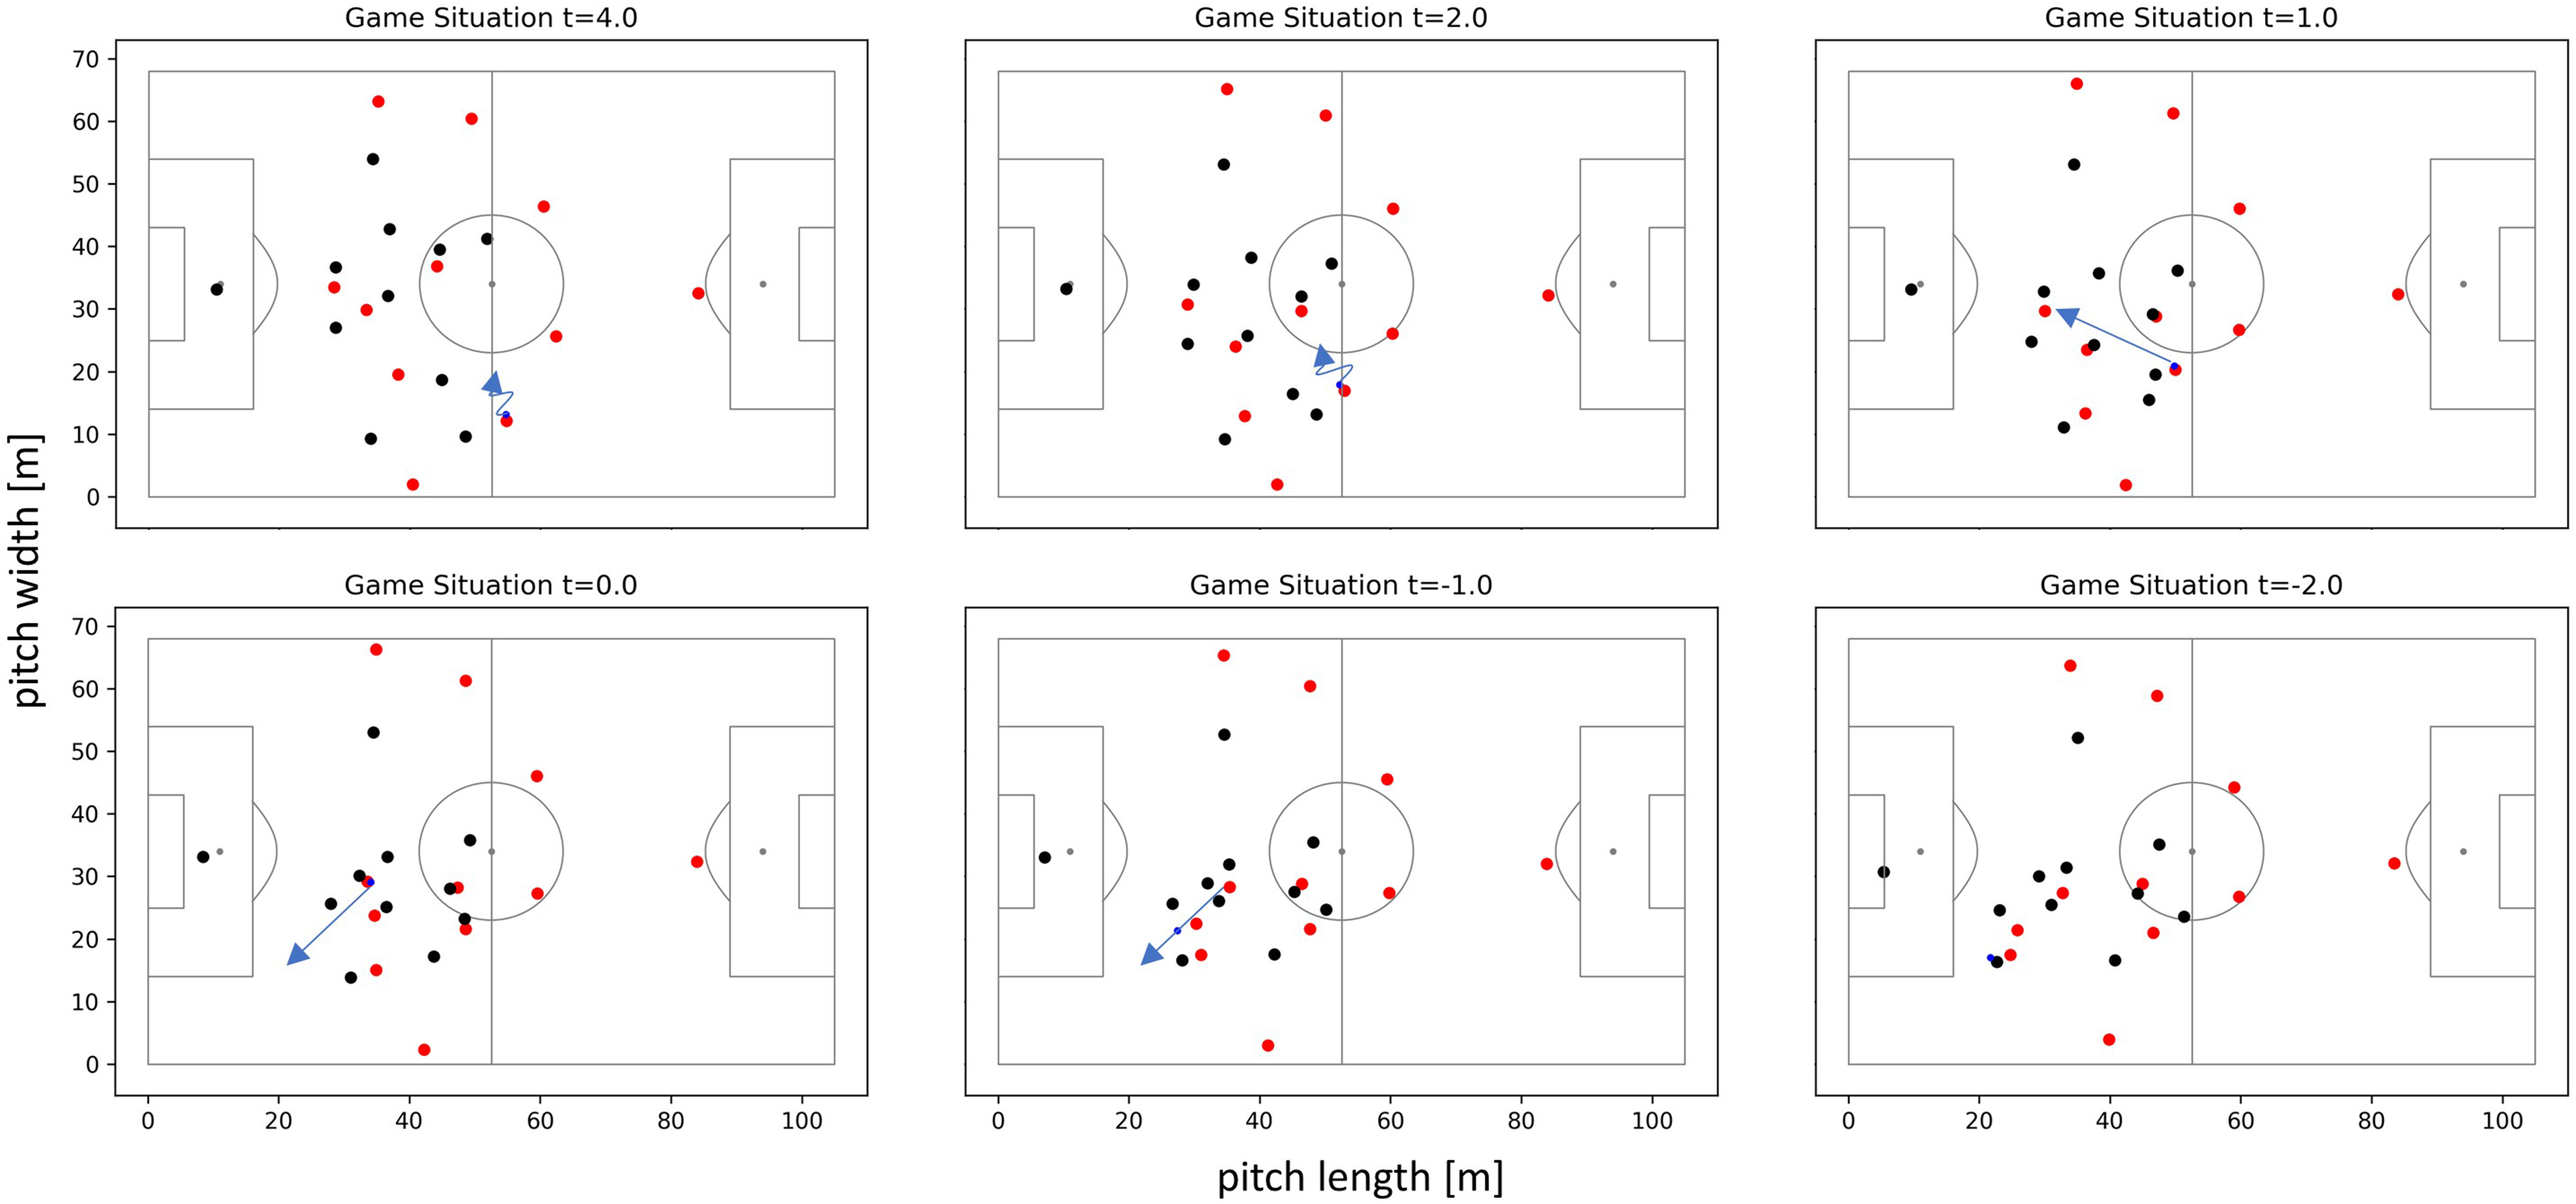
The course of an actual game situation in the German Bundesliga season 2020/21 with the ball-possessing team (red), the defending team (black), and the ball (blue). The left full back of the attacking team (red) is dribbling toward the middle (t = 4 and t = 2) and subsequently, two passes are played through the defending team (t = 1 and t = 0). The defending team (black) is pressurizing near ball areas with the defenders close to the ball while securing the deep spaces behind the defensive line (central defenders) and the weakside (left full back). This results in high compactness near the ball and optimal but less compactness of the whole team (the full-back is further away from the team's centre) which ultimately results in a ball gain (t = −2).
Accordingly, our initial hypothesis that successful defensive plays show higher compactness (e.g., smaller surface area and spread) can solely be confirmed for a subgroup of defenders in areas close to the ball.
Summarizing these results, it seems to be important for the success of a defensive play to not solely form high compactness of the entire defense but to create an optimal degree of compactness. This allows the defending team to control the space within its’ organization without allowing opposing passes through it while also controlling other dangerous pitch areas (e.g., deep spaces or weak side, see above). Therefore, our results suggest that soccer teams should create an optimal defensive compact organization for the whole defending team and increase the compactness in ball proximity to increase the chance of being successful in defensive play.
Contraction of compactness
For the contraction of compactness, which describes the change of compactness over a time period, this study showed first evidence supporting the idea that a higher contraction is connected to defensive success.
The contraction of compactness (contraction max-min) of the whole team (surface area and spread), the DC consisting of defenders and midfielders (surface area and spread), as well as the distance between the defending line and the other two formation lines (dis-def-mid and dis-def-att) was higher in successful defensive plays. Therefore, one could argue that a rebuild of compactness (whole team and defender, and midfielder collective) is important to regain the ball. With it, we can confirm our initial hypothesis, where we expected a higher contraction of compactness in successful defensive plays (for max-min contraction). However, since contraction could be shaped by temporal and spatial characteristics and the time window of the contraction variables was not controlled this result is solely a first indication of the influence of spatial contraction.
Therefore, future studies should investigate this performance indicator of the rebuilding of a compact organization by contracting in more detail and by considering both temporal and spatial contraction.
Organization
Concerning the defensive organization, quantified by the distances between the formation lines, the results revealed that the defensive-line and the midfielder-line are closer to each other (Ø = 10.22 ± 3.76) compared to the distance of the attacking-line to the rest of the team (Ø = 13.30 ± 4.22). This supports our initial idea that the defensive compact organization is not decisively shaped by the position of the attackers (e.g., attackers might not take part in the defending play when they are overplayed). However, we found no differences in the organization patterns between successful and unsuccessful defensive plays. Accordingly, it can be concluded that the distances between the formation lines, in the discovered range of very small inter-line distances (10–13 [m]), seem not decisive for the success of a defensive play. These discovered very small inter-line distances (10–13 m) could indicate that all teams in German Bundesliga are able to create and maintain a good organization in defense. However, it could be expected that increasing inter-line distances above the discovered range (> 15 m, e.g., in lower-quality leagues) could lead to more unsuccessful defensive plays as the areas inside the defending organization increase which should be assessed in future studies. In the end, this could lead to a disrupted organization allowing for more dangerous opponent passes and dribblings within that organization, which was previously shown to be important for attacking success. 40
Limitations and future directions
The procedures of this study have led to some limitations. First, this study focussed solely on deliberate possessions excluding short attacks. Therefore, the results are exclusively representative for possessions longer than five seconds. This methodology was chosen to exclude unintentional actions as well as short defensive transitions (in which other tactical behaviour of players is expected) which allows identifying tactical patterns representative of the defensive playing phase. Second, this study did not assess the influence of contextual variables (e.g., playing style, venue, match status, quality of teams) which have been shown to influence tactical behaviour in defensive play.41,42 In detail, we did not include information about different teams with different tactical formations and different playing styles in our study. Though, Low et al. 1 showed in the first experimental approach that there is no difference in the defensive compactness between two different tactical formations. Furthermore, an earlier study found no clear differences in defending behaviour between different teams, however, analyzing a distinctly different defensive principle of play defensive pressure. 21 Nonetheless, contrasting defending playing styles (e.g., deep defending or high pressing) have different principles of play that have been shown to influence the compactness of team. 35 For instance, high pressing to achieve ball gains close to the opposing goal leads to a larger team length 35 (≙ smaller compactness) as the attacking line is pressuring the ball carrying opposing defenders deep in the opposing half. However, the procedure of this study leads to a greater overall generality of the results that can be applied to every defending playing style for different teams at different match statuses. Still, future studies should investigate the mentioned differences (e.g., playing styles) to gain more detailed knowledge complementing the current findings.
Conclusion
Summing up, creating high compactness of defenders in areas close to the ball (e.g., smaller surface area) seems to be crucial for defensive success. In addition, we found preliminary evidence that a higher contraction of compactness (for the whole team and the defender and midfielder collective) could be beneficial for defensive success. In contrast to the importance given by practitioners to the compact organization of the entire team in defense, we found no evidence that a higher compactness in the whole defending team (e.g., smaller surface area and spread) and a better organization (smaller inter-line distances) would increase the probability to gain the ball in defensive play.
Overall, we showed that the group-level defending in areas close to the ball is more important than the whole defending team concerning the defensive compact organization. Furthermore, rebuilding a compact organization (operationalized using contraction variables) appears to be a meaningful performance indicator whose connection with defensive success was suggested by our results.
Those findings are of significant interest to coaches and practitioners. For instance, the results can be applied to training regimes where subgroups of the defending team need to put pressure on the opposing ball carrier by increasing the compactness in those areas. Furthermore, the provided information can assist game analysts to be able to evaluate the defensive performance in more detail. For instance, in matches, analysts should check the compactness of defenders in ball proximity and the contraction of compactness of the whole team.
Footnotes
Acknowledgments
The authors thank the German Football League (Deutsche Fußball Liga, DFL) for providing the match data used in this study.
Data availability statement
The used data is property of the German Football League (Deutsche Fußball Liga, DFL) and is not publicly available. The authors do not have permission to share the data publicly. This work can be reproduced using similar data from professional soccer (e.g., tracking and event data of other soccer leagues).
Declaration of conflicting interests
The author(s) declared no potential conflicts of interest with respect to the research, authorship, and/or publication of this article.
Ethical approval
This study was approved by the local ethics committee (Human and Business Sciences Institute, Saarland University, Germany, identification number: 22-02, 10 January 2022) and all procedures were conducted in accordance with the guidelines of the Declaration of Helsinki.
Funding
The author(s) received no financial support for the research, authorship, and/or publication of this article.