
Abstract
The wet bulb globe temperature (WBGT) is widely used in athletics for assessing heat stress. Sports governing bodies provide a wide variety of recommendations on how often to take WBGT measurements during activities like practices and competitions. This can leave coaching staff and other sports medicine personnel in a quandary as to what is the “best practice.” Our study is the first to use a large dataset to quantify the variability of WBGT within practice and competition sessions, and to identify the impact of using different measurement rates on the WBGT. The study leverages 6 years of data from thousands of American football practice and competition sessions from across Georgia, USA. We observed that, on average, WBGTs are coolest in the morning (26.67°C) and evening (24.84°C), and hottest in the midday (30.23°C) and afternoon (27.21°C). The variability within sessions tended to be greater for morning, midday, and afternoon than evenings, with session standard deviations of 0.96°C to 1.27°C and ranges of 2.67°C to 3.55°C when controlling for duration. WBGTs also tended to increase over time in morning sessions and decrease over time during afternoon and evening sessions. These changes are clinically important. We found that Georgia High School Association (GHSA) WBGT activity modification categories often changed during sessions, especially in the morning, midday, and afternoon where a change in GHSA category of ≥1 occurred in 57% to 76% of sessions. Considering this variability, our results indicate that more frequent measurements better capture maximum WBGT values over a session and reduce the likelihood of misclassifying activity modification.
Introduction
The health1–3 and performance4–6 of athletes who train and compete outdoors is often impacted by exposure to hot conditions. As the climate warms, heat hazards are expected to increase and mitigation measures such as weather-based activity modification (e.g. adjust work:rest ratios or even cancel activities) will become an increasingly important part of a comprehensive heat safety policy that benefit not only the athletes but help sports medicine and coaching staffs make better informed decisions.7–11
There are a variety of heat stress indices that range from “direct indices” that are computed from measure environmental variables to “rational indices” that are based on the human heat balance. 12 The focus of this work is on a direct index called the wet bulb globe temperature (WBGT) because it is widely used in sports for heat stress assessment. It has been endorsed in various position statements in athletics as well as occupational safety13–18 and is becoming more commonly available for use by various decision makers across the United States and internationally, especially for active, outdoor populations like athletes and workers. 19 In recent years, for example, WBGT forecast products have become available across the United States via the U.S. National Weather Service and the Southeast Regional Climate Center, and across Europe via the HEAT-SHIELD occupational warning system.19–21 The WBGT was developed in the 1950s and both its strengths (e.g. it integrates multiple weather variables associated with heat stress; is easy to collect) and weaknesses/limitations (e.g. nonstandard instrumentation can affect measurement quality, underestimation of heat stress in environments with restricted evaporation, and questions about the accuracy of clothing adjustment factors) that are well known.22–24
Collecting accurate and representative real-time WBGT measurements that can be used for possible activity modification includes a number of considerations such as the location of measurement,25–27 the quality of the WBGT sensor, 28 and the frequency of measurements. 17 Long-term, average data shows that heat hazards indicated by WBGT vary in a predictable way throughout the day with morning and evening time frames cooler, and midday and afternoon sessions hotter. 29 Yet, short-term weather fluctuations in meteorological values such as wind speed and solar radiation can also influence WBGT.30–32 Several studies have documented that on-site measurements better capture the local exposure conditions than those of more distant weather stations, which may have different meteorological conditions (e.g. cloud cover and wind speed) and often lack the sensors (e.g. black globe and natural wet bulb) to directly measure the WBGT.25–27 Both Pryor et al. 25 and Guyer et al. 27 found that WBGTs modeled from regional weather stations underestimated local WBGTs which could lead to activity modification misclassification. Interestingly, WBGTs did not show differences among surface type (e.g. grass, synthetic turf, and hardcourt tennis) within a given athletic complex in two case studies conducted in warm humid and hot dry climate regions27,33
As WBGT values are known to change over short time spans, different organizations and groups have established measurement protocols for monitoring heat stress to athletes. In the United States, for example, the Georgia High School Association (GHSA) requires measurements every 30 minutes and New Jersey High School Association (The New Jersey State Interscholastic Athletic Association, NJSIAA) requires measurements every hour during a practice session.34,35 International sports organizations like World Athletics 36 requires measurements every 20 minutes during road races and race walks, the International Tennis Federation 37 took measurements every 30 minutes at the 2020 Tokyo Olympics, the Federation Internationale de Volleyball 38 requires measurements at that start of each game, and World Triathlon 39 is less specific, requiring sampling at “regular intervals.” A roundtable consensus document by Hosokawa et al. 17 recommends that sampling at ≤ 30 minutes is ideal. Yet, to our knowledge, these clinical guidelines are not data-driven but rather based on expert opinion. In sum, there are wide differences in recommendations on how often to monitor WBGT for heat safety. This can raise questions for coaches and sports medicine personnel about the best approach.
Unlike air temperature, which is routinely collected at weather stations at regular intervals, WBGT is typically measured on fields of play during periods of practice or competition. Thus, there are less data available to understand WBGT temporal patterns and variability for informing decisions on how often to collect data. Our study leverages a 6-year, high temporal resolution dataset of WBGTs collected from over 4700 interscholastic practice and competition sessions in a hot and humid climate. The objective is to understand WBGT and its variability within sessions and at different times of the day. We seek to answer the following questions:
How do mean session WBGTs vary by time of day? What is the variability of WBGT within sessions and does the variability differ by time of day? How do activity modification classifications change within a session by time of day? How does changing the WBGT sampling rate affect categorical activity modification recommendations during the hottest portion of a session?
It is hoped that the results will provide data-driven guidance on appropriate sampling of WBGT for those like coaches and athletic trainers engaged in heat safety for athletes.
Methods
WBGT data
We collected WBGT measurements for six consecutive American football seasons (2009–2014) from 30 high schools across the state of Georgia, located in the southeastern corner of the United States. Data collection occurred for all scheduled practices and competitions from August through October during the 2009–2011 seasons and from August through September during the 2012–2014 seasons. The physical sites used in this study were in a humid subtropical climate with hot and humid summers, but also covered more localized climates within this broad climate classification in the coastal plains, piedmont, and mountains. 40
At each school, WBGT data were measured with a QuestTemp-34 instrument (model QT-34; Quest Technologies, Oconomowoc, WI). The sensors were placed on a tripod 0.91 m (3 feet) above the ground, in a sunny location adjacent to the field of play. All practice sessions in our study were held on football fields. Differences in playing surface (e.g. synthetic turf or hardcourt tennis) from the grass surface where data were collected should not affect WBGT.27,33 The sensors collected dry bulb (DB), natural wet bulb (NWB), and black globe (BG) temperatures. The three measurements were combined into the WBGT by the following equation:

Statistical analysis
Practice and competition sessions were categorized by time of day to represent the change in diurnal conditions (e.g. air temperature or solar radiation) and to match the traditional timing of different sessions: morning (<11:00 a.m.), midday (11 a.m.–1:59 p.m.), afternoon (2–4:49 p.m.), and evening (≥ 5 p.m.).
We first computed the average WBGT for each individual session (“session WBGT”). The mean and 95% confidence intervals (CIs) of these session WBGTs were also computed for each of the four times of day. We identified statistically significant differences between means if the 95% CIs do not overlap. 41
Next, the WBGT variability within sessions by time of day was determined using range, standard deviation, and slope. The mean session duration along with 95% CIs were computed for each of the four times of day. We expected an association between the variability measures (range and standard deviation) and session duration. Thus, we used a one-way analysis of covariance to compare any difference in average range or standard deviation among the four times of day while controlling for session duration. Statistical significance was set a priori at an alpha level of < .05. The WBGT slope (change per minute) was computed for sessions with two or more observations. The slopes were converted to change per hour to ease interpretation, and the strength of the linear relationship was determined using the coefficient of determination (r2). The mean along with 95% CIs about the mean, were computed from the session values (i.e. slope, r2) for each of the four times of day. As above, statistically significant differences between means were determined if the 95% confidence intervals do not overlap. 41
Third, we computed the range (maximum–minimum categorical value) of GHSA activity modification categories within sessions to investigate the impact of WBGT variations from a clinical perspective. The GHSA WBGT guidelines are an evidence-based policy that has been documented to reduce exertional heat illness rates. 2 As the WBGT value rises, there are associated WBGT categories that will dictate activity modifications such as increased rest/hydration breaks, reduced practice length and intensity, and greater restrictions on the amount of equipment worn (Table 1). 34 There are a total of five activity modification classifications:(1) < 27.8°C, (2) 27.8–30.5°C, (3) 30.6–32.3°C, (4) 32.3–33.4°C, and (5) > 33.4°C. 34 For analysis, we computed the percentage of sessions that changed 0, 1, 2, 3, and 4 categories by time of day.
Georgia High School Association WBGT activity and rest break guidelines.
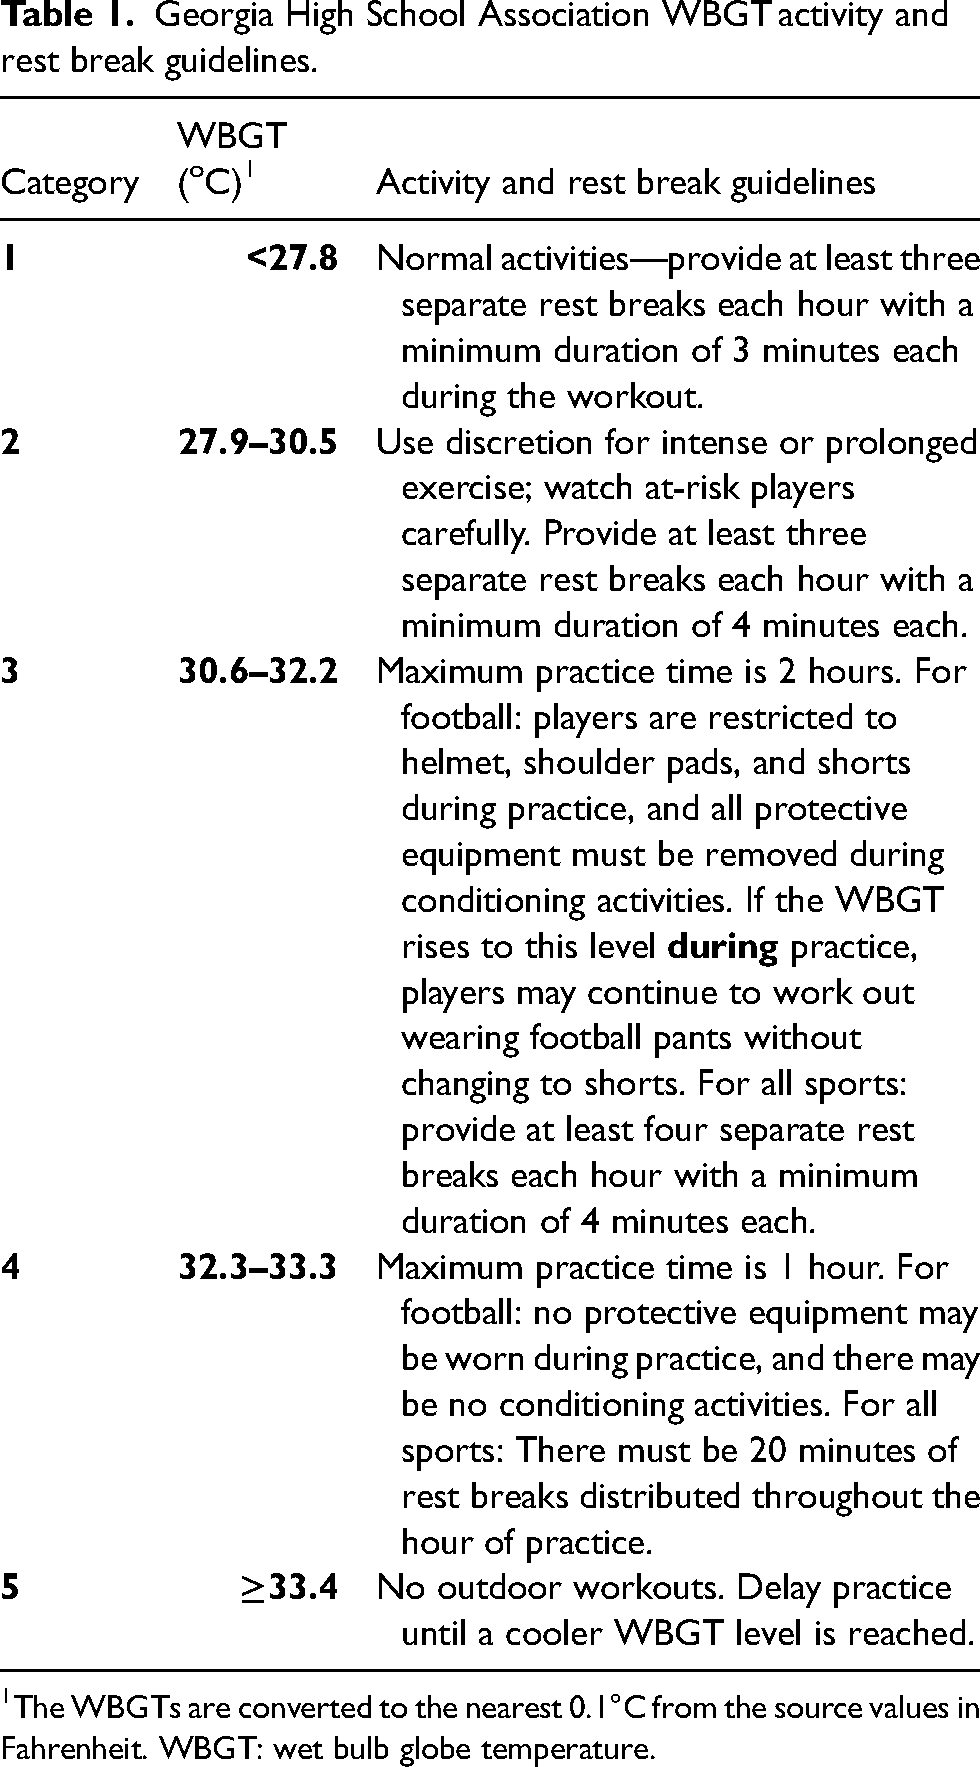
The WBGTs are converted to the nearest 0.1°C from the source values in Fahrenheit. WBGT: wet bulb globe temperature.
Finally, we determined the influence of measurement or sampling interval on the maximum session WBGT, which shows the worst possible condition during a session. We recognize that integrated measurements are best for assessing heat stress. However, the commercially available sensors currently available will only collect instantaneous measurements and this is how clinicians like athletic trainers make decisions on activity modification. Synthetic datasets of 30 and 60 minutes were created from the original 15-minute interval dataset by removing intervening measurements (e.g. remove 15 and 45 minute observations for 30 minute sampling). This approach is designed to replicate how measurements would actually be collected in a systematic way by on-site personnel. Also, these intervals were selected to correspond with those either recommended by expert opinion or used by various sports organizations.17,34,35 Because shorter sessions may not allow for a 60-minute sampling session, we only included in our analysis sessions that had ≥3 observations and had a time length ≥2 hours from within the 60-minute sampling category. These restrictions reduced our study sample to 1914 sessions. The ≥2-hour session is also relevant from a health standpoint as Cooper et al. 2 found that the rate of heat syncope and heat exhaustion doubled for practice sessions in excess of 2 hours and tripled for those in excess of 3 hours when these sessions occurred early in the practice season.
We quantified the impact of changing the sampling interval on maximum session WBGTs using both relative accuracy scores and metrics that consider whether activity modification was accurately assessed. In doing this, we assumed that the source 15-minute data represented the “true” conditions as this resolution is finer than proposed by other organizations, which as noted above often use 30 minutes or higher sampling rates. Mean absolute error (MAE) and root mean square error (RMSE) were computed for 30 and 60-minute sampling rates.
42
We use both metrics as the RMSE is more sensitive than the MAE to larger errors. In addition, we used the “hit rate” (also called the “probability of detection”) to identify if there were differences in the accuracy of identifying particular risk categories based on the GHSA WBGT activity modification guidelines of maximum session WBGT for 15 versus 30-minute sampling and 15 versus 60-minute sampling.
42
The hit rate represents the ratio of correct identification of the event of interest (i.e. a particular GHSA activity modification category) to the number of times the event of interest occurred. It is computed using as: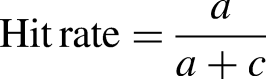
Results
Average WBGTs by time of day
WBGTs were collected for 4794 practice/competition sessions during a 6-year period covering the fall football season. Evenings and mornings had the coolest average WBGTs with means of 24.84°C (95% CI = 24.70, 24.97°C) and 26.67°C (95% CI = 26.39, 26.95°C), respectively. Midday had the hottest average WBGT of 30.23°C (95% CI = 29.44, 31.02°C) followed by the afternoon with a mean WBGT of 27.21°C (95% CI = 27.09, 27.33°C). Based on the nonoverlapping 95% CIs, the mean WBGTs by time of day (i.e. morning, midday, afternoon, and evening) were significantly different from one another.
Variation of session WBGT by time of day
We next examined the variability of WBGTs within sessions by time of day, focusing on the range and standard deviation to show the magnitude of change. The average duration of sessions varied by time of day with morning 125.50 minutes (95% CI = 121.74 min,129.25 min), midday 108.75 minutes (95% CI = 96.69,120.82), afternoon 132.75 minutes (95% CI = 131.22,134.28), and evening 152.42 minutes (95% CI = 149.72, 155.12). Controlling for session duration, we observed a significant difference in WBGT standard deviation among times of day [F(3,4686) = 40.53, p < .001]. With a duration of 137.51 minutes, evening has a significantly lower estimated marginal mean standard deviation than the other times of day with a value of 0.96°C (95% CI = 0.92°C,1.00°C) compared with 1.27°C (95%CI = 1.20°C,1.33°C) for morning, 1.23°C (95% CI = 1.04°C,1.41°C) for midday, and 1.21°C (95% CI = 1.18°C,1.24°C) for afternoon. We also observed a significant difference in range among the four times of day when controlling for session duration [F(3,4686) = 42.91,p < .001]. The marginal mean range of 2.67°C (95% CI = 2.57°C,2.77°C) for a 137.51 minutes evening session was significantly lower than for morning [3.55°C (95% CI = 3.38°C,3.71°C)] and afternoon [3.34°C (95% CI = 3.26°C, 3.41°C)] but not different than midday [3.20°C (95% CI = 2.71°C,3.68°C)].
The range of GHSA categories (maximum–minimum categorical value) within a given session was computed to show the impact of these WBGT variations from a clinical perspective (Table 2). The majority of evening sessions (71%) had no change in category. There was a change in category of 1 or more within a given session in 57% of morning, 76% of midday, and 60% of afternoon, sessions. Further, 19–34% of sessions in morning, midday, and afternoon had a category change of 2 or more.
Percentage of sessions with different ranges in GHSA category by time of day.
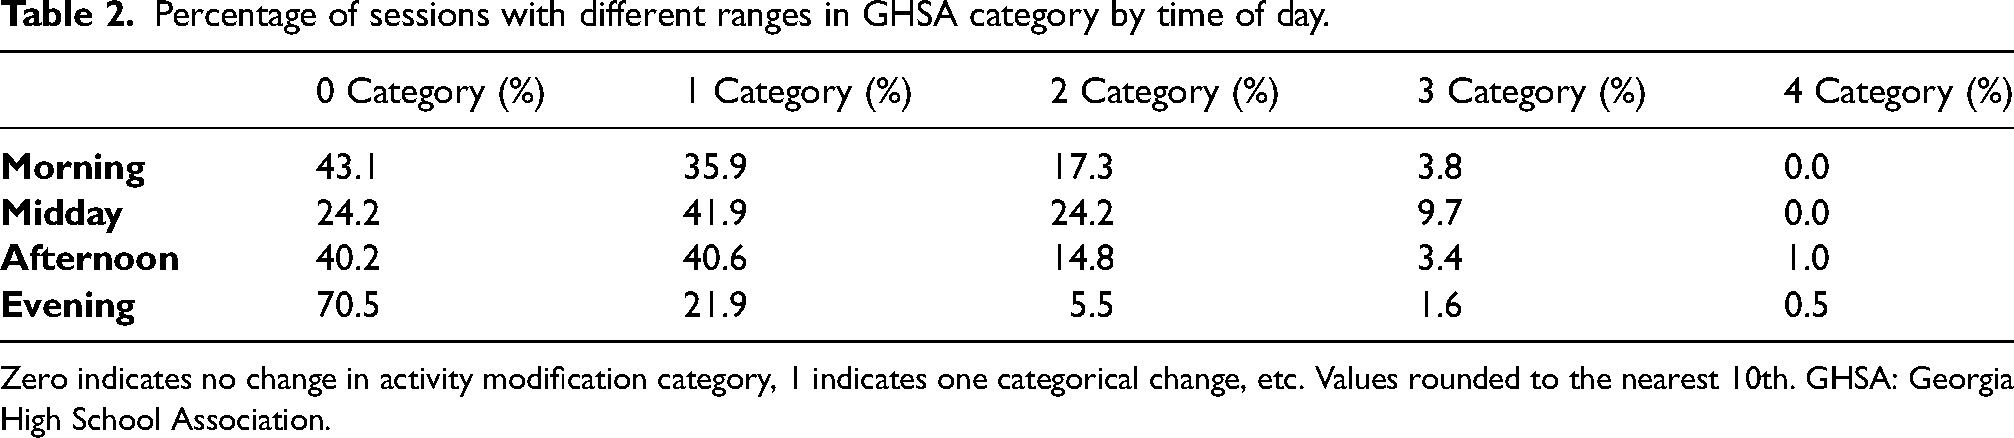
Zero indicates no change in activity modification category, 1 indicates one categorical change, etc. Values rounded to the nearest 10th. GHSA: Georgia High School Association.
Rate of change of session WBGT
The relationship between WBGT and time varied among the four times of day. Morning and evening periods had the strongest linear relationships between WBGT and time, with mean session r2 = 0.67 (95% CI = 0.65,0.70) and 0.76 (95% CI = 0.75,0.78), respectively. The linear patterns were weaker for midday with an r2 = 0.46 (95% CI = 0.37,0.55) and afternoon with an r2 = 0.47 (95% CI = 0.46,0.48). The mean session r2 is significantly different between morning and evening, and for morning/evening versus midday/afternoon; there was no difference between midday and afternoon.
Given that there is some linear relationship between WBGT and time, especially for morning and evenings, we computed the rate of change of WBGT per hour by time of day (Figure 1). The largest average rate of change was 1.31°C/h (95% CI = 1.17°C/h,1.45°C/h) in the morning. Both afternoon and evening sessions have negative rates of change, averaging −0.91°C/h (95%CI = −0.98°C/h,−0.83°C/h) and −1.11°C/h (95% CI = −1.17,−1.04°C/h), respectively. Midday had the smallest rate of change (near zero), averaging 0.08°C/h (95% CI = −0.49,0.64°C/h). All time periods had average rates of change that are significantly different from each other based on nonoverlapping 95% CIs. In addition, we found similar patterns when we stratified the data by month (i.e. July, August, September, and October; Supplemental Table S1).
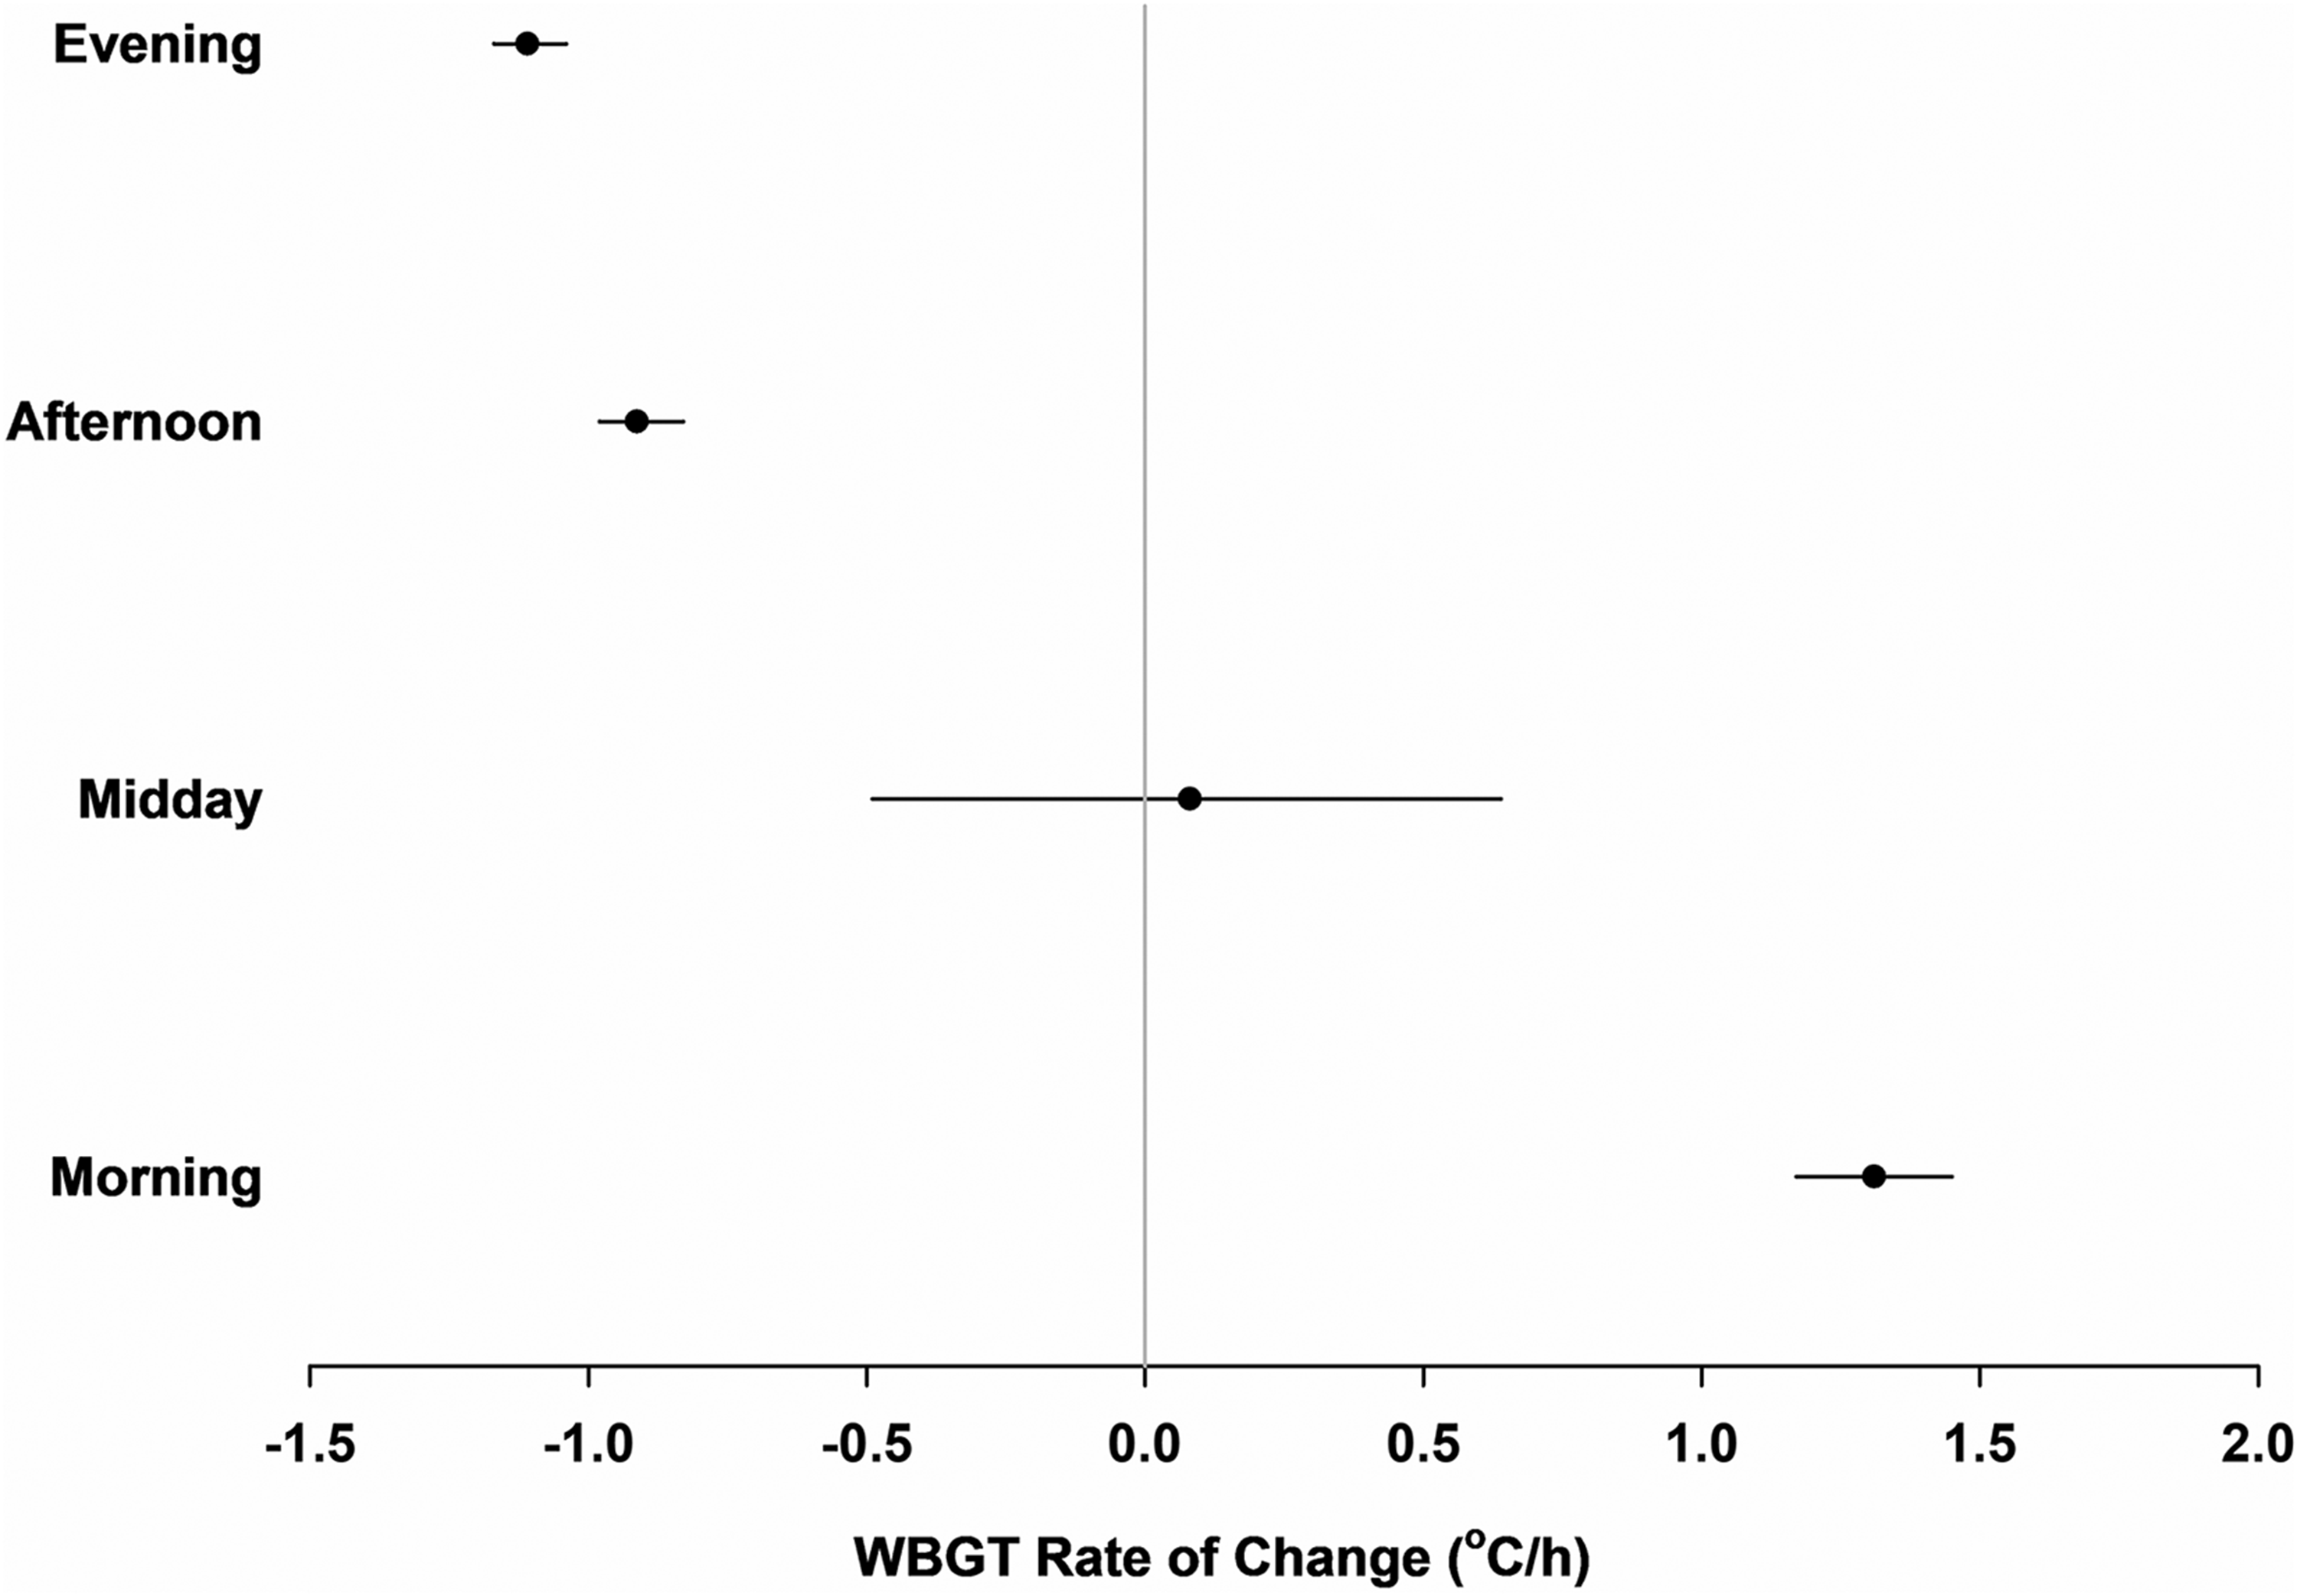
Mean rate of change of session WBGT (oC/h) by time of day with 95% confidence intervals. WBGT: wet bulb globe temperature.
Case study of WBGT variability
Two practices (27 July 2012 and 25 July 2013) from Brunswick High School (located in the city of Brunswick in southwestern Georgia) were used to show the variability of WBGT, along with the component variables of DB, NWB, and BG temperatures (Figure 2). These morning practices were 1.5–2 hours in length, had similar WBGT ranges of 3.1°C to 3.5°C, and experienced a shift of GHSA activity modification categories at some point during the session. Yet, there are important differences in how the WBGT changes with time and when GHSA activity modification thresholds are crossed. In the session with a stronger linear WBGT trend (r2 = 0.95; 27 July 2012), the WBGT begins at 27.9°C, increases, along with its components, over the duration of the practice (Figure 2(a)). For all but the last measurement, conditions are at GHSA activity modification category 2 throughout the practice (Table 1). In addition, the monotonic increase in WBGT over time means that heat stress is increasing through the practice, although conditions remain mostly in one activity modification category. In the session with the weaker linear trend (r2 = 0.21; 25 July 2013), however, the variability in the globe temperature during the session (caused by changes in solar radiation) led to more variable WBGTs with time (Figure 2(b)). In this example, the WBGT begins at 25.3°C (which requires no activity modification), shifts to GHSA category 2 activity modification for 2 consecutive readings in the middle of practice and then back to no activity modification. Thus, a single measurement at the beginning of practice would not adequately capture the additional heat stress occurring throughout the entire session.
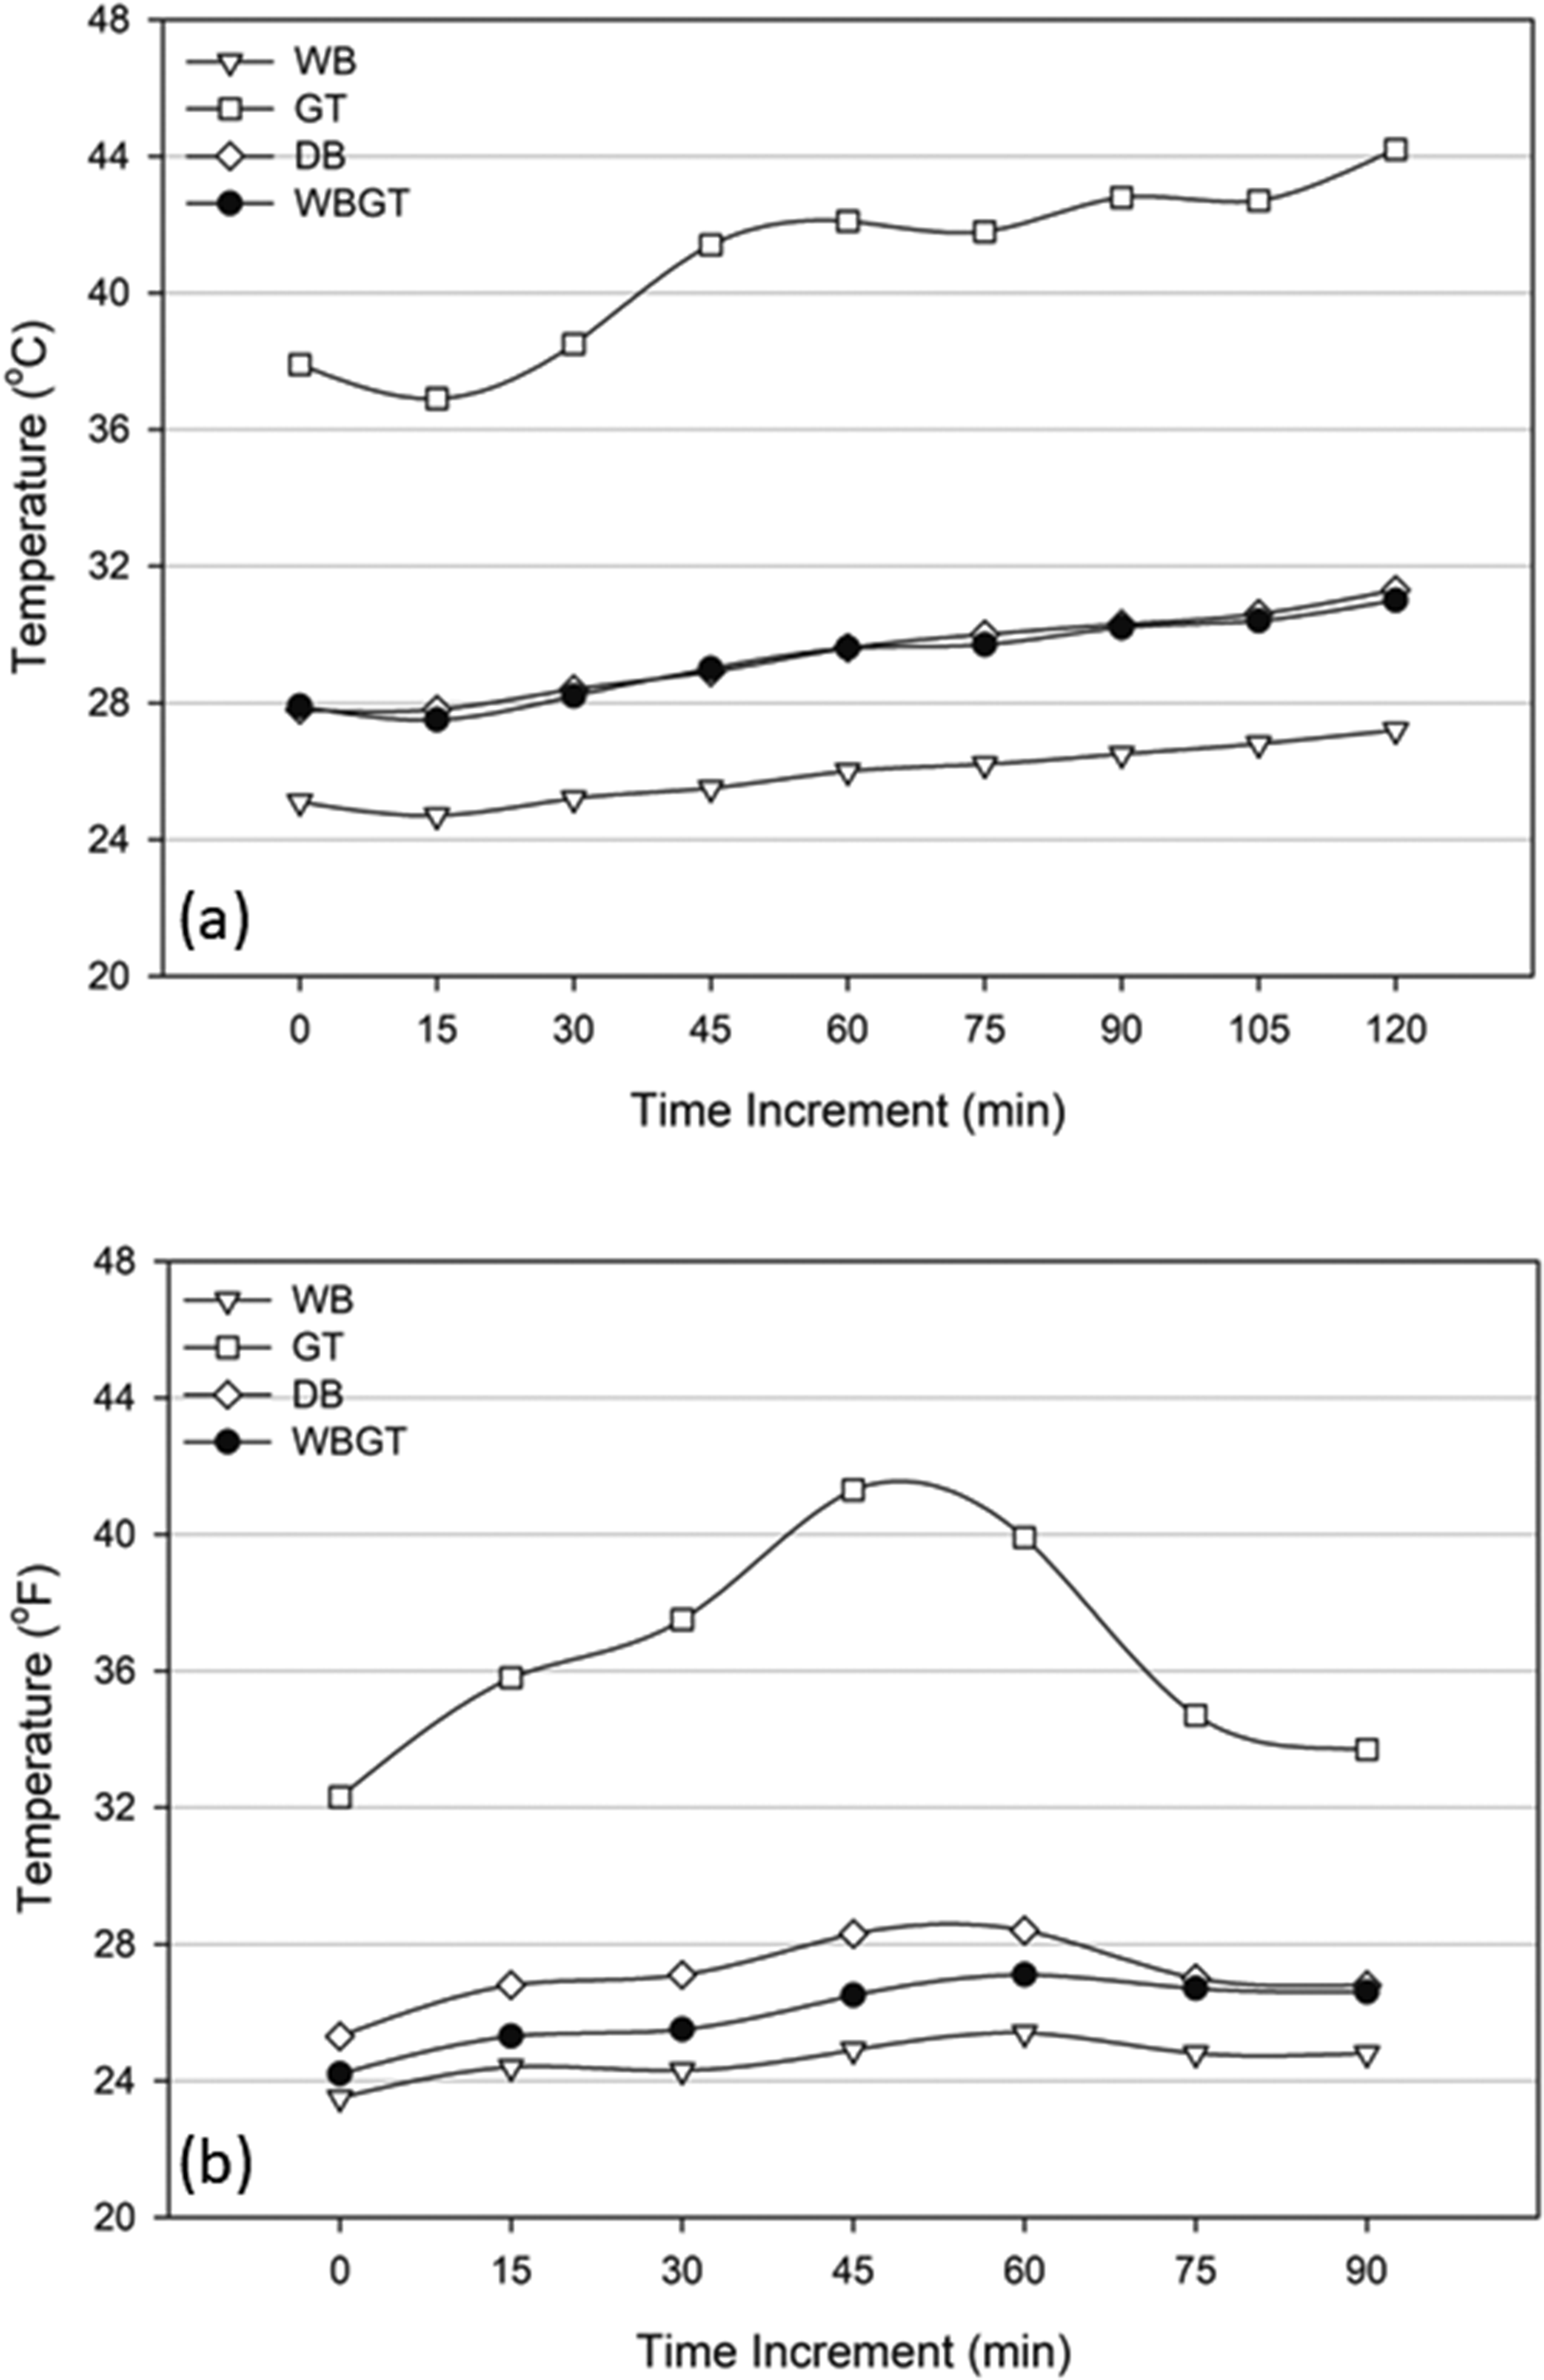
Morning practice sessions from Brunswick High School for (a) 27 July 2012 and (b) 25 July 2013 with strong and weak changes in WBGT with time, respectively. DB: dry bulb temperature; GT: globe temperature; WB: wet bulb temperature; WBGT: wet bulb globe temperature.
WBGT sampling and maximum heat stress conditions
The variability in WBGT and changes in GHSA categories within sessions we observed indicates that multiple observations should be collected during activities like practice or competitions. Here, we can leverage our large dataset to investigate whether different sampling rates will affect the accuracy of identifying the maximum session WBGT and the ability to determine the need for activity modification. The ability to capture the “true” maximum temperature is reduced with larger sampling intervals (Table 3). MAE values, as expected, are lower than RMSE. Using 30-minute sampling, the MAEs relative to 15-minute sampling range from 0.12°C to 0.29°C and RMSEs 0.37°C to 0.62°C. At 60-minute sampling intervals, the MAEs relative to 15-minute sampling range from 0.28°C to 0.83°C and the RMSEs 0.55°C to 1.10°C. Under both sampling scenarios, the largest errors were found in the afternoon and morning.
Accuracy measures for maximum session WBGT for 15 versus 30-minute and 15 versus 60-minute sampling intervals.
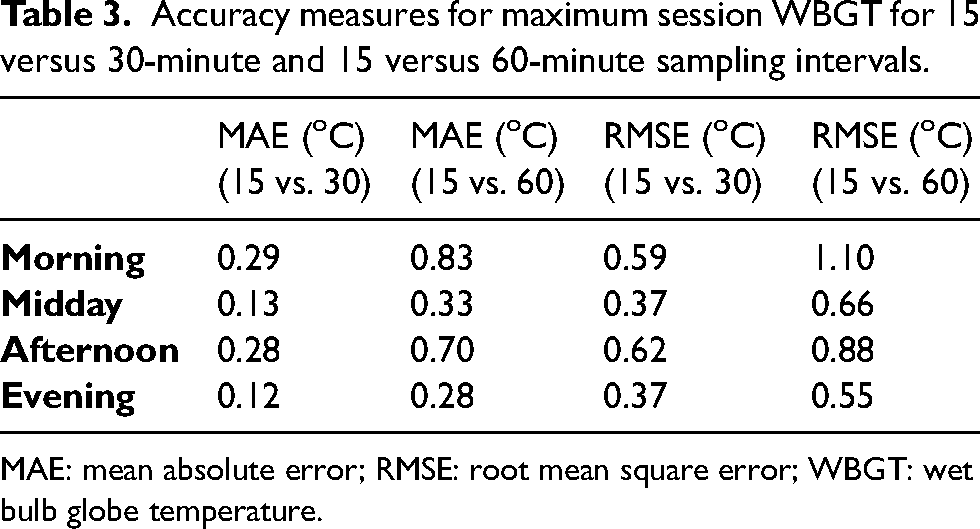
MAE: mean absolute error; RMSE: root mean square error; WBGT: wet bulb globe temperature.
We also assessed the ability to accurately capture whether activity modification was required at some point during the practice (Figure 3). Using the 30-minute sampling, the hit rates were greatest at the lower GHSA categories and decreased at higher GHSA categories. At GHSA category 1, for instance, the hit rate was 1 and fell to 0.71 to 0.84 in category 4 (Figure 3(a)). The hit rates tended to increase for all but morning in category 5, with values from 0.82 to 0.96. However, there are relatively few observations that fall into category 5 especially in the evening and morning sessions, and some caution should be used when interpreting these results. Also, the hit rates were best for midday and generally worst for morning and afternoon. A similar pattern appears in the 60-minute sampling, although with lower hit rates for categories 2 to 5 (Figure 3(b)). Also, the morning and afternoon had the lowest overall hit rates compared with midday and evening. Of particular note are the hit rates under 0.5 in categories 4 and 5 in the morning and 0.47 to 0.65 for these categories in the afternoon.
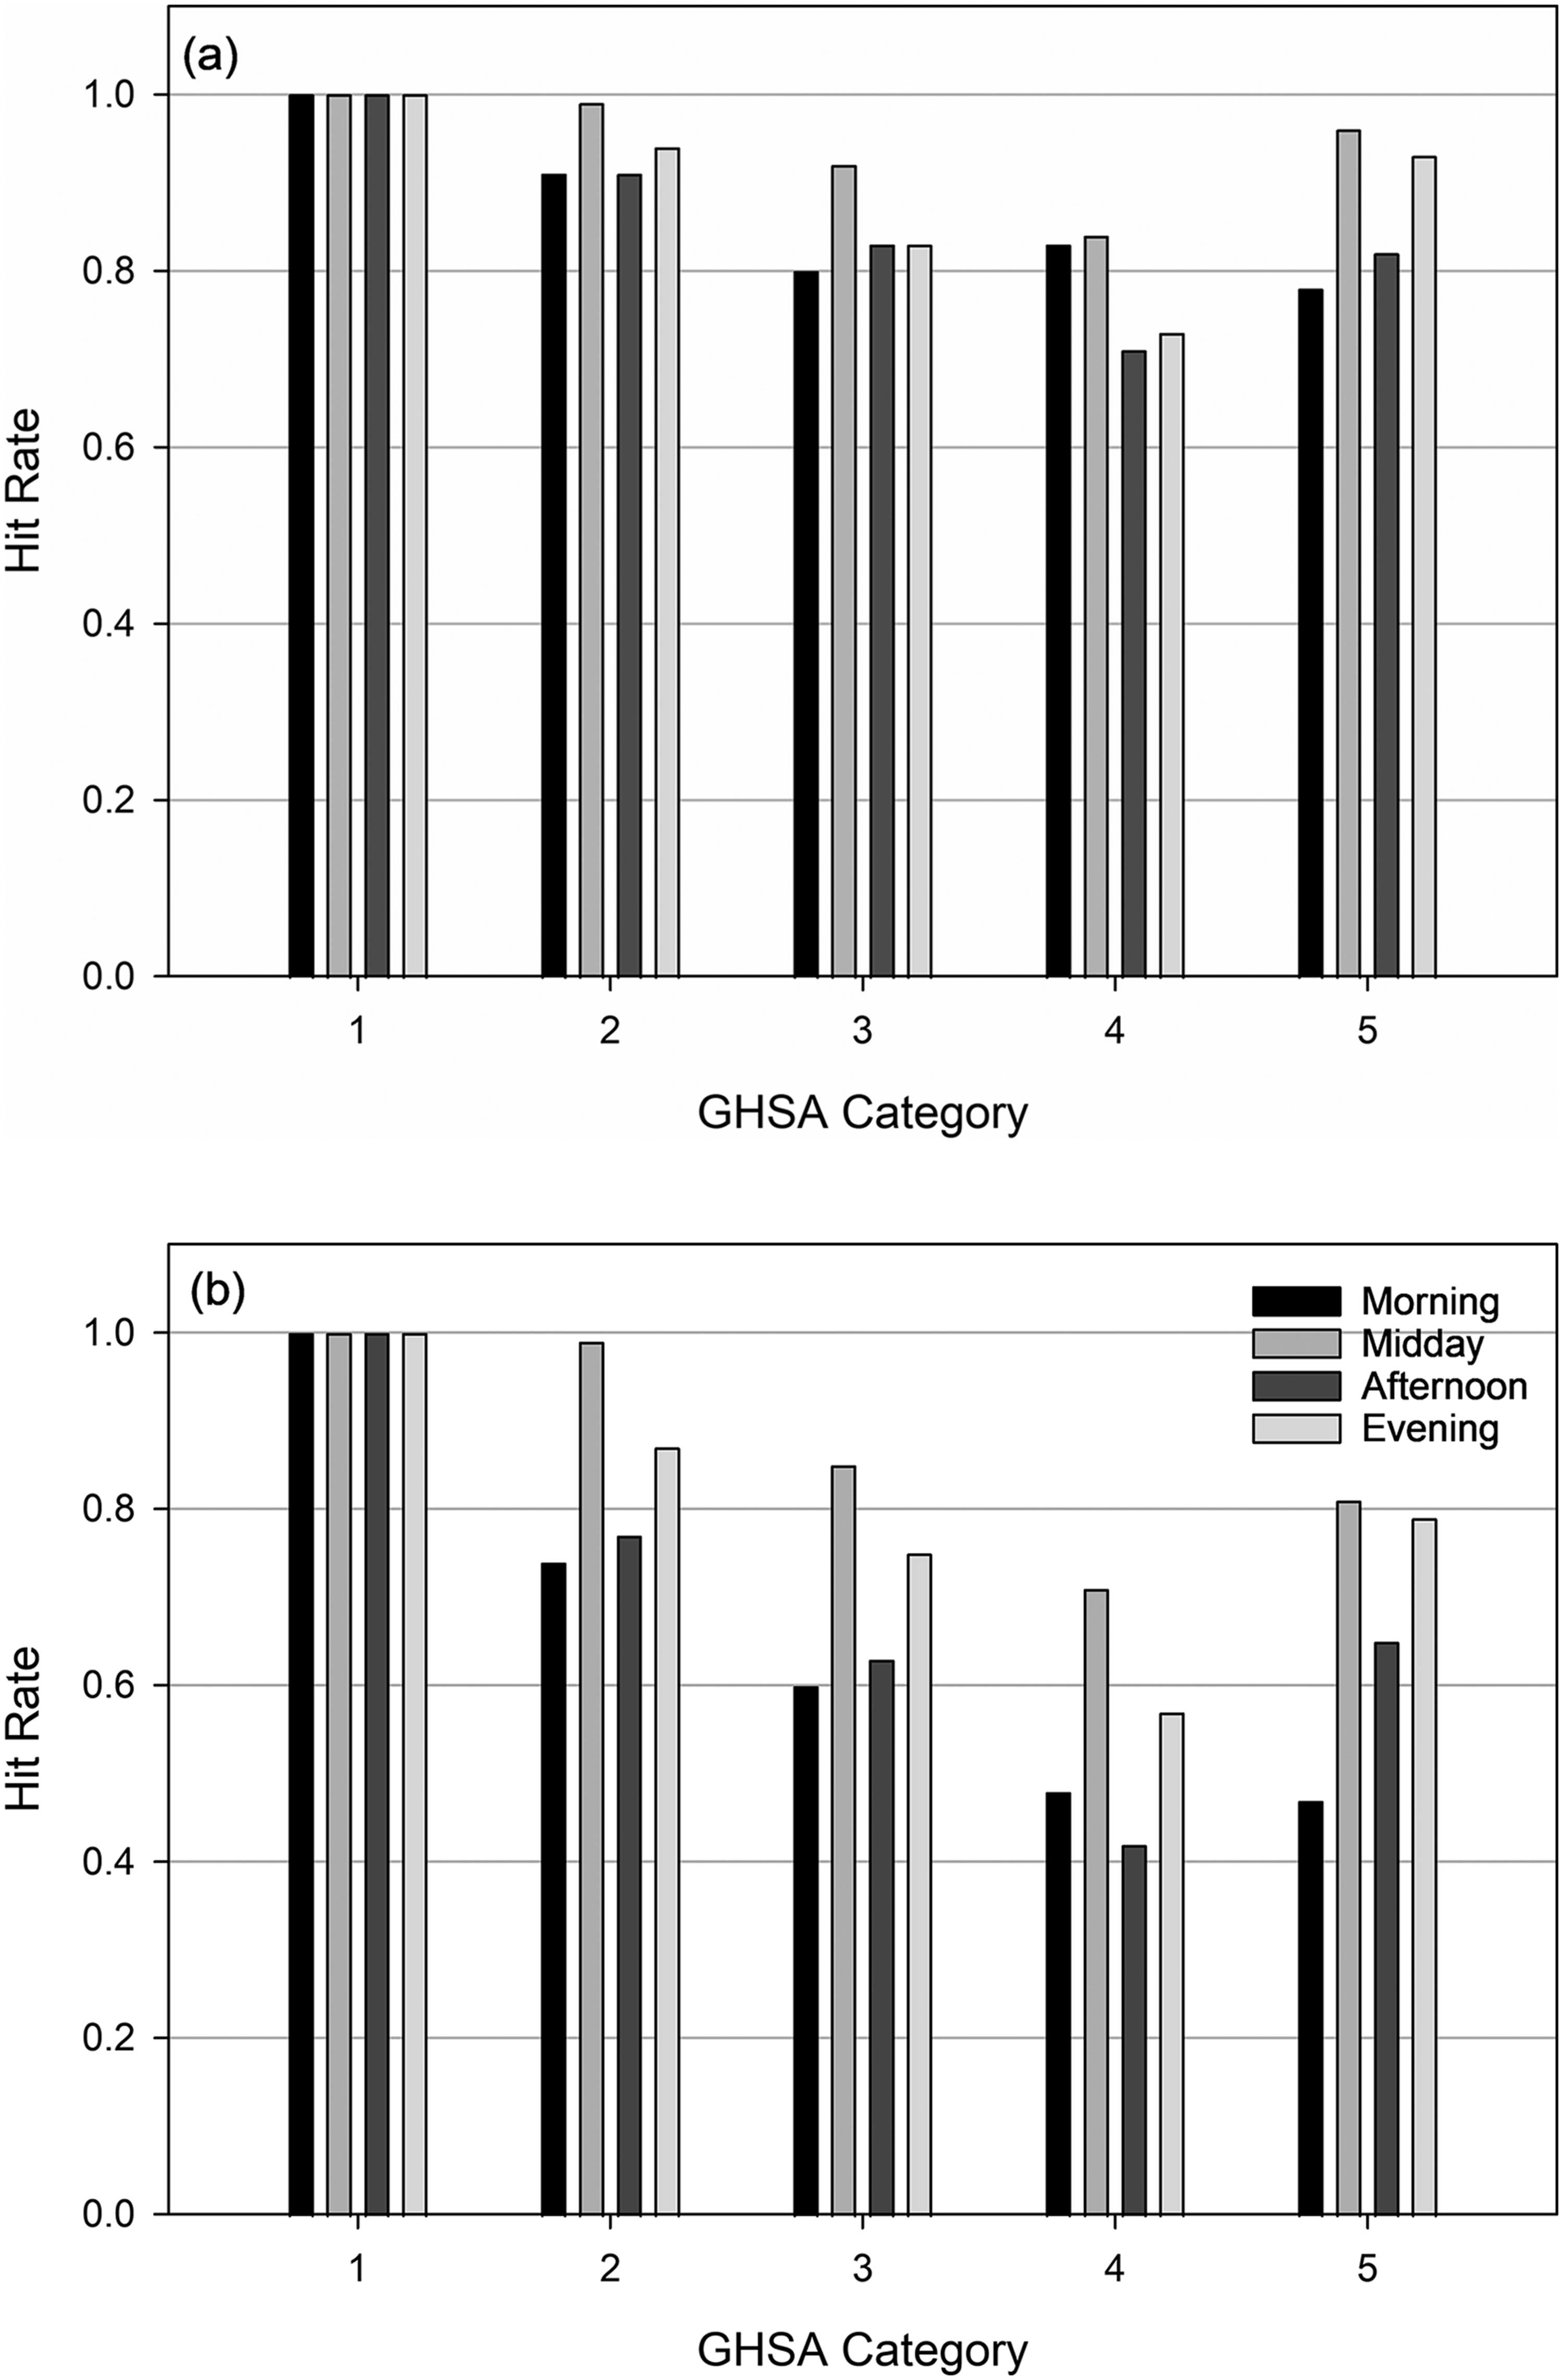
Hit rates for (a) 15 versus 30-minute sampling and (b) 15 versus 60-minute sampling for GHSA categories 1–5. GHSA: Georgia High School Association.
Discussion
We examined the temporal patterns of WBGT over 6 years of data from practice and competition sessions of Georgia high school football teams to gather insight into the variability of WBGT within sessions and among times of day. During the study period, morning (mean = 26.67°C) and evening (mean = 24.84°C) session WBGTs were, on average, cooler than those during midday (mean = 30.23°C) and afternoon (mean = 27.21°C). These findings are consistent with climatological work by Grundstein et al. 29 who observed similar patterns, including peak WBGTs during midday.
In terms of variability, we found no difference in the average standard deviation among morning, midday, and afternoon sessions. Evenings, however, tended to have lower variability than the other times of the day. In addition, we identified strong linear trends in the direction of change for morning and evening sessions. The morning had the largest increase (mean = 1.31°C/h) and the evening had the largest decrease in WBGT over time among sessions (mean = −1.11°C/h). On average, afternoon sessions had a slightly lower rate of decrease in WBGT (mean = −0.91°C/h) than those in the evening and midday sessions had no trend in WBGT. The implications of these findings are that from a heat danger perspective, frequent monitoring is especially important during times that are hotter with larger variability (i.e. midday and afternoon) or when there is a trend of increasing heat hazard overtime (morning). The initial measurement during an evening session on average represents the worst conditions and the most restrictive activity modifications; more frequent measurements, then, may allow more flexibility in activities as conditions cool.
Climatological patterns as noted above can certainly be helpful but cannot substitute for on-site real-time observations to guide activity modification. Our case study of two practice sessions reinforces the need for collecting multiple measurements as meteorological factors such as cloud cover can alter heat stress during a practice or competition in an unpredictable way. Finally, these changes are clinically important as we observed a change in GHSA category of 1 or more within a given session in 57% of morning, 76% of midday, and 60% of afternoon, and 29% of evening sessions that can affect activity modification.
The above findings which show variability through sessions support the need for frequent monitoring of WBGT throughout a practice or competition session. A key question is how often to measure WBGT. While there are suggestions from expert opinion and examples from clinical guidelines, there are no data to our knowledge that quantify the implications of using different sampling frequencies. Our results provide quantitative information on the patterns of WBGT for practice sessions throughout the day and how changing the monitoring frequency can affect the detection of potentially hazardous conditions and the implementation of appropriate activity modification. We observed higher sampling rates better capture the maximum WBGT which is similar to results from Gough et al. 43 for sampling maximum air temperature. More importantly, a higher sampling rate better detects the “correct” activity modification category than a lower one. We observed particularly large reductions in the ability to capture dangerous conditions using the 60-minute sampling interval in more restrictive categories, especially in the afternoon. For instance, during the afternoon, the hit rate for category 4 (no protective equipment and no conditioning activities) is 0.71 for 30-minute sampling and 0.42 for 60-minute sampling. In other words, sampling every 30 minutes would misclassify the category 29% of the time and sampling every 60 minutes would misidentify this category 58% of the time when compared with 15-minute measurements. This is particularly important since afternoon is both one of the hottest times of the day and also a common after-school practice time.
Our findings are not designed to be a one-size-fits-all solution but rather to provide data to inform appropriate decision making. We recognize that there are a variety of practical and logistical issues with collecting WBGT data during practices and competitions. 17 First, continuous monitoring during a session is most effective for practice activities where adjustments in work-to-rest ratios and equipment can easily be made. At least for American football, this is important as most exertional heat illnesses (EHIs) occur during practices compared with competitions. 2 In certain competition settings like marathons, however, measurement is usually taken prior to the race. Yet, knowledge of the rate of change in WBGTs over different times of the day, as presented in our study, may help to guide decisions about how WBGTs may change over the race based on the initial measurement. Morning races, for instance, can be assumed to have increasing WBGTs over the duration of the competition. This highlights the importance of informing runners about changing conditions, either by posting WBGTs along the course or even pushing text-based notifications to runners as is done at the Boston Marathon that would allow them to adjust their pacing and activity levels to the environmental conditions.44,45
Second, more frequent measurements and the potential for more frequent activity modifications does not necessarily have to be disruptive. Athletic trainers or coaching staff members, who have multiple responsibilities, are often tasked with the responsibility for collecting WBGT measurements and increased monitoring may add to their workload. Hosokawa et al. 17 suggests that physical effort can be reduced by either delegating measurement responsibilities to another staff member like a team manager or assistant coach or by using WBGT instruments that can transmit data to a smartphone or tablet. Also, practice policy can be designed to consider both safety and mitigate any disruptions caused by variability in measurements that are not sustained at higher activity modification levels. The GHSA, for instance, as of November 2022, is considering a policy revision where sessions that start at a higher activity modification category will remain at this level, even if WBGTs decrease, and if WBGTs increase to a new category during a session, the practice will only be modified if it remains at the higher category for at least 15 minutes. In addition, when addressing the concept of quantifying sustained exposure, Hosokawa et al. 17 recommended using a 30-minute rolling average WBGT to gather an integrated measure of heat stress that is less variable than single measurements. We agree that this may be an optimal approach, but at present, most commercial handheld sensors will not provide a running average WBGT. Thus, modulating the sampling interval as discussed in this article, and utilizing a policy such as noted above by the GHSA, is directly relevant to gathering representative conditions.
This study is not without limitation. The purpose of our study was to help optimize the use of a commonly used direct heat metric (WBGT) by leveraging a large dataset of actual practices/competitions to describe the behavior/pattern of WBGT data over time. It was not our intent to weigh in on the best heat metric. While our findings may be helpful for guiding decision making that relies on the WBGT, we recognize that our conclusions about measurement frequency are not linked to clinical outcome data (i.e. EHI incidence rate). Also, our study focuses only on WBGT and we cannot directly comment upon suitable measurement frequency of other heat metrics that are driven by weather factors. Future studies should aim to connect WBGT patterns and variability with the occurrence of EHIs as well as investigate suitable measurement frequencies of other heat stress indices.
Conclusions
Our study was designed to improve the use of WBGT in identifying heat-related hazards to athletes by better understanding its temporal variability. We collected data from thousands of American football practices and competitions and identified distinct temporal patterns in WBGT. On average, WBGTs are coolest in the morning and evening, and hottest in the midday and afternoon. WBGTs also change over sessions with distinct trends (increasing for mornings and decreasing for afternoon/evenings), depending on the time of day. GHSA activity modification categories often change during sessions, especially during morning, midday, and afternoon sessions. This indicates that measurements should be taken more than just at the beginning of a session to avoid underestimating heat stress in the case of morning or overestimating heat stress possibly for an evening session and unnecessarily missing out on training activities. The exact frequency of sampling will be influenced by practical considerations (e.g. staff to collect data), but our results show that more frequent measurements reduce the likelihood of misclassification of activity modification. Finally, routine sampling does not have to be disruptive if coupled with appropriate policies such as recommended by the GHSA, and technologies like sensors that transmit data and warnings to smart phones and tablets.
Supplemental Material
sj-docx-1-spo-10.1177_17479541231186146 - Supplemental material for Wet bulb globe temperature variability and its implications on heat stress monitoring
Supplemental material, sj-docx-1-spo-10.1177_17479541231186146 for Wet bulb globe temperature variability and its implications on heat stress monitoring by Andrew Grundstein, Earl Cooper and Yuri Hosokawa in International Journal of Sports Science & Coaching
Footnotes
Acknowledgements
The authors would like to thank the National Athletic Trainers’ Association Research and Education Foundation, Georgia High School Association, National Federation of High Schools, and Georgia Athletic Trainers Association for their support of the data collection in this study.
Declaration of conflicting interests
The author(s) declared no potential conflicts of interest with respect to the research, authorship, and/or publication of this article.
Funding
The author(s) received no financial support for the research, authorship, and/or publication of this article.
Supplemental material
Supplemental material for this article is available online.
References
Supplementary Material
Please find the following supplemental material available below.
For Open Access articles published under a Creative Commons License, all supplemental material carries the same license as the article it is associated with.
For non-Open Access articles published, all supplemental material carries a non-exclusive license, and permission requests for re-use of supplemental material or any part of supplemental material shall be sent directly to the copyright owner as specified in the copyright notice associated with the article.