
Abstract
The aims of this study were (i) to compare the sprint times between linear-sprint (LS) and curved-sprint (CS) tests of different radii, and (ii) to examine the relationships between sprint times in these tests in soccer players. Nineteen elite youth male soccer players (age, 18.6 ± 0.6 years) completed an LS test and three CS tests with different radii both from the left and the right side (11.15-m radius = CSwide, 9.15-m radius = CSmedium and 7.15-m radius = CSnarrow), each with a distance of 17 m. Differences in sprint times were examined using analysis of variance with Bonferroni-corrected pairwise comparisons and Cohen's d effect sizes (ES). Relationships between sprint times were determined by Pearson's product-moment correlations (r). Significantly lower sprint times were evident for LS compared to all three CS tests (p < .001, MD = 0.08–0.16 s, ES = 0.83–1.49), for CSwide compared to CSnarrow (p = .02, MD = 0.04 s, ES = 0.47) and for CSmedium compared to CSnarrow (p < .001, MD = 0.07 s, ES = 0.82). Very large correlations (p < .001, r = 0.75–0.80) were found between sprint times in LS and the three CS tests. Very large to nearly perfect correlations (p < .001, r = 0.79–0.91) were found within the three CS tests. Practitioners should be aware that sprint times are lower in LS compared to CS of different radii and that CS times are higher at narrower angles compared to wider angles. Given the high correlations within three CS tests, the application of only one CS (e.g., CSmedium) during a test battery may be sufficient if using different CS is not possible. Results of the correlation analysis also suggest that LS contributes to CS performance, however, to slightly different extents depending on the radius of the CS. Consequently, both LS and CS drills might be incorporated into sprint training practices of elite youth soccer players.
Introduction
Sprinting is a key component of overall performance in soccer.1,2 Professional outfield players commonly cover 250–400 m per match while sprinting,3–5 both in a linear and non-linear manner.6,7 However, recent studies using video footage and spatio-temporal data of matches, respectively, indicate that especially those sprints performed at maximal speed follow a curvilinear pattern in approximately 85% of cases8,9 with angles of between 5° and 30° 10 and radii of between 3.5 and 11 m 11 being observed. Such curved sprints (CS) were recently defined as ‘the upright running portion of the sprint completed with the presence of some degree of curvature’.8,12
While the assessment of linear-sprint (LS) and change-of-direction performance reflects a standard component of fitness testing batteries in soccer, 13 assessing CS performance only gained popularity in recent years, 12 despite the frequent occurrence of CS actions during matches.9,10 The test that is most widely used in this regards is the CS test by Fílter et al. 12 In this test, the players perform a 17-m sprint in the arc of the area within a radius of 9.15 m (official FIFA radius). The inter-session reliability of this test has been confirmed with intraclass correlation coefficients (ICCs) of 0.89–0.93 and coefficients of variation (CV) of 0.87–1.15%. 12 Since then, this test has been applied in a number of studies.12,14 For example, Loturco et al. 14 showed that soccer players are faster in an LS compared to a distance-matched (i.e., 17 m) CS, while Fílter et al. 12 only found this trend regarding the ‘weak side’ during CS.
Moreover, the authors of the latter study also investigated the relationship between LS and CS performance and found only moderate correlations (r = 0.59), concluding that LS and CS represent different skills. 12 By contrast, other studies found higher correlations of r = 0.67–0.76, 15 r = 0.74–0.82, 14 and even r = 0.93–0.95, 16 which might be attributed to other age groups and performance levels of players being investigated. 17
However, only the abovementioned CS test using a radius of 9.15 m was applied in all of these studies. Conversely, as neuromuscular and biomechanical differences are evident between LS and CS due to the emerging centrifugal forces during the latter, 18 changing the radius during CS might also alter such neuromuscular and biomechanical characteristics, and therefore, performance in the respective tasks. 10 For example, smaller radii will possibly further increase contact time and reduce step length and frequency as compared to wider radii.19,20 Moreover, joint stabilization in the frontal plane is thought to become more important with smaller radii. 21 As CS occur at a variety of radii during match-play, it seems worthwhile to investigate CS tests using different radii because of their potential neuromuscular and biomechanical, and consequently performance-related implications. 10 Therefore, in our study, we applied CS tests with three different radii: A wide CS with a radius of 11.15 m (CSwide), a medium CS with a radius of 9.15 m (CSmedium) and a narrow CS with a radius of 7.15 m (CSnarrow).
Specifically, we aimed to (i) compare the sprint times between LS and CSwide, CSmedium and CSnarrow and (ii) examine the relationships between sprint times in LS and CSwide, CSmedium and CSnarrow in a sample of elite youth soccer players. Based on studies conducted in soccer 14 and other sports19,20 as well as on theoretical considerations, we hypothesized that sprint times would be higher in all CS compared to the LS and would further increase the narrower the CS gets. Moreover, we expected large correlations between LS and all CS, however, with decreasing magnitude of correlations the narrower the CS gets.
The results of this study could enhance our understanding of CS in soccer using different radii and aid researchers and coaches in the selection of appropriate tests to assess CS performance.
Methods
Design
In the present cross-sectional study, elite youth soccer players completed an LS test and three CS with different radii (CSwide, CSmedium and CSnarrow) to compare sprint times and examine correlations between test outcomes. All tests were conducted at the beginning of the competitive season on an artificial grass soccer pitch. The players only performed light or no training the day before. All tests took place during a single session in the afternoon, weather conditions were dry, 21 °C.
Population
Nineteen elite youth male players belonging to the U19 team of a professional German soccer club (age, 18.6 ± 0.6 years; age range, 17–19 years; height, 182.1 ± 8.2 cm; body mass, 77.5 ± 9.5 kg; four to five training sessions and one official match per week) classified as tier 3 athletes 22 volunteered to participate in this study. All players were free from injuries at the time of testing. Data were collected during the routine fitness assessments of the team so that ethical approval was not required. 23 All athletes or their legal guardians, respectively, gave their written informed consent prior to participating in the fitness assessments.
Procedures
All participants performed a standardized 15-min warm-up consisting of jogging, short accelerations and movement-preparation exercises. Subsequently, players completed the four abovementioned tests in the following order: LS, CSwide, CSmedium and CSnarrow. All tests contained the same sprinting distance (i.e., 17 m) in order to allow for comparisons between the tests. A 3-min passive rest between the trials of each test and a 6-min rest between the tests was provided to ensure full recovery between the total of 14 sprint trials per player (2 LS trials and 12 CS trials).
For all tests, a recently validated timing-gate system using error correction processing (Smartspeed Pro, Fusion Sport, Coopers Plains, Australia) 24 was used. The start and finish timing gates were mounted at a height of 0.95 m, and the starting distance from the start timing gate was set at 0.30 m. 25 The players were instructed to perform a split-stance standing start for all tests. Athletes were free to choose the front foot depending on the test (e.g., CS tests to the left or to the right) but had to maintain the front foot for both trials of a test.
Linear-Sprint test
For the LS test, athletes performed two sprint trials in a straight line. The recorded score for this test was the mean value of the two trials. The intra-session reliability statistics were as follows: ICC 3.1 = 0.94 (95% confidence interval [CI] = 0.85–0.98) and CV = 0.72% (range = 0.04–2.52%).
Curved-Sprint tests
The three CS tests contained the same sprinting distance (i.e., 17 m) but differed regarding the radius used. CSwide consisted of a radius of 11.15 m, CSmedium of a radius of 9.15 m and CSnarrow of a radius of 7.15 m (Figure 1). Regarding CSmedium, the radius was already marked on the arc of the area. For CSwide and CSnarrow, the running paths were drawn manually using chalk spray (Figure 2). Each player performed four trials for each radius (two to the left, two to the right), leading to a total of 12 sprints. For each radius, the mean of the two trials to each side was computed, and the mean of both sides was recorded for analysis. The intra-session reliability statistics were as follows: CSwide: ICC 3.1 = 0.64–0.91 (95% CI = 0.03–0.86, 0.78–0.97), CV = 0.65%-0.97% (range = 0.02–2.67%, 0.00–6.75%); CSmedium: ICC 3.1 = 0.83–0.91 (95% CI = 0.56–0.94, 0.77–0.97), CV = 0.72–0.89% (range = 0.04–2.42%, 0.04–4.22%); CSnarrow: ICC 3.1 = 0.46–0.87 (95% CI = −0.44–0.78, 0.65–0.95) and CV = 1.05–1.62% (range = 0.00–3.11%, 0.25–5.10%).
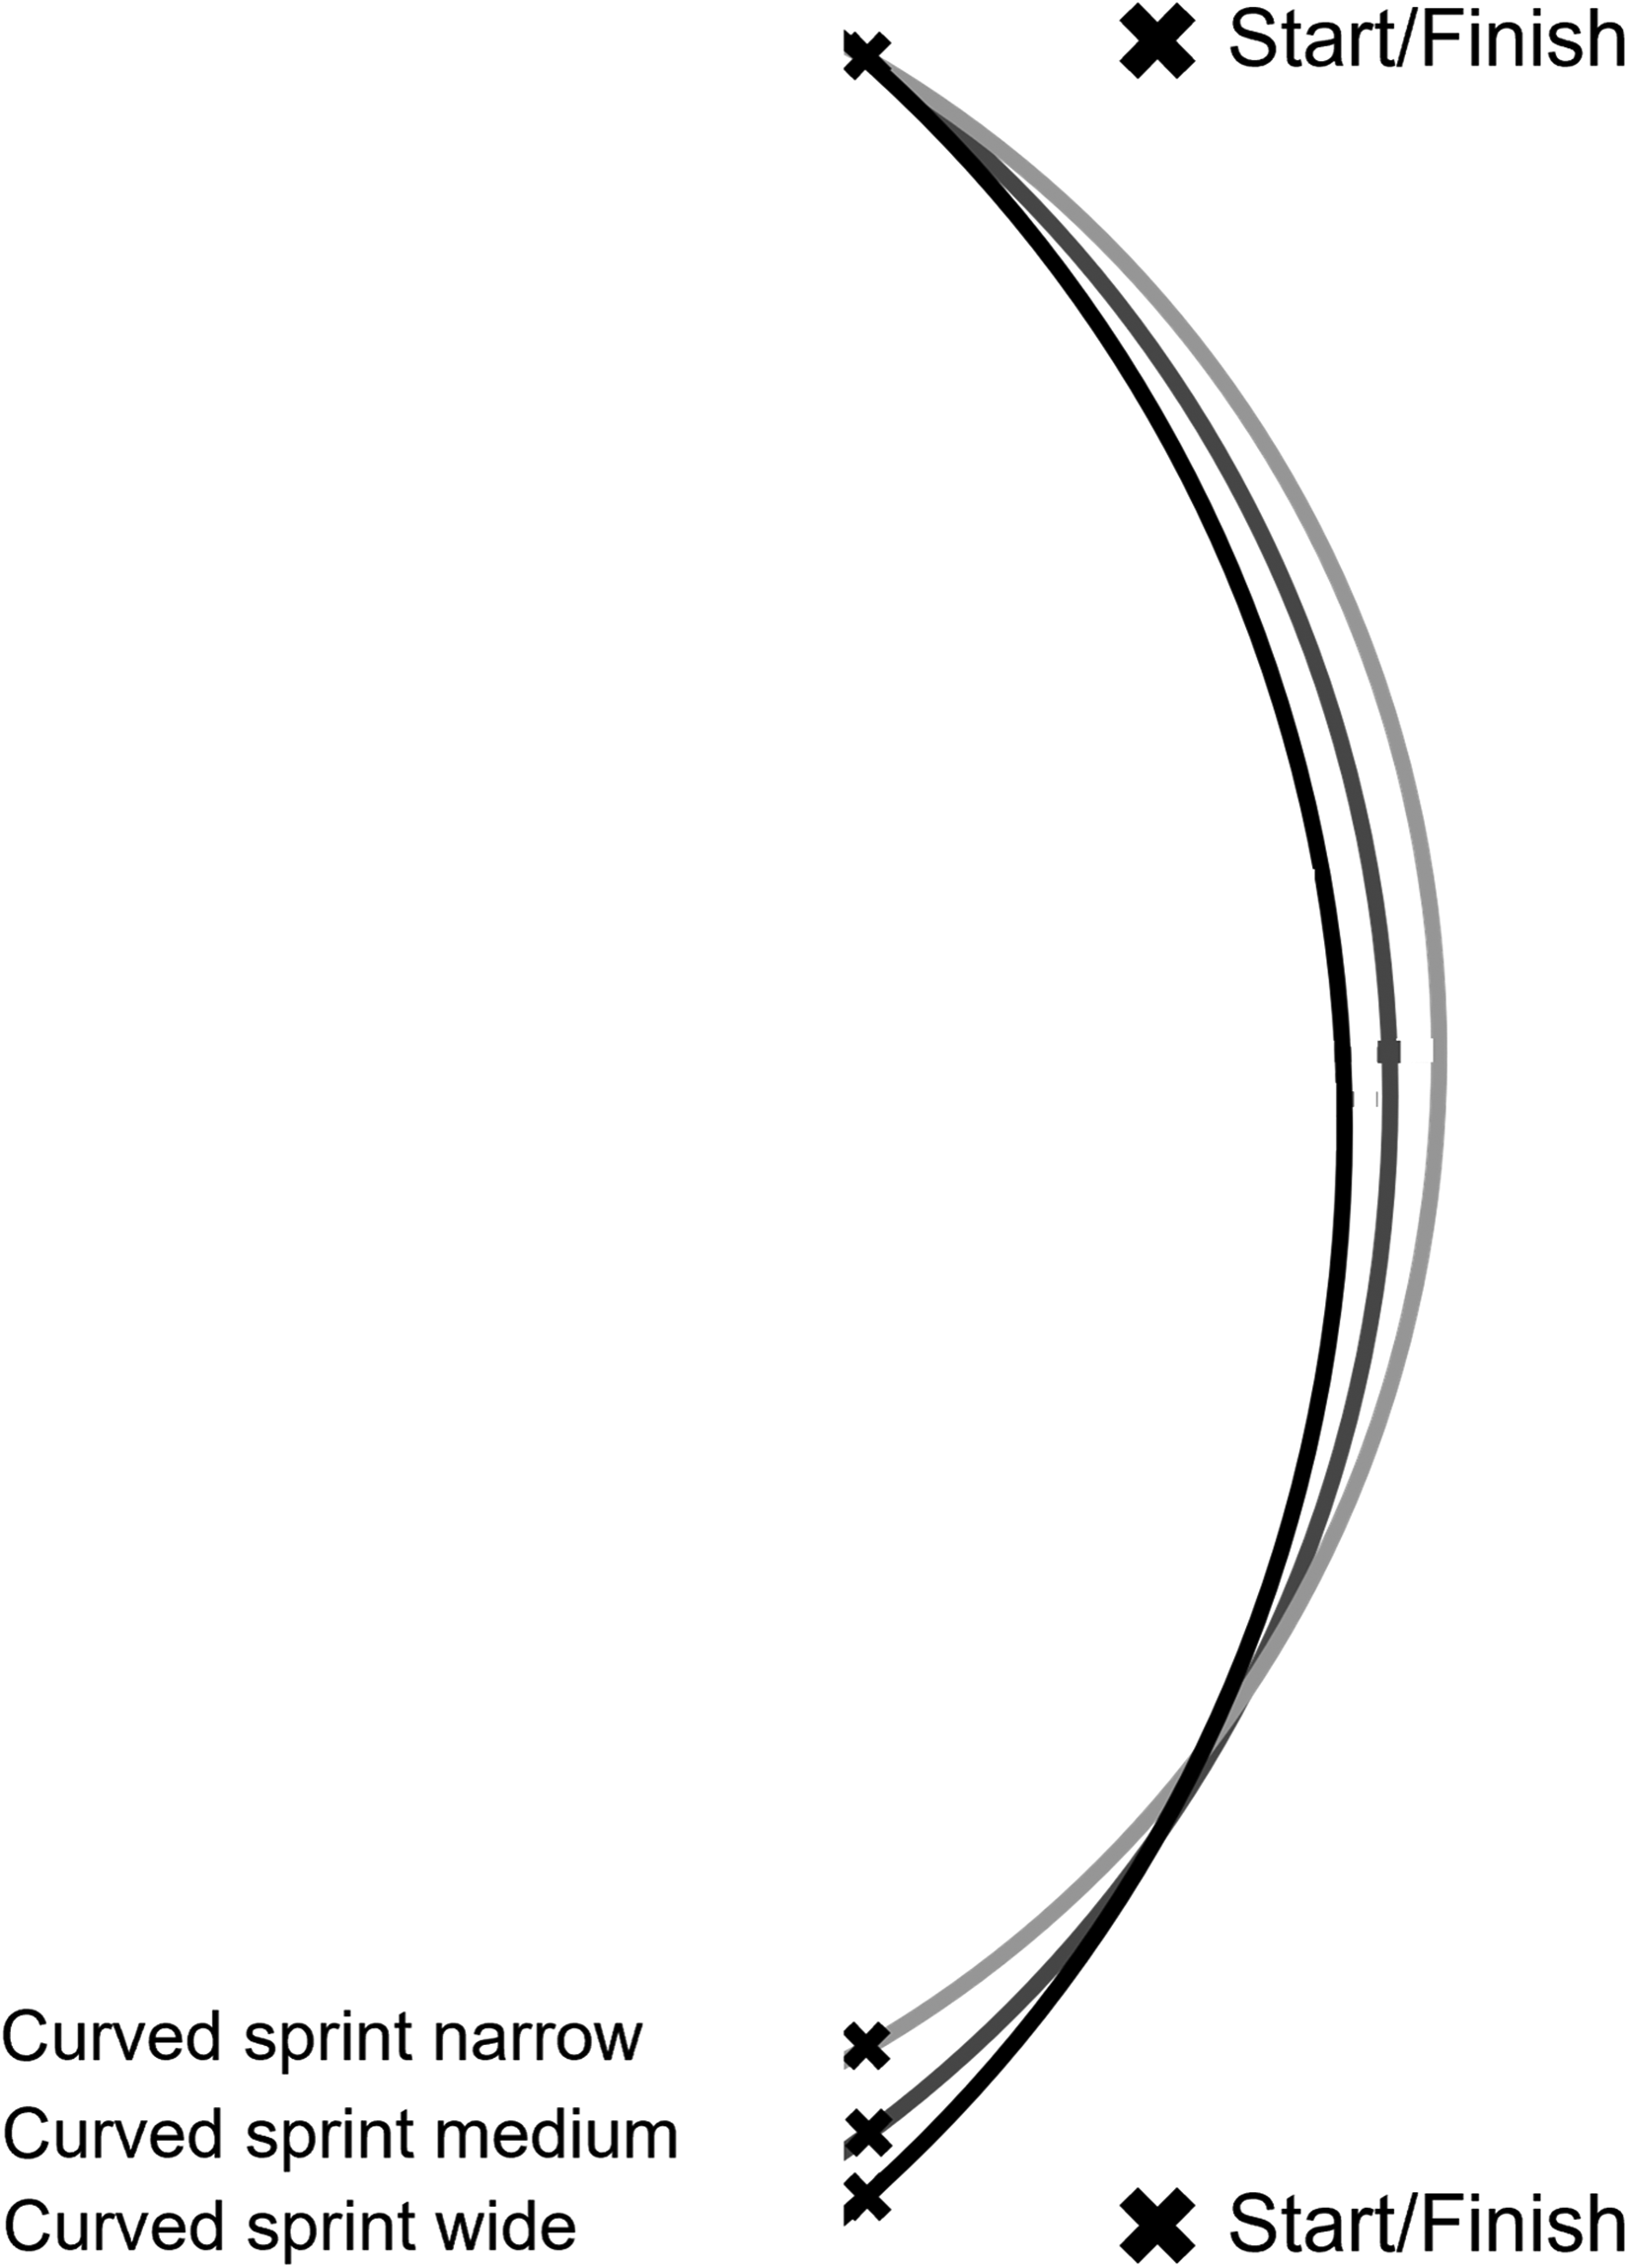
The three CS tests. CSwide consisted of a radius of 11.15 m, CSmedium of a radius of 9.15 m and CSnarrow of a radius of 7.15 m.
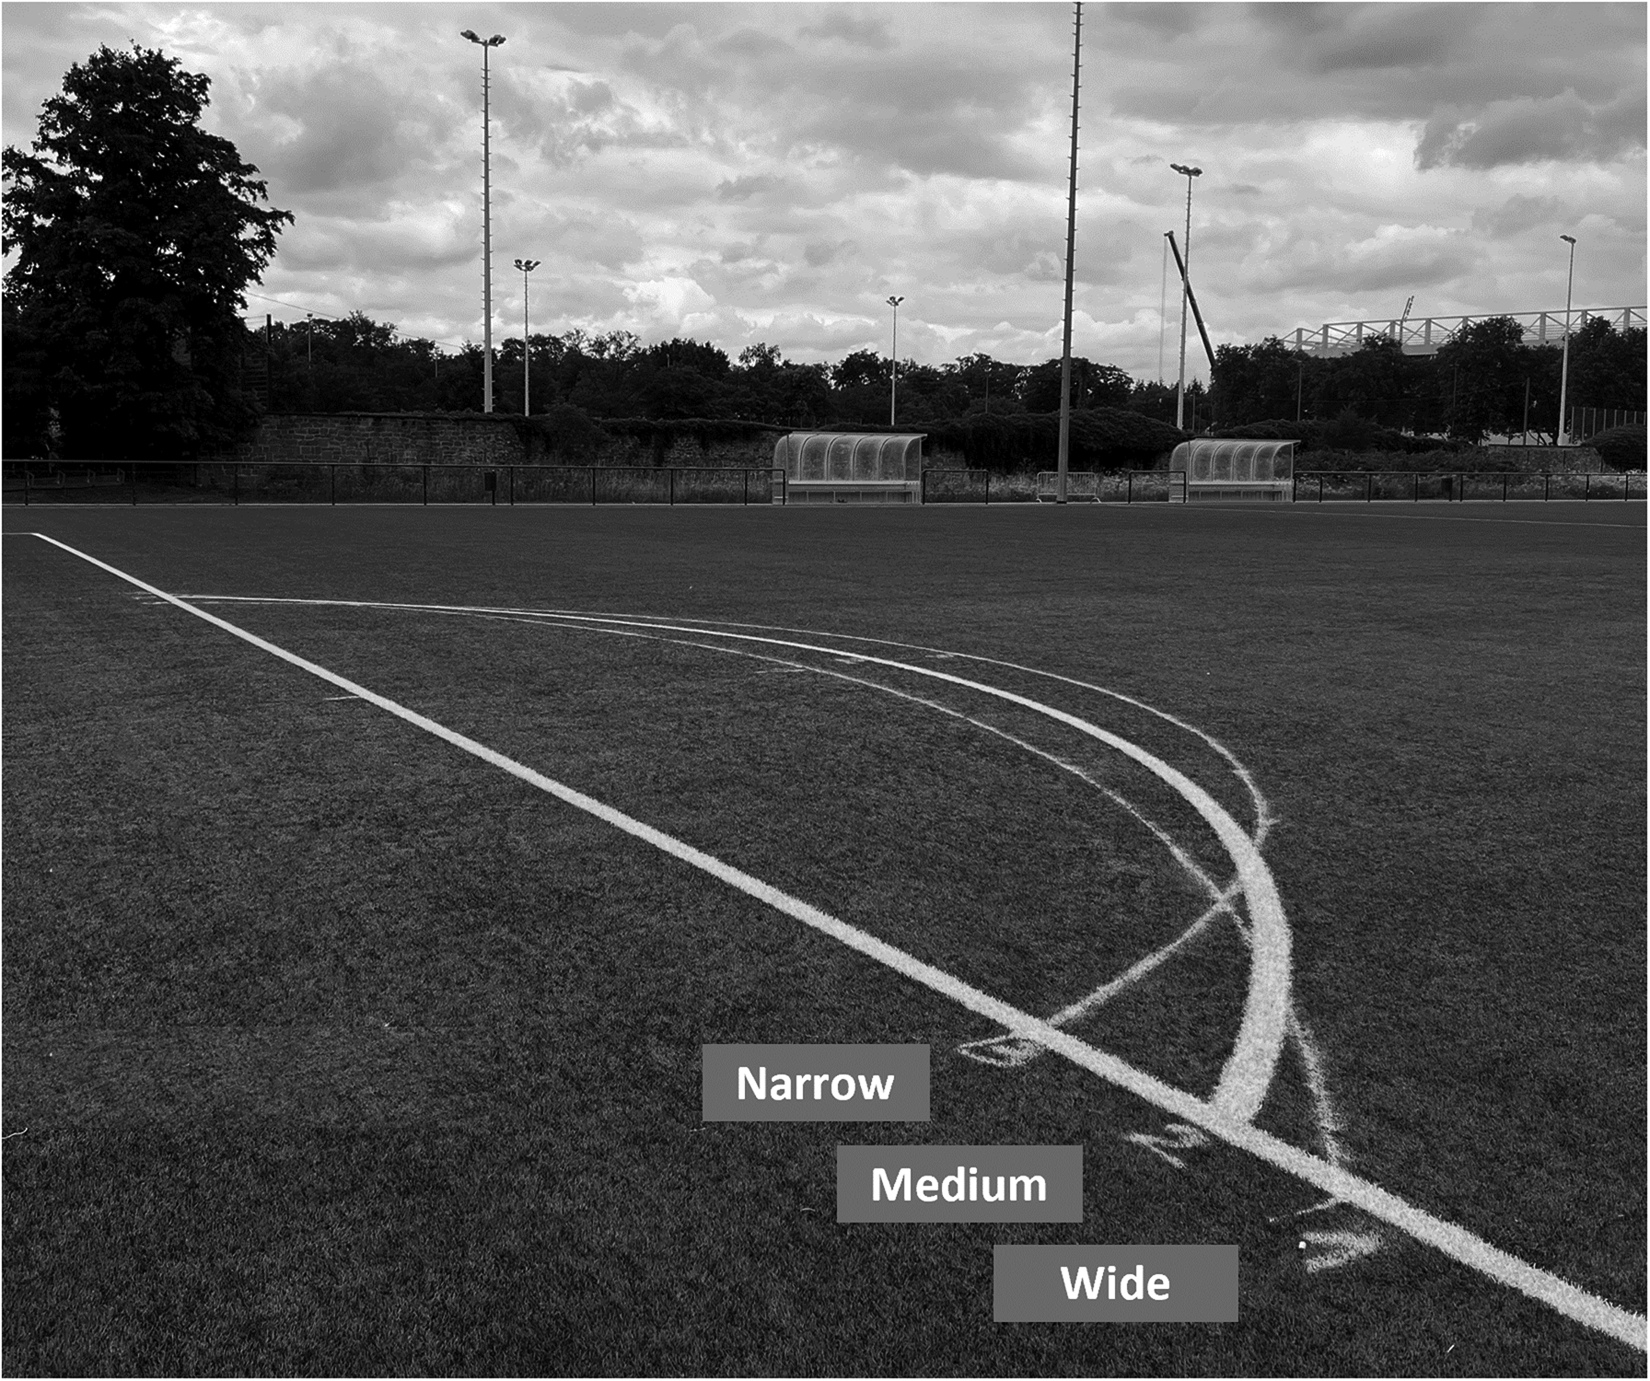
Illustration of the three curved-sprint (CS) tests (CSwide, CSmedium and CSnarrow) on the artificial-grass soccer pitch.
Statistical analysis
The data were analyzed using SPSS statistical software version 28.0 (SPSS, Inc., Chicago, IL). Mean values and standard deviations (SDs) were calculated for each test outcome.
Differences in sprint times between the four tests were examined using one-way repeated measures analysis of variance (ANOVA) and subsequent Bonferroni-corrected pairwise comparisons with 95% CI. Cohen's d effect sizes (ESs) using pooled SD were calculated to quantify the magnitude of differences between test outcomes. The ES was considered as small (0.2 ≤ ES < 0.5), moderate (0.5 ≤ ES < 0.8) and large (ES ≥ 0.8). 26
Relationships between sprint times in the four tests were determined by Pearson's product-moment correlations (r) with 95% CI. The magnitude of the correlation coefficient was considered as small (0.1 ≤ r < 0.3), moderate (0.3 ≤ r < 0.5), large (0.5 ≤ r < 0.7), very large (0.7 ≤ r < 0.9) and nearly perfect (r ≥ 0.9). 27 The significance level for all statistical tests was set to 0.05.
Results
Descriptive statistics (mean ± SD) and individual values for each player of all tests are illustrated in Figure 3. The ANOVA showed a significant main effect for sprint times between the four tests. Post-hoc comparisons revealed significantly lower sprint times for LS compared to all three CS (p < .001, mean difference (MD) = 0.08–0.16 s, ES = 0.83–1.49), for CSwide compared to CSnarrow (p = .02, MD = 0.04 s, ES = 0.47) and for CSmedium compared CSnarrow (p < .001, MD = 0.07 s, ES = 0.82) (Table 1). No significant differences were evident for CSwide compared to CSmedium (p = .06, MD = −0.03 s, ES = 0.38). Very large to nearly perfect correlations (p < .001, r = 0.75–0.91) were found between sprint times in all four tests (Table 1).
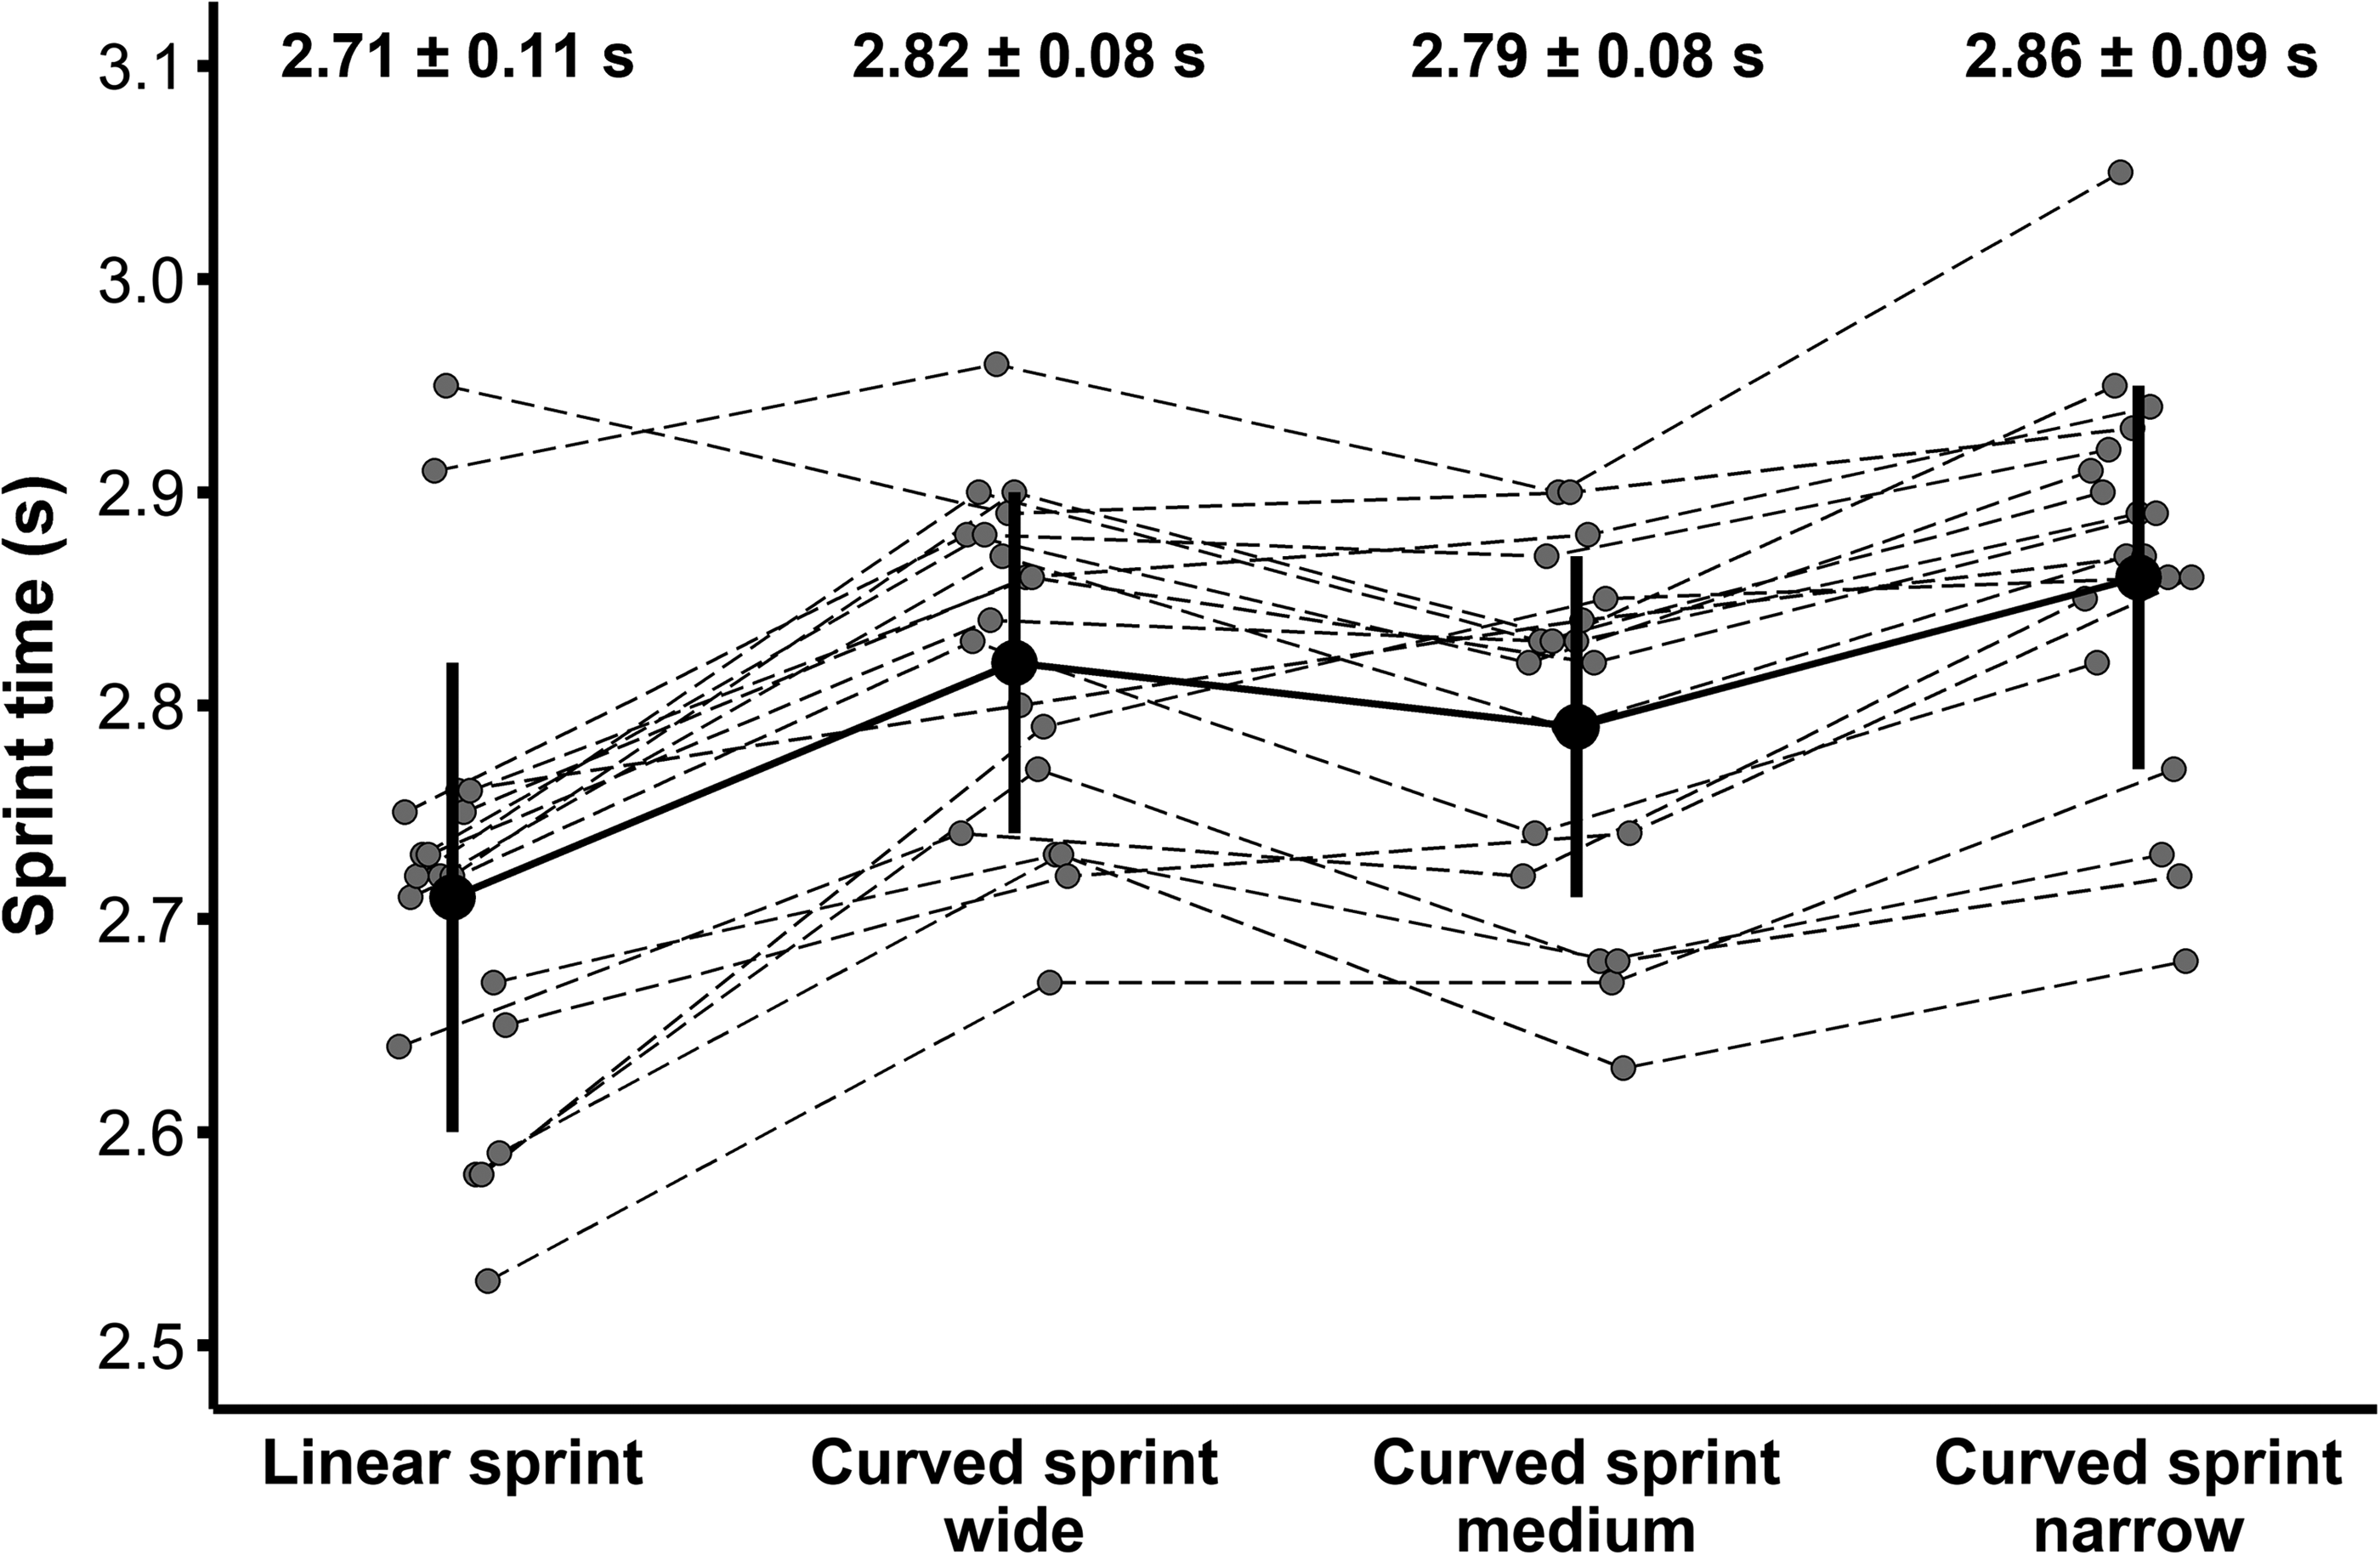
Descriptive statistics (mean ± standard deviation) and individual values for each player of all tests.
Mean difference (95% CI), ANOVA post-hoc test, ES and Pearson’s r (95% CI) between LS, CSwide, CSmedium and CSnarrow.
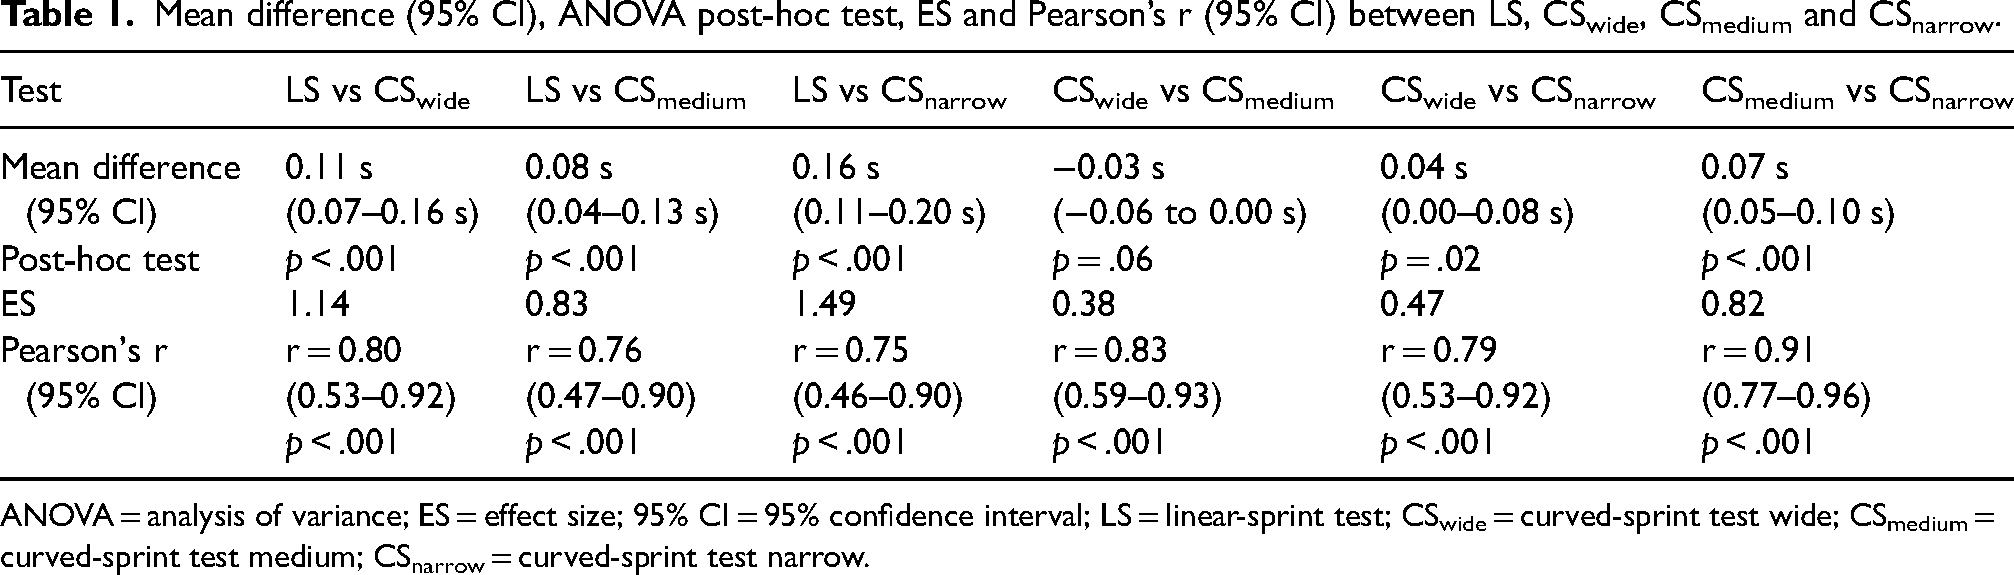
ANOVA = analysis of variance; ES = effect size; 95% CI = 95% confidence interval; LS = linear-sprint test; CSwide = curved-sprint test wide; CSmedium = curved-sprint test medium; CSnarrow = curved-sprint test narrow.
Discussion
The purpose of this study was to compare the sprint times between LS and three CS of different radii (wide, medium and narrow) and to examine the relationships between sprint times in these tests in elite youth soccer players.
The first main finding of this study was that sprint times were lower for LS compared to all three CS tests and that sprint times generally increased the narrower the CS got (although there were no significant differences between CSwide and CSmedium), thereby confirming our first hypothesis.
The second main finding was that very large to nearly perfect correlations were evident between sprint times in all four tests. Moreover, as the CS radius decreased, we observed slightly smaller correlations between LS and CS sprint times. Lastly, the correlations among sprint times in the three CS were somewhat higher than those between LS and all three CS. Although 95% CI was rather large for most of the correlations, also our second hypothesis can be confirmed.
Comparison of sprint times between the four tests
In terms of the comparison between sprint times, the present results are in line with previous research in elite youth male and elite senior female players showing that sprint times are lower in LS compared to CS.14,16 A new finding of our study was that sprint times were highest in CSnarrow compared to CSmedium and CSwide. These findings seem plausible as athletes need to make several mechanical adjustments during CS, which lead to increased contact time and reduced step length and frequency compared to LS.19,20 These adjustments are likely even more pronounced in CSnarrow compared to CSmedium and CSwide, resulting in higher sprint times. 10 The finding that sprint times did not further increase from CSwide to CSmedium was somewhat surprising. Although the players were familiar with CS in their daily training, this could potentially be attributed to a learning effect as all players performed the CSmedium after the CSwide. Moreover, we applied a relatively small difference in radius (i.e., 2 m) between the CS tests, which could contribute to the similar sprint times between CSmedium and CSwide.
Relationships between sprint times in the four tests
The very large correlations of sprint times between LS and the three CS are somewhat higher than the large correlations reported by Fílter et al. 12 who investigated semi-professional adult players, but well in line with other studies showing mostly very large to almost perfect correlations in elite youth male 14 and elite adult female players. 16 The slightly decreased correlation for CSmedium and CSnarrow compared to CSwide with regards to LS further reflects the different affordances at smaller angles compared to wider angles during CS 10 and that not all players were able to cope with these affordances in a similar manner. An explanation could be that joint stabilization in the frontal plane becomes increasingly important with smaller radii. Therefore, sprint speed may become increasingly limited by the ability of a group of joint stabilizer muscles to generate force, which is mainly accomplished by the inside leg. 21 The outside leg, by contrast, mainly serves as a propulsion and rotational stabilizer.9,18,28 Lastly, the finding that the largest correlations of sprint times were evident within the three CS, that is, larger than between LS and the three CS, may indicate that CS represents a unique skill (although with varying characteristics depending on the radius) as compared to LS. From a practical point of view, these very large to nearly perfect correlations suggest that researchers and coaches may use only one CS during a test battery if the application of different CS is not possible. In that sense, it would be interesting to know which CS radii occur most frequently during match-play in order to evaluate the specificity of the three CS in our study. Unfortunately, although there exist some studies investigating CS during matches9–11 such detailed data are currently not available.
Strengths, limitations and future research
The main strengths of this study are the inclusion of three different radii during CS and the high-performance level of the players. However, we did not separately report results for the left and right side or the good and weak side, respectively, during CS as it was done in previous studies12,14 because we did not find clear patterns in this regards and, therefore, only reported the mean for both sides. Moreover, although players rested for 3 and 6 min between trials and tests, respectively, we cannot exclude possible fatigue effects towards the last trials of the 14 sprints performed by each player. Randomizing the order of sprint tests would have accounted for this, however, this was not possible in the current study due to organizational reasons. It is also important to acknowledge that despite the point estimates of the correlations between the four tests were very large to nearly perfect, 95% CI was relatively large (range from moderate to nearly perfect). To obtain more robust correlations with a smaller 95% CI, a larger sample of players should be analyzed. Although beyond the scope of this study, it would be of interest for future studies to investigate the relationships and biomechanical characteristics between CS of different radii and change-of-direction sprints of different angles. These information could be used to determine the most appropriate movement pattern in terms of injury risk and performance of high-intensity actions during match-play. Lastly, as our investigation was cross-sectional in nature, no conclusions about causality can be drawn on this basis. In order to examine task-specific and transfer effects of different training interventions, future studies should investigate the impact of LS-oriented and CS-oriented programs on both LS and CS performance.
Conclusions
Researchers and coaches should be aware that sprint times are lower in distance-matched LS compared to CS tests of different radii and that CS times are higher at narrower angles compared to wider angles (although there were no significant differences between CSwide and CSmedium) in elite youth soccer players. Therefore, results from such tests should not be used interchangeably.
While all CS were very largely correlated with LS performance, correlations within the CS were highest. The latter suggests that the application of only one CS during a test battery may be sufficient if using different CS is not possible. In that case, we recommend a radius of 9.15 m for reasons of convenience as this radius is commonly already marked on the arc of the area according to FIFA dimensions and because it is best established in science and practice.
The results of the correlation analysis suggest that LS and CS share determining factors of performance, however, to different extents depending on the radius of the CS. Consequently, both LS and CS drills should be incorporated into sprint-training practices of soccer players, although task-specific and potential transfer effects of training remain to be investigated.
Footnotes
Declaration of conflicting interests
The author(s) declared no potential conflicts of interest with respect to the research, authorship, and/or publication of this article.
Funding
The author(s) received no financial support for the research, authorship, and/or publication of this article.