
Abstract
Badminton is a demanding sport that requires effective workload management to enhance performance and prevent injuries. This study developed a machine learning-based Decision Tree (DT) model to create personalized workload management strategies for 73 young elite badminton players, averaging 6 years of experience. Players underwent anthropometric and fitness assessments, with external loads measured via triaxial accelerometers and internal loads through rate of perceived exertion (RPE) during training and competition. K-means clustering categorized players into high, moderate, and low external workload levels. High-load players were generally older, taller, heavier, and exhibited superior flexibility, grip strength, and countermovement jump performance. Moderate-load players excelled in balance and leg endurance, while low-load players showed greater upper body strength, quicker reaction times, and higher perceived exertion. A sensitivity analysis was conducted to evaluate the impact of tree depth on model performance, followed by a comparative assessment of the Decision Tree (DT) model and multinomial Logistic Regression (MLR). The results demonstrated that the DT model outperformed the MLR, achieving 92% accuracy in predicting external loads compared to the MLR's 57%. This highlights the DT model's superior capability to provide tailored workload recommendations, thereby enhancing athletic performance and reducing the risk of injury.
Keywords
Introduction
Badminton, a physically demanding sport, requires high levels of fitness, agility, and coordination. Players execute complex movements like jumping, lunging, and rapid directional changes. 1 These actions impose significant external and internal workload demands. External load refers to measurable work done, while internal load encompasses the physiological and psychological responses to this work. 2 Effective workload management is essential for optimizing performance and minimizing injury risk. 3
Research across various sports, including soccer, basketball, gymnastics, and cricket, underscores the importance of monitoring both external and internal loads to tailor training and recovery strategies effectively. In soccer, studies have revealed age-related differences in training loads and the impact of match congestion on player performance, necessitating specific load management approaches.4,5 Basketball research has demonstrated the significant variability in physical demands between training and competition emphasizing distinct physiological and psychological stressors experienced by basketball players during these different contexts.6,7 In gymnastics, the lack of a significant relationship between internal and external load metrics suggests the need for independent consideration of each load type in training design. 8 Similarly, Soomro et al. emphasized the integration of physical conditioning and workload management practices in cricket fast bowlers, highlighting the relevance of combining internal and external load metrics to optimize performance and prevent injuries. 9
Determining the optimal workload for each badminton player is challenging due to individual differences in gender, fitness, and anthropometric characteristics. Studies have shown that female players may require lower workloads than male players due to differences in maximum heart rate.10,11 Similarly, another study found that players with a higher body mass index (BMI) required a lower workload to achieve the same level of exertion as players with a lower BMI. 12
Machine learning techniques offer a promising avenue for advancing workload management by developing predictive models tailored to individual player characteristics.3,13–16 While these models have been successfully applied in other sports, their application in badminton remains unexplored. Current workload management techniques in badminton often rely on standardized guidelines or subjective assessments, which may not adequately account for individual differences.
This study aims to address this gap by developing a machine learning model for workload management in badminton based on gender, fitness, and anthropometric characteristics. By generating individualized workload management recommendations, this model has the potential to significantly improve performance and injury prevention in badminton players. Additionally, the application of the Decision Tree-based machine learning model in the current study can help identify critical performance determinants, showcasing how technology can enhance workload management across sports by providing individualized insights.
Materials and methods
Participants
The study involved 73 young elite badminton players (49 males and 24 females) with the following characteristics: Age (14.45 ± 1.92yrs); Badminton experience (6 ± 2.2yrs) mean and standard deviation respectively. It is worth highlighting that while male and female players do not compete directly against each other in badminton, they were pooled in this study to develop a generalized machine learning model capable of capturing broader patterns in workload management across player demographics. Gender-specific differences in workload characteristics were accounted for as independent variables in the model to ensure representation. The players were drawn from various academy programs in Malaysia which were selected through simple random sampling. The study adhered to standard guidelines for research involving human subjects, as recommended by the Helsinki Declaration. After obtaining approval to conduct the study (UMT/JKEPM/2023/164), all participants aged 18 and above signed a consent form, while those under 18 had their parents or guardians sign on their behalf.
Anthropometric assessment
The participants were assessed for basic anthropometric attributes using standard procedures. Height, weight, abdominal circumference, waist circumference, hip circumference, leg length, and medial upper arm circumference (MUAC) were measured following established protocols. Standing height was measured with a wall-attached wooden stadiometer, and weight was determined in kilograms using an electronic scale. Waist, abdominal, and hip circumferences were measured in centimeters with non-elastic tape. 17 Leg length was measured from the anterior superior iliac spine to the medial malleolus with a measuring tape, and MUAC was measured at the midpoint between the acromion and the olecranon process using non-elastic tape. 18
Fitness and motor skills assessments
The fitness and motor skill assessments included the Y-balance test for dynamic balance, stork balance for static balance, single wall sit for lower body endurance, hand wall toss for hand-eye coordination, plank test for core strength, and sit-ups and push-ups for abdominal and upper body endurance, respectively. Explosive leg power was measured via the standing broad jump, while reaction time was assessed using the reaction time ruler test. The Badminton-Specific Endurance Test (B-Endurance Test) evaluated endurance and agility through repeated badminton-specific movements. 19 Grip strength was measured using a hand dynamometer, with all fitness data collected 48 h before game data to allow for recovery. 20
Monitoring internal load during training and competitive scenarios
The internal load of the players was monitored during both training sessions and competitive matches. Weekly averages of the players’ internal training loads were recorded, while internal loads from the competition were measured immediately after the players completed a match. Notably, the competitive data was collected during organized selection competitions held by each club, ensuring a high level of relevance to real-game scenarios. To maintain fairness in the selection process, matches were paired according to players’ age groups and gender. Each game followed a standard format of three sets, with the best of 15 points determining the outcome. This approach ensured consistency in the data collection process and allowed for accurate comparisons of internal load across different contexts and player demographics.
Sensor attachment and data streaming
In the current study, we utilized an Xsens sensor to quantify the external load experienced by each player during a competition. This sensor excels at measuring tri-axial acceleration along the X, Y, and Z axes, with a dynamic range extending up to ±16 g. To ensure optimal data recording, we set the sampling frequency at 30 Hz. 21 The sensor was affixed to the players’ lumbar region, as illustrated in Figure 1. Data extraction was performed in its raw format, preserving the integrity of the measured parameters. Specifically, we captured sensor data in both m/s² and mg units. These real-time measurements were transmitted to the computer via Bluetooth Low Energy (BLE) protocol. 22
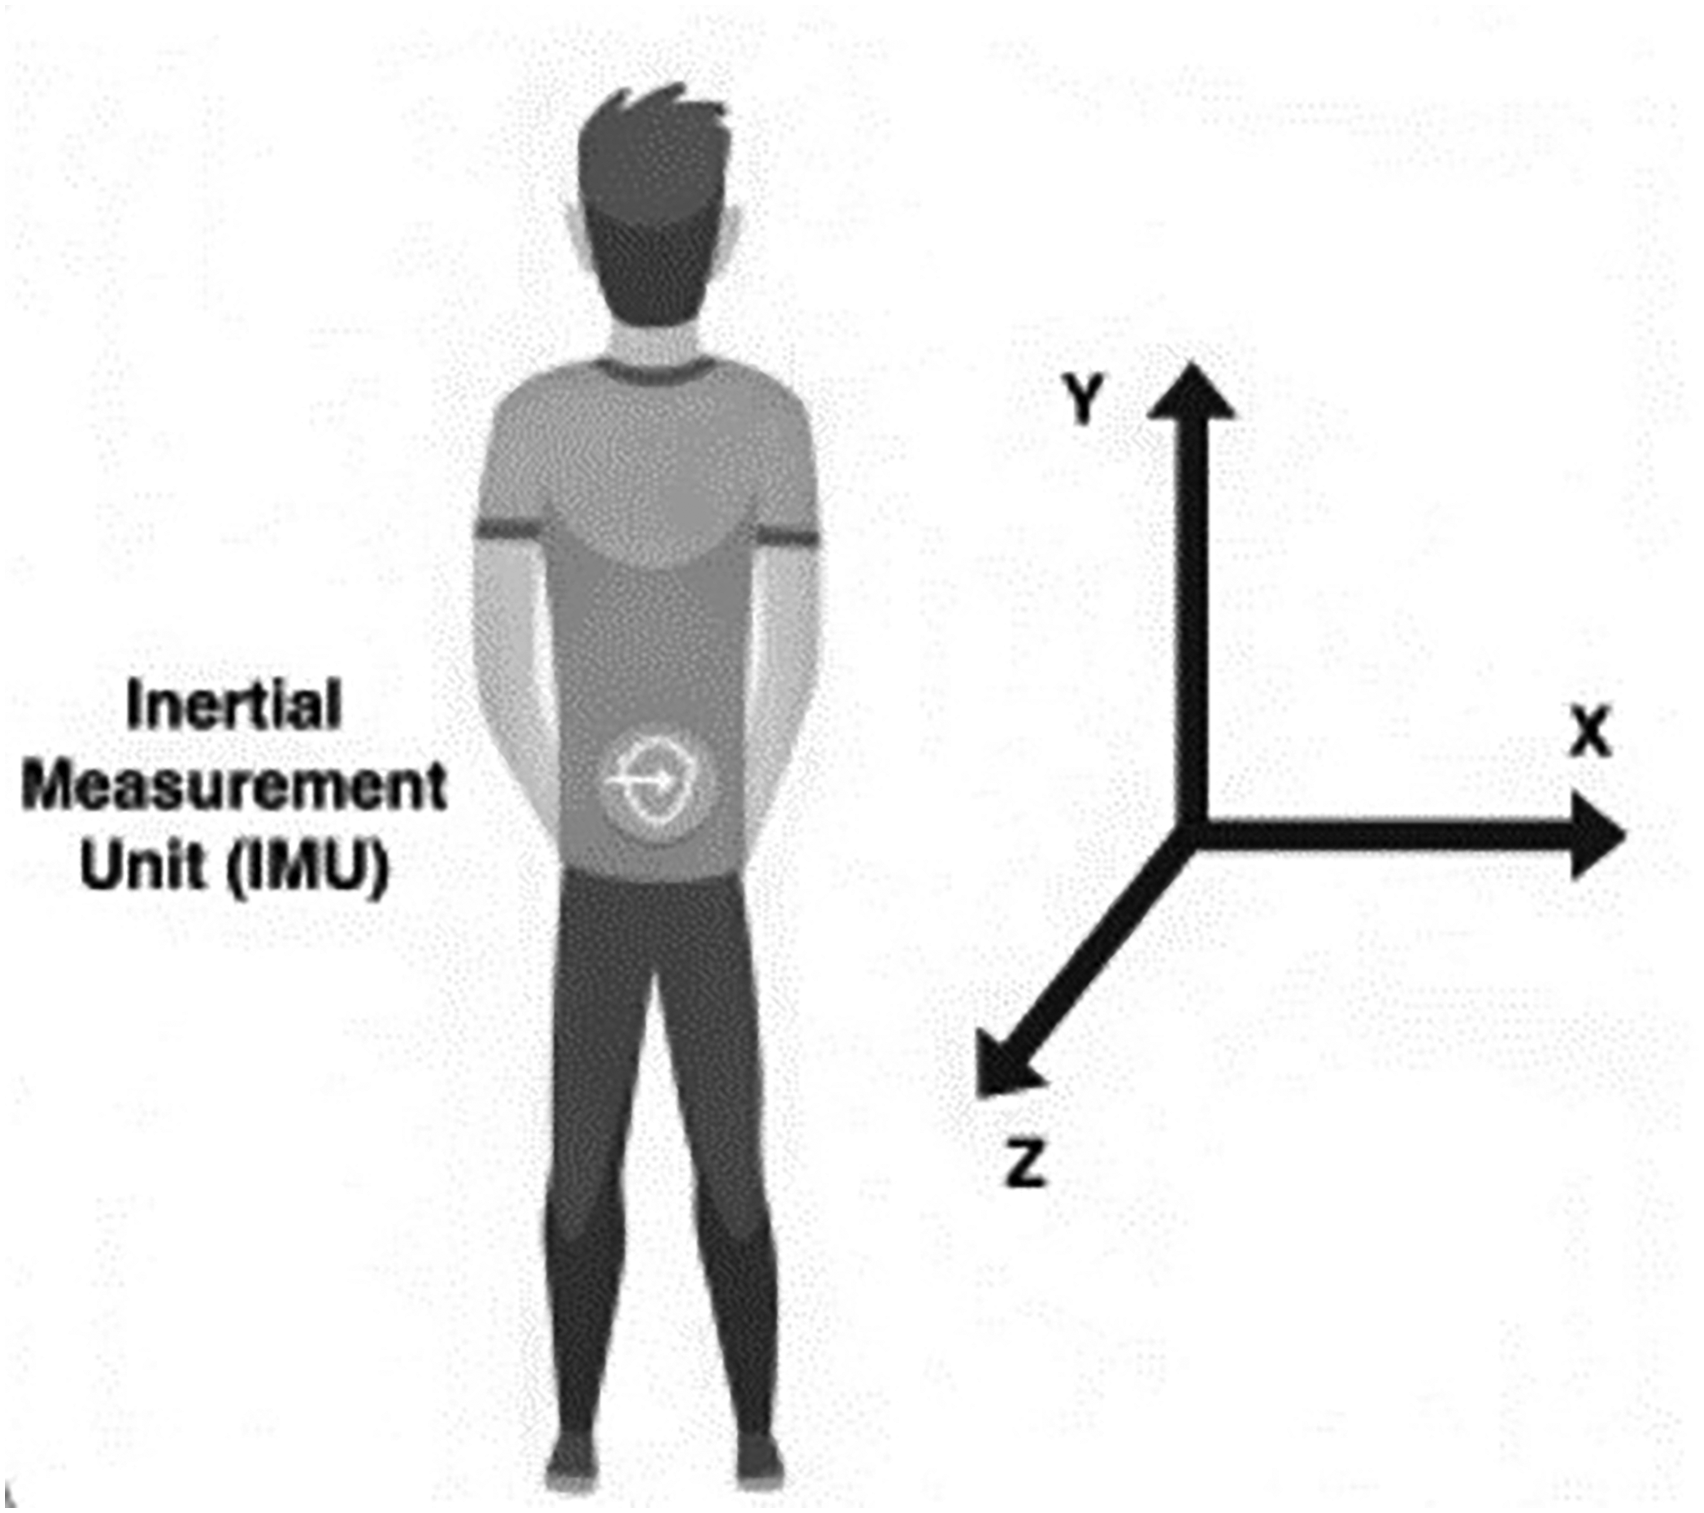
Sensor attachment on the player's body.
Data pre-processing and player's external load calculation
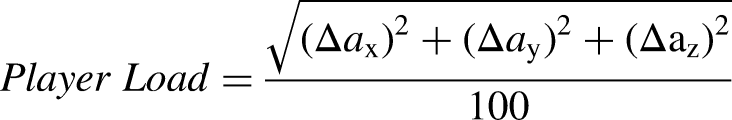
The collected accelerometer data from athletes during matches included samples (timestamps), and acceleration values in three axes (ax, ay, az), for each player. Subsequently, player load is computed for each player using the following equation:
Data analysis
The following statistical analyses were employed to achieve the objectives of the current study.
Clustering players’ external load
In the current investigation, we employed the k-means clustering technique to partition the external load data, collected via accelerometers during competition, into distinct, non-overlapping groups.24–26 The optimal number of clusters (k=3) was determined using a silhouette analysis as depicted in Figure 2. The silhouette analysis demonstrated a silhouette score of 0.85, indicating well-defined and cohesive clusters. The high silhouette score reflects strong separation between clusters and internal consistency within each cluster, providing valuable insights into the dynamics and characteristics of players with similar load patterns. Each data point was allotted to one group, ensuring comparability within groups while distinguishing between them. We used the Euclidean distance measure to identify group formation. This approach provides a clear categorization of variation of external loads for each player group, enabling a deeper exploration of the differences in external load measures among the players.
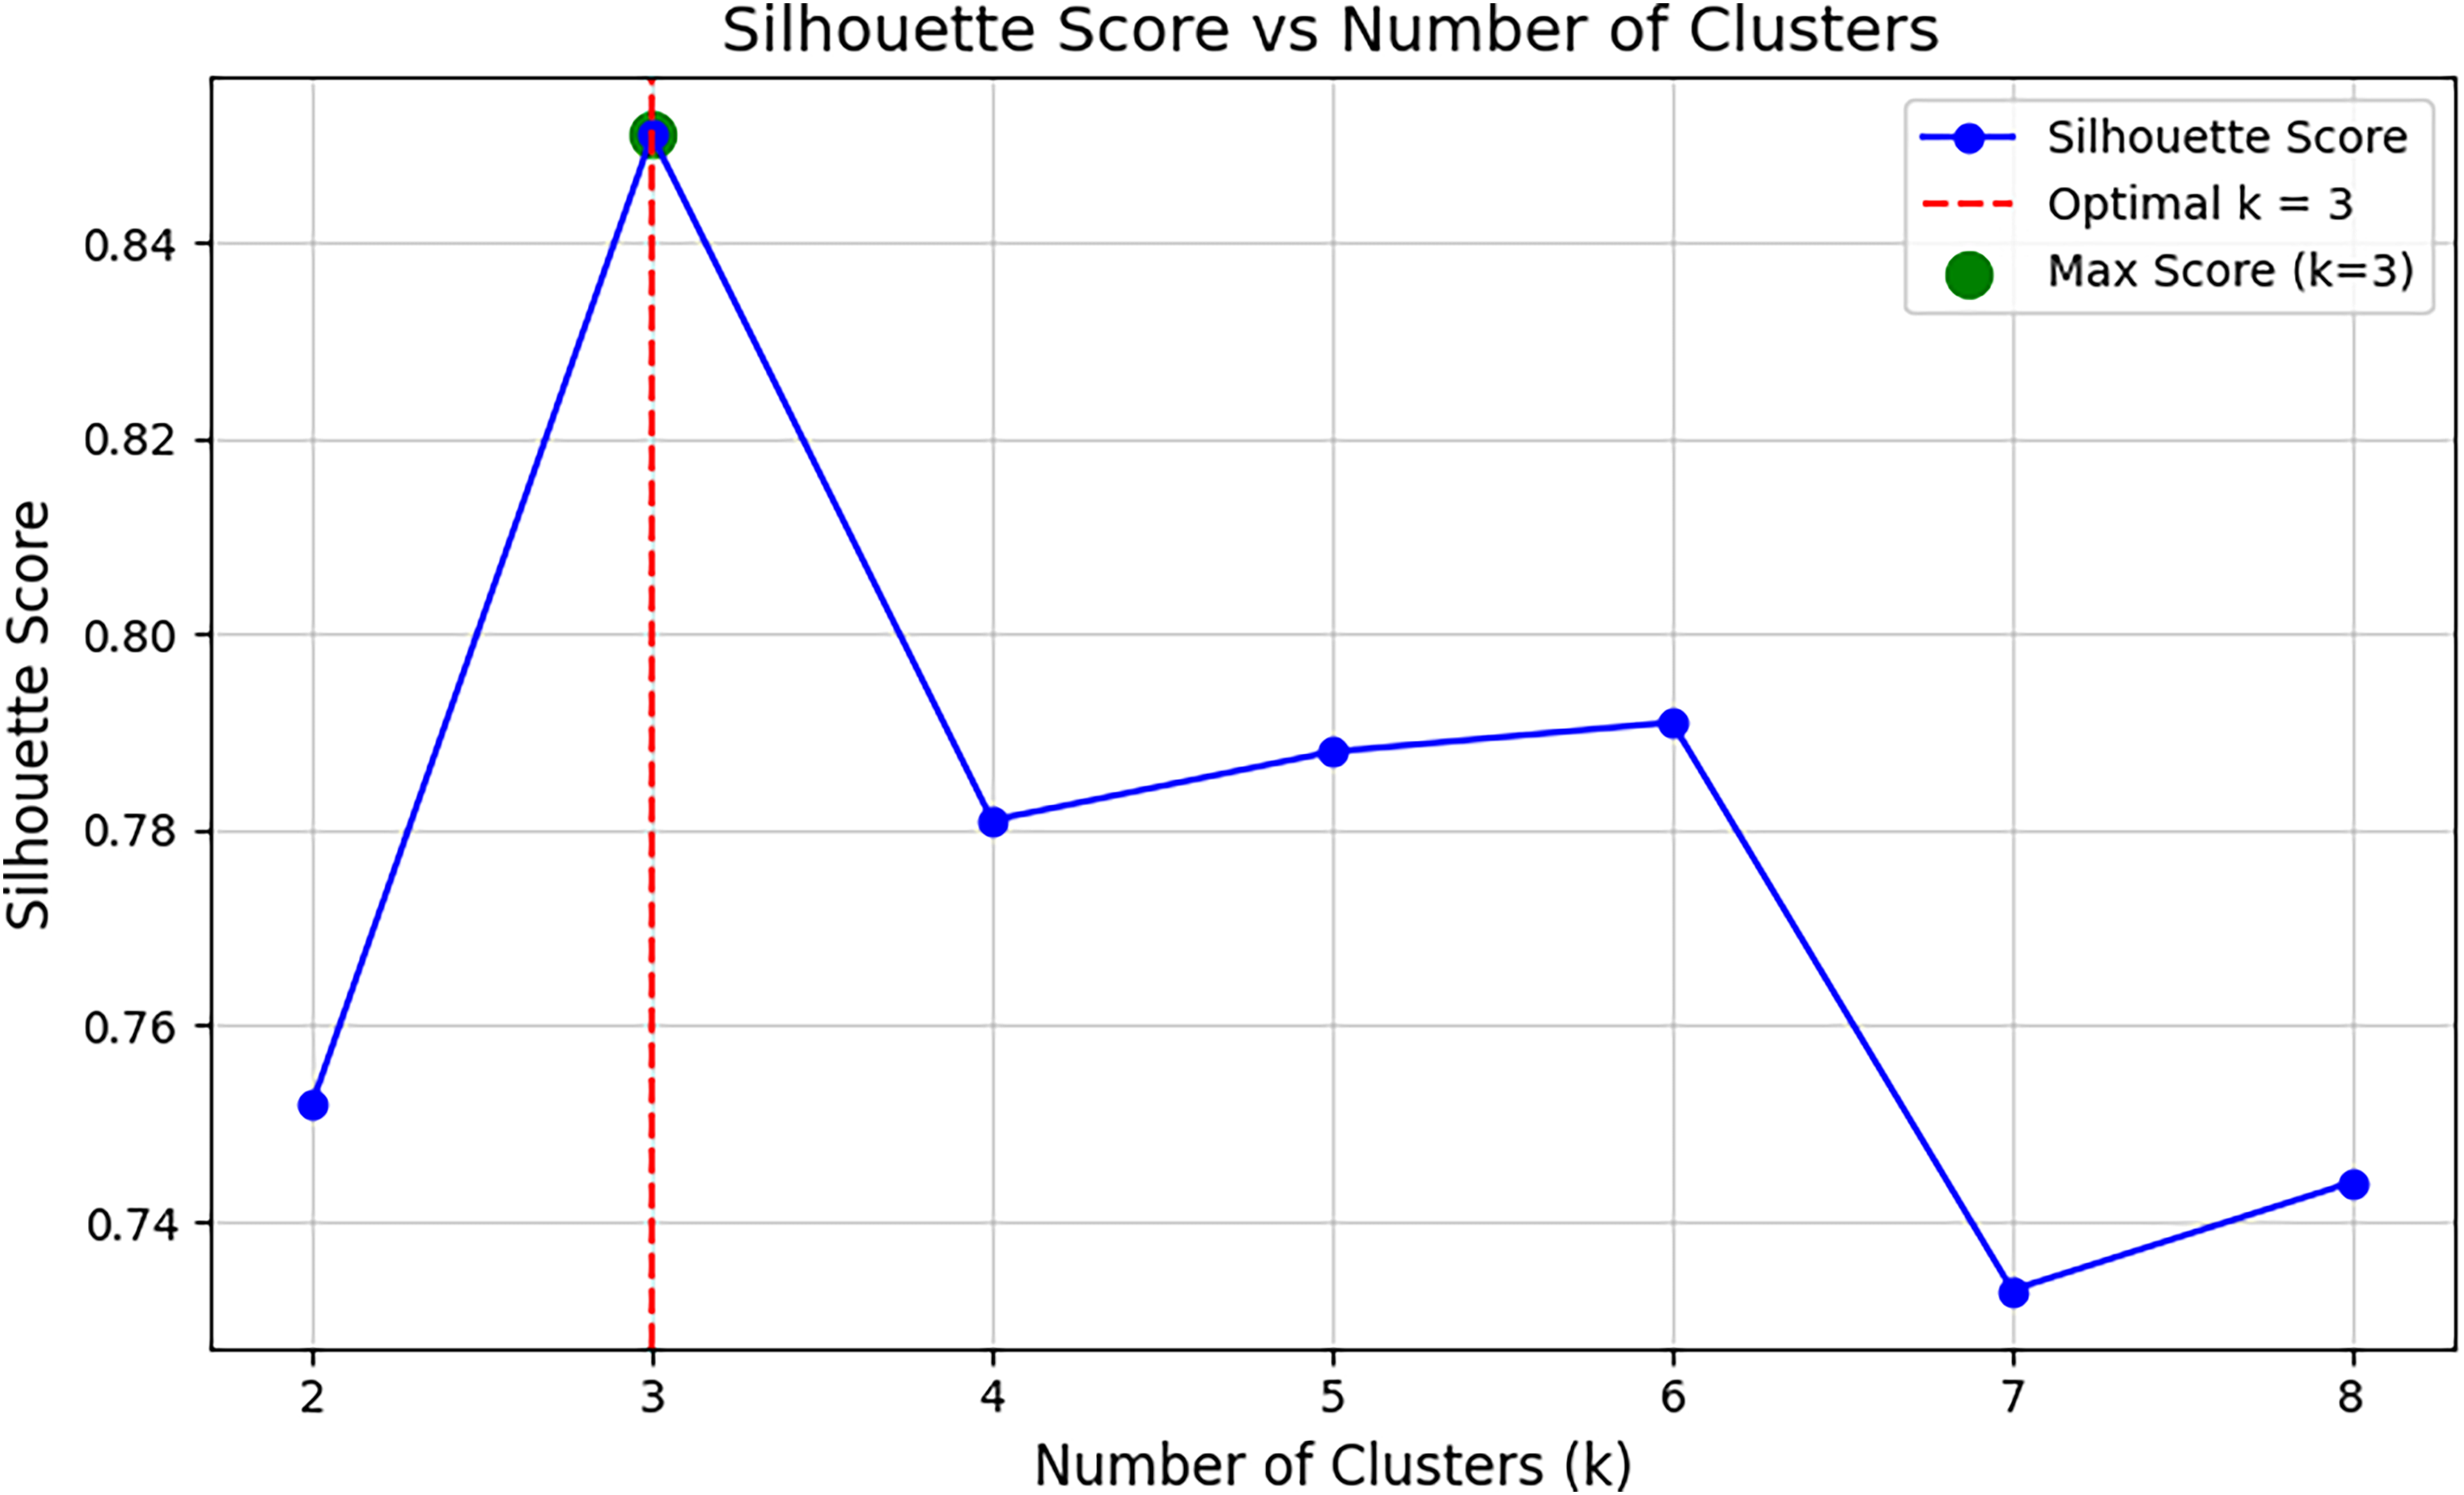
Silhouette plot for cluster identification.
Development of the regression tree model
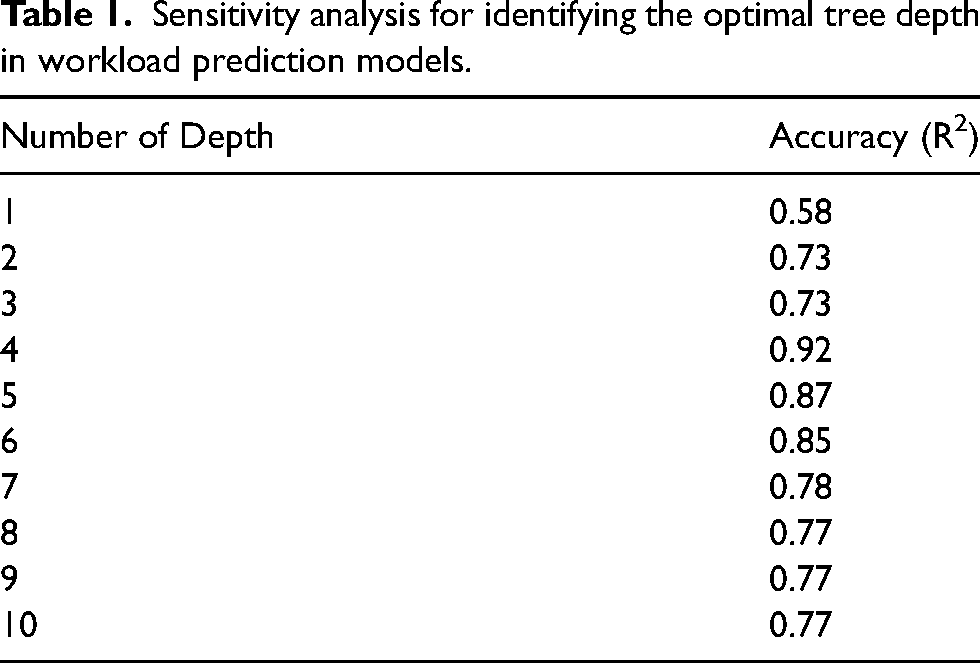
In this study, a regression tree model was developed to predict player load using athletes’ physical characteristics and external load data. Physical characteristics and load categories were the independent variables, while actual player load was the dependent variable. Decision Tree regression was chosen for its interpretability, ability to handle non-linear relationships, and suitability for feature interactions. This method provides clear rules for understanding load prediction factors and informing training strategies for badminton players. The model was trained on 70% of the data (48 observations), with 30% reserved for testing (25 observations). This split is a widely adopted practice in machine learning to ensure a balanced approach to training and testing, especially with relatively limited datasets.27–29 It is worth noting that that this split was carried out randomly within the model algorithm to avoid any bias and maintain the integrity of the analysis. The random split was performed separately within each category to ensure that all load categories were adequately represented in both the training and testing sets. The Gini impurity measure was used to determine the nodes of the Decision Tree, maximizing the homogeneity of the resulting groups. Sensitivity analysis on the depth of the tree (ranging from 1 to 10) showed the best performance at a depth of 4, balancing accuracy with interpretability as depicted in Table 1. Standard pre-processing techniques, including the use of a Standard Scaler, were applied to normalize variables, ensuring fair contributions from all variables.30,31
Model evaluation
The goodness of the Decision Tree (DT) model was evaluated using several metrics: R², mean absolute error (MAE), mean squared error (MSE), and root mean squared error (RMSE). The R² metric measures the proportion of variance in the dependent variable that is predictable from the independent variables, while MAE, MSE, and RMSE evaluate the model's prediction accuracy. Low values of MAE and RMSE indicate high model prediction ability. 32 Additionally, the model's effectiveness was assessed by analyzing the relationship between observed and predicted external load using the Pearson correlation coefficient. The average Pearson correlation was calculated across cross-validation runs to ensure robustness. The Pearson correlation coefficient (r) ranges from −1 (indicating a negative correlation) to +1 (indicating a positive correlation). Furthermore, Bland-Altman analysis was employed to evaluate the agreement between actual and predicted external load. 33 This analysis quantifies the bias (i.e., the mean difference between observed and predicted external load) and systematic error (i.e., the relationship between the mean and difference in predicted and observed external load) of the DT.
Moreover, a comparative analysis of predictive efficacy was conducted between the Decision Tree (DT) model and the Logistic Regression (LR) model to evaluate their relative performance in estimating players’ external loads based on the investigated parameters. The three clusters served as the outcome variables while the fitness and anthropometric parameters were used as the independent variables. This comparison aimed to determine the effectiveness of the DT model in capturing complex relationships and providing reasonable predictions.
Results
Figure 3 illustrates the distinct classes identified through k-means analysis based on players’ external load levels. Three well-defined load categories emerge: high (15 males, 9 females), moderate (25 males, 10 females), and low (10 males, 4 females). High-load players exhibit an average load score of 6.3, while moderate-load players accrue a mean score of 3.8. In contrast, the low load category records an average score of 0.4.
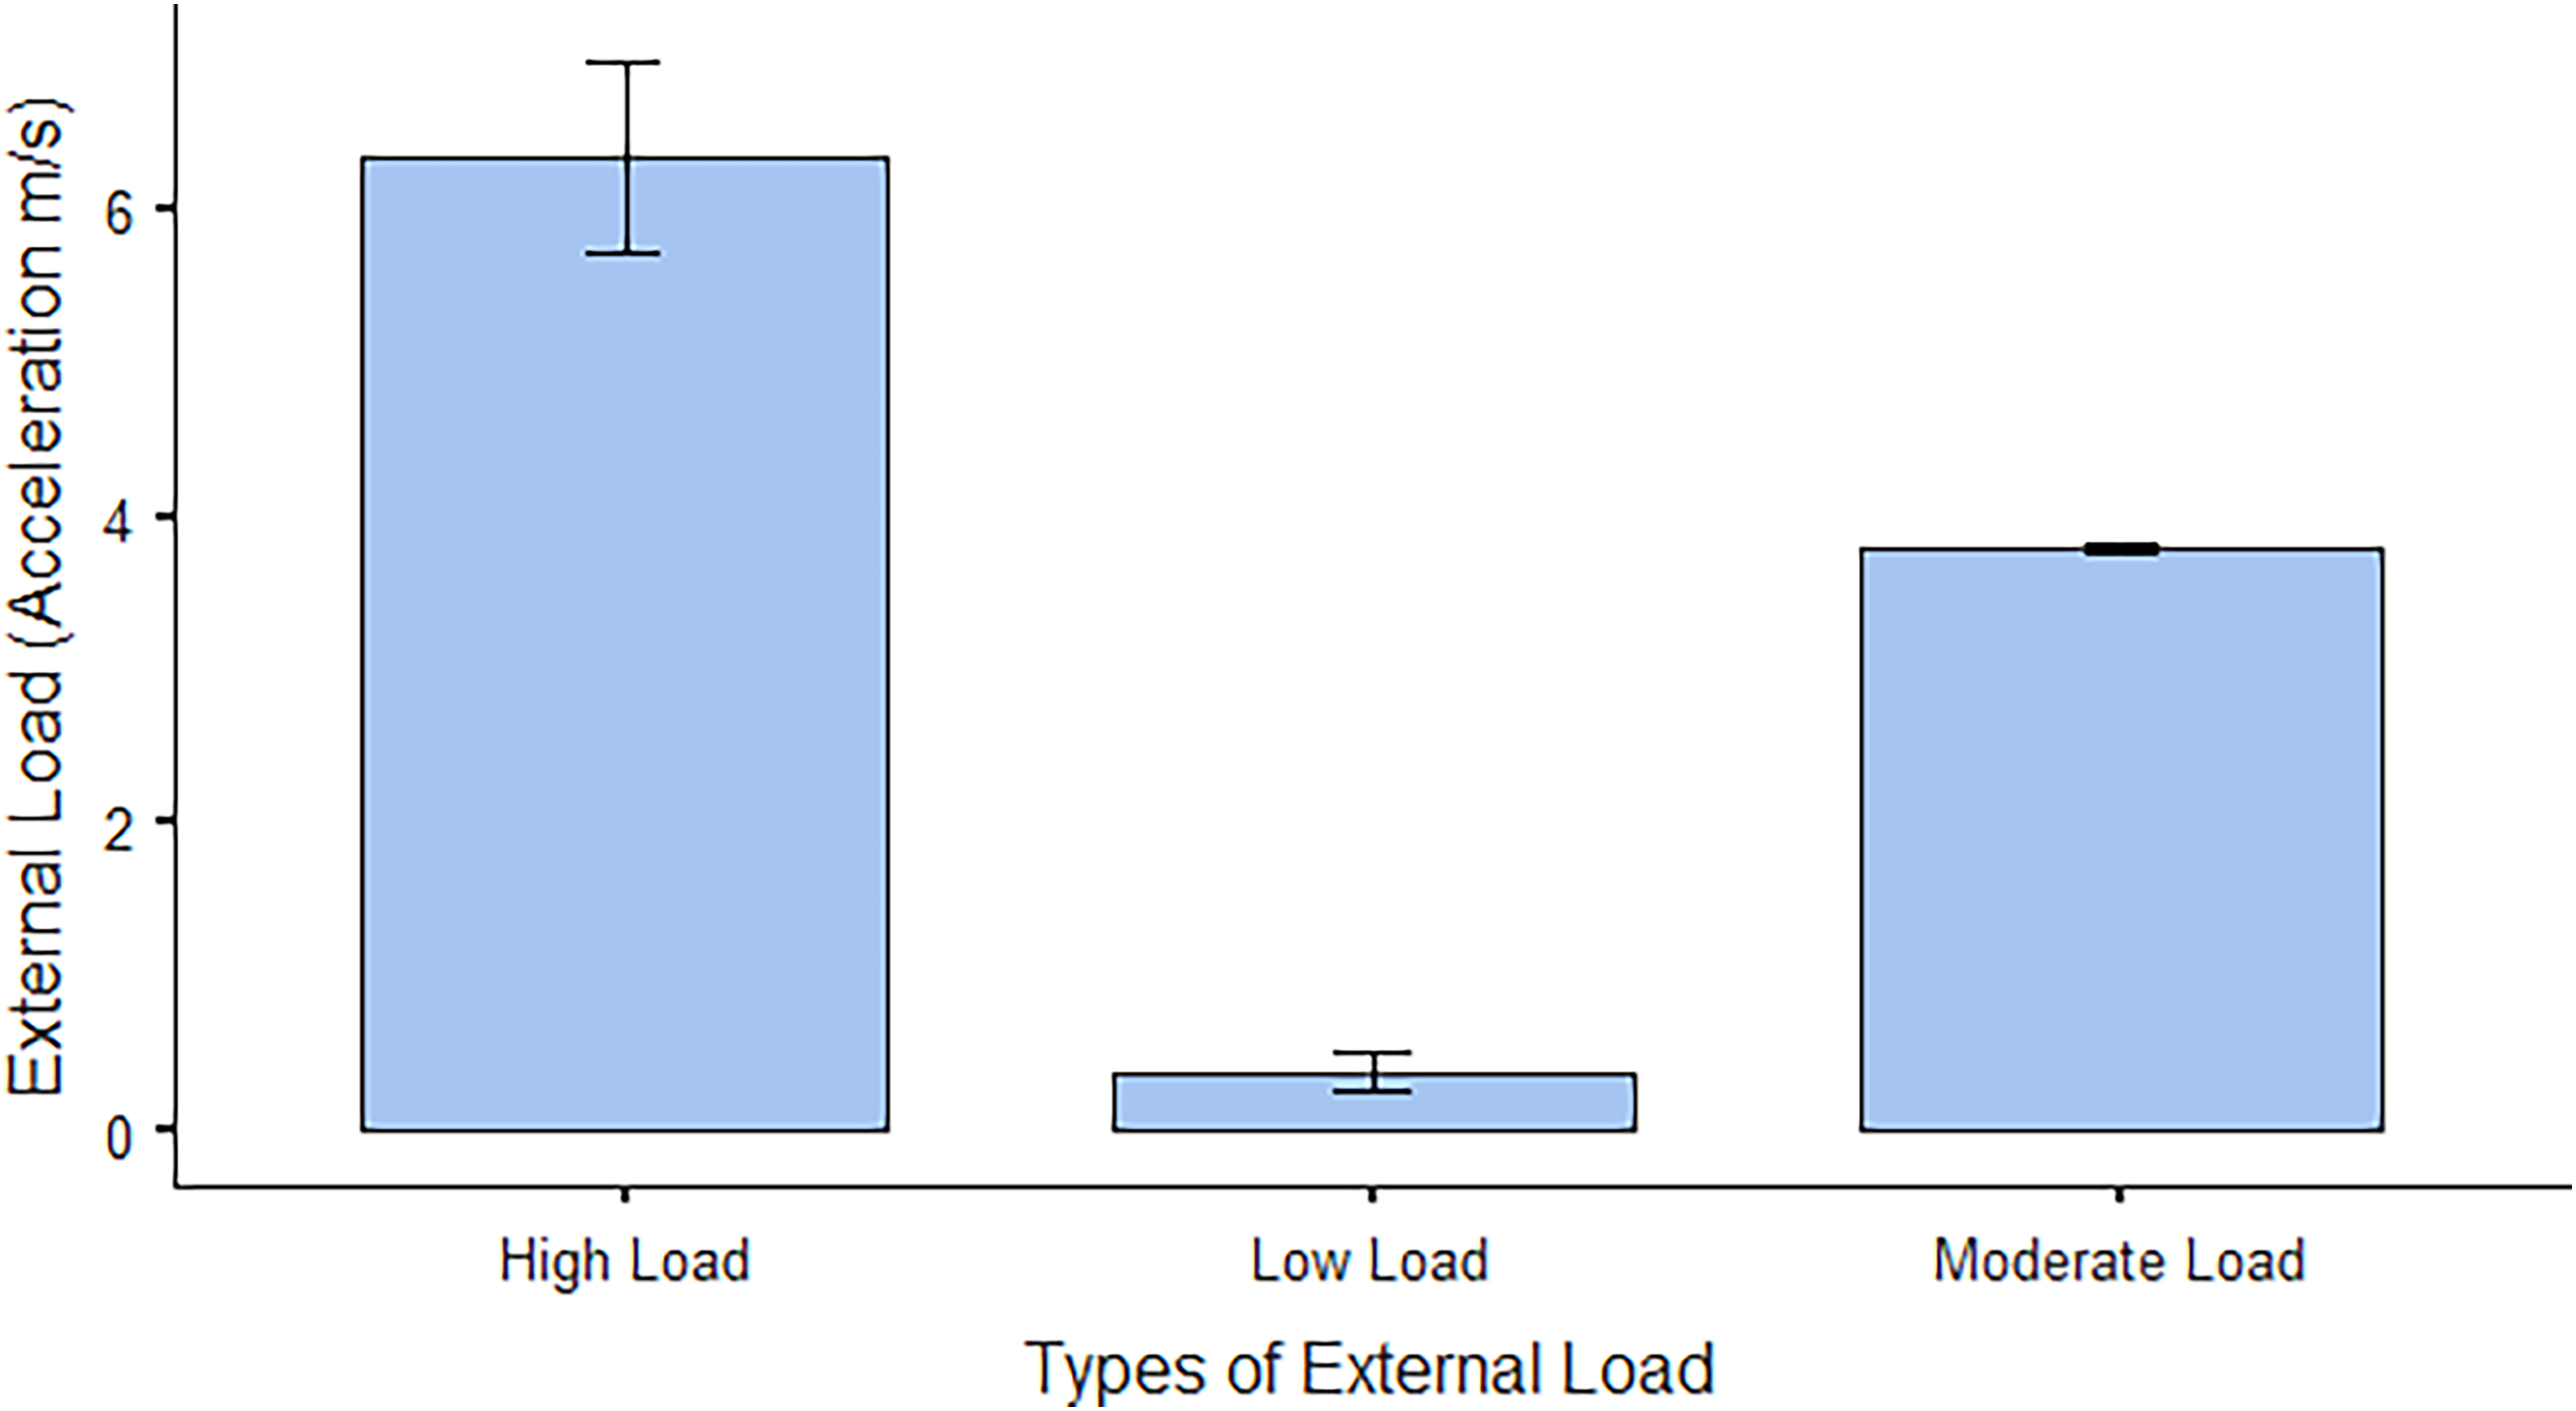
Box-plot of external loads categories identified through k-means clustering.
Table 2 reveals that only static balance, leg endurance, and flexibility showed significant differences across external load categories among players, while other variables exhibited no significant variability. While other variables such as age, height, and grip strength showed minor variations across clusters, these differences were not statistically significant and should be interpreted cautiously, as they may reflect sample randomness rather than meaningful trends.
Sensitivity analysis for identifying the optimal tree depth in workload prediction models.
Normative profile of the players based on investigated parameters and external load category.
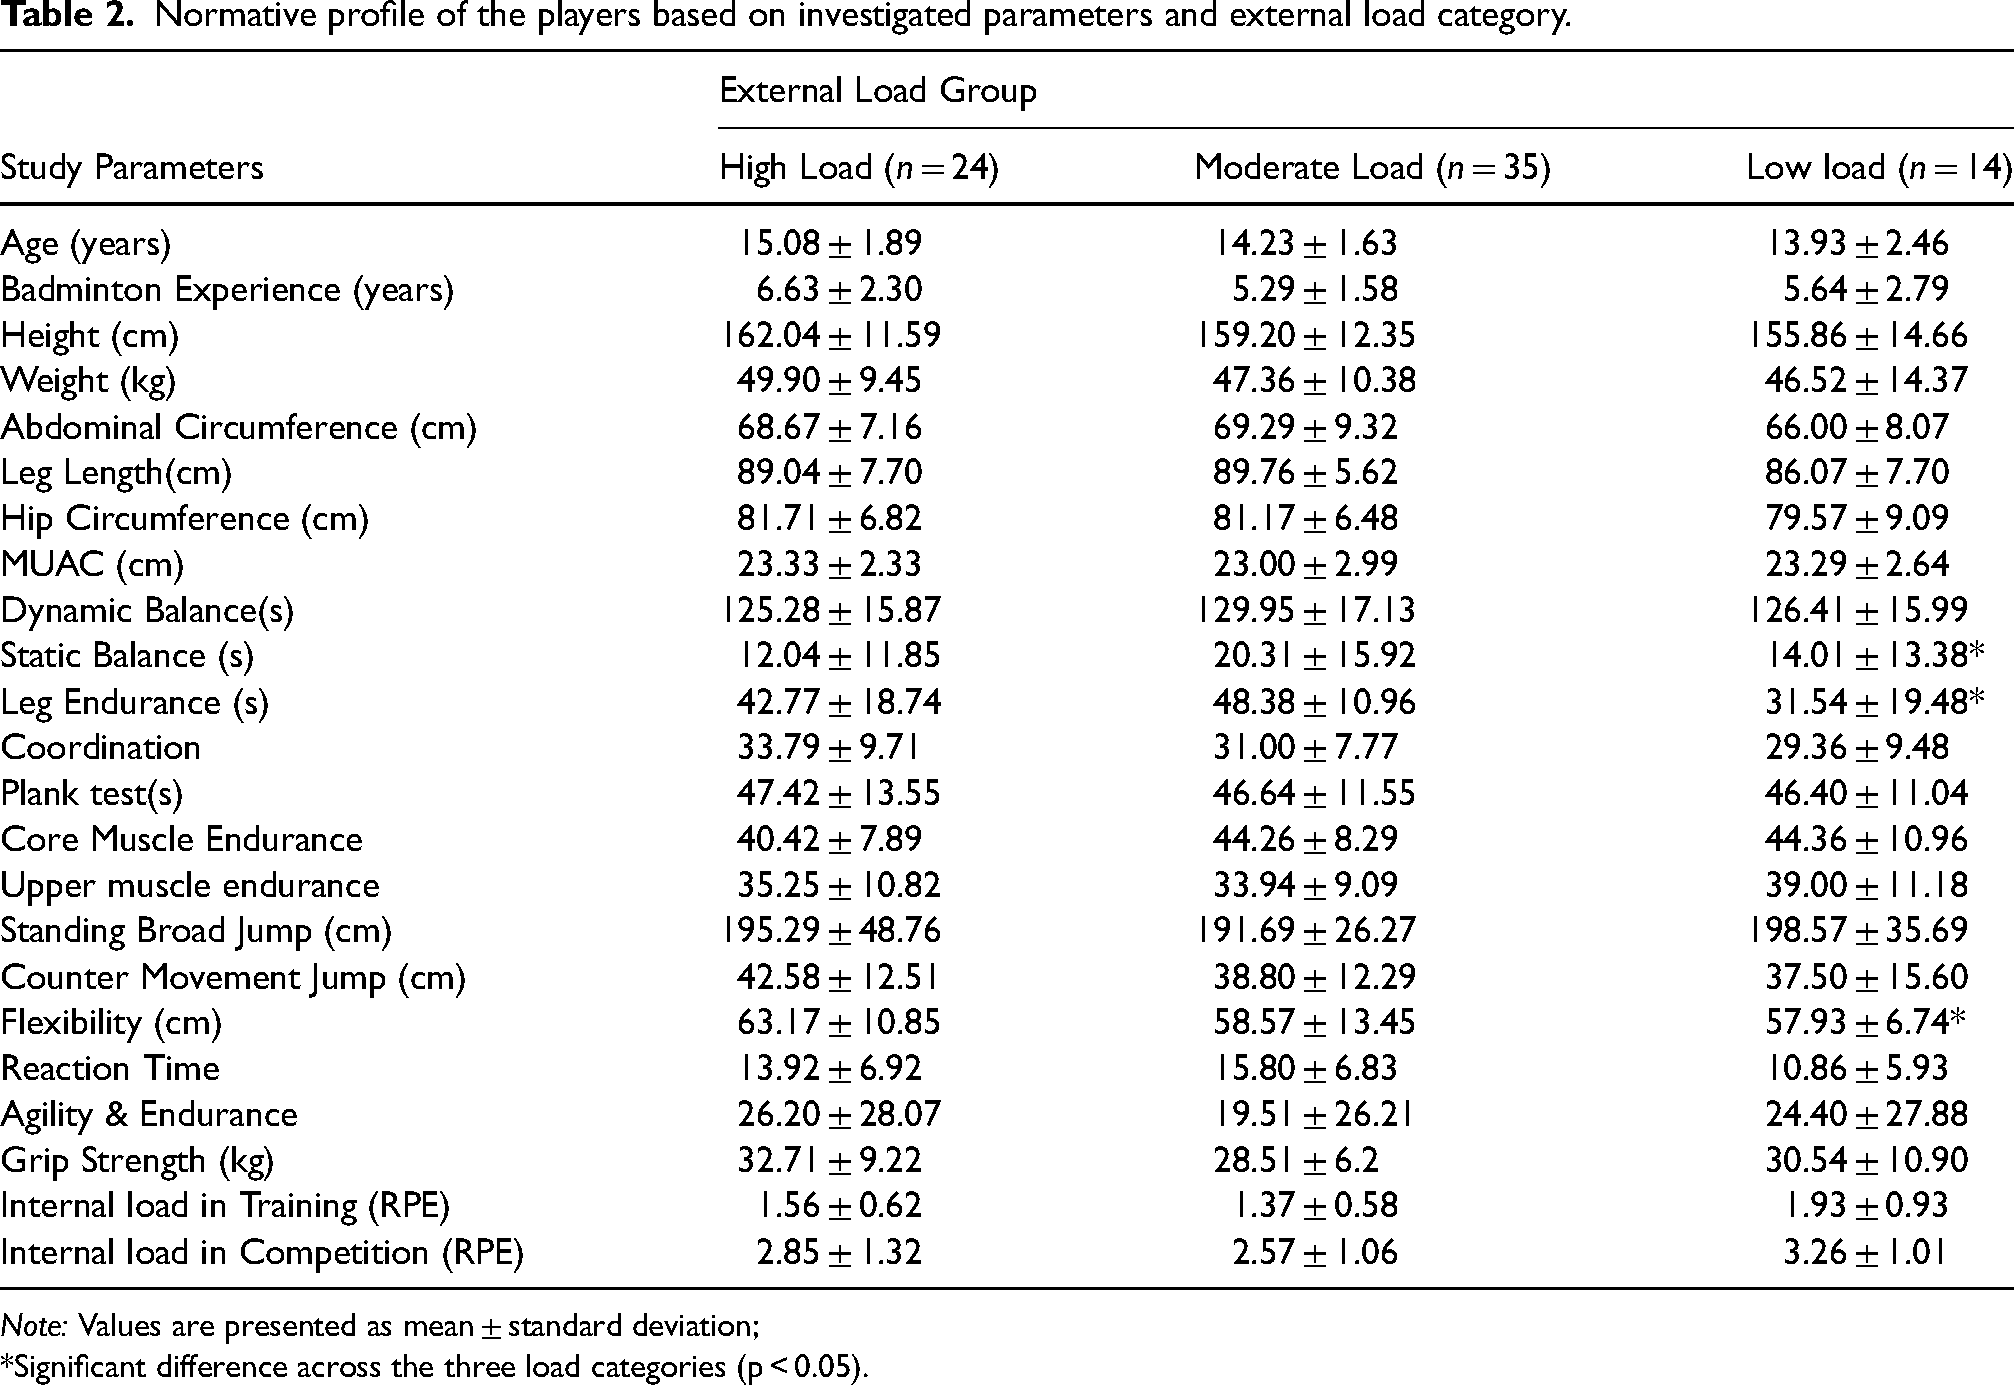
Note: Values are presented as mean ± standard deviation;
*Significant difference across the three load categories (p < 0.05).
Table 3 illustrates the comparative predictive efficacy of the Decision Tree (DT) and Logistic Regression (LR) models in estimating players’ external loads on the test dataset based on the investigated parameters. The model was calculated as the percentage of correct predictions across all categories in load prediction i.e., (high, moderate, and low loads) on the test data. It could be observed that the DT model outperformed the LR in all the performance metrics evaluated. Notably, the DT model demonstrated a mean accuracy score of 92%, indicating a strong ability to predict different load categories. The DT model demonstrated superior predictive performance compared to the Logistic Regression (LR) model, as indicated by the Area Under the ROC Curve (AUC). The DT model achieved an AUC of 0.97, reflecting excellent discrimination capability, while the LR model exhibited a considerably lower AUC of 0.55, indicating poor performance in distinguishing between the external load categories. Both precision and recall scores for the DT mode were 95% and 96%, showing that the model correctly predicted over 95% of positive cases and accurately identified 96% of actual positive classes while Matthew's Correlation Coefficient (MCC) was 0.92%, reflecting strong predictive power. For multinomial Logistic Regression, the probability of each class k is given by:
Comparative analysis of performance metrics of the Decision Tree and Logistic Regression models on the test dataset.
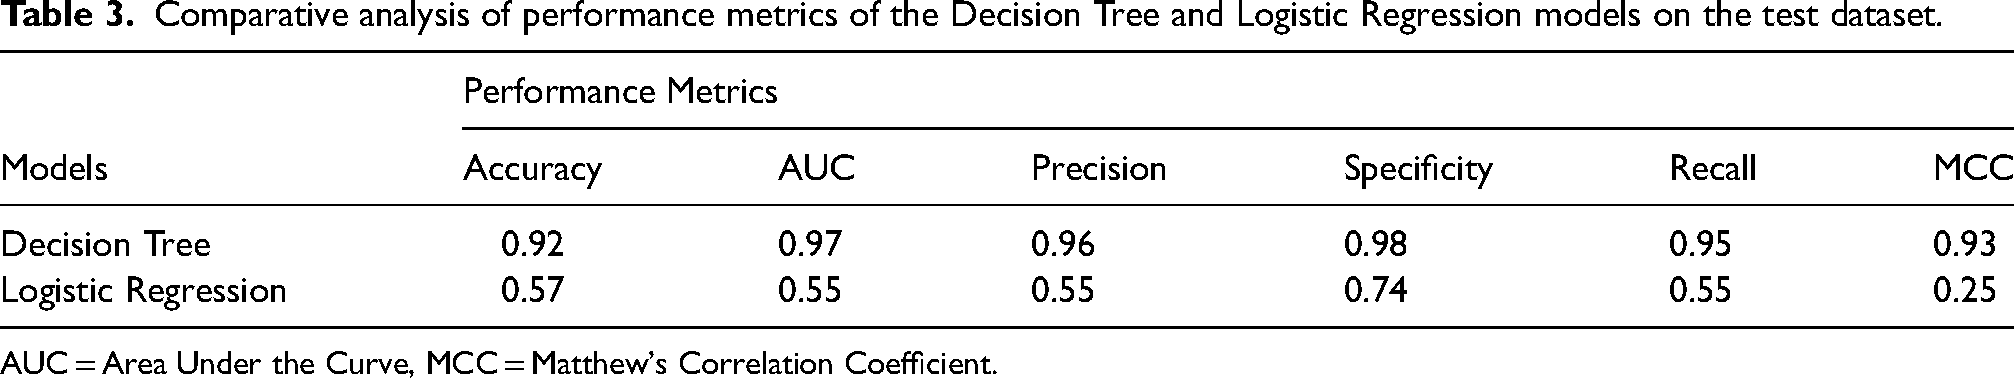
AUC = Area Under the Curve, MCC = Matthew's Correlation Coefficient.
Model coefficients of the multinomial Logistic Regression model for each class.
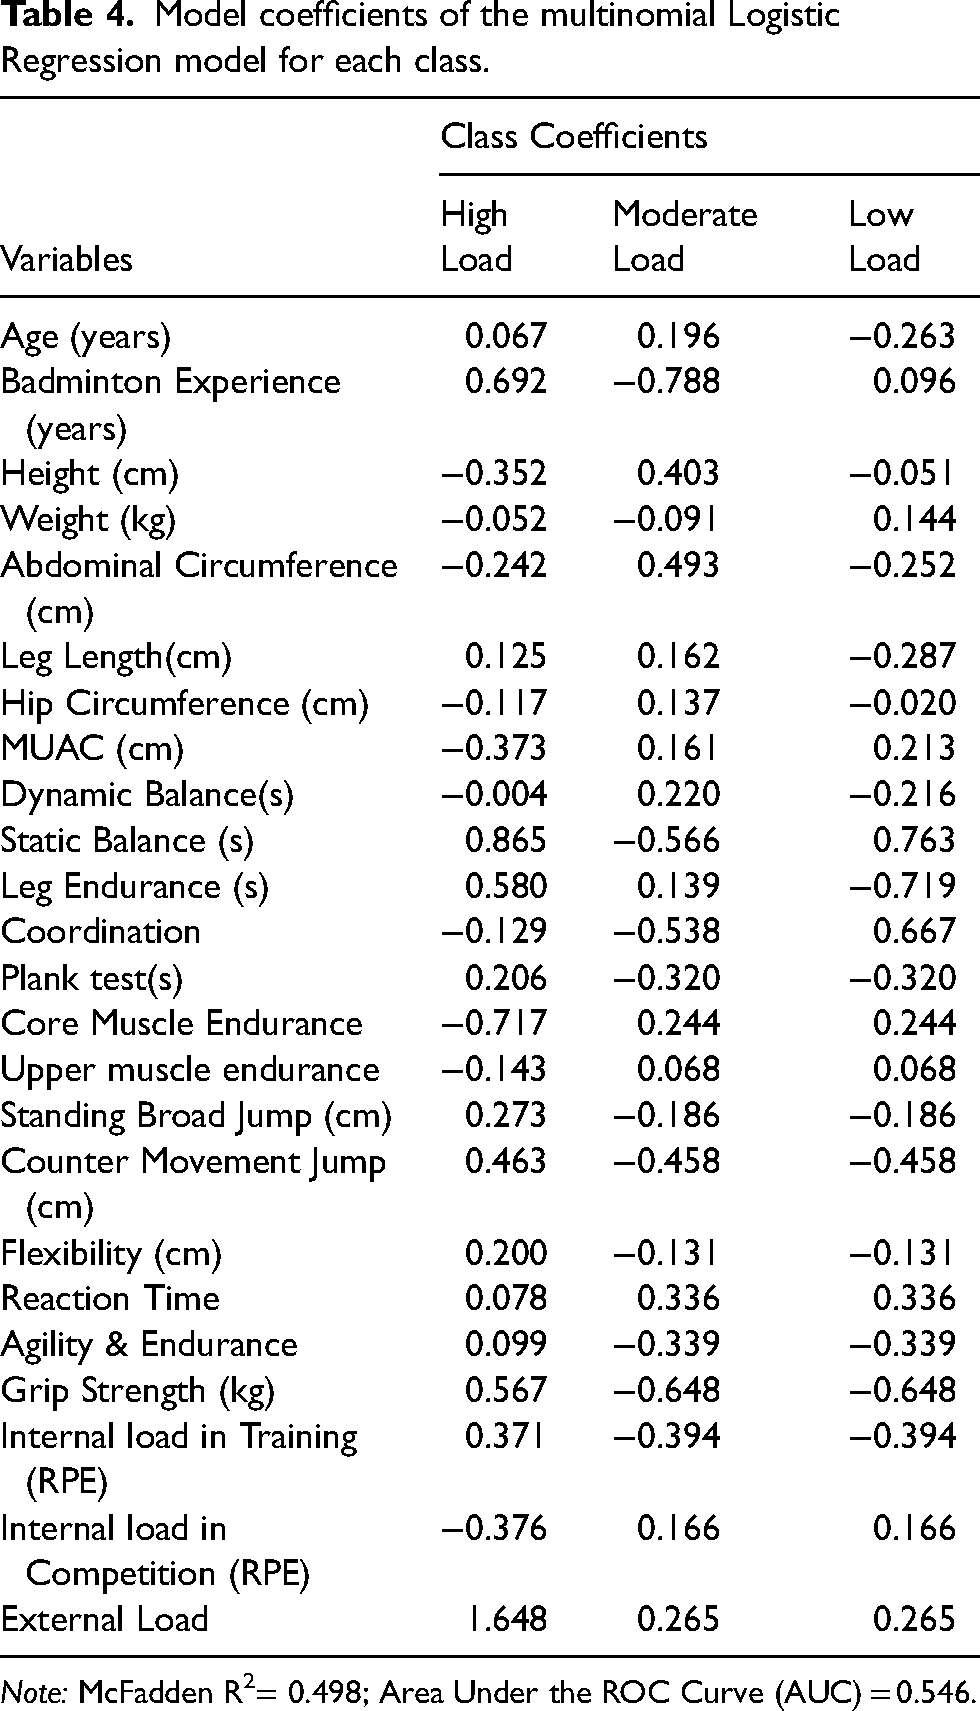
Note: McFadden R2= 0.498; Area Under the ROC Curve (AUC) = 0.546.
It is worth highlighting that there were 7 players each in the high and low loads categories while the moderate loads included 8 players. Overall, these findings suggest that the DT model performed well in predicting players’ external load levels. Moreover, the low values of MAE, MSE, and RMSE depicted in Figure 4 accentuate the significance of these parameters in explaining players’ external load. Moreover, the actual load values of the test data set closely align with the predicted values, exhibiting a correlation coefficient of 0.96.
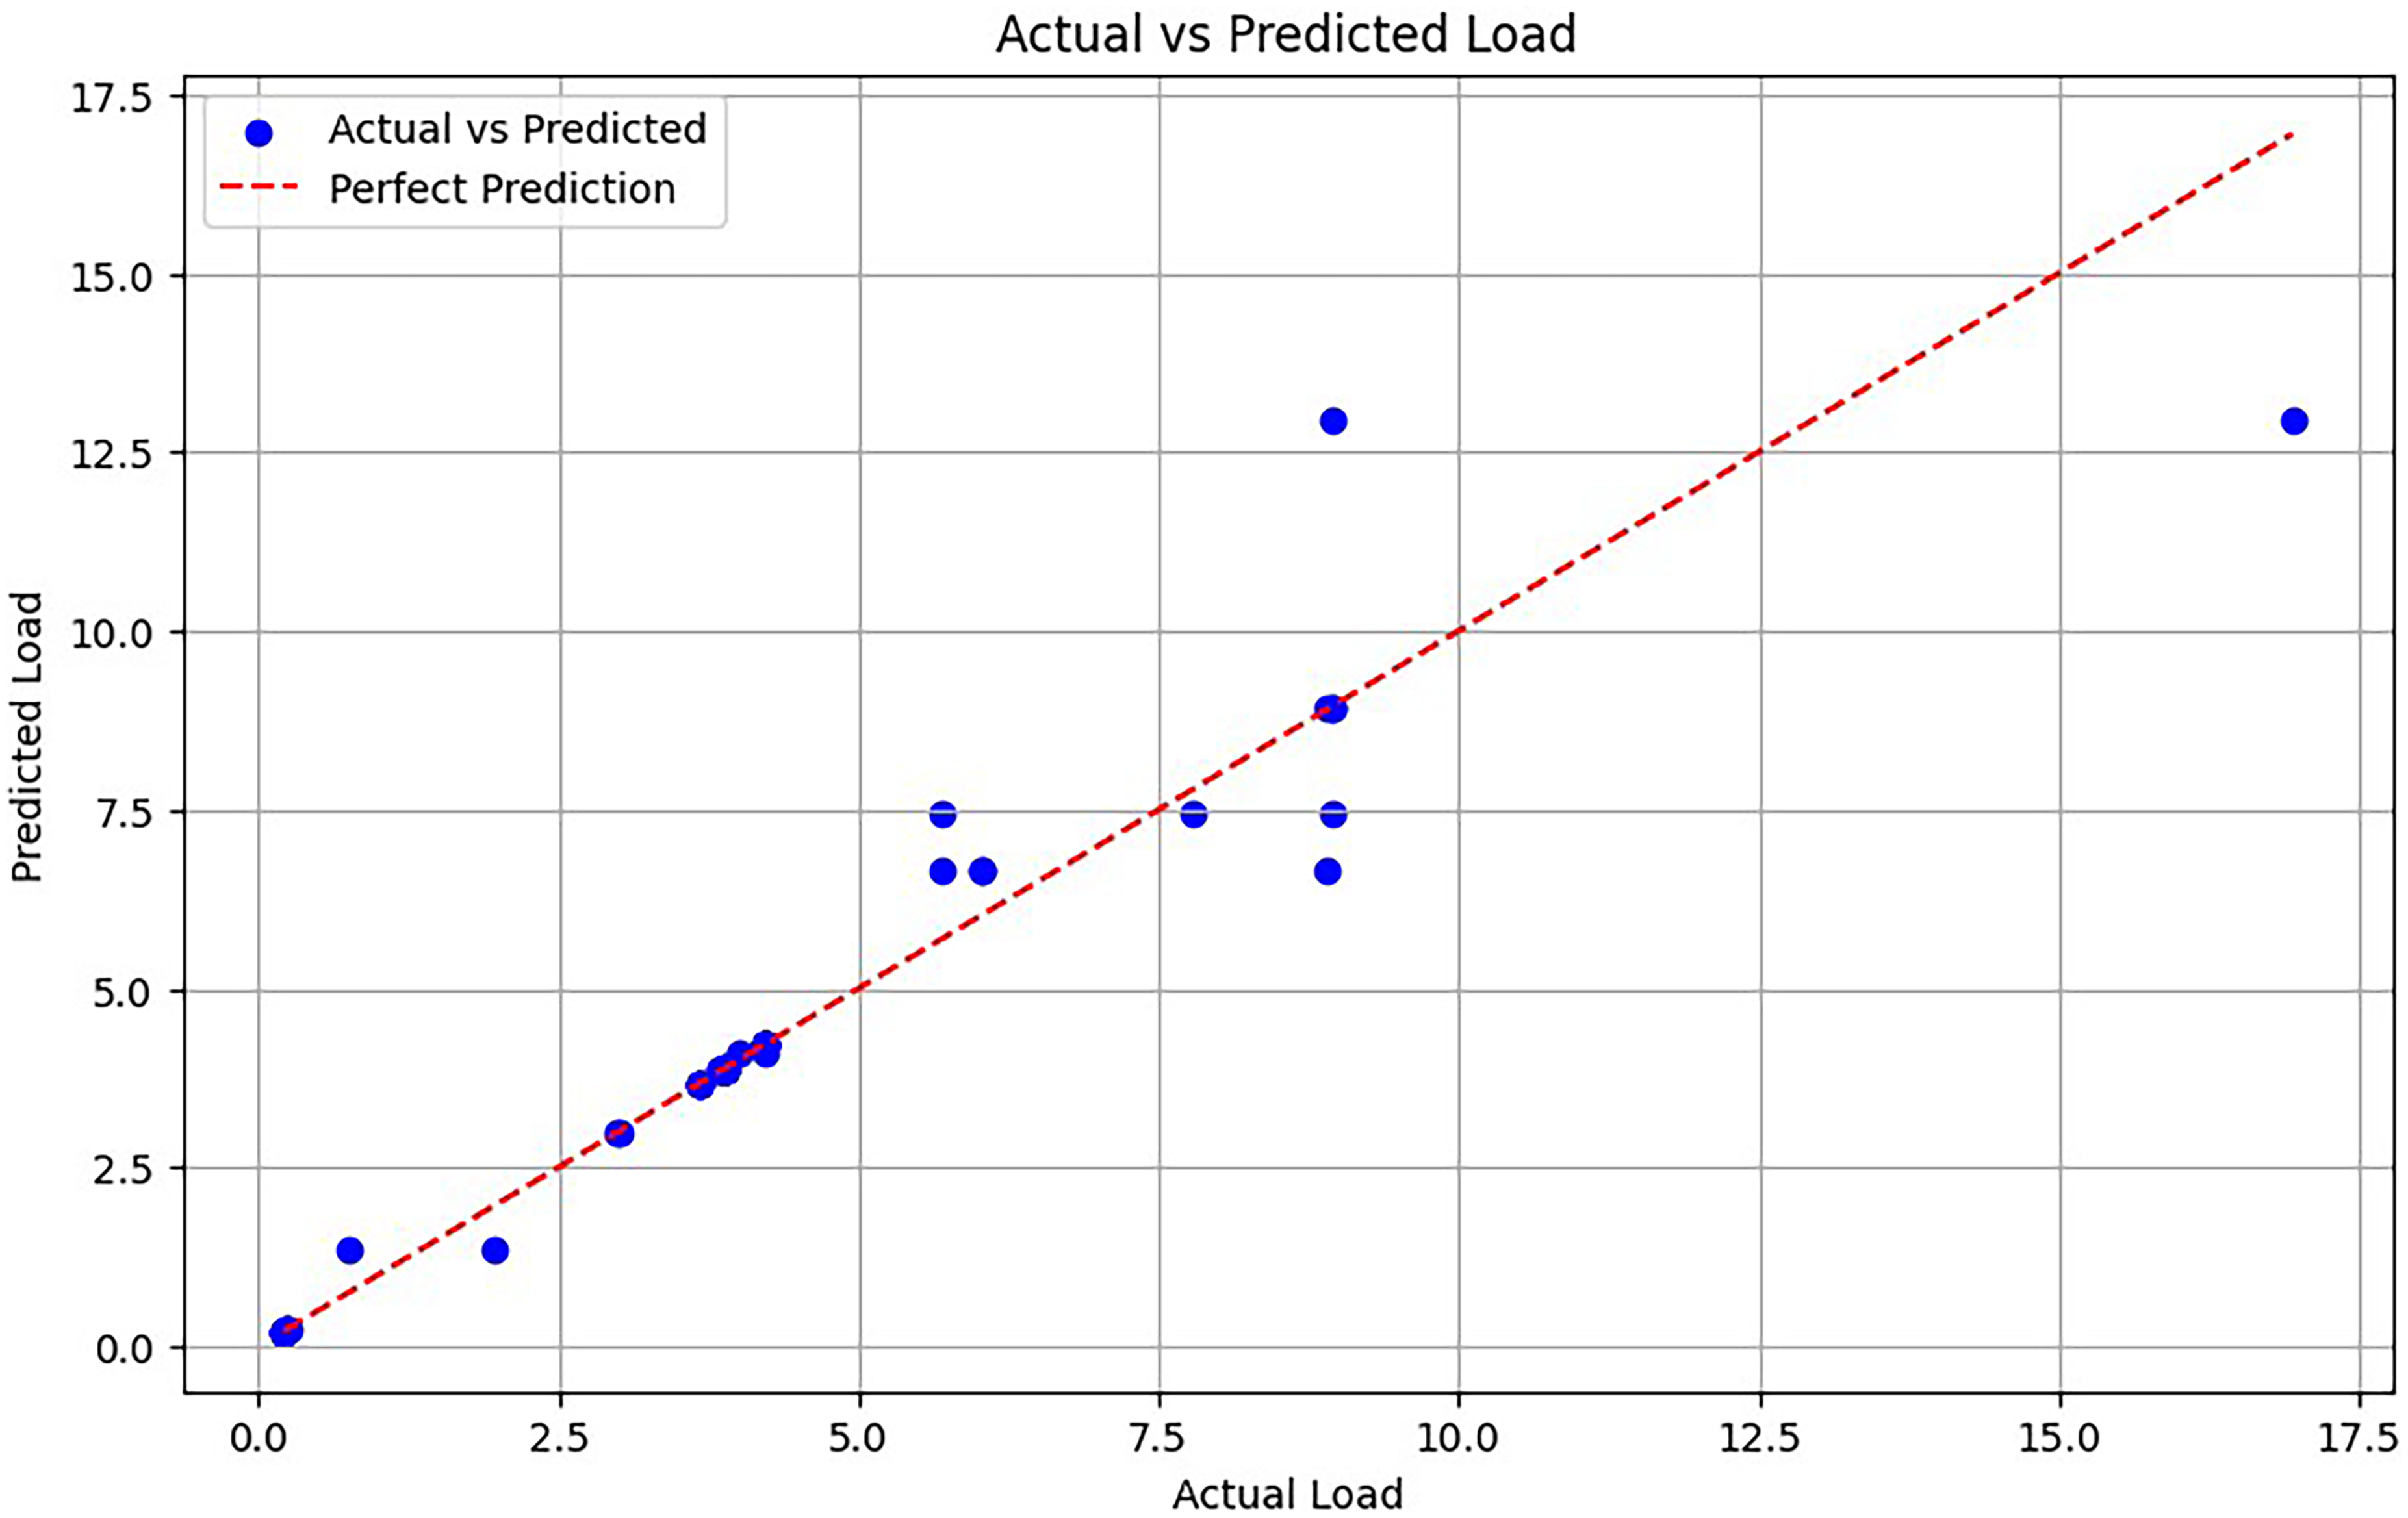
Actual versus predicted player's external load plot on test dataset.
Figure 5 shows the Bland-Altman analysis plot, illustrating the relationship between the mean and the difference between actual and predicted external load values for players. The plot displays upper and lower limits of agreement. Notably, the shaded area indicates a minimal bias, ranging from −0.185 to +0.185, affirming the model's integrity in this study.
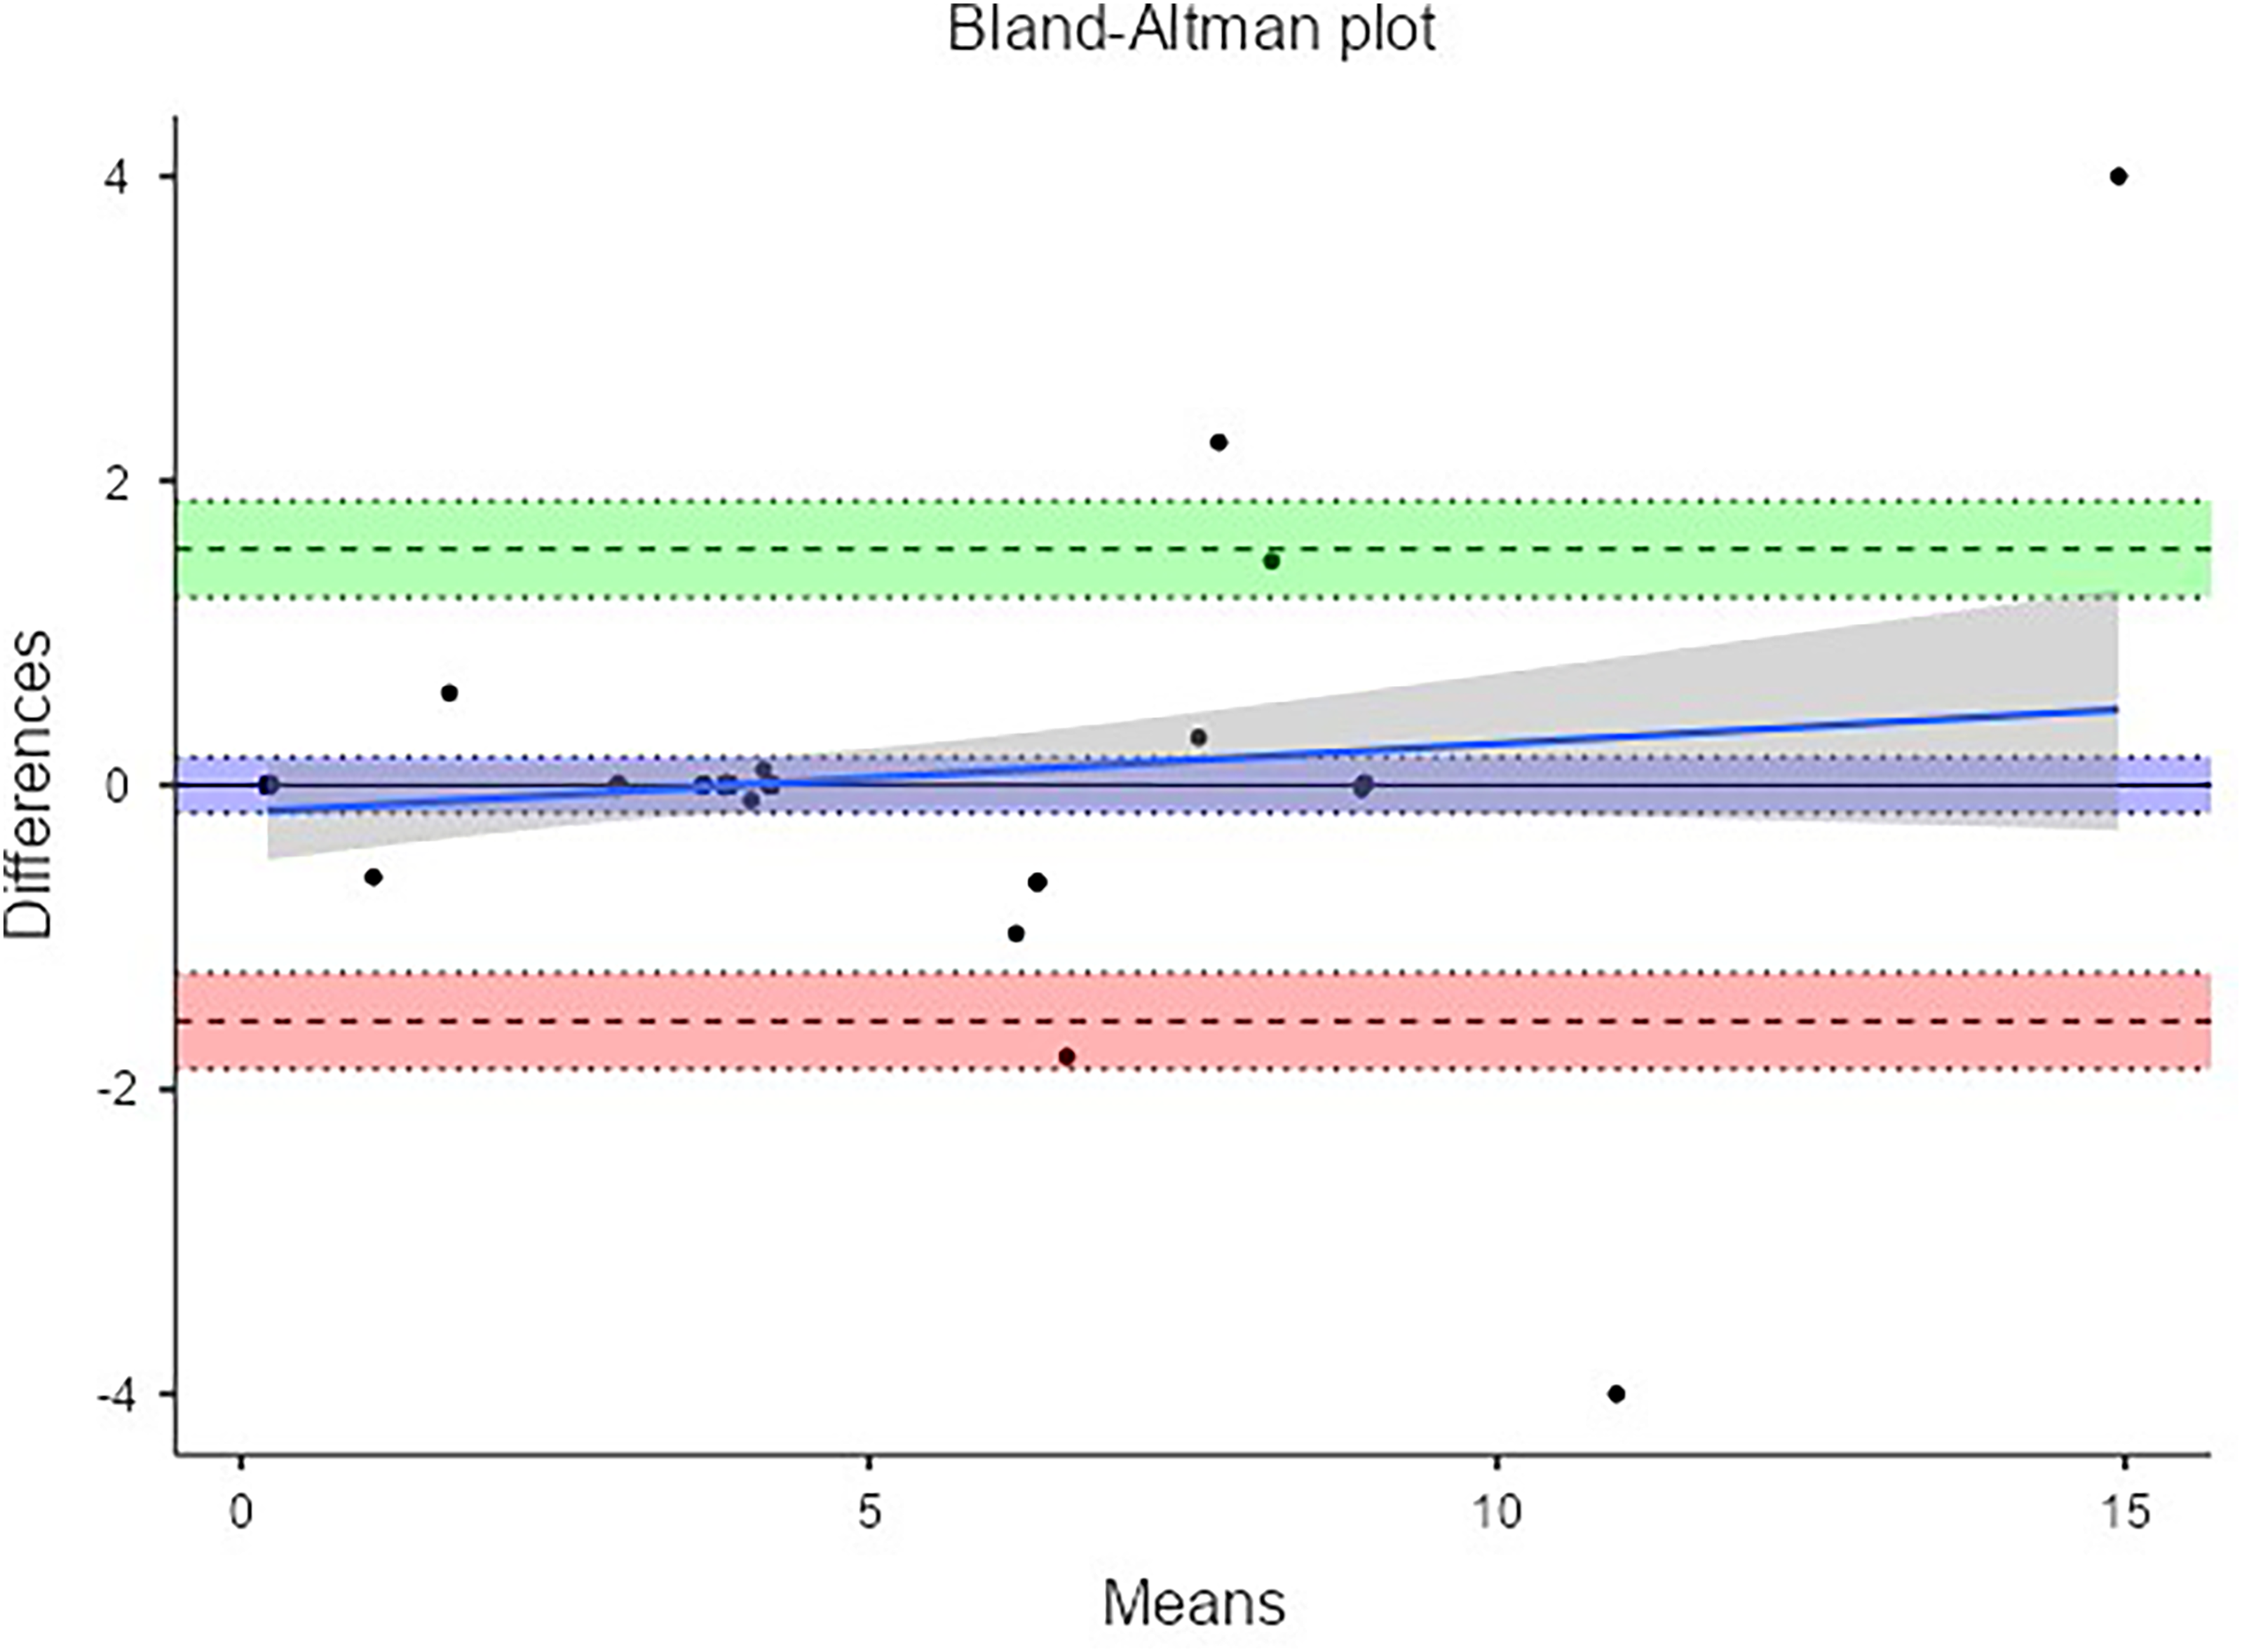
Bland-Altman agreement analysis between actual and predicted loads.
Figure 6 illustrates the Decision Tree model used to prescribe external loads for players based on various fitness and anthropometric parameters. The model classifies players into high, moderate, and low load categories. Starting with 73 instances and an average load of 4.0 ± 7.3, the root node splits based on “Types of External Load.” High-load players (24 instances) are distinguished by shuttle run times (≤ 59.64 s), further split by height, reaction time, and RPE during training, resulting in average loads between 4.8 and 8.9. For low-load players (14 instances), splits occur at waist circumference (≤ 77 cm), followed by standing broad jump and age, with an average load of 0.2. Moderate-load players (35 instances) are categorized by push-up performance (≤ 42 max/m), further divided by age, badminton experience, vertical jump, plank test, and shuttle run, resulting in average loads between 3.4 and 3.9. These splits highlight the importance of specific physical and anthropometric characteristics in determining appropriate load levels, offering insights into how these factors correlate with prescribed external loads.
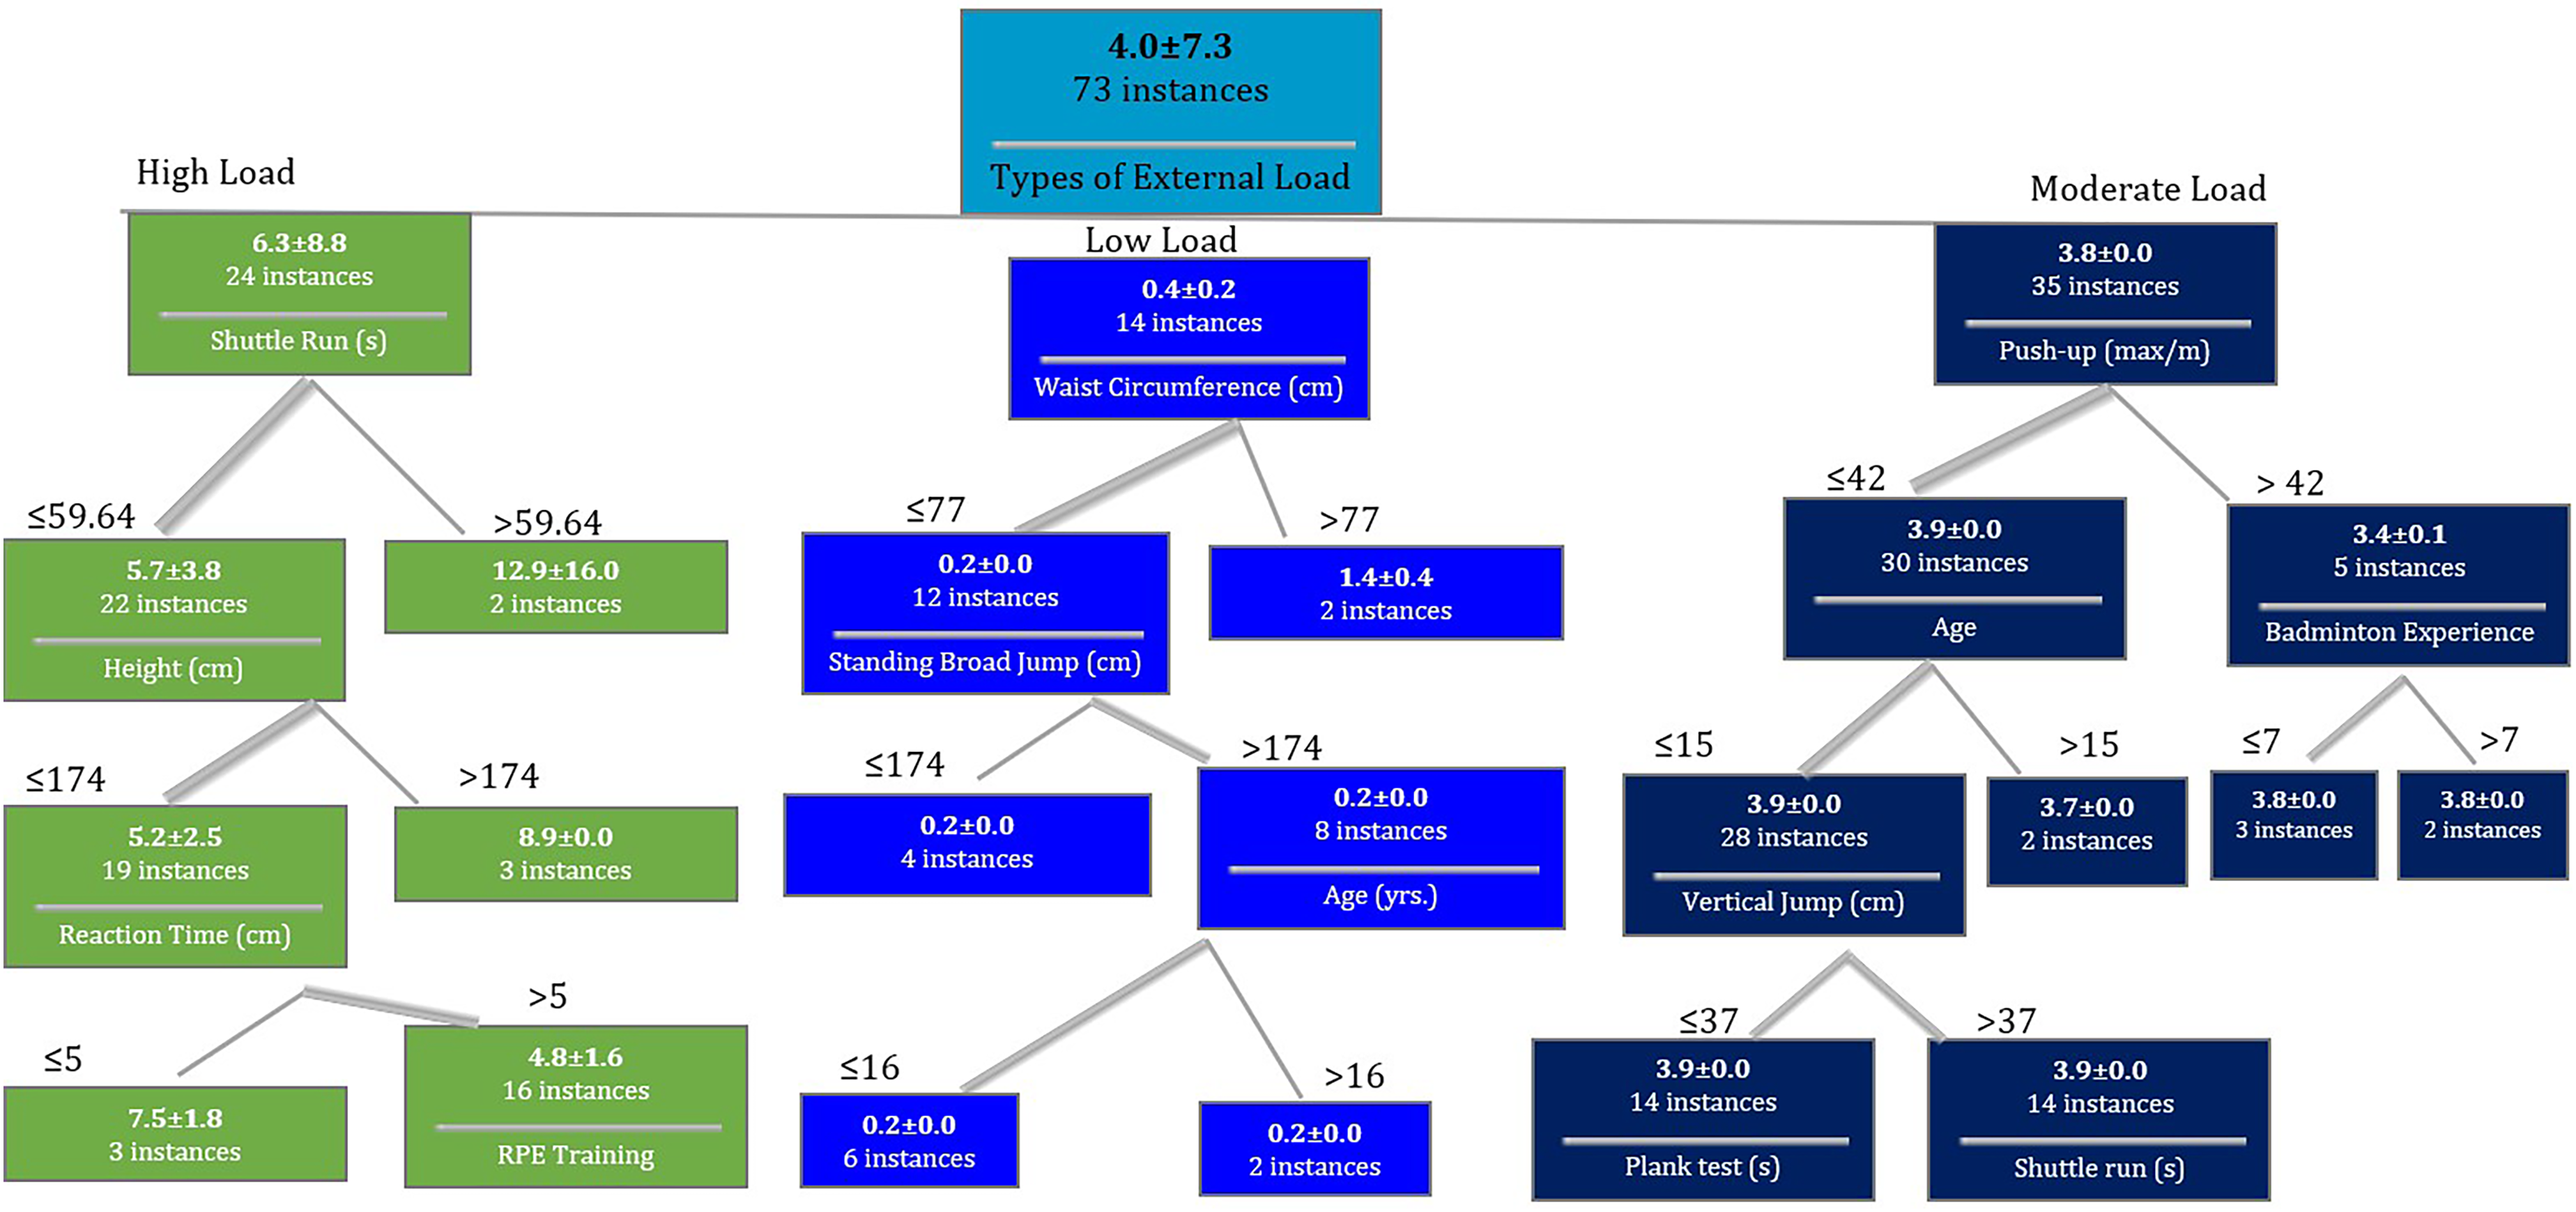
Decision Tree model architecture for external load prescription of young elite badminton players.
Discussion
This study aimed to develop a player workload management strategy by examining physical fitness and anthropometric characteristics through a machine learning-based Decision Tree model. K-means clustering identified distinct external load categories among badminton players, consistent with previous findings that factors like court type, age, and gender can influence external workloads, highlighting the need for individualized training programs. 34 The high-load cluster, with an average score of 6.3, likely includes elite-level players engaging in intense on-court activities, such as explosive movements and extended rallies. This aligns with research by Phomsoupha and Laffaye, 35 which found that top-level players exhibit higher external load profiles due to the intensity of their gameplay. The moderate-load cluster, with a score of 3.8, may represent developing players or those in less demanding positions, reflecting findings by Abdullahi et al. 36 in their study of collegiate players. The low-load cluster, with a score of 0.4, likely includes players during recovery, those with limited court time, or players focusing on technical skill refinement. Jessop 37 emphasized the importance of lower-intensity sessions to support recovery and skill development.
The identification of these distinct load categories aligns with the principle of individualized training in sports science. As emphasized by Jaspers et al., 13 understanding individual load profiles is crucial for optimizing performance and minimizing injury risk. The clear separation between these clusters as depicted in Figure 2 suggests that badminton coaches and sports scientists should tailor training programs and recovery strategies to match the specific load category of each player. Moreover, this classification system could serve as a valuable tool for monitoring load progression over time. Players transitioning between categories (e.g., from low to moderate load) may require special attention to ensure they are adapting appropriately to increased physical demands. Conversely, a player moving from high to moderate load category might indicate fatigue or the need for a recovery period.
Table 2 shows a clear differentiation in the physical and anthropometric characteristics across external load categories among players, underscoring how these factors influence workload levels. The characteristics of high-load players align with recent studies in badminton and other racquet sports, suggesting that older age and greater experience contribute to the ability to handle higher loads. This is supported by findings that elite players often have more years of practice and competition experience.10,38 The greater height, weight, and jumping ability observed in high-load players also reflect previous research identifying these traits as key performance factors in badminton. 39 Taller athletes are noted for their advantage in reach and power generation, allowing them to maintain high-intensity play for longer. Superior flexibility and grip strength further highlight the well-rounded fitness profiles of these players, which is consistent with studies showing that experienced athletes often demonstrate better physical conditioning due to prolonged training.14,15 Additionally, the relationship between muscle mass, strength, and load capacity has been well-documented, particularly in explosive sports like badminton.40,41 Enhanced flexibility and grip strength are crucial for elite badminton performance, aiding in stroke mechanics, injury prevention, and powerful shot execution.42,43
The role of dynamic movements in workload categorization aligns with the findings of the preceding investigators who identified acceleration and deceleration qualities as critical predictors of performance in badminton players. This supports the findings of this study, where moderate-load players demonstrated superior balance and leg endurance emphasizing the value of these qualities in managing external workloads effectively. 44 These attributes further align with the findings of Lam et al., who identified balance as crucial factors in badminton performance. 45 The authors suggested that these skills are fundamental to the sport's demands but may not necessarily correlate with the highest external loads. The enhanced leg endurance in this group could be related to efficient movement patterns and energy conservation, allowing these players to maintain moderate loads over extended periods. Indeed, an earlier research found that efficient court movement is a key factor in managing match loads effectively. 36 It has also been documented that players with better balance and agility may manage their energy expenditure more effectively, leading to a more moderate external load. 46 Additionally, the emphasis on leg endurance in this group aligns with findings from studies on other sports, suggesting that athletes with better endurance may distribute their workload more evenly, avoiding peaks that lead to higher external load categorization.47,48
The characteristics of low-load players, particularly their higher upper muscle strength and quicker reaction times, present an intriguing profile. These attributes suggest that low-load players may excel in short, explosive actions which is typical in badminton rallies but may not sustain high-intensity play for extended periods. This aligns with the work of the preceding investigators who found that upper body strength and reaction time were crucial for specific badminton skills but did not necessarily correlate with overall match demands.49,50 The higher perceived exertion suggests that these players may reach their physical limits more quickly, resulting in a lower overall external load. This is supported by research indicating that athletes with less experience or less developed endurance may perceive exertion more acutely, which can limit their capacity to sustain high workloads over time. 51 The quicker reaction times observed in this group could be attributed to a reliance on fast-twitch muscle fibers, which are advantageous for short, explosive movements, but may not sustain high loads due to quicker fatigue. 52
The Decision Tree model developed in the current investigation offers a structured approach to prescribing external loads to players, categorizing them into high, moderate, and low load groups based on a combination of fitness and anthropometric parameters as depicted in Figure 6. Similar to the findings of Ibáñez et al. on the impact of task constraints in elite women's soccer, the individualized workload recommendations generated in this study emphasize the importance of tailoring training to badminton-specific movement patterns and match demands. Incorporating constraints such as shuttle movement trajectories and match durations could further refine player-specific workload management strategies. 53 Interestingly, the initial split was based on types of external load which suggests that the nature of the external load itself is a primary determinant in load categorization. This aligns with the work of the previous investigators who emphasized the importance of differentiating between various types of external loads in badminton, such as movement patterns, stroke types, and match duration.11,54
For the high-load category, the Decision Tree identifies shuttle run time as a key determinant, refined by height, reaction time, and RPE during training, with average loads ranging from 4.8 to 8.9. These results align with existing literature that emphasizes the role of high-intensity performance metrics, such as shuttle runs, in assessing players’ load capacity. Previous studies emphasize the importance of aerobic capacity and speed endurance, as elite badminton players often display superior shuttle run performance, enabling them to maintain high-intensity gameplay.55–57 The further refinement by height, reaction time, and RPE highlights these attributes as critical in identifying players capable of handling higher external loads. Taller players have been consistently linked with higher performance levels in badminton, 58 and the inclusion of reaction time supports earlier findings on its significance in high-level play. This reinforces the need for personalized training that accounts for both physical and perceptual factors.16,59
The moderate load category comprises 35 instances, with the initial split determined by push-up performance. This category is further divided by age, badminton experience, vertical jump, plank test, and shuttle run, with resulting average loads ranging from 3.4 to 3.9. This suggests that moderate-load players have a balanced combination of endurance, experience, and power, which allows them to handle intermediate training loads. Research indicates that these attributes are critical in developing a well-rounded athlete capable of sustaining moderate workloads over time without overtraining. 46 This finding is also consistent with the previous study which documented that upper body strength and endurance were crucial for maintaining consistent performance in badminton. 60 Moreover, the subsequent splits by age, badminton experience, vertical jump, plank test, and shuttle run for moderate-load players present a comprehensive profile of physical attributes. 61 This multi-factorial approach to load categorization is supported by another study which emphasized the importance of a well-rounded physical profile in badminton performance. 62
In the low load category, 14 instances were identified based on waist circumference, with further splits by standing broad jump performance and age, resulting in an average load of 0.2. This finding highlights the role of anthropometric measurements, such as waist circumference, in load determination, suggesting that players with smaller waist measurements and lower explosive power (as indicated by standing broad jump) may require lighter training loads. Recent literature supports the relationship between lower body fat percentage, as indicated by waist circumference, and reduced load capacity, emphasizing the need for more tailored, lower-intensity training for such players.63,64 The subsequent splits by standing broad jump and age for low-load players indicate the relevance of lower body power and player maturity when prescribing low-load to badminton players as inferred by the previous investigators.38,65
Conclusions
The Decision Tree (DT) model developed in this study showed high accuracy with low bias, effectively predicting players’ external loads. These results highlight the potential for tailored training and workload management strategies. Distinct physical profiles across load categories suggest personalized programs can boost performance and reduce injury risk. High-load players, with greater muscle mass and strength, should focus on injury prevention, while moderate-load players could benefit from exercises that improve balance and agility. Low-load players may need to build endurance and manage exertion to gradually increase workload capacity.
Practical implications for coaching practice
The findings of this study have significant implications for coaching practice, particularly in individualized workload management. By using machine learning to predict external loads based on a player's physical fitness and anthropometric characteristics, coaches can develop tailored training programs that meet each player's unique needs. For example, high-load players could benefit from injury prevention and recovery strategies, while moderate-load players might need exercises to enhance agility and endurance.
The Decision Tree model offers a transparent, data-driven approach that coaches can easily interpret and apply. This helps in making informed decisions when adjusting training intensities, ensuring players are neither overtrained nor undertrained, thus optimizing performance and minimizing injury risk. The model also highlights the importance of balancing physical and perceptual factors, such as reaction time and perceived exertion, often overlooked in traditional workload management methods.
Incorporating this model into daily coaching routines fosters a more scientific, individualized approach to training, bridging the gap between sports science and coaching practice. Coaches can use insights from the model to monitor player workloads in real-time, adjusting sessions as needed to enhance training effectiveness and player well-being.
Limitations of the study
Some limitations are acknowledged in the current study. The exclusion of nutritional and psychological factors suggests areas for future refinement. Although pooling male and female players in the analysis allowed for broader generalization of the workload management model, it may not fully capture the specific physiological and performance differences between genders. Future studies could develop gender-specific models to provide more tailored workload recommendations for male and female players. The model achieved an overall accuracy of 92%, which is notable compared to typical benchmarks in sports science machine learning applications, where accuracy rates often vary between 70–90%. However, the significance of classification errors is not uniform. For instance, misclassifying a high-load player as low-load has greater implications than misclassifying them as moderate-load. Future work will focus on incorporating weighted classification metrics, such as cost-sensitive learning or confusion matrix analysis, to account for the varying impact of misclassifications. Additionally, validating this model across broader populations, exploring the relationships between physical attributes and load capacity, and integrating these insights into long-term athlete development programs could further enhance its usefulness in optimizing training and performance.
Footnotes
Acknowledgements
The authors would like to thank the Badminton World Federation (BWF) for supporting this study under their developmental research grant project 2023.
Declaration of conflicting interests
The authors declared no potential conflicts of interest with respect to the research, authorship, and/or publication of this article.
Ethical consideration
The study adhered to standard guidelines for research involving human subjects, as recommended by the Helsinki Declaration. After obtaining approval to conduct the study (UMT/JKEPM/2023/164), all participants aged 18 and above signed a consent form, while those under 18 had their parents or guardians sign on their behalf.
Funding
The authors disclosed receipt of the following financial support for the research, authorship, and/or publication of this article: This project has been carried out with the support of the Badminton World Federation (BWF)-2023.